Attached files
| file | filename |
|---|---|
| 8-K - FORM 8-K - NuStar Energy L.P. | d234674d8k.htm |
 Exhibit 99.1
NUSTAR ANALYST DAY
New Orleans and St. James, LA
September 21, 2011 |
 Statements
contained in this presentation that state management’s expectations or predictions
of the future are forward-looking statements intended to be covered by the safe
harbor provisions of the Securities Act of 1933 and the Securities Exchange Act of
1934. The words “believe,” “expect,”
“should,”
“targeting,”
“estimates,”
and other similar expressions identify
forward-looking statements. It is important to note that actual results
could
differ materially from those projected in such forward-looking statements. We
undertake no duty to update any forward-looking statement to conform the
statement to actual results or changes in the company’s expectations. For
more information concerning factors that could cause actual results to differ
from those expressed or forecasted, see NuStar Energy L.P.’s annual report on
Form 10-K and quarterly reports on Form 10-Q, filed with the Securities and
Exchange Commission and available on NuStar’s website at
www.nustarenergy.com.
2
Forward Looking Statements |
 Agenda
NuStar Overview (15 minutes)
Curt Anastasio
4
Storage Segment Overview (20 minutes)
Danny Oliver
11
Transportation Segment Overview (20 minutes)
Danny Oliver
20
Asphalt & Fuels Marketing Overview
Paul Brattlof
31
(15 Minutes)
St. James Terminal Overview (15 minutes)
Kyle Oppliger
38
Closing Remarks and Q&A
Curt Anastasio
52
3
Topic
Presenter*
Page #
* Bios of management team can be found in the appendix starting on page 53 |
 NuStar Overview
Curt Anastasio
Curt Anastasio
CEO & President
CEO & President
4 |
 Spent $136
million on internal growth projects Majority of this spending relates to projects that
will begin generating EBITDA in the last half of 2011 Completed six projects with a total
spend of $28 million and a projected EBITDA multiple of 4x to 6x Spent another $100
million on acquisitions that should yield annual EBITDA of around $20 million
Earned $253 million in EBITDA
Record June year to date EBITDA
Increased NS and NSH distributions in 2nd quarter
NS
distributions
increased
to
$1.095
per
unit,
2%
higher
than
1Q
2011
and
3%
higher
than
2Q
2010
NSH distributions increased to $0.495 per unit, 3% higher than 1Q 2011 and 8% higher than 2Q
2010
45
June 2011 Year to Date
NuStar Energy Highlights
Continued to maintain an outstanding safety and environmental record
superior to our industry peers
Obtained VPP Star Site status at four locations with the goal being the entire
company |
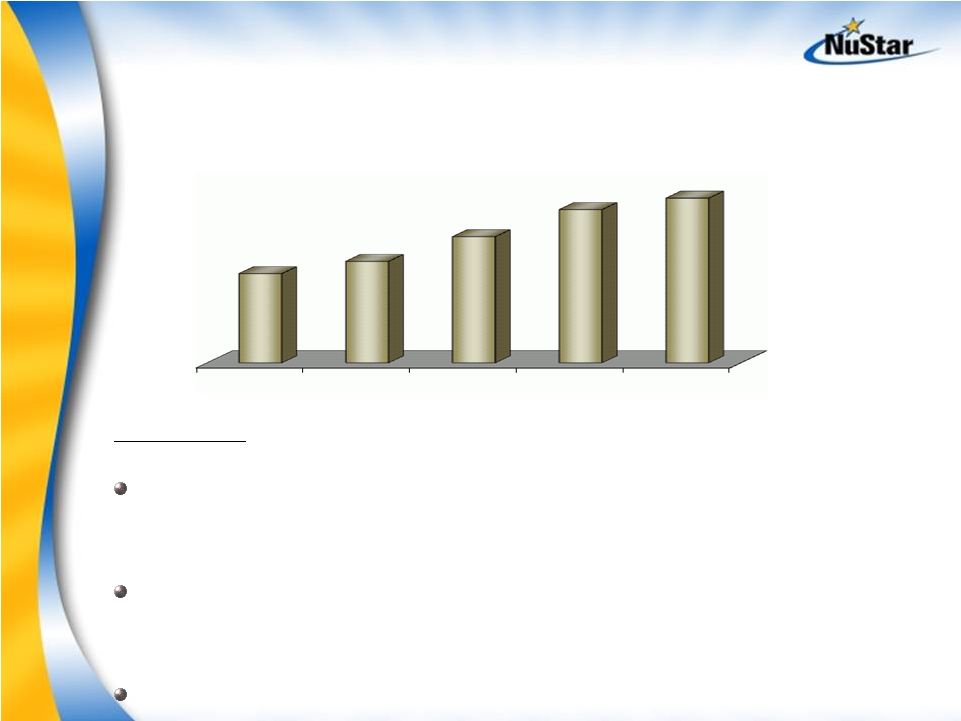
 EBITDA ($ in Millions)
6
Continued weak economic conditions causing results in our asphalt operations to
be lower than expected in the last half of the year
Lower pipeline throughputs expected to cause our transportation segment results to be
lower than 2010
2011 EBITDA expected to be comparable to 2010
2002
2003
2004
2005
2006
2007
2008
2009
2010
$77
$112
$133
$219
$322
$353
$492
$461
$483 |
 While
distribution growth at NS and NSH has slowed in the past couple of
years…internal growth projects expected to lead to higher distribution
growth levels over the next several years
NS Distribution ($ per Unit)
NSH Distribution ($ per Unit)
~6.6% CAGR
~9.9% CAGR
* Annualized Distribution
7 |
 $20
$13
$55
$107
$159
$205
$14
$20
$30
$23
$27
$45
$43
$100
2009 Actual
2010 Actual
2011 Forecast
Acquisitions
Corporate
Asphalt & Fuels Marketing
Storage
Transportation
2011 Total Spending on Internal Growth Projects
& Acquisitions currently projected to be around $435 million
(
Dollars in Millions)
$164
$262
$435
8 |
 Safety and
Environmental performance in 2011 continues to exceed Industry Benchmarks
NuStar Injury Incident Frequency Rates
*Through August 2011
9
*
NuStar 2011 Safety and Environmental Awards
Industry Benchmarks
Independent
Liquid Terminals
Association
Safety Excellence
Award
Perfect Record
Award -
National
Safety Council
Million
Hours
Award -
National
Safety Council
Safety Leadership
Award -
National
Safety Council
Occupational
Excellence Award-
National Safety
Council
2006
2007
2008
2009
Refineries
1.4
1.6
1.1
1.0
Pipelines
2.2
2.0
1.6
1.9
Terminals
5.6
5.8
6.4
4.6
2006
2007
2008
2009
Refineries
0.5
0.3
0.2
0.3
Pipelines
0.6
0.5
0.5
0.5
Terminals
1.1
1.7
1.8
1.2
TRIR
LTIR
TRIR – Total Recordable Incidents Rate LTIR – Lost Time Incidents
Rate 1.49
1.36
0.76
0.31
0.69
0.27
0.14
0.19
0.15
0.00
0.15
0.00
2006
2007
2008
2009
2010
2011
TRIR
LTIR |
 Continued
development of our strategically located storage terminals Primarily Texas City, St.
James, St. Eustatius and New York Harbor Eagle Ford and Other Shale plays
Expansion of bunker marketing, fuel oil marketing and crude oil trading
in certain areas
Feedstock cost and logistics optimization at our Asphalt and Fuels
refineries
Acquisition opportunities in strategic domestic and international
locations
9
Key Growth Areas and Focus
10 |
 Storage Segment Overview
Danny Oliver
Danny Oliver
Senior VP –
Senior VP –
Business & Corporate
Business & Corporate
Development
Development
11 |
 2011 Storage
Segment results should be improved over 2010…. Internal Growth projects continue to
drive increases in EBITDA Storage Segment EBITDA
(in Millions)
2011 Summary
Full year of EBITDA should be realized from May 2010 Mobile, AL terminal
acquisition and St.
Eustatius terminal project completed in the 4th quarter of 2010 Benefits from St. James
Phase I storage project began July 1 and will continue to be phased in during the
3rd quarter as a portion of the planned tanks are completed 2011 segment EBITDA expected
to be $20 to $30 million higher than 2010 12
2006
2007
2008
2009
2010
$162
$177
$208
$242
$256 |
 < 1
Year 1 to 3 Years
3 to 5 Years
> 5 Years
28%
39%
21%
12%
Demand for storage continues to be strong at
NuStar terminal locations
Storage Contract Renewals (% of Revenues)
Approximately 95% of our tankage is currently leased
NuStar continues to enter into storage agreements with large credit worthy customers
Current customers and potential new customers continue to approach us about
constructing new tankage at several of our terminal locations
Looking at terminal acquisition opportunities in domestic and international markets
that are of interest to our customer base
13 |
 2012 Storage
Segment Internal Growth spending should be higher than 2011 levels
(Dollars in Millions)
Identified
Storage
Projects
>$10
Million:
14
$340
$0
$50
$100
$150
$200
$250
$300
$350
2008
2009
2010
2011
Forecast
2012
Forecast
$128
$107
$159
$205
$120
$220
Projects being evaluated
Identified Projects
St. James Storage Tank Expansion-Phase 1
$89
$4
$130
St. James Storage Tank Expansion-Phase 2
$0
$35
$123
St. Eustatius Tank Expansion
$23
$29
$53
Linden NuTop Tank Expansion
$7
$31
$61
St. James Unit Train Project
$27
$8
$30
EBITDA multiples on these projects should range from 4x to 8x
2011
2012
CAPEX
CAPEX
Total |
 Phase I
Completed in 3
rd
quarter 2011
3.2 million barrels of crude oil storage for trading companies
Total cost around $130 million
Phase II
Should be similar in size and cost to Phase I
Most of tankage should be crude storage
Expect tanks to be in-service late 2012 or early 2013
Phase I of St. James, Louisiana terminal expansion
recently completed..Phase II in early planning stages
15 |
 Constructing
one million barrels of new storage for distillate service Customer is a large national
oil company Projected CAPEX around $50 million
Expected in-service 4th quarter 2012
Currently evaluating a major expansion project at the St. Eustatius terminal
In the process of constructing new tanks for
distillate service at our St. Eustatius terminal
16 |
 Continued
demand for bulk storage in New York Harbor justifies the conversion of the terminal from
a rack marketing terminal to a bulk storage facility
Plan to construct ~850,000 barrels of new storage
Should increase terminal capacity to 1.2 million barrels
Projected CAPEX around $60 million
Expected in-service 3rd quarter 2013
Linden NuStar terminal expansion project
expected to begin in the next few months
17 |
 Entered into
an agreement with two subsidiaries of EOG Resources, Inc. EOG is a large independent oil
and natural gas company Proved reserves in the United States, Canada, the UK and
China Project description:
New rail and unit train offloading facilities jointly developed by NuStar and
two EOG Resources, Inc. subsidiaries
Facility will be equipped to handle at least one 70,000-barrel train per day
Two new storage tanks with a combined capacity of 360,000 barrels
Costs and completion dates:
Project expected to be completed and in service early 3rd quarter 2012
NuStar’s share of the costs should be approximately $30 million
Have begun the construction of a unit train
offloading facility at our St. James terminal
18 |
 Chickasaw, AL
terminal pipeline connection Connection
to
3
party
crude
oil
pipeline
South Texas Valley System Ethanol
Convert Edinburg and Harlingen Terminals to ethanol blending
Stockton, CA diesel rail loading
Gives customers the ability to load CARB diesel on rail cars
Linden Fuel Oil Conversion (Joint Venture Terminal)
Convert
one
320,000
barrel
tank
currently
in
fuel
oil
service
to
clean
light
products
service
Total spending for these projects should be around $20 million
Several projects with capital spending of less than $10
million per project…were completed in 2011 or should
be completed by end of 2011
19
rd |
 Transportation Segment Overview
Danny Oliver
Danny Oliver
Senior VP –
Senior VP –
Business & Corporate
Business & Corporate
Development
Development
20 |
 2011 EBITDA
expected to be down due primarily to lower throughputs
Transportation Segment EBITDA
(in Millions)
2011 Summary
Eagle Ford shale crude project with Koch Pipeline Company completed in
June 2011. Throughput and deficiency agreement for 30,000 BPD
Throughputs projected to be down 7% to 8%. Heavy customer refinery
turnaround schedule and increased export demand for distillates could
negatively impact throughputs on NuStar’s Corpus to Houston refined
products pipeline
Full year 2011 segment EBITDA expected to be $5 to $15 million lower than
2010
21
2006
2007
2008
2009
2010
$170
$176
$186
$190
$199 |
 Shale oil Is
expected to provide growth opportunities in the Transportation Segment
Shale
Oil
Growth/Technology
Key shale oil developments are located in NuStar’s Mid-Continent and Gulf Coast
regions, including the Eagle Ford, Bakken, Granite Wash, Barnett, Mississippian and
Niobrara
NuStar’s assets are well positioned to capitalize on the expanding unconventional oil
& gas developments
A
key
strategic
objective
is
to
grow
earnings
from
fee-based
logistics
services
Redeploying existing and/or build new pipelines
and terminals in the shale oil regions
Diversifying customer base and expanding
logistics services for crude oil, condensate
and NGLs through asset modifications,
expansions and strategic acquisitions
22 |
 (Dollars in Millions)
23
Expect to spend a record amount
of Internal Growth capital in
Transportation Segment in both 2011 and 2012
Transportation
Projects
>$10
Million:
2011
2012
CAPEX
CAPEX
Total
Three Rivers Crude Supply for Valero
$15
$43
$58
Oakville
Storage
and
16”
Crude
Pipeline
Reversal
$17
$30
$47
North Beach Crude Loading
$5
$8
$13
San Antonio Refinery Crude Pipeline
$16
$5
$21
San Antonio Product Supply Expansion
$2
$11
$13
EBITDA multiples on these projects should range from 4x to 8x
|
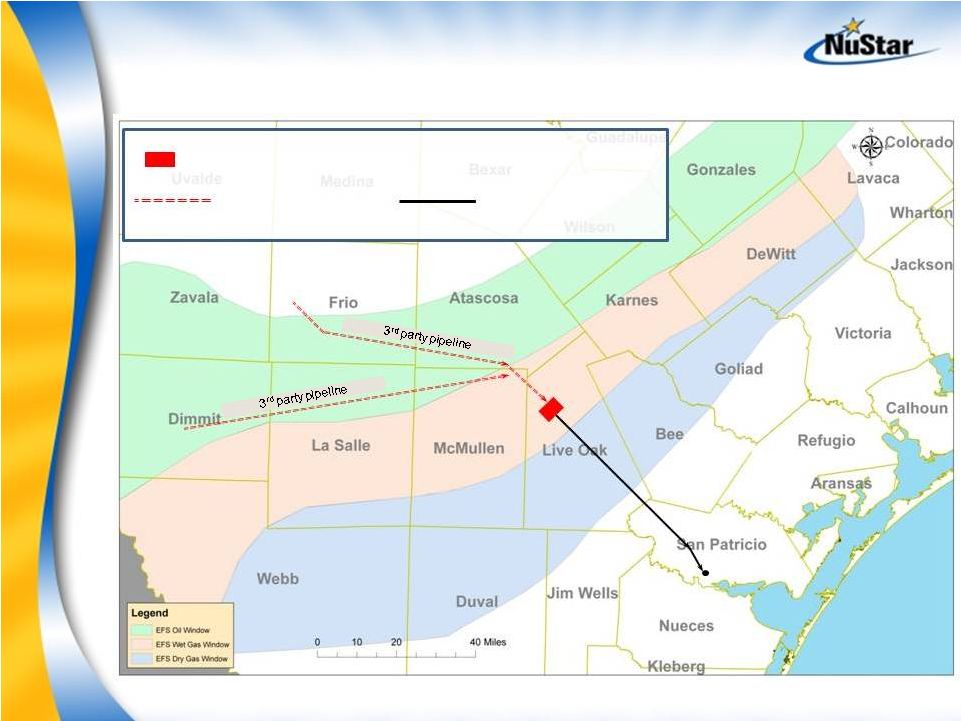
 NuStar plans to modify existing pipeline assets
and construct new pipeline assets
for Valero in Eagle Ford Shale
Plans call for reversal of an existing 8-inch refined products pipeline
Line moved products from Corpus Christi to Three Rivers
Plan to place in crude oil service after reversal
Projected CAPEX less than $5 million
Placed in service September 15, 2011
NuStar also plans to build 55 miles of new 12-inch pipeline that will connect to
existing NuStar pipeline segments
Expect to move crude and condensate from Corpus Christi to Valero’s Three Rivers
refinery
Projected CAPEX close to $60 million
Should be in service by the 2nd quarter of 2012
24 |
 New NuStar Pipeline
Existing NuStar Pipeline
NuStar plans to modify existing pipeline assets
and construct new pipeline assets
for Valero in Eagle Ford Shale
Valero
West Plant
CORPUS CHRISTI
THREE RIVERS
REFINERY
8”
line
12”
line
25 |
 Plan
to develop a new pipeline system in the Eagle Ford Shale as a result of
Letters of Intent entered into in the 2nd Quarter of 2011
In the 2nd quarter of 2011, announced the signing of LOIs with TexStar
Midstream Services and Velocity Midstream Partners to develop a new
pipeline system
TexStar and Velocity both plan to construct pipelines that transport crude and
condensate to Three Rivers, TX
Pipelines should be interconnected with a new storage facility to be constructed at
Three Rivers, TX by NuStar
Plan to connect the storage facility to NuStar’s existing 16-inch pipeline that can
transport 200,000 BPD to NuStar’s Corpus Christi North Beach storage terminal
Both projects expected to be in-service 2Q 2012
26 |
 Plan
to develop a new pipeline system in the Eagle Ford Shale as a result of
Letters of Intent entered into in the 2nd Quarter of 2011
NORTH BEACH
OAKVILLE
16”
line
27
Potential New 3
rd
Party
Pipeline
Existing NuStar
Pipeline
Potential New Storage Facility |
   28
Pursuing additional projects in the Eagle Ford Shale to
better utilize Houston 12”
line and idle 8”
line out
of Pettus
NORTH BEACH
OAKVILLE
16”
line
PETTUS
Underutilized Existing NuStar Pipeline
8”
line
12”
line
Potential New NuStar
Pipeline
Existing NuStar Pipeline
Potential New Storage Facility |
 Plan to
construct a new 3 bay truck rack for crude offloading at our Elmendorf storage facility
and a new 12 mile 8” crude oil
pipeline from the facility to the San Antonio Refinery
Project should reduce transportation costs and unplanned
refinery outages by improving crude supply logistics and crude
quality for San Antonio Refinery
Total CAPEX should be around $20 million
Expected in-service 1st quarter 2012
Constructing a new 8”
pipeline to supply crude
to San Antonio refinery
29 |
 One
of our customers has approached us about increasing the amount of refined
products that supply the San Antonio market Total CAPEX currently estimated at
about $13 million Pipeline capacity on the line could be increased by the
start of the 4th quarter 2012
In the early planning stages of expanding the
capacity of our refined products pipeline that
supplies the San Antonio market
30 |
 Asphalt & Fuels Marketing Overview
Paul Brattlof
Paul Brattlof
Senior VP –
Senior VP –
Supply & Trading
Supply & Trading
31 |
 Earnings from
San Antonio refinery acquisition and improved earnings in Fuels Marketing are
offset by lower Asphalt results
Asphalt & Fuels Marketing
2011 Summary
Weak
asphalt
demand
and
high
feedstock
costs
should
cause
EBITDA
in
our
asphalt
operations to be lower than 2010
April 2011 San Antonio refinery acquisition contributing slightly less than expected
due to higher crude costs
Strong
fuels
marketing
results
in
2011
due
to
the
expansion
of
crude
trading
and
bunker
fuels marketing in late 2010
Full year 2011 segment EBITDA expected to be lower compared to 2010
2006
2007
2008
2009
2010
$80
$111
$127
32
Asphalt
Fuels Marketing
$27
$22
$37
$10
$37
$90
$70
$74
Segment EBITDA ($ in millions) |
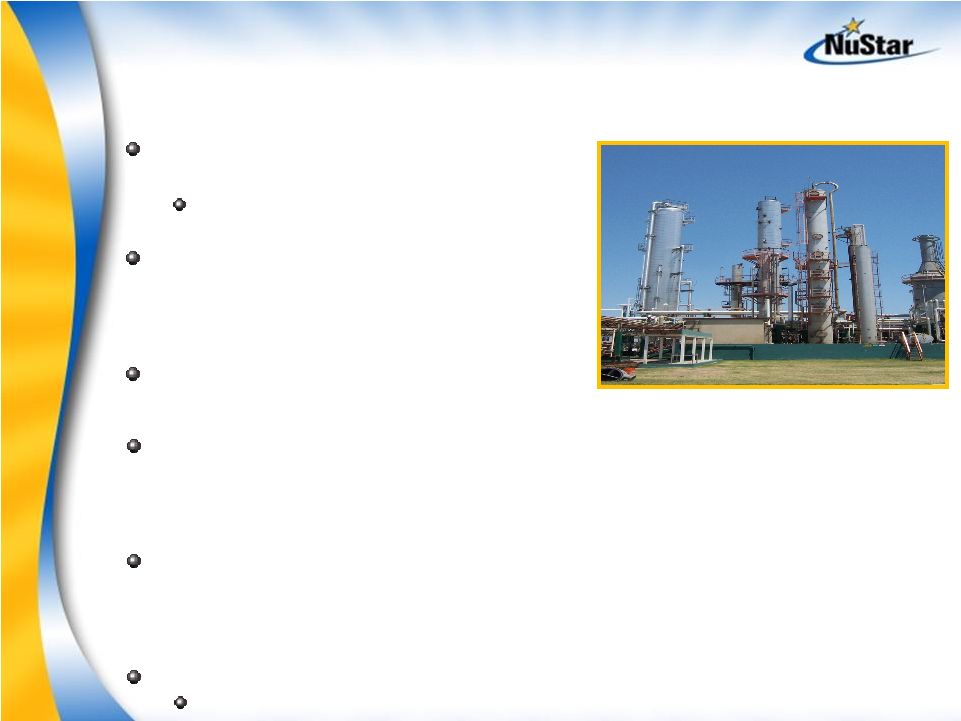 33
San Antonio Refinery acquisition expected
to be a solid contributor to our
Asphalt & Fuels Marketing segment
Approximately 70% of refinery production is hedged (spread
between WTI and refined products) over the next three to four
years
New 8”
crude pipeline from Elmendorf should reduce transportation
costs and unplanned refinery outages
by improving crude supply logistics
Expect refinery to generate around $15 million of EBITDA in 2011
Slightly lower than expected due to increased crude costs
14,500 BPD refinery acquired for $41
million plus working capital
YTD Run rates ~11,500 BPD
Processes crude and condensate from
nearby Eagle Ford shale and
other South Texas formations
Produces and sells jet fuel, ULSD,
naphtha, reformate and LPG’s |
 2011
Summary Currently market out of four NuStar locations:
St Eustatius
Pt Tupper
Texas City
Los Angeles
NuStar Bunker sales volumes are up 98% since 2009
since adding new marketing operations at Texas
City and Los Angeles.
Dependable and competitively priced supply is key to making a successful Bunker
Marketing operation. Term purchases make up 55% of total supply of bunker fuel
2012 Outlook
Looking to expand in more markets where we can gather our own supply and
effectively penetrate the market
Bunker Marketing –
2011 Looks to be
best year ever
St.
Eustatius
Texas
City
Pt
Tupper
Los
Angeles
34 |
 35
Asphalt Operations initiatives to lower
supply costs and improve margins
2011 Summary
Asphalt Demand is down 1.5% thru June on an annualized basis
However, East Coast asphalt prices have averaged $50 per ton premium over
the Mid-Continent and Gulf Coast rack prices
Midwest refiners with lower feedstock costs have incentive to supply East
Coast markets
Asphalt results expected to be lower than 2010
2012 Initiatives
Entered into 10,000 barrel per day Peregrino Crude Oil Purchase
agreement with Statoil. Contract commences December 2011.
Pursuing Heavy Canadian rail supplied crude for Paulsboro and Savannah
refineries
Pursuing asphalt off-take agreements with regional suppliers to create more
flexibility within system to take advantage arb’s |
 Heavy Oil
Trading – Texas City rail blending
hub has become dependable outlet for Midwest refiners
Texas City has become a dependable rail
outlet for heavy oils from Midwest refiners
-
volumes expected to be up 50% vs. 2010
Midwest refinery utilization is currently
above 93%, providing ample supply of VTB’s
Texas City is a true Black Oil blending hub
gathering heavy oils, asphalts, slurry oil and
other blend stocks to blend into either
bunker fuel, asphalt or fuel oil
Most of the Heavy Oil bought is blended into
Bunker Fuel and sold internally to our Bunker
Marketing Group at Texas City; the remainder
is sold into the Houston area spot market
36
Source: Energy Information Administration
PADD II Refinery Utilization Rates
Year average
80.0%
82.0%
84.0%
86.0%
88.0%
90.0%
92.0%
94.0%
96.0%
2000
2001
2002
2003
2004
2005
2006
2007
2008
2009
2010
2011
2011 Summary
2012 Outlook
Looking to expand the Texas City concept to our Mobile, AL and Wilmington, CA terminals
|
 Crude Trading
– continue growing domestic rail
gathering systems at St. James, LA and Texas City, TX
2011 Summary
Brent crude is trading at historically high
premiums over WTI
Gulf Coast Light Louisiana Sweet (LLS) is also
trading at historically high premiums to WTI
Increased production of Bakken crude in
North Dakota and Eagle Ford in South
Texas can be railed to our waterborne
terminals and marketed to gulf coast refiners
St. James is a Hub Terminal located in the
center of the Gulf Coast domestic crude
trading and blending market
Currently can gather up to 10,000 barrels per
day on manifest rail
Texas City is our newest gathering point for Eagle Ford crude
Currently can receive truck and rail up to 3,000 barrels per day
2012 Outlook
Looking for ways to expand volumes at St James into a unit train
Looking to expand truck capabilities at Texas City by adding additional offloading
lanes 37
-
3
8
13
18
23
28
33
1/1
2/1
3/1
4/1
5/1
6/1
7/1
8/1
9/1
10/1
11/1
12/1
2009
2010
2011
9/19 $28.06/bbl
LLS over WTI (Front Month)
2 |
 St. James Terminal Overview
Kyle Oppliger
Kyle Oppliger
Vice President &General Manager
Vice President &General Manager
–
–
Gulf Region
Gulf Region
38 |
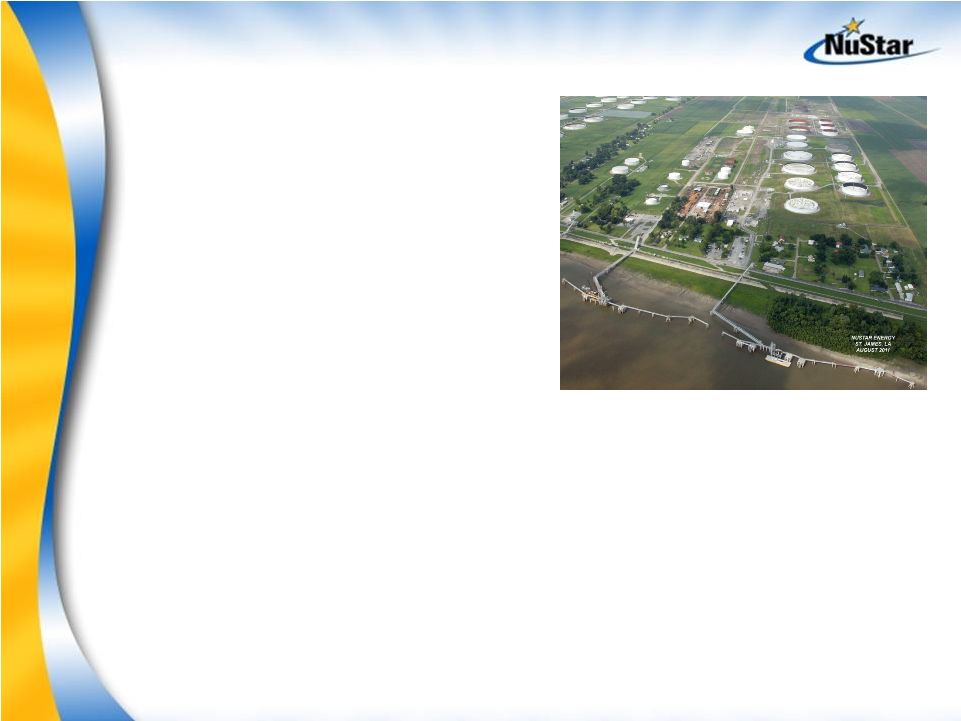 39
St James Terminal Description
Tanks
28
tanks
Capacity: 8,000,000 barrels
Size Range 36,000 to 680,000
barrels Employees 22
employees
Products
Crude Oils
Land
~ 900 Acres Modes
Served Vessel, Barge, Pipeline, Rail, Truck
•
3 Ship/Barge Docks (2 have vessel capacity)
•
20 Railcar unload facility (Bakken)
•
70,000 bpd Unit train facility ( under construction)
•
2 Truck unload spots
•
Pipelines
•
40”
to Capline
•
30”
to Exxon, Shell and LOOP
•
20”
to Exxon
•
48”
to Locap |
 40
St James Schematic
Overview
St James Terminal |
 41
NuStar’s Vision and Strategy
Demonstrate excellence in safety and environmental performance,
operations, customer service and community involvement
Develop St. James Terminal into an integrated hub location to
capitalize on opportunities for light sweet crude blending and
heavy crude blending
St James Terminal provides unique market advantages due to
access to key logistics and markets
Grow hub terminal with fee-based business while providing access
to key niche markets for margin-based opportunities
Fee business provides base revenue to support critical
infrastructure improvements with a reasonable return on the
partnership’s investments
Hub customers provide NuStar MS&T with ready access to
trading partners
Vision and Strategy for St James Terminal |
 42
Commitment and Focus on
Safety
Achieved 20 years without lost time
incident
Approaching 16 years without OSHA
recordable
Process Safety Management (PSM) –
foundation of safety and operating
programs
Recognized as OSHA Star Site
Voluntary Protection Program (VPP)
Safety and Environmental Performance |
 43
Environmental Performance
Reportable spills –
Zero in 2010,
1 in 2011
Zero Notice of Violations
Compliance calendar and audits
Implemented DOT compliance
programs for pipelines
Implemented Pipeline Integrity
Program
Equipment upgrades and
preventive maintenance
programs
Safety and Environmental Performance |
 44
Marine Facilities
Two ship docks
Dock 5 w/ 2 –
16”
loading arms
Dock 2 w/3 –
16”
loading arms
ship or barge for crude and fuel
oil
One barge dock capable of
crude and fuel oil and vapor
destruction for crude oil
loading
Truck Receipts
Two metered truck receipt
skids
Rail Facilities
Unload facilities with capacity
of 20 rail cars per day
St James Key Logistics |
 45
Valero
Trafigura
NuStar Marketing, Supply and Trading
Statoil
EOG Resources
Current Customers |
 46
2006 (Dec) –
Acquired St James Terminal from Koch
14
tanks with 3.3 million barrels of storage capacity
Existing 3
rd
Party blending programs
Valero Marketing and Supply Co.’s refinery crude supply
Koch crude oil and fuel oil blending
2007
–
3
rd
Party
Expansion
(1.5
million
barrels)
Constructed four
new tanks for Trafigura crude oil blending
Designed internal pipeline infrastructure to accommodate future expansion
Upgraded Dock #1 with marine vapor destruction unit
2008/2009 –
Ship Shoal Pipeline Connection Upgrade
Constructed new metering facilities and upgraded pipeline connection increasing
fee- based pipeline revenues and providing greater access to desired crudes
2010 –
Bakken Crude for NuStar MS&T (110,000 barrels)
Acquired idled LaJet Refinery property and storage tanks
Refurbished two tanks to provide crude oil storage
Reactivated
idle
rail
spur
and
provided
20
rail
spots
for
Bakken
crude
oil
receipts
Implementing the Strategy
Completed Projects |
 47
2010 –
3rd Party Expansion –
Phase 1 (3.2 million barrels)
Constructed 7 tanks for Trafigura and Statoil for crude oil storage
Infrastructure upgrades include improving pipeline connectivity and reactivating
an idled marine ship dock
Storage tanks went into service in July / August 2011
Storage capacity of the terminal has grown from 3.3 million barrels in
December 2006 to ~ 8.0 million barrels after the Phase 1 expansion
project
Implementing the Strategy
Current Projects |
 48
2011 –
3rd Party Expansion –
Phase 2
Project currently in development to provide additional storage
opportunities to refining and trading companies
Expect new tanks to store crude oil and fuel oil
Additional Storage Expansion
Customer interest remains high and facility has property for additional
storage expansion
New Rail and Unit Train Offloading Project for EOG
Facility should be able to handle at least one 70,000 barrel train per day
Implementing the Strategy
Future Opportunity |
 LEGEND
Current Construction
Future Heated Storage
Future Non Heated Storage
Implementing the Strategy
49
NUSTAR |
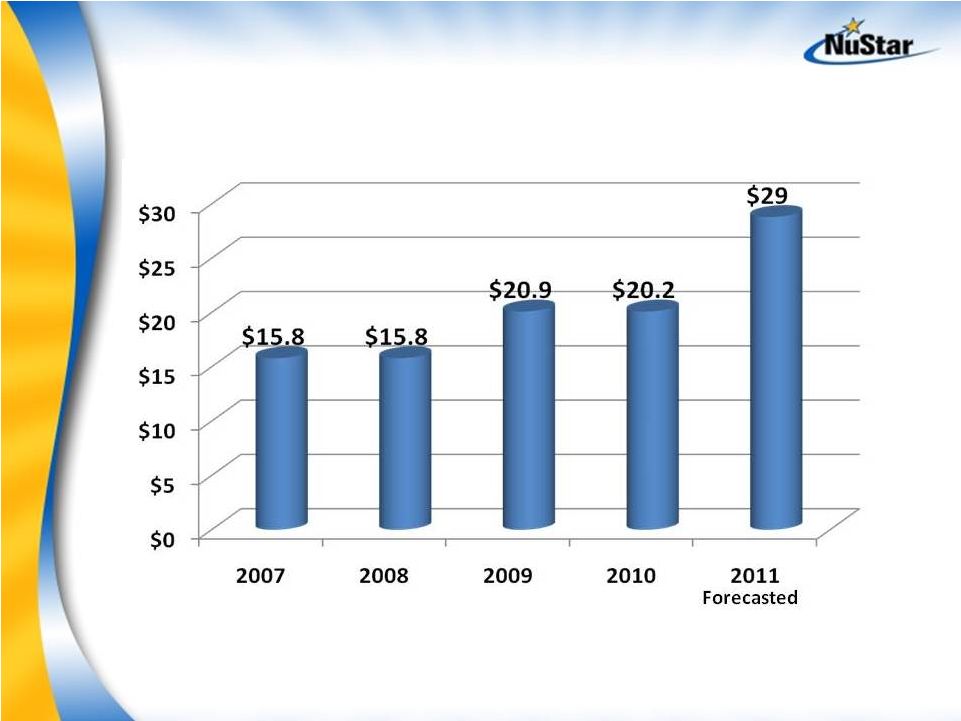 50
Implementation of Strategy
NuStar St. James Terminal EBITDA
($millions)
2012 EBITDA could be double 2011 results |
 51
Terminal acquired from Koch in Dec 2006
Employees naturally embraced NuStar’s culture and have
demonstrated excellence in safety, environmental, community
service and customer satisfaction
Implementation of hub strategy has more than doubled the total
storage capacity of the facility and current project plans schedule
through 2012 could quadruple the storage capacity
Integrating NuStar MS&T into the hub terminal landscape has
created niche rail pipeline opportunities to capture emerging
Bakken crude play
Future remains bright at St James with high customer interest and
opportunities to continue storage expansion, and expand our unit
train rail capabilities.
A Bright Future for St. James |
 Closing Remarks
and Q&A
and Q&A
Curt Anastasio
Curt Anastasio
CEO & President
CEO & President
52 |
 Management
Team Bios
Team Bios
53 |
 Management
Bios Management Bios
Curt Anastasio, CEO & President
President and CEO of NuStar Energy L. P. (NYSE: NS) and NuStar GP Holdings,
LLC (NYSE: NSH)
Anastasio has been President of NuStar Energy L.P. and its predecessors since
December 1999, and he assumed the position of CEO of NuStar GP Holdings, LLC
in 2006.
Prior to becoming President of NuStar GP, LLC in 1999, Anastasio held various
positions in supply, trading, transportation, marketing, development and legal.
He has 22 years of industry experience.
Curt serves on the Board of the National Association of Publicly Traded
Partnerships and as a Director of the San Antonio Branch of the Federal Reserve
of Dallas.
In addition to participating in various volunteer activities, Curt serves on the
Board of Trustees of the United Way of San Antonio and Bexar County, and is
the communitywide United Way Campaign Chairman for 2011. He also serves as
a board
member
of
the
San
Antonio
Medical
Foundation
,
Southwest
Research
Institute, Texas Biomedical Research Institute, Alamo Area Council of the Boy
Scouts
of
America,
and
the
Economic
Development
Foundation
–
all
in
San
Antonio. In addition, Anastasio belongs to various professional organizations and
has lectured and written on legal and business topics.
Curt received a Juris Doctorate degree from Harvard Law School in 1981 and a
Bachelor of Arts degree, Magna cum Laude, from Cornell University in 1978.
After graduation, he practiced law in New York City.
54 |
 Management
Bios Management Bios
Steve Blank, Senior VP -
CFO & Treasurer
Chief
Financial
Officer,
Senior
Vice
President
and
Treasurer
of
NuStar
Energy L.P. In this position, he is responsible for corporate finance,
external reporting, accounting, budgeting and forecasting, investor
relations, risk management, tax, treasury and credit.
Before that, Steve held a variety of positions with Ultramar Diamond
Shamrock and Valero Energy in New York, London and San Antonio,
including Director, Planning and Development (1980-83); Assistant
Treasurer –
Corporate Finance (1983-90); Vice President of Investor
Relations
(1991-95);
Vice
President
–
Information
Technology
(1996);
and
Vice
President
–
Finance
and
Treasurer
(1996-01).
Before joining Ultramar Diamond Shamrock in 1980, Steve worked for
two years with National Westminster Bank in New York.
Steve received a BA in History from the State of University of New York in
1976. He went on to obtain a Master’s in International Affairs, with a
specialization in Business, from Columbia University in 1978.
55 |
 Management
Bios Management Bios
Rick Bluntzer,
Senior
VP
-
Operations
Rick Bluntzer, Senior Vice President of Operations oversees NuStar Energy
L.P.’s extensive pipeline, terminal, international and asphalt & fuels
refining operations. Additionally he oversees NuStar’s engineering,
information systems (operations) and procurement organizations.
Rick began his career with Valero Refining Company in 1976, serving in
various operating and management positions until 1997, when he became
a part of Valero’s refinery acquisition team.
Rick joined the Valero L.P. organization after the Valero/UDS merger and
held various senior operating and management positions, contributing to
the success and transition of today’s NuStar organization.
56 |
 Management
Bios Management Bios
Brad
Barron,
Senior
VP
-
General
Counsel
57
Brad
Barron
serves
as
Senior
Vice
President
and
General
Counsel
of
NuStar
Energy L.P. and NuStar GP Holdings, LLC, both of which are headquartered
in San Antonio, TX. As such, he provides legal counsel on all major
transactions, assures compliance with securities laws, provides legal
counsel to the boards of directors and principal officers, manages real
estate and right-of-way issues, and oversees health, safety and
environmental compliance.
Prior to joining the company, Mr. Barron was with Valero Energy
Corporation. Mr. Barron began his legal career with Vinson & Elkins LLP
and continued in private practice until he joined Valero in 2001.
A committed volunteer, Mr. Barron is also active in the San Antonio
community. He serves on the boards of directors of the Witte Museum,
Alamo Bowl and Family Service Association, and he previously volunteered
as
a
board
member
of
the
Boys
and
Girls
Club
of
San
Antonio.
He
also
serves on the Texas Tech Foundation Board.
Mr.
Barron
holds
a
B.B.A.
from
Texas
Tech
University
and
a
J.D.
from
the
University of Texas School of Law. In addition, Mr. Barron holds a M.L.A.
from St. John’s College. |
 Management
Bios Management Bios
Paul
Brattlof,
Senior
VP
-
Supply
and
Trading
58
Paul Brattlof leads NuStar Energy L.P.’s Marketing, Supply and
Trading organization, which includes products trading, crude supply &
trading, heavy fuels trading bunker marketing and asphalt marketing.
Under
Mr.
Brattlof’s
leadership,
this
organization
capitalizes
on
opportunities to optimize the use and profitability of the company’s
worldwide portfolio of assets, manages risk as NuStar diversifies its
business, and enhances the company’s competitive position when
pursuing acquisitions.
Mr. Brattlof has more than two decades of experience in cash
markets, futures markets and derivatives trading. Previously, he
served as Vice President of Trading for Valero Energy Corporation,
where he worked for 10 years. Prior to that, he spent 11 years with
Kerr-McGee Refining and two years with Mieco, a Long Beach-based
trading company. A graduate of Rice University, Mr. Brattlof holds a
Bachelor of Arts degree in Managerial Studies.
|
 Management
Bios Management Bios
Mike
Hoeltzel,
Senior
VP
–
Strategic
Planning
&
Economics
Senior Vice President for NuStar Energy L.P., responsible for developing
strategic plans, refinery planning, market analysis, and project
evaluations
Joined NuStar in February 2007 with 30 years refinery experience.
Valero Energy's Corporate Development Department from 2000 to
2007.
Primary
responsibility
was
valuation
of
refinery
acquisitions
during
this period of growth from 6 to 19 refineries.
Also supported growth of
Valero
L.P.
during
2002-2006
when
M&A
opportunities
for
both
companies were developed in a common department.
Worked in
CITGO's Corpus Christi refinery from 1991-2000 in various
Project Management, Planning & Economics, and Strategic Planning
positions.
Worked in Kerr-McKee's Corpus Christi refinery from 1977-1991 in
Project Management and Planning & Economics positions.
Worked for Exxon in Oil Production from 1971-1973 and Dupont from
1973-1977,
project engineering assignments with both companies.
Graduated from Oklahoma State University in 1971 with BS and MS
degrees
in
Mechanical
Engineering.
Also
received
MBA
from
Corpus
Christi State University (now Texas A&M Corpus Christi) in 1983
59 |
 Management
Bios Management Bios
Danny
Oliver,
Senior
VP
-
Marketing
and
Business
Development
60
Danny Oliver, Senior Vice President of Marketing & Business Development
for NuStar Energy L.P., oversees the company’s commercial activities for its
pipelines
and
terminals
business.
Previously,
he
served
as
Vice
President
of
Product
Supply
&
Trading
for
NuStar
where
he
was
instrumental
in
building
the company’s successful trading operations from the ground up. He brings
nearly
20
years
of
industry
experience
–
the
majority
of
which
was
spent
trading energy commodities.
Prior to joining NuStar in 2007, Mr. Oliver spent 10 years at Valero Energy
holding management positions in Product Supply & Trading where he helped
to build a world-class refined product trading organization and played a key
role in the company’s aggressive acquisition of refinery and logistics assets.
He
previously
worked
at
Enron
Corp.
in
the
International
Trading
division
where he was responsible for the company’s worldwide MTBE and Methanol
trading activities, and also held several positions at Kerr-McGee Refining &
Marketing in products scheduling and accounting,
with an emphasis in
reporting and analyzing trading activities.
Mr. Oliver graduated from Texas State University with a B.B.A. in Accounting.
Committed to the community in which he works and lives, Mr. Oliver
currently serves on the boards of directors of San Antonio Sports and the
Harmony Ridge Association. He is also actively involved with his church and
the United Way of Bexar County. |
 Management Bios
Kyle
Oppliger,
VP
GM
-
Operations
61
Kyle Oppliger serves as the Vice President and General Manager of the
NuStar Gulf Coast region. As such, he manages all aspects of the
region’s operations, maintenance, capital projects, safety and
environmental compliance, quality assurance and security initiatives for
NuStar terminal assets in Texas, Louisiana, Alabama, Georgia and
Florida. He brings over 15 years of experience in refining and
terminal operations. Prior to joining NuStar in 2006, Mr. Oppliger
spent 10 years at Valero Energy holding leadership roles in operations,
planning and economics and laboratory departments. He has played a
key role in the aggressive integration and development of acquired assets
in NuStar’s Gulf Coast region. He previously worked for
Phibro and Basis refining companies, and prior to working in the refining
industry, Mr. Oppliger worked as a chemist in research and
development.
As a committed volunteer, Mr. Oppliger has been active in communities in
which NuStar does business, including United Way organizations throughout
the Gulf region. Additionally he has been active in youth mentoring
programs, Big Brothers & Big Sisters and Boy Scouts of America.
Mr.
Oppliger
received
his
undergraduate
degree
in
Chemistry
from
Sam
Houston State University and his Master’s degree in Business from University
of Houston. |
 62
Appendix
Appendix |
 63
Reconciliation of Non-GAAP Financial
Information: EBITDA
(Unaudited, Dollars in Thousands)
The following is a reconciliation of net income to EBITDA:
2002
2003
2004
2005
2006
2007
2008
2009
2010
Net income
55,143
$
69,593
$
78,418
$
107,675
$
149,906
$
150,298
$
254,018
$
224,875
$
238,970
$
Plus interest expense, net
4,880
15,860
20,950
41,388
66,266
76,516
90,818
79,384
78,280
Plus income tax expense
395
-
-
4,713
5,861
11,448
11,006
10,531
11,741
Plus depreciation and amortization expense
16,440
26,267
33,149
64,895
100,266
114,293
135,709
145,743
153,802
EBITDA
76,858
111,720
132,517
218,671
322,299
352,555
491,551
460,533
482,793
Note: 2005 and 2006 EBITDA are from continuing operations.
Year Ended December 31,
NuStar Energy L.P. utilizes a financial measure, EBITDA, that is not defined in United States
generally accepted accounting principles. Management uses this financial measure because it is
a widely accepted financial indicator used by investors to compare partnership performance. In addition, management
believes that this measure provides investors an enhanced perspective of the operating performance of
the partnership's assets. EBITDA is not intended nor presented as an alternative to net
income. EBITDA should not be considered in isolation or as a substitute for a measure of performance prepared in
accordance with United States generally accepted accounting principles.
|
 64
Reconciliation of Non-GAAP Financial
Information: Storage Segment
The following is a reconciliation of operating income to EBITDA for the Storage
Segment: 2006
2007
2008
2009
2010
Operating income
108,486
$
114,635
$
141,079
$
171,245
$
178,947
$
Plus depreciation and amortization expense
53,121
62,317
66,706
70,888
77,071
EBITDA
161,607
$
176,952
$
207,785
$
242,133
$
256,018
$
Projected incremental operating income range
$ 11,000 -
20,000
Plus projected incremental depreciation and
amortization expense range
9,000 -
10,000
Projected incremental EBITDA range
$ 20,000 -
30,000
The following is a reconciliation of operating income to EBITDA for our St. James,
LA terminal: 2007
2008
2009
2010
Operating income
10,785
$
10,226
$
14,079
$
14,045
$
Plus depreciation and amortization expense
5,011
5,564
6,866
6,175
EBITDA
15,796
$
15,790
$
20,945
$
20,220
$
The following is a reconciliation of projected annual operating income to
projected annual EBITDA for our St. James, LA terminal: Projected operating
income 21,512
$
Plus projected depreciation and
amortization expense
7,296
Projected EBITDA
28,808
$
Year Ended
December 31, 2011
Year Ended December 31,
The following is a reconciliation of projected incremental operating income to
projected incremental EBITDA: Year Ended December 31,
Year Ended
December 31, 2011
(Unaudited, Dollars in Thousands)
NuStar Energy L.P. utilizes a financial measure, EBITDA, that is not defined in United States
generally accepted accounting principles. Management uses this financial measure because it is
a widely accepted financial indicator used by investors to compare partnership performance. In addition, management
believes that this measure provides investors an enhanced perspective of the operating performance of
the partnership's assets. EBITDA is not intended nor presented as an alternative to net income.
EBITDA should not be considered in isolation or as a substitute for a measure of performance prepared in
accordance with United States generally accepted accounting principles.
|
 65
Reconciliation of Non-GAAP Financial
Information: Transportation Segment
The following is a reconciliation of operating income to EBITDA for the
Transportation Segment: 2006
2007
2008
2009
2010
Operating income
122,714
$
126,508
$
135,086
$
139,869
$
148,571
$
Plus depreciation and amortization expense
47,145
49,946
50,749
50,528
50,617
EBITDA
169,859
$
176,454
$
185,835
$
190,397
$
199,188
$
The following is a reconciliation of projected decrease in operating income to
projected decrease in EBITDA: Projected decrease in operating income
($ 5,000 -
15,500)
Plus projected incremental depreciation and
amortization expense range
0 -
500
Projected decrease in EBITDA range
($ 5,000 -
15,000)
Year Ended
December 31,
2011
Year Ended December 31,
NuStar Energy L.P. utilizes a financial measure, EBITDA, that is not defined in United States
generally accepted accounting principles. Management uses this financial measure because it is
a widely accepted financial indicator used by investors to compare partnership performance. In addition, management
believes that this measure provides investors an enhanced perspective of the operating performance of
the partnership's assets. EBITDA is not intended nor presented as an alternative to net
income. EBITDA should not be considered in isolation or as a substitute for a measure of performance prepared in
accordance with United States generally accepted accounting principles.
(Unaudited, Dollars in Thousands) |
 66
Reconciliation of Non-GAAP Financial
Information: Asphalt and Fuels Marketing
Segment
(Unaudited, Dollars in Thousands)
Asphalt
Operations
Fuels Marketing
Operations
Asphalt and Fuels
Marketing
Segment
Operating income
53,977
$
36,884
$
90,861
$
Plus depreciation and
amortization expense 20,164
93
20,257
EBITDA
74,141
$
36,977
$
111,118
$
Asphalt
Operations
Fuels Marketing
Operations
Asphalt and Fuels
Marketing
Segment
Operating income
50,710
$
9,919
$
60,629
$
Plus depreciation and
amortization expense 19,463
-
19,463
EBITDA
70,173
$
9,919
$
80,092
$
Year Ended
December 31, 2007
Year Ended
December 31, 2006
Asphalt
Operations
Fuels Marketing
Operations
Asphalt and Fuels
Marketing
Segment
Asphalt and Fuels
Marketing
Segment
Asphalt and Fuels
Marketing
Segment
Operating income
76,267
$
36,239
$
112,506
$
21,111
$
26,815
$
Plus depreciation and
amortization expense 14,182
552
14,734
423
-
EBITDA
90,449
$
36,791
$
127,240
$
21,534
$
26,815
$
Year Ended December 31,
2009 Year Ended December 31, 2008
NuStar
Energy
L.P.
utilizes
a
financial
measure,
EBITDA,
that
is
not
defined
in
United
States
generally
accepted
accounting
principles.
Management
uses
this
financial
measure
because
it
is
a
widely
accepted
financial
indicator
used
by
investors
to
compare
partnership
performance.
In
addition,
management
believes
that
this
measure
provides
investors
an
enhanced
perspective
of
the
operating
performance
of
the
partnership's
assets.
EBITDA
is
not
intended
nor
presented
as
an
alternative
to
net
income.
EBITDA
should
not
be
considered
in
isolation
or
as
a
substitute
for
a
measure
of
performance
prepared
in
accordance
with
United
States
generally
accepted
accounting principles.
The following tables reconcile operating income to EBITDA for asphalt operations
and fuels marketing operations in our asphalt and fuels marketing segment:
Year Ended December 31, 2010 |
 67
Reconciliation of Non-GAAP Financial
Information: Acquisitions
(Unaudited, Dollars in Thousands)
San Antonio
Refinery
Turkey
Total
Projected annual operating income
17,000
$
1,000
$
18,000
$
Plus projected annual
depreciation and amortization expense
2,500
1,800
4,300
Projected annual EBITDA
19,500
$
2,800
$
22,300
$
Year Ended
December 31,
2011
Projected operating income
13,000
$
Plus projected depreciation
and amortization expense
2,000
Projected EBITDA
15,000
$
The following is a reconciliation of projected annual
operating income to projected annual EBITDA for our 2011 Acquisitions: The
following is a reconciliation of projected operating income to projected EBITDA for the San Antonio Refinery acquisition:
NuStar Energy L.P. utilizes a financial measure, EBITDA, that is not defined in United States
generally accepted accounting principles. Management uses this financial measure because it is
a widely accepted financial indicator used by investors to compare partnership performance. In addition, management believes that this measure
provides investors an enhanced perspective of the operating performance of the partnership's assets.
EBITDA is not intended nor presented as an alternative to net income. EBITDA should not be
considered in isolation or as a substitute for a measure of performance prepared in accordance with United States generally accepted
accounting principles.
|