Attached files
| file | filename |
|---|---|
| 8-K - 8-K - HARDINGE INC | a11-26388_18k.htm |
Exhibit 99.1
|
|
Longbow Research Industrial Manufacturing & Technology Investor Conference September 15, 2011 Presenters Richard Simons Edward Gaio President & Chief Executive Officer Vice President & Chief Financial Officer NASDAQ: HDNG |
|
|
Presentation Contains Forward-Looking Statements This presentation contains forward-looking statements (within the meaning of Section 27A of the Securities Act of 1933, as amended and Section 21E of the Securities Exchange Act of 1934, as amended). Such statements are based upon management’s current expectations that involve risks and uncertainties. Any statements that are not statements of historical fact or that are about future events may be deemed to be forward-looking statements. For example, words such as “may”, “will”, “should”, “estimates”, “predicts”, “potential”, “continue”, “strategy”, “believes”, “anticipates”, “plans”, “expects”, “intends” and similar expressions are intended to identify forward-looking statements. The Company’s actual results or outcomes and the timing of certain events may differ significantly from those discussed in any forward-looking statements. The following factors are among those that could cause actual results to differ materially from the forward-looking statements, which involve risks and uncertainties, and that should be considered in evaluating any such statement: fluctuations in the machine tool business cycles, changes in general economic conditions in the U.S. or internationally, the mix of products sold and the profit margins thereon, the relative success of the Company’s entry into new product and geographic markets, the Company’s ability to manage its operating costs, actions taken by customers such as order cancellations or reduced bookings by customers or distributors, competitor’s actions such as price discounting or new product introductions, governmental regulations and environmental matters, changes in the availability of cost of materials and supplies, the implementation of new technologies and currency fluctuations. The Company undertakes no obligation to publicly update any forward-looking statement, whether as a result of new information, future events, or otherwise. 2 |
|
|
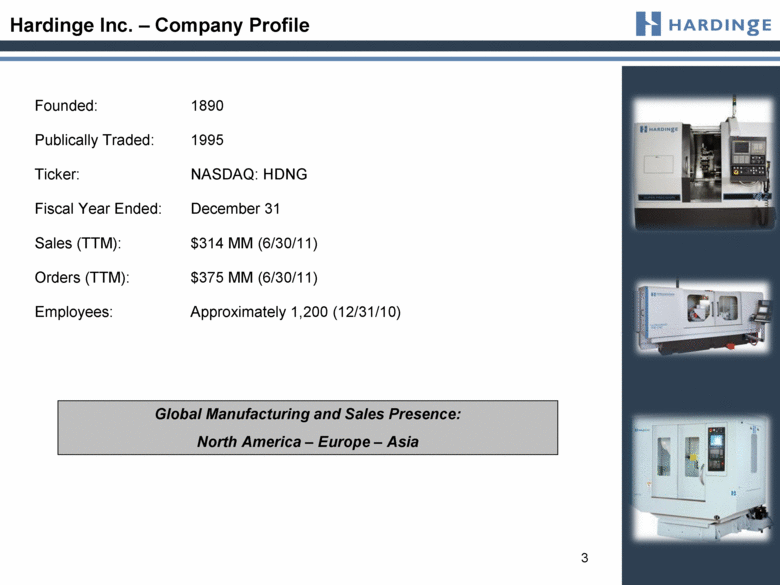
Hardinge Inc. – Company Profile ii Founded: 1890 Publically Traded: 1995 Ticker: NASDAQ: HDNG Fiscal Year Ended: December 31 Sales (TTM): $314 MM (6/30/11) Orders (TTM): $375 MM (6/30/11) Employees: Approximately 1,200 (12/31/10) Global Manufacturing and Sales Presence: North America – Europe – Asia 3 |
|
|
Hardinge Inc. – Investment Profile Shares Outstanding 11.7 MM Average 50-Day Trading Volume 37,000 Market Cap $105.6 MM P/E Ratio (TTM) 19.8 52 Week Price Range $7.53 - $14.00 Forward Annualized Dividend $0.08 Forward Annualized Dividend Yield 0.9% Book Value Per Share1 $15.48 Inst. Ownership (Shares) 7.8 MM Inst. Ownership (Percentage) 67.0% Inst. Holders 69 Inside Ownership 3.4% All market data are obtained from www.nasdaq.net as of 09/07/2011, except otherwise noted. (1) Amount calculated based on published balance sheet as of June 30, 2011. 4 |
|
|
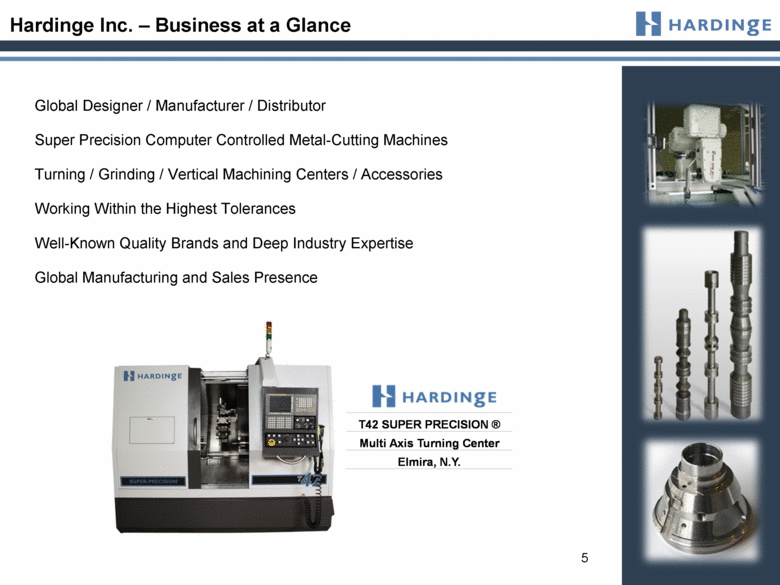
Hardinge Inc. – Business at a Glance Global Designer / Manufacturer / Distributor Super Precision Computer Controlled Metal-Cutting Machines Turning / Grinding / Vertical Machining Centers / Accessories Working Within the Highest Tolerances Well-Known Quality Brands and Deep Industry Expertise Global Manufacturing and Sales Presence 5 T42 SUPER PRECISION ® Multi Axis Turning Center Elmira, N.Y. |
|
|
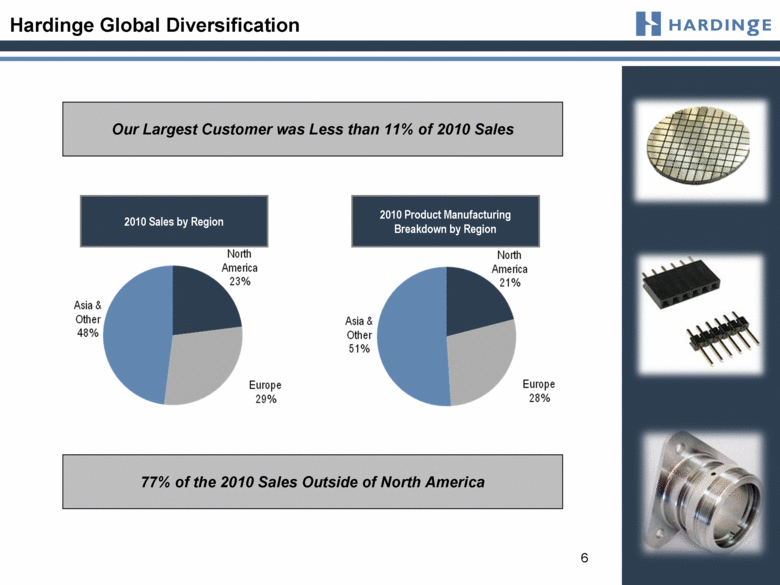
Hardinge Global Diversification 2010 Sales by Region 2010 Product Manufacturing Breakdown by Region Our Largest Customer was Less than 11% of 2010 Sales 77% of the 2010 Sales Outside of North America 6 |
|
|
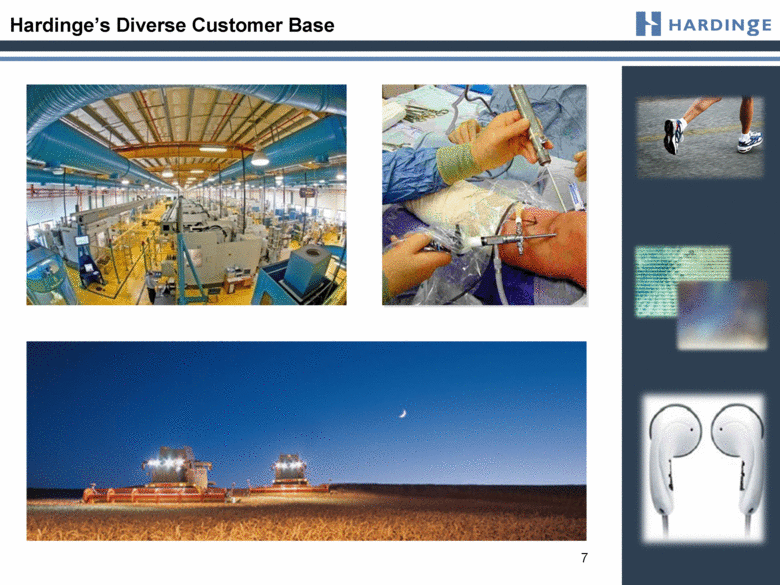
Hardinge’s Diverse Customer Base 7 |
|
|
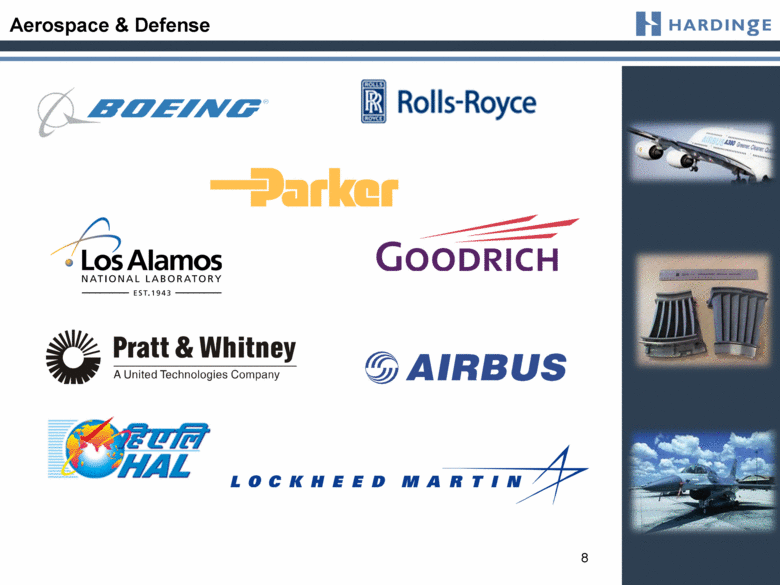
Aerospace & Defense 8 |
|
|
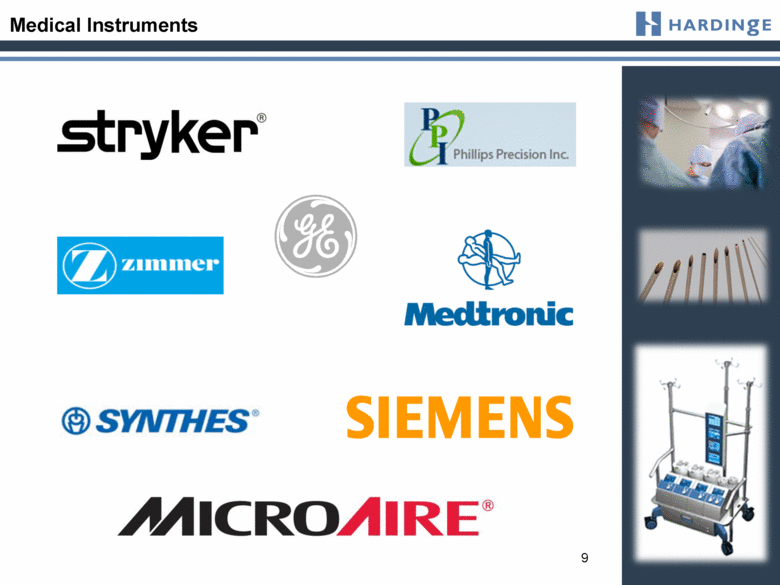
Medical Instruments 9 |
|
|
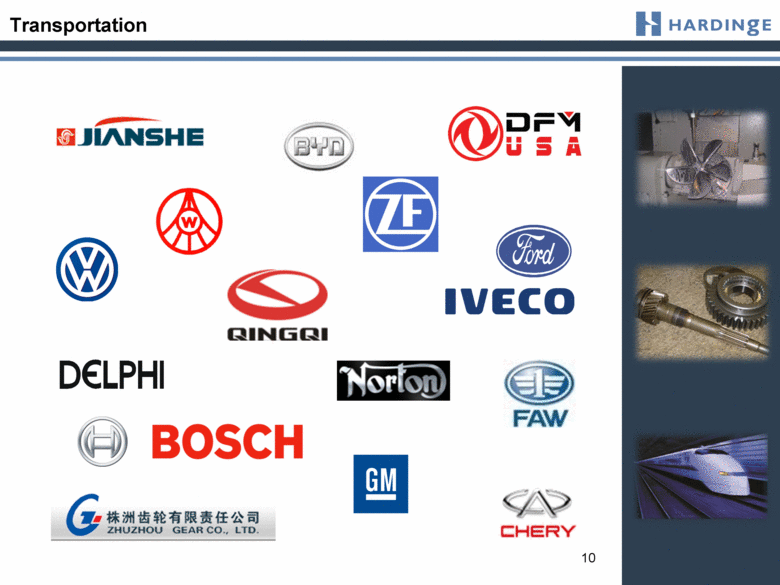
Transportation 10 |
|
|
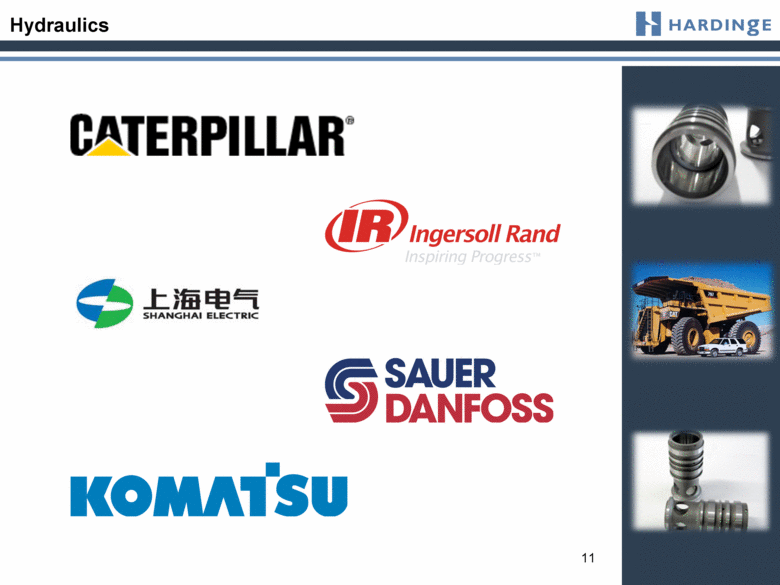
Hydraulics 11 |
|
|
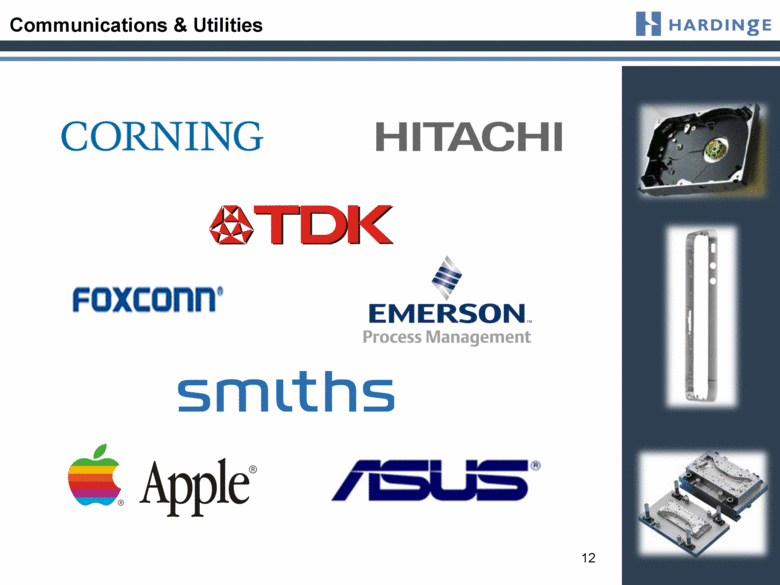
Communications & Utilities 12 |
|
|
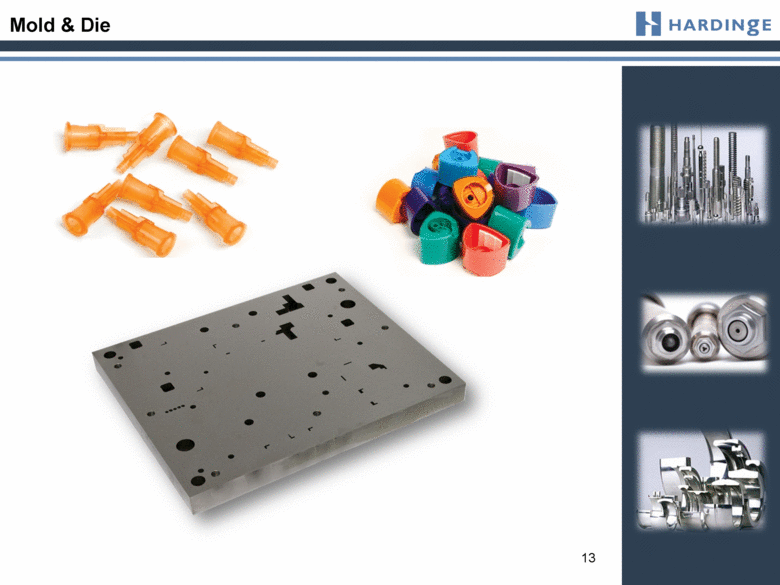
Mold & Die 13 |
|
|
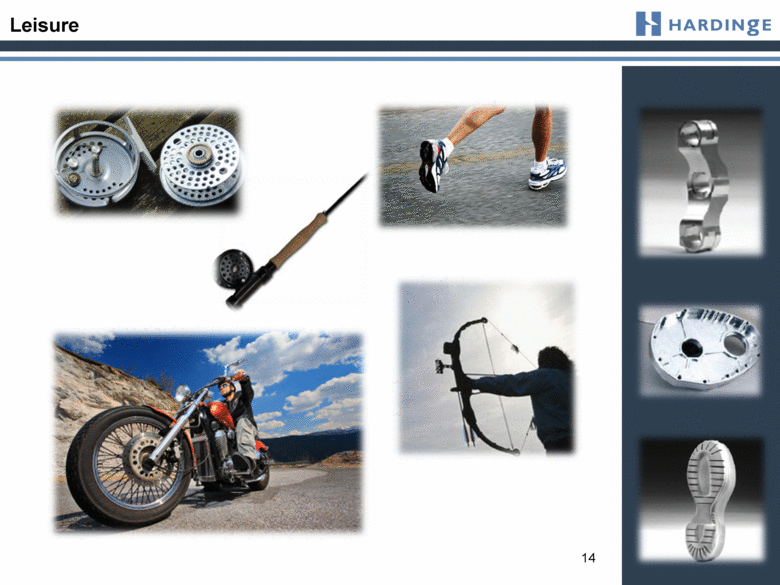
Leisure 14 |
|
|
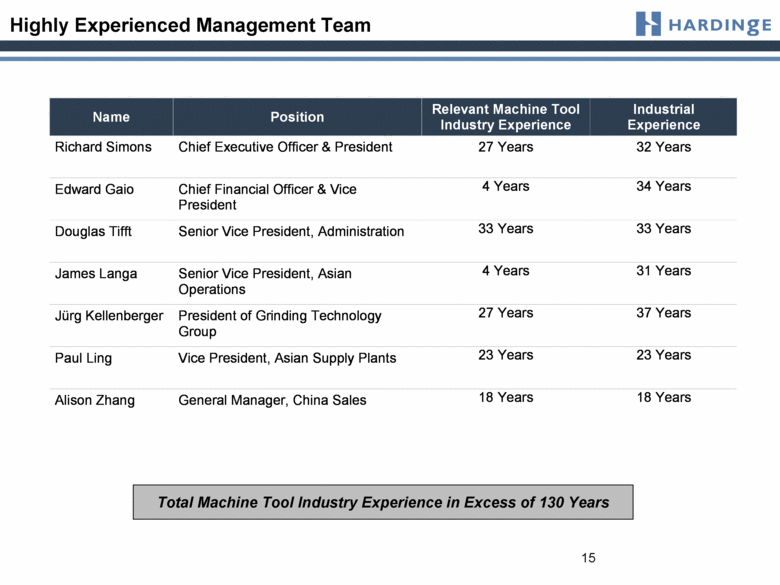
Highly Experienced Management Team Total Machine Tool Industry Experience in Excess of 130 Years 15 Name Position Relevant Machine Tool Industry Experience Industrial Experience Richard Simons Chief Executive Officer & President 27 Years 32 Years Edward Gaio Chief Financial Officer & Vice President 4 Years 34 Years Douglas Tifft Senior Vice President, Administration 33 Years 33 Years James Langa Senior Vice President, Asian Operations 4 Years 31 Years Jürg Kellenberger President of Grinding Technology Group 27 Years 37 Years Paul Ling Vice President, Asian Supply Plants 23 Years 23 Years Alison Zhang General Manager, China Sales 18 Years 18 Years |
|
|
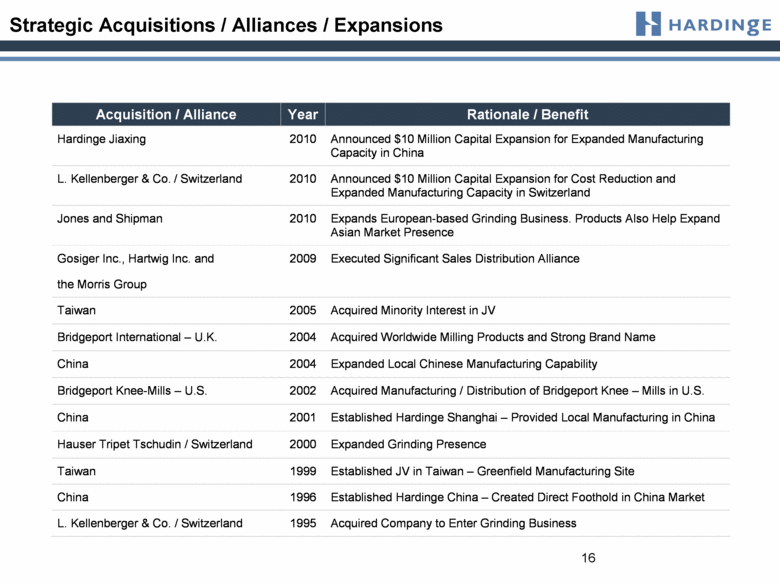
Strategic Acquisitions / Alliances / Expansions 16 Acquisition / Alliance Year Rationale / Benefit Hardinge Jiaxing 2010 Announced $10 Million Capital Expansion for Expanded Manufacturing Capacity in China L. Kellenberger & Co. / Switzerland 2010 Announced $10 Million Capital Expansion for Cost Reduction and Expanded Manufacturing Capacity in Switzerland Jones and Shipman 2010 Expands European-based Grinding Business. Products Also Help Expand Asian Market Presence Gosiger Inc., Hartwig Inc. and the Morris Group 2009 Executed Significant Sales Distribution Alliance Taiwan 2005 Acquired Minority Interest in JV Bridgeport International – U.K. 2004 Acquired Worldwide Milling Products and Strong Brand Name China 2004 Expanded Local Chinese Manufacturing Capability Bridgeport Knee-Mills – U.S. 2002 Acquired Manufacturing / Distribution of Bridgeport Knee – Mills in U.S. China 2001 Established Hardinge Shanghai – Provided Local Manufacturing in China Hauser Tripet Tschudin / Switzerland 2000 Expanded Grinding Presence Taiwan 1999 Established JV in Taiwan – Greenfield Manufacturing Site China 1996 Established Hardinge China – Created Direct Foothold in China Market L. Kellenberger & Co. / Switzerland 1995 Acquired Company to Enter Grinding Business |
|
|
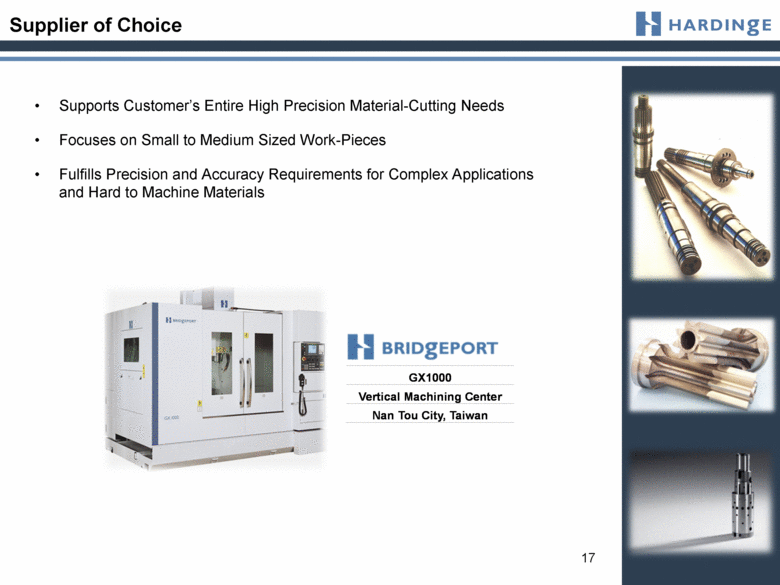
Supplier of Choice Supports Customer’s Entire High Precision Material-Cutting Needs Focuses on Small to Medium Sized Work-Pieces Fulfills Precision and Accuracy Requirements for Complex Applications and Hard to Machine Materials 17 GX1000 Vertical Machining Center Nan Tou City, Taiwan |
|
|
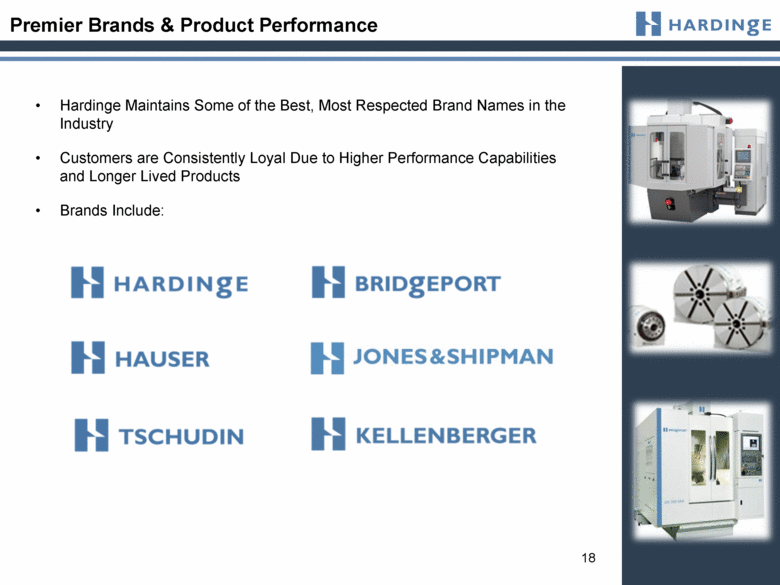
Premier Brands & Product Performance Hardinge Maintains Some of the Best, Most Respected Brand Names in the Industry Customers are Consistently Loyal Due to Higher Performance Capabilities and Longer Lived Products Brands Include: 18 |
|
|
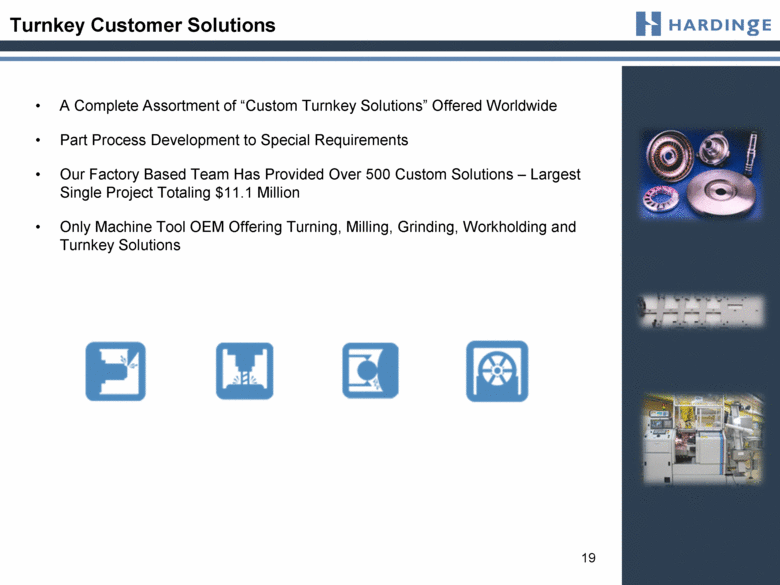
Turnkey Customer Solutions A Complete Assortment of “Custom Turnkey Solutions” Offered Worldwide Part Process Development to Special Requirements Our Factory Based Team Has Provided Over 500 Custom Solutions – Largest Single Project Totaling $11.1 Million Only Machine Tool OEM Offering Turning, Milling, Grinding, Workholding and Turnkey Solutions 19 |
|
|
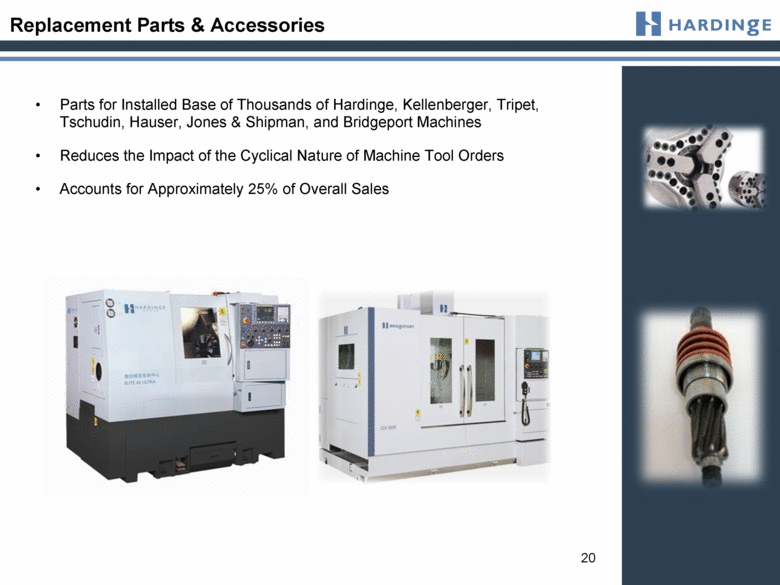
Replacement Parts & Accessories Parts for Installed Base of Thousands of Hardinge, Kellenberger, Tripet, Tschudin, Hauser, Jones & Shipman, and Bridgeport Machines Reduces the Impact of the Cyclical Nature of Machine Tool Orders Accounts for Approximately 25% of Overall Sales 20 |
|
|
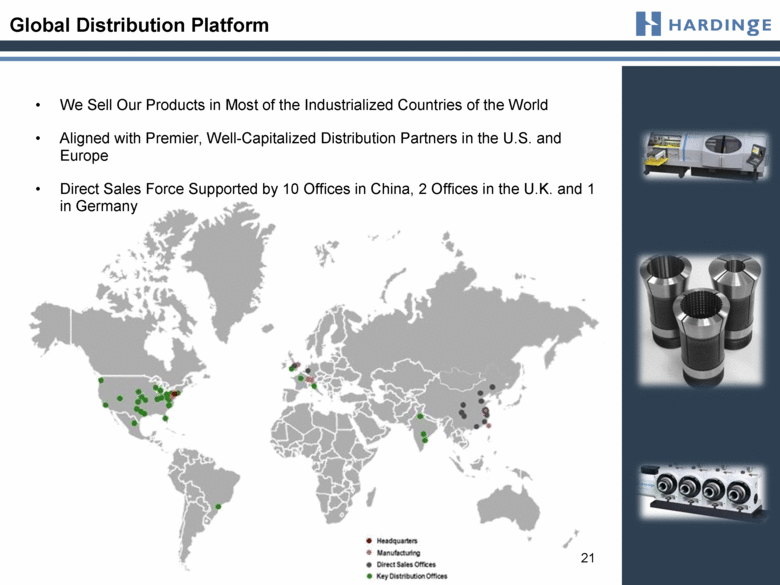
Global Distribution Platform We Sell Our Products in Most of the Industrialized Countries of the World Aligned with Premier, Well-Capitalized Distribution Partners in the U.S. and Europe Direct Sales Force Supported by 10 Offices in China, 2 Offices in the U.K. and 1 in Germany 21 |
|
|
Driving Long-Term Value Initiatives in 2008, 2009, and 2010 Significantly Improved the Company’s Operating Cost Structure, Working Capital and Business Model, While Increasing Capacity in Asia and Our Global Grinding Capacity. Initiatives Included: Streamlined Distribution Channels Focused Direct Sales and Distribution Channel Partners for the Top 15 Key Geographic Markets and a Few Key Developing Markets (BRIC Countries) Realigned U.S. Distribution Structure Consolidated European Sales and Distribution Organizations Outsourced Non-Critical Machine Parts Manufacturing From the U.S. Facility Eliminated Unprofitable Product Lines Focused on New Product Engineering for Higher-End Products Expanded Capacity and Capabilities in: Switzerland : ~ $10 MM Investment in a New Facility With Upgraded Machining Capabilities and Reduced Operating Costs China : ~ $10 MM Investment in a New Facility in Jiaxing, China Which Nearly Triples Capacity for Assembly in China Initiatives Generated Annual Fixed Cost Savings of Approximately $30 Million and Expanded Capacity to Serve Demand 22 |
|
|
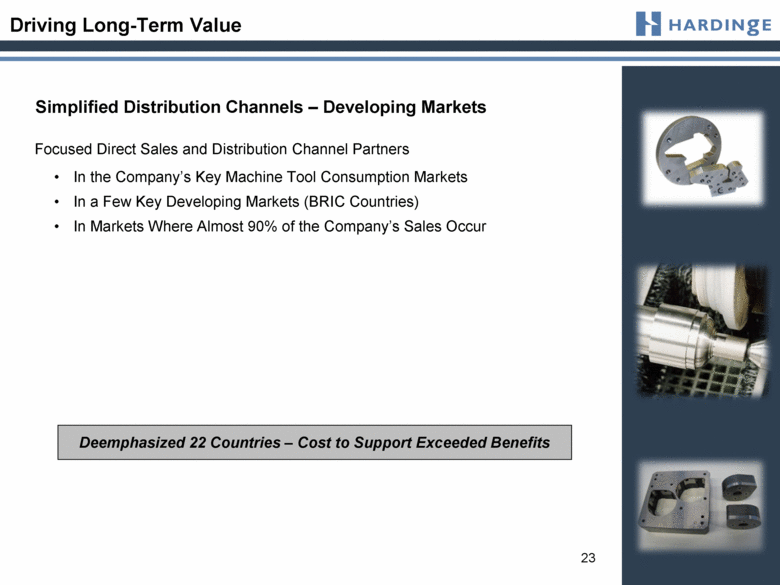
Driving Long-Term Value Simplified Distribution Channels – Developing Markets Focused Direct Sales and Distribution Channel Partners In the Company’s Key Machine Tool Consumption Markets In a Few Key Developing Markets (BRIC Countries) In Markets Where Almost 90% of the Company’s Sales Occur Deemphasized 22 Countries – Cost to Support Exceeded Benefits 23 |
|
|
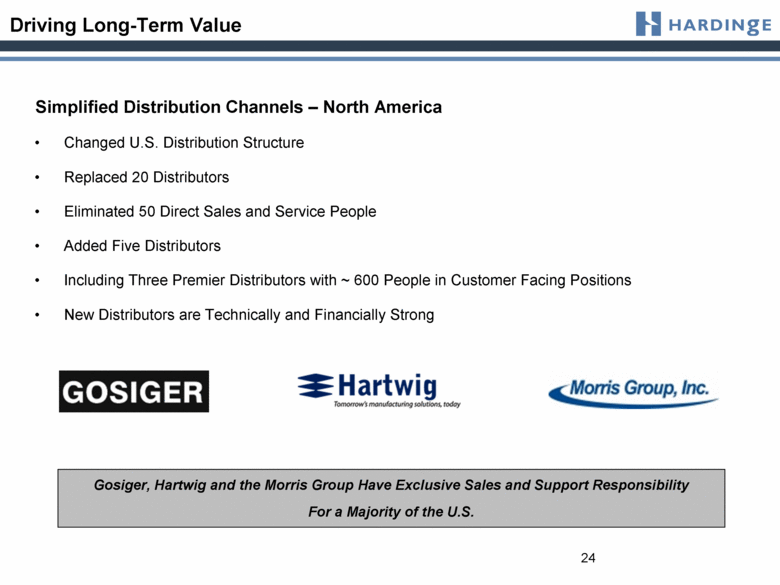
Driving Long-Term Value Simplified Distribution Channels – North America Changed U.S. Distribution Structure Replaced 20 Distributors Eliminated 50 Direct Sales and Service People Added Five Distributors Including Three Premier Distributors with ~ 600 People in Customer Facing Positions New Distributors are Technically and Financially Strong Gosiger, Hartwig and the Morris Group Have Exclusive Sales and Support Responsibility For a Majority of the U.S. 24 |
|
|
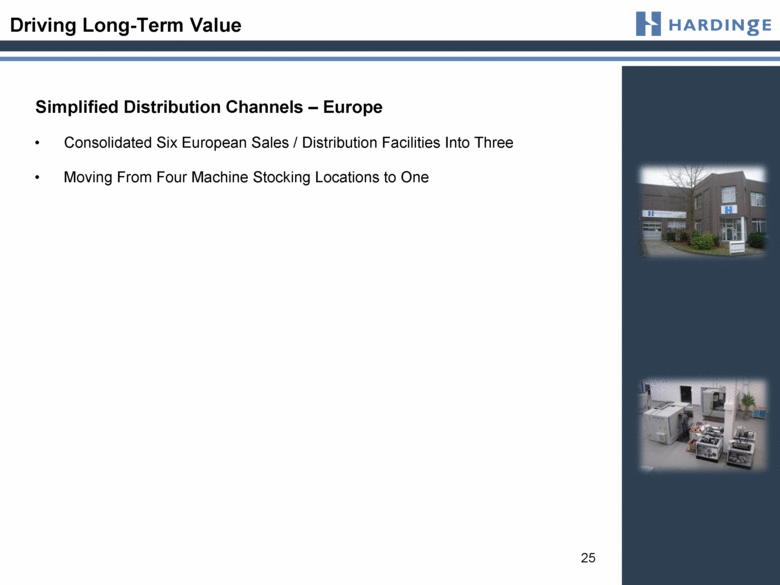
Driving Long-Term Value Simplified Distribution Channels – Europe Consolidated Six European Sales / Distribution Facilities Into Three Moving From Four Machine Stocking Locations to One 25 |
|
|
Driving Long-Term Value Outsourced Non-Critical Machine Parts Manufacturing From the U.S. Facility Reduced Manufacturing Employment From 229 to 62 Focused U.S. Manufacturing On Design and Assembly Production of Critical Components Workholding Manufacturing Decommissioned and Sold Over 80 Pieces of Equipment 26 |
|
|
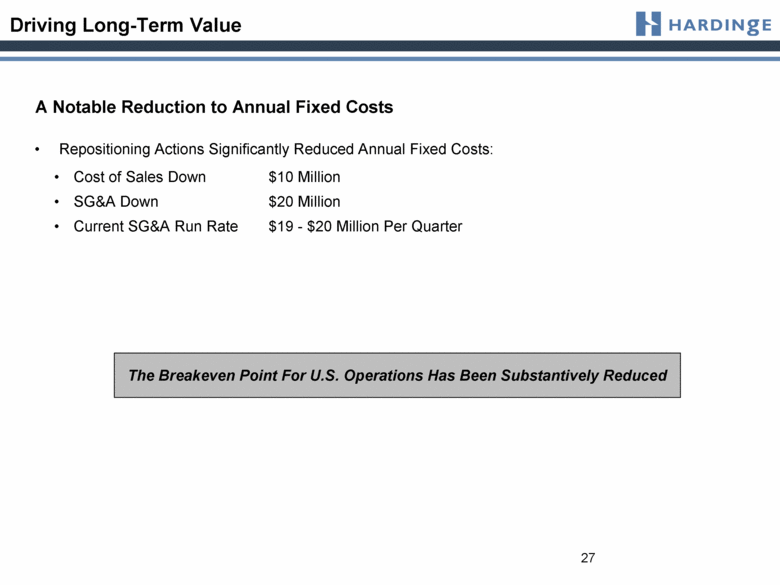
Driving Long-Term Value A Notable Reduction to Annual Fixed Costs Repositioning Actions Significantly Reduced Annual Fixed Costs: Cost of Sales Down $10 Million SG&A Down $20 Million Current SG&A Run Rate $19 - $20 Million Per Quarter The Breakeven Point For U.S. Operations Has Been Substantively Reduced 27 |
|
|
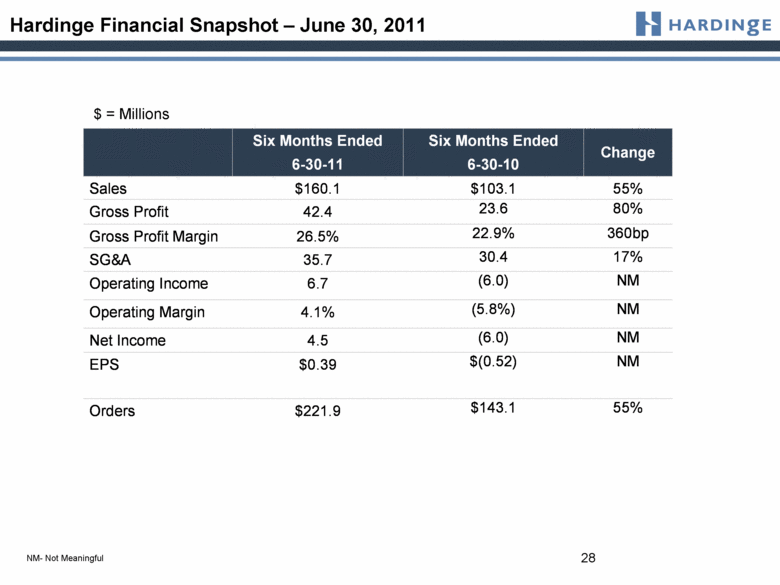
Hardinge Financial Snapshot – June 30, 2011 $ = Millions NM- Not Meaningful 28 Six Months Ended 6-30-11 Six Months Ended 6-30-10 Change Sales $160.1 $103.1 55% Gross Profit 42.4 23.6 80% Gross Profit Margin 26.5% 22.9% 360bp SG&A 35.7 30.4 17% Operating Income 6.7 (6.0) NM Operating Margin 4.1% (5.8%) NM Net Income 4.5 (6.0) NM EPS $0.39 $(0.52) NM Orders $221.9 $143.1 55% |
|
|
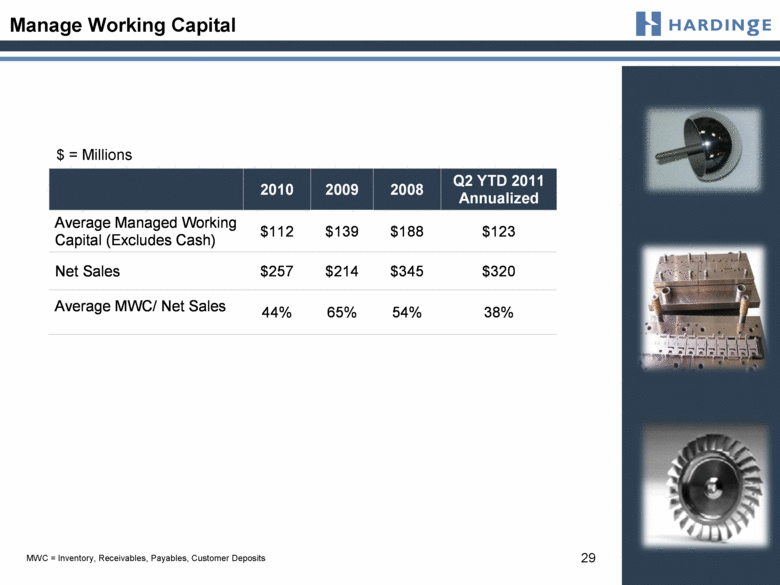
Manage Working Capital $ = Millions MWC = Inventory, Receivables, Payables, Customer Deposits 29 2010 2009 2008 Q2 YTD 2011 Annualized Average Managed Working Capital (Excludes Cash) $112 $139 $188 $123 Net Sales $257 $214 $345 $320 Average MWC/ Net Sales 44% 65% 54% 38% |
|
|
Hardinge Order Growth 2010 - 2011 $ = Millions YOY % 75% 92% 51% 63% 98% 26% 30 |
|
|
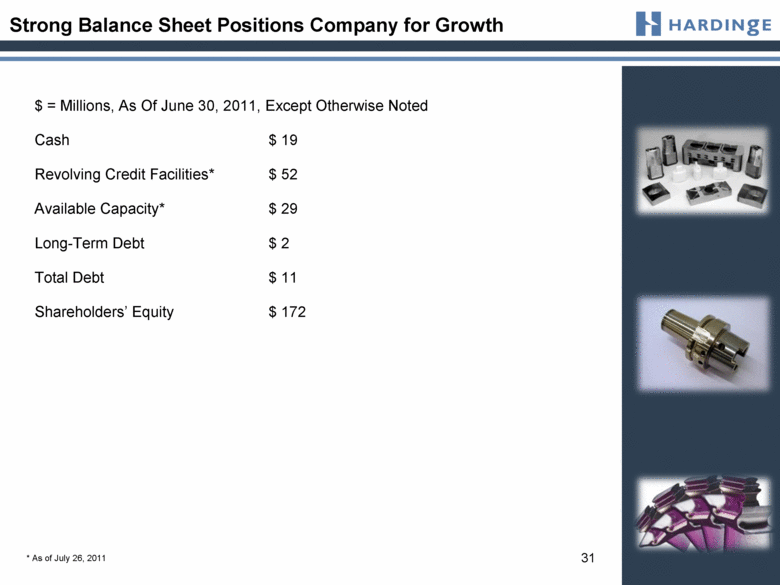
Strong Balance Sheet Positions Company for Growth $ = Millions, As Of June 30, 2011, Except Otherwise Noted Cash $ 19 Revolving Credit Facilities* $ 52 Available Capacity* $ 29 Long-Term Debt $ 2 Total Debt $ 11 Shareholders’ Equity $ 172 31 * As of July 26, 2011 |
|
|
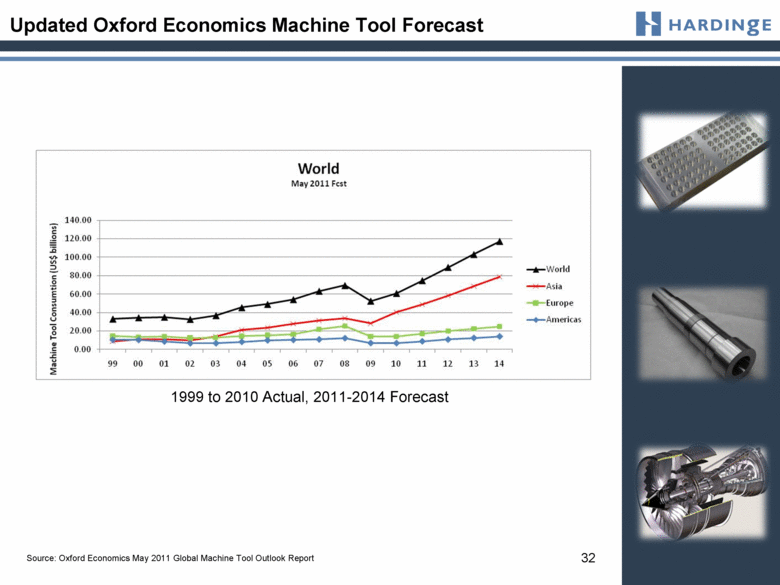
Updated Oxford Economics Machine Tool Forecast Source: Oxford Economics May 2011 Global Machine Tool Outlook Report 32 1999 to 2010 Actual, 2011-2014 Forecast |
|
|
Global Growth - China World Machine Tool Consumption Increased 19% in 2010 * China – the World's Largest Market - Increased 38% in 2010* China Third Largest Producer Behind Only Japan and Germany China Machine Tool Consumption 2010 - $27 Billion ^ 39% of HDNG 2010 Sales - China $36 Million Order in 2010 from Single Supplier to the Consumer Electronics Industry * Metalworking Insiders Report ^ 2011 World Machine Tool Output & Consumption Survey 33 |
|
|
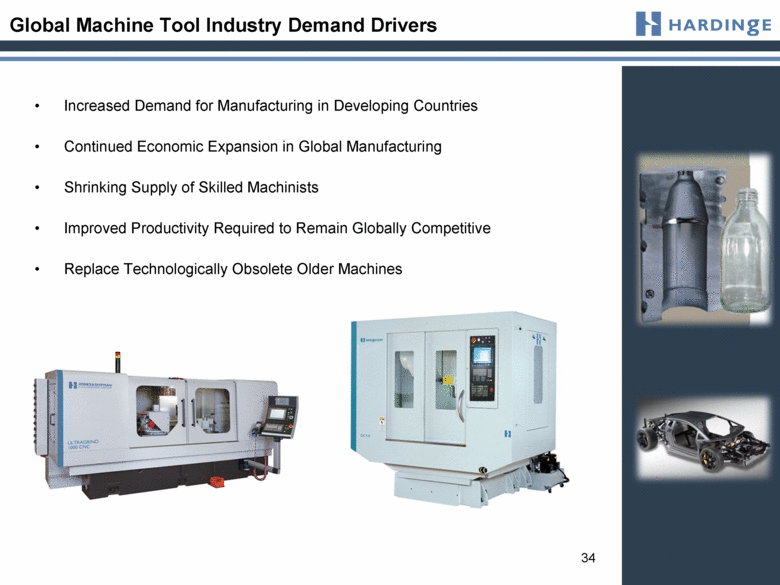
Global Machine Tool Industry Demand Drivers Increased Demand for Manufacturing in Developing Countries Continued Economic Expansion in Global Manufacturing Shrinking Supply of Skilled Machinists Improved Productivity Required to Remain Globally Competitive Replace Technologically Obsolete Older Machines 34 |
|
|
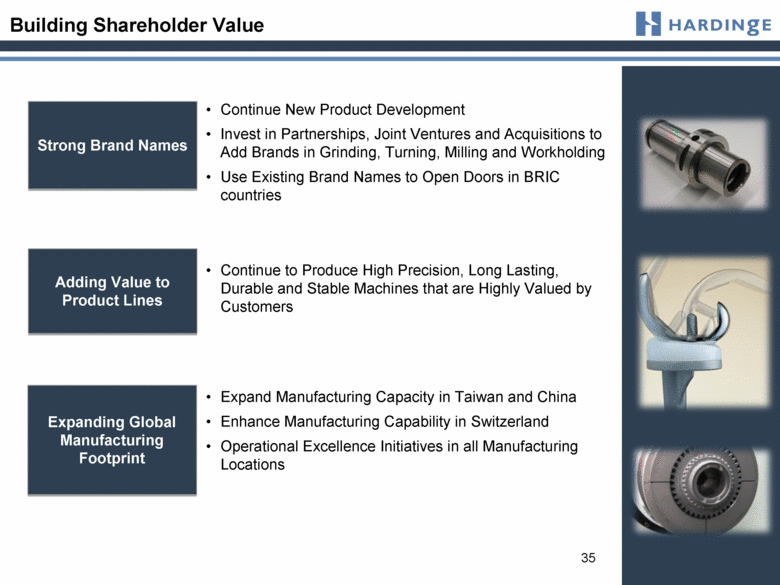
Building Shareholder Value Strong Brand Names Continue New Product Development Invest in Partnerships, Joint Ventures and Acquisitions to Add Brands in Grinding, Turning, Milling and Workholding Use Existing Brand Names to Open Doors in BRIC countries Expanding Global Manufacturing Footprint Expand Manufacturing Capacity in Taiwan and China Enhance Manufacturing Capability in Switzerland Operational Excellence Initiatives in all Manufacturing Locations Adding Value to Product Lines Continue to Produce High Precision, Long Lasting, Durable and Stable Machines that are Highly Valued by Customers 35 |
|
|
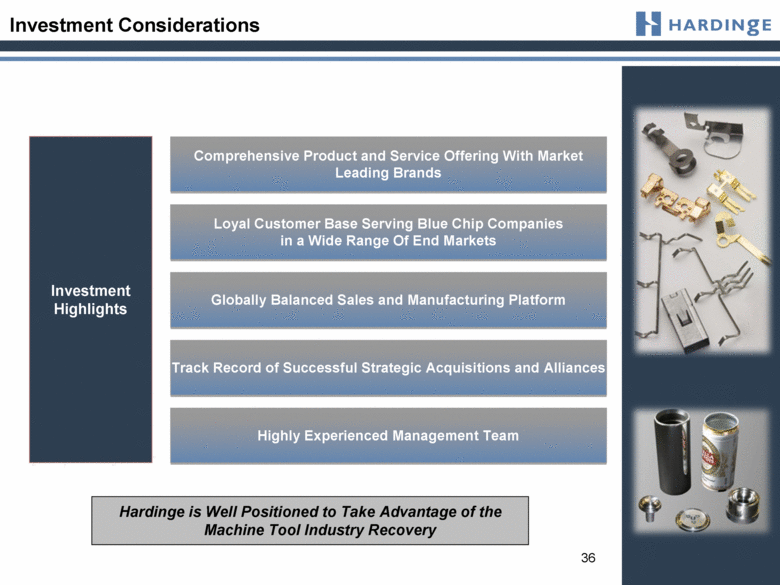
Investment Considerations Investment Highlights Comprehensive Product and Service Offering With Market Leading Brands Globally Balanced Sales and Manufacturing Platform Track Record of Successful Strategic Acquisitions and Alliances Loyal Customer Base Serving Blue Chip Companies in a Wide Range Of End Markets Highly Experienced Management Team Hardinge is Well Positioned to Take Advantage of the Machine Tool Industry Recovery 36 |
|
|
Q&A NASDAQ: HDNG Longbow Research Industrial Manufacturing & Technology Investor Conference September 15, 2011 |

