Attached files
| file | filename |
|---|---|
| 8-K - 8-K - TAKE TWO INTERACTIVE SOFTWARE INC | a11-26314_18k.htm |
Exhibit 99.1
|
|
Take-Two Interactive Software, Inc. (NASDAQ: TTWO) ThinkEquity 8th Annual Growth Conference September 13, 2011 |
|
|
The statements contained herein which are not historical facts are considered forward-looking statements under federal securities laws and may be identified by words such as "anticipates," "believes," "estimates," "expects," "intends," "plans," "potential," "predicts," "projects," "seeks," "will," or words of similar meaning and include, but are not limited to, statements regarding the outlook for the Company's future business and financial performance. Such forward-looking statements are based on the current beliefs of our management as well as assumptions made by and information currently available to them, which are subject to inherent uncertainties, risks and changes in circumstances that are difficult to predict. Actual outcomes and results may vary materially from these forward-looking statements based on a variety of risks and uncertainties including: our dependence on key management and product development personnel, our dependence on our Grand Theft Auto products and our ability to develop other hit titles for current generation platforms, the timely release and significant market acceptance of our games, the ability to maintain acceptable pricing levels on our games, our ability to raise capital if needed and risks associated with international operations. Other important factors and information are contained in the Company's Annual Report on Form 10-K for the fiscal year ended March 31, 2011, in the section entitled "Risk Factors," and the Company's other periodic filings with the SEC, which can be accessed at www.take2games.com. All forward-looking statements are qualified by these cautionary statements and apply only as of the date they are made. The Company undertakes no obligation to update any forward-looking statement, whether as a result of new information, future events or otherwise. Forward-Looking Statements |
|
|
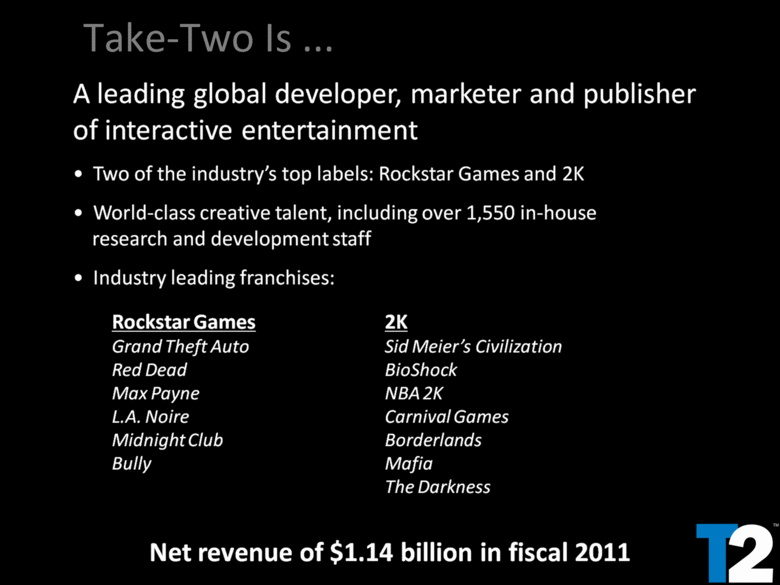
Take-Two Is A leading global developer, marketer and publisher of interactive entertainment Two of the industry’s top labels: Rockstar Games and 2K World-class creative talent, including over 1,550 in-house research and development staff Industry leading franchises: Rockstar Games 2K Grand Theft Auto Red Dead Max Payne L.A. Noire Midnight Club Bully Sid Meier’s Civilization BioShock NBA 2K Carnival Games Borderlands Mafia The Darkness Net revenue of $1.14 billion in fiscal 2011 |
|
|
Positioned for Continued Success Favorable demographic and industry trends Unparalleled creative team and strong management Diverse portfolio of top-rated, commercially successful franchises Proven strategy focused on publishing select triple-A titles Actively investing in digitally delivered content, online gaming and mobile gaming Profitable on a non-GAAP basis (1) Robust pipeline of titles in development Based on actual results for fiscal 2011 and financial outlook for fiscal 2012 and 2013 as of August 8, 2011. See the attached Glossary for a discussion of non-GAAP financial measures and cautionary statement . |
|
|
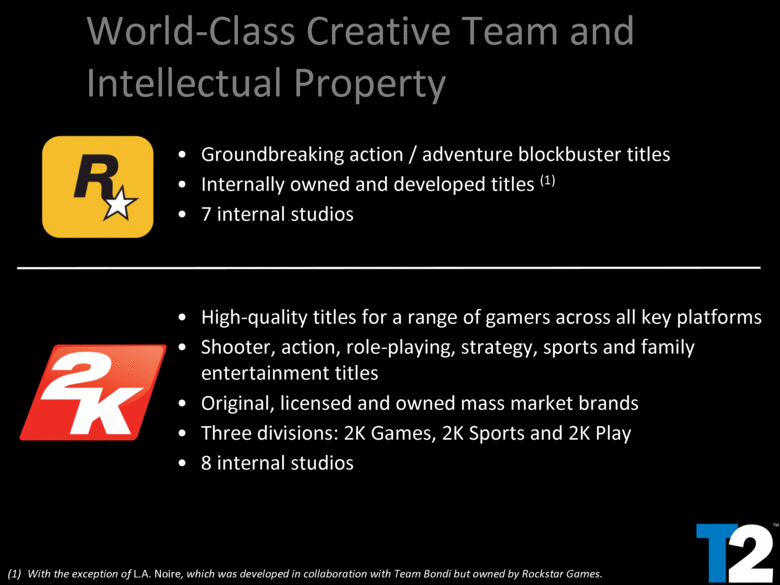
World-Class Creative Team and Intellectual Property High-quality titles for a range of gamers across all key platforms Shooter, action, role-playing, strategy, sports and family entertainment titles Original, licensed and owned mass market brands Three divisions: 2K Games, 2K Sports and 2K Play 8 internal studios Groundbreaking action / adventure blockbuster titles Internally owned and developed titles (1) 7 internal studios With the exception of L.A. Noire, which was developed in collaboration with Team Bondi but owned by Rockstar Games. |
|
|
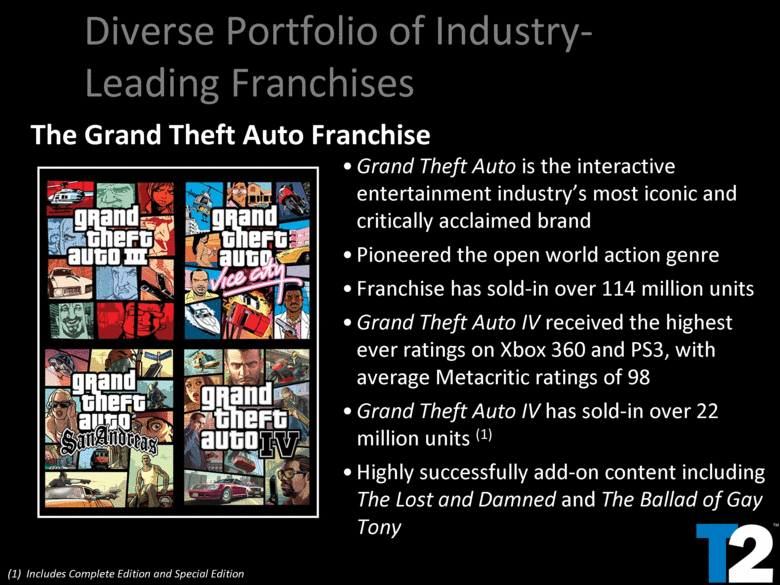
Diverse Portfolio of Industry-Leading Franchises The Grand Theft Auto Franchise Grand Theft Auto is the interactive entertainment industry’s most iconic and critically acclaimed brand Pioneered the open world action genre Franchise has sold-in over 114 million units Grand Theft Auto IV received the highest ever ratings on Xbox 360 and PS3, with average Metacritic ratings of 98 Grand Theft Auto IV has sold-in over 22 million units (1) Highly successfully add-on content including The Lost and Damned and The Ballad of Gay Tony (1) Includes Complete Edition and Special Edition |
|
|
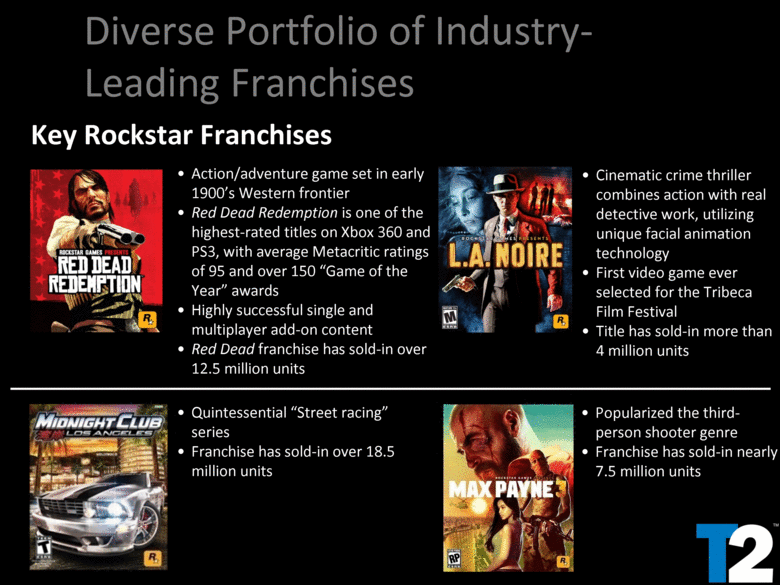
Action/adventure game set in early 1900’s Western frontier Red Dead Redemption is one of the highest-rated titles on Xbox 360 and PS3, with average Metacritic ratings of 95 and over 150 “Game of the Year” awards Highly successful single and multiplayer add-on content Red Dead franchise has sold-in over 12.5 million units Quintessential “Street racing” series Franchise has sold-in over 18.5 million units Popularized the third-person shooter genre Franchise has sold-in nearly 7.5 million units Cinematic crime thriller combines action with real detective work, utilizing unique facial animation technology First video game ever selected for the Tribeca Film Festival Title has sold-in more than 4 million units Key Rockstar Franchises Diverse Portfolio of Industry-Leading Franchises |
|
|
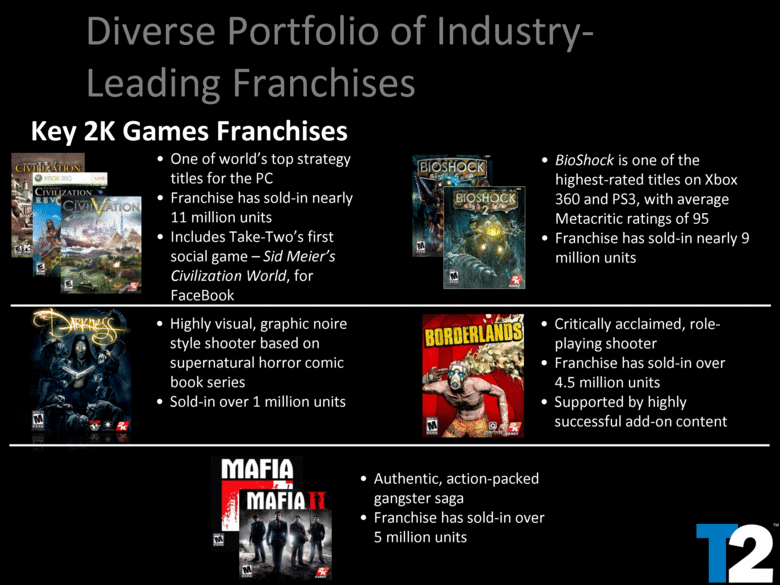
Diverse Portfolio of Industry-Leading Franchises Key 2K Games Franchises BioShock is one of the highest-rated titles on Xbox 360 and PS3, with average Metacritic ratings of 95 Franchise has sold-in nearly 9 million units One of world’s top strategy titles for the PC Franchise has sold-in nearly 11 million units Includes Take-Two’s first social game – Sid Meier’s Civilization World, for FaceBook Authentic, action-packed gangster saga Franchise has sold-in over 5 million units Critically acclaimed, role-playing shooter Franchise has sold-in over 4.5 million units Supported by highly successful add-on content Highly visual, graphic noire style shooter based on supernatural horror comic book series Sold-in over 1 million units |
|
|
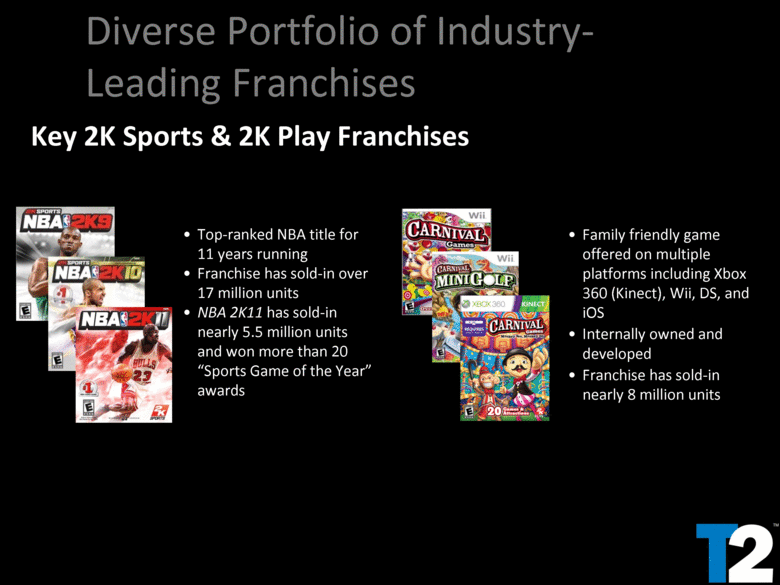
Top-ranked NBA title for 11 years running Franchise has sold-in over 17 million units NBA 2K11 has sold-in nearly 5.5 million units and won more than 20 “Sports Game of the Year” awards Family friendly game offered on multiple platforms including Xbox 360 (Kinect), Wii, DS, and iOS Internally owned and developed Franchise has sold-in nearly 8 million units Diverse Portfolio of Industry-Leading Franchises Key 2K Sports & 2K Play Franchises |
|
|
Targeted Growth Strategy Focused on Publishing Triple-A Titles 5 new franchises launched since 2007 Bioshock Borderlands Carnival Games L.A. Noire The Darkness 32 distinct multi-million unit selling titles 19 proprietary brands Platform agnostic Track record of producing the highest quality games |
|
|
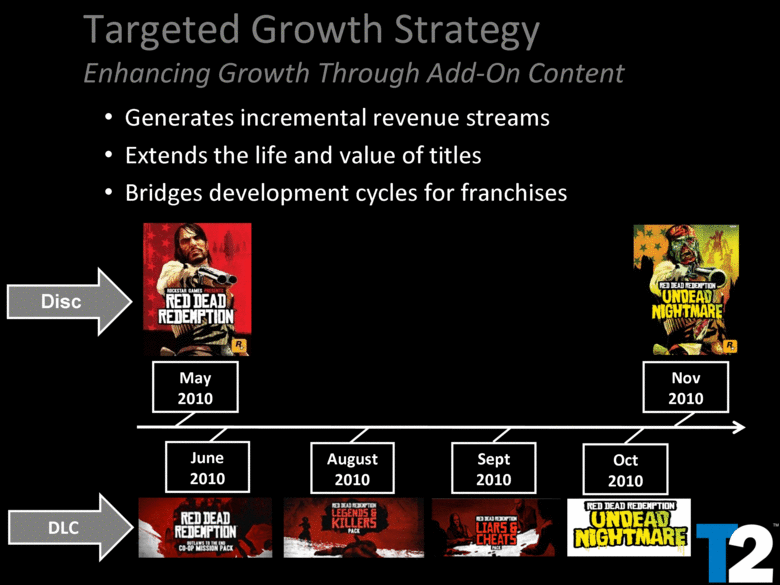
Disc DLC June 2010 Sept 2010 Nov 2010 August 2010 Oct 2010 Generates incremental revenue streams Extends the life and value of titles Bridges development cycles for franchises May 2010 Targeted Growth Strategy Enhancing Growth Through Add-On Content |
|
|
Targeted Growth Strategy Aggressively investing in Emerging Platforms Launched 1st social game – Sid Meier’s Civilization World, for FaceBook Released 9th offering for Apple’s iOS platform – Sid Meier’s Pirates! App for iPad Rated 88 on Metacritic and among top-10 paid iPad Apps Partnered with leading Asian companies to develop online games Tencent – online version of NBA 2K for China Nexon Corporation – online baseball game for South Korea XLGAMES – MMO game based on a top 2K Games franchise Strong pipeline of additional unannounced projects |
|
|
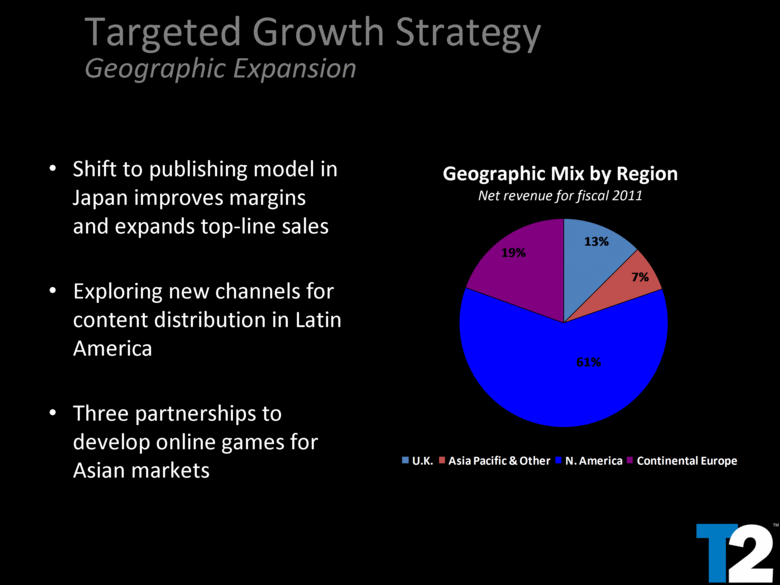
Geographic Mix by Region Net revenue for fiscal 2011 Shift to publishing model in Japan improves margins and expands top-line sales Exploring new channels for content distribution in Latin America Three partnerships to develop online games for Asian markets Targeted Growth Strategy Geographic Expansion 13% 7% 61% 19% U.K. Asia Pacific & Other N. America Continental Europe |
|
|
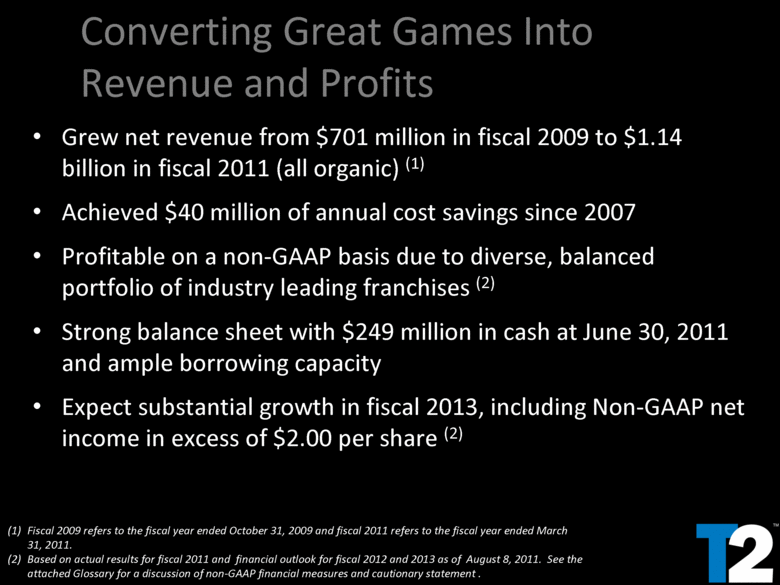
Grew net revenue from $701 million in fiscal 2009 to $1.14 billion in fiscal 2011 (all organic) (1) Achieved $40 million of annual cost savings since 2007 Profitable on a non-GAAP basis due to diverse, balanced portfolio of industry leading franchises (2) Strong balance sheet with $249 million in cash at June 30, 2011 and ample borrowing capacity Expect substantial growth in fiscal 2013, including Non-GAAP net income in excess of $2.00 per share (2) Converting Great Games Into Revenue and Profits Fiscal 2009 refers to the fiscal year ended October 31, 2009 and fiscal 2011 refers to the fiscal year ended March 31, 2011. Based on actual results for fiscal 2011 and financial outlook for fiscal 2012 and 2013 as of August 8, 2011. See the attached Glossary for a discussion of non-GAAP financial measures and cautionary statement . |
|
|
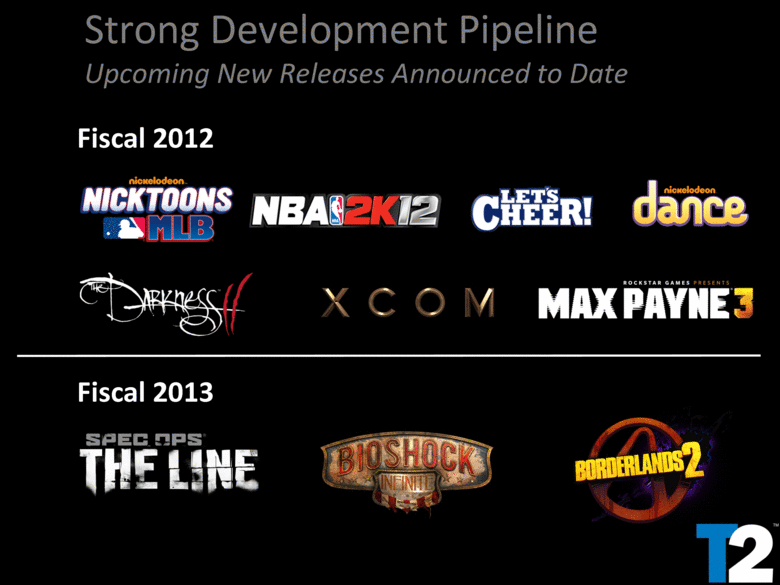
Strong Development Pipeline Upcoming New Releases Announced to Date Fiscal 2013 Fiscal 2012 |
|
|
Take-Two Positioned for Continued Success Global interactive entertainment company focused on publishing the highest quality triple-A titles World-class creative talent Diverse, balanced portfolio of industry-leading franchises Actively pursuing growth opportunities in digitally delivered content and online and mobile gaming Solid financial foundation Robust pipeline of titles in development |
|
|
Non-GAAP Financial Measures In addition to reporting financial results in accordance with U.S. generally accepted accounting principles (GAAP), the Company uses Non-GAAP measures of financial performance that exclude certain non-recurring or non-cash items. Non-GAAP gross profit, income (loss) and earnings (loss) per share are measures that exclude certain non-recurring or non-cash items and should be considered in addition to results prepared in accordance with GAAP. They are not intended to be considered in isolation from, as a substitute for, or superior to, GAAP results. These Non-GAAP financial measures may be different from similarly titled measures used by other companies. The Company believes that these Non-GAAP financial measures, when taken into consideration with the corresponding GAAP financial measures, are important in gaining an understanding of the Company’s ongoing business. These Non-GAAP financial measures also provide for comparative results from period to period. Therefore, the Company believes it is appropriate to exclude certain items as follows: Stock-based compensation – the Company does not consider stock-based compensation charges when evaluating business performance and management does not contemplate stock-based compensation expense in its short- and long-term operating plans. As a result, the Company has excluded such expenses from its Non-GAAP financial measures. Income (loss) from discontinued operations – the Company does not engage in sales of subsidiaries on a regular basis and therefore believes it is appropriate to exclude such gains (losses) from its Non-GAAP financial measures. As the company is no longer active in its discontinued operations, it believes it is appropriate to exclude income (losses) thereon from its Non-GAAP financial measures. Professional fees and expenses associated with unusual legal and other matters – the Company has incurred expenses for professional fees and has accrued for legal settlements that are outside its ordinary course of business. As a result, the Company has excluded such expenses from its Non-GAAP financial measures. Non-cash interest expense related to convertible debt – The Company records non-cash interest expense on its convertible notes in addition to the interest expense already recorded for coupon payments. The Company excludes the non-cash portion of the interest expense from its Non-GAAP financial measures because these amounts are unrelated to its ongoing business operations. Non-cash tax expense for the impact of deferred tax liabilities associated with tax deductible amortization of goodwill – due to the nature of the adjustment as well as the expectation that it will not have any cash impact in the foreseeable future, the Company believes it is appropriate to exclude this expense from its Non-GAAP financial measures. Glossary © Take-Two Interactive Software, Inc., 2011. All trademarks are property of their respective owners. |

