Attached files
| file | filename |
|---|---|
| 8-K - FORM 8-K - CNO Financial Group, Inc. | form8k.htm |

CNO Financial Group: An Overview
September 13, 2011
September 13, 2011
Exhibit 99.1
CNO Financial Group
2

CNO Financial Group
3
Non-GAAP Measures
This presentation contains the following financial measures that differ from the
comparable measures under Generally Accepted Accounting Principles (GAAP):
operating earnings measures; earnings before net realized investment gains (losses) and
corporate interest and taxes; and debt to capital ratios, excluding accumulated other
comprehensive income (loss). Reconciliations between those non-GAAP measures and
the comparable GAAP measures are included in the Appendix.
While management believes these measures are useful to enhance understanding and
comparability of our financial results, these non-GAAP measures should not be
considered substitutes for the most directly comparable GAAP measures.
comparability of our financial results, these non-GAAP measures should not be
considered substitutes for the most directly comparable GAAP measures.
Additional information concerning non-GAAP measures is included in our periodic filings
with the Securities and Exchange Commission that are available in the “Investors - SEC
Filings” section of CNO’s website, www.CNOinc.com.
with the Securities and Exchange Commission that are available in the “Investors - SEC
Filings” section of CNO’s website, www.CNOinc.com.

CNO Financial Group
4
The Company: CNO Financial Group
§ Focused on serving the protection needs of the fast-growing but
underserved middle income and senior markets
underserved middle income and senior markets
§ Products include supplemental health, Medicare supplement, life,
annuity and long-term care
annuity and long-term care
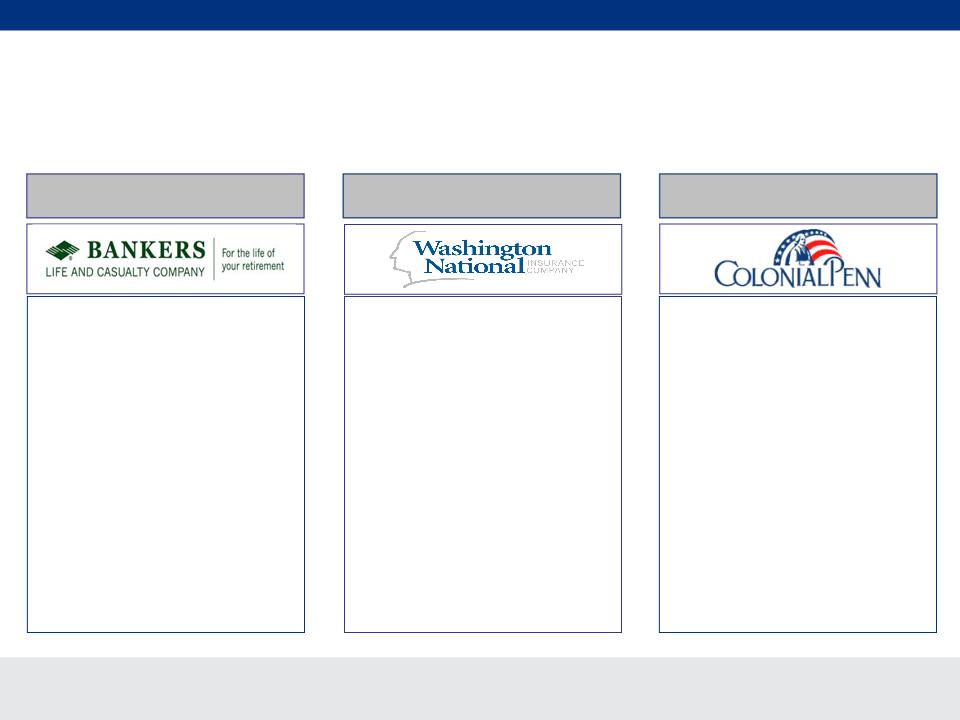
§ Products sold through efficient, growing distribution channels:
– Bankers Life: strong career agent franchise
– Washington National: wholly-owned distributor (PMA) and independent
agents
agents
– Colonial Penn: direct distribution platform
§ Centralized services operation to add value to all units
§ Over 3.9 million policies in force

CNO Financial Group
5
Value Through Growth and Execution
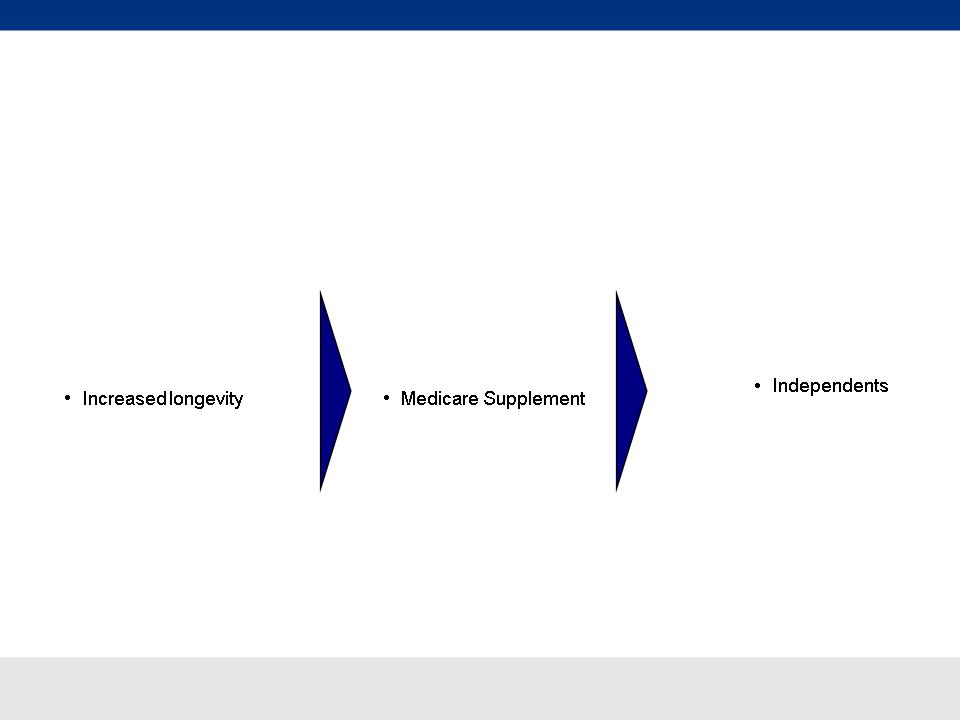
The Opportunity: Rapidly Growing, Underserved Market
§ Our focus is meeting the needs of fast-growing senior market
§ Attractive demographics: Baby Boomers reaching retirement age
– The first of Boomer population becoming Medicare-eligible this year
– In twenty years, percentage of population 65 years old and older is
projected to increase by 50%
projected to increase by 50%
– Financial downturn underscored importance of risk management and
guaranteed products
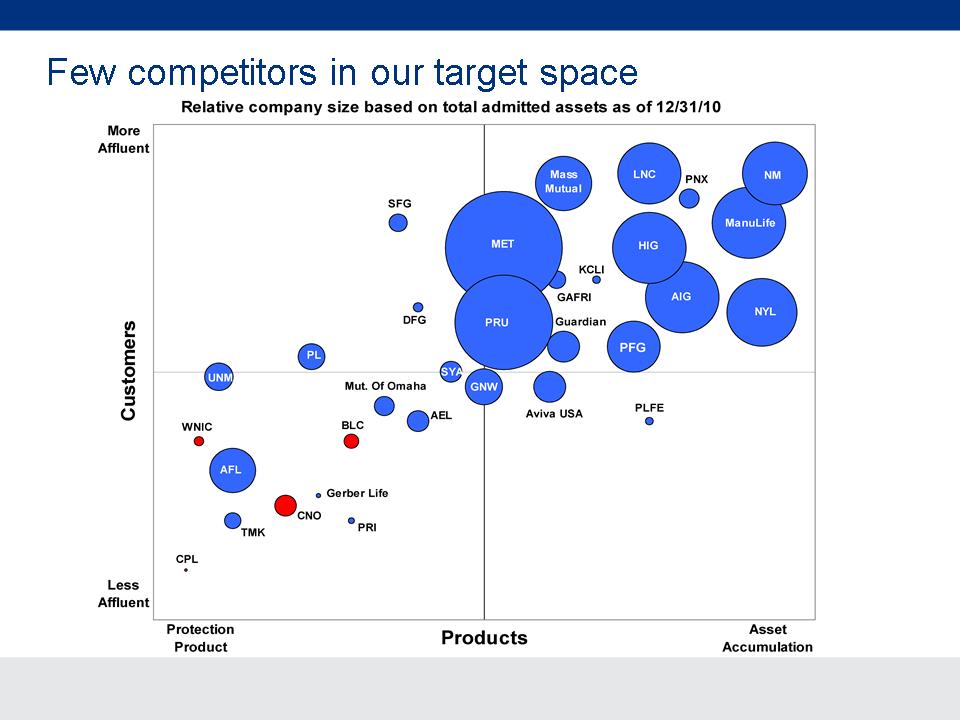
guaranteed products
The senior middle income market is attractive; we know it well, pursue it
full time, and we represent a pure play in this market
full time, and we represent a pure play in this market
CNO Financial Group
6
Broad Distribution Reach
• Focused on middle-income
working Americans in Worksite
and Individual markets with
supplemental health and life
insurance products
working Americans in Worksite
and Individual markets with
supplemental health and life
insurance products
• Serving approximately 1 million
policyholders and over 20,000
groups; e.g. small business,
education, government, and
healthcare
policyholders and over 20,000
groups; e.g. small business,
education, government, and
healthcare
• Distribution through over 2,000
independent agents in 2 sales
channels; PMA (a wholly-owned
distributor) and WNIC
Independent.
independent agents in 2 sales
channels; PMA (a wholly-owned
distributor) and WNIC
Independent.
• Focused on lower middle-income
retirees with simple, low-cost life
insurance products
retirees with simple, low-cost life
insurance products
• Direct response model with media
and mail-based lead generation
with robust telemarketing support
and mail-based lead generation
with robust telemarketing support
Career
Direct
PMA/Independent
• Focused on middle-income senior
market with Medicare supplement,
life, annuity, LTC, Medicare Part D
and Medicare Advantage products
market with Medicare supplement,
life, annuity, LTC, Medicare Part D
and Medicare Advantage products
• “Kitchen-table” sales model
through over 5,000 career agents
and sales managers; grown
producers by 28% since 2004
through over 5,000 career agents
and sales managers; grown
producers by 28% since 2004
• 240+ locations nationwide
CNO Financial Group
7
• Fixed and Fixed-Index
Life and Annuity
Products
Life and Annuity
Products
• Long-Term Care
• Whole and Universal
life products
life products
• Final expense
• Supplemental Health
CNO can access
consumers across
multiple channels
consumers across
multiple channels
• With an Agent (Retail)
• Bankers
• Washington National
• PMA (CNO-owned)
• Without an Agent (Direct)
• Colonial Penn
• At Work (Worksite Marketing)
• PMA Worksite Division
• Washington National -
Independents
Independents
• Rising medical costs
• Decline of societal safety
nets (government and
employer)
nets (government and
employer)
• Greater awareness of need
for retirement planning
for retirement planning
CNO has expertise
across important middle
-market products
across important middle
-market products
Strong trends are driving
middle-market consumers
middle-market consumers
CNO: The right products and the right channels for
today’s middle-market consumer
today’s middle-market consumer
CNO Financial Group
8
CNO Financial Group
9
Q4 2008
Separation
of Closed
Block LTC
business
of Closed
Block LTC
business
Q4 2006
VNB
introduced
VNB
introduced
2007/2008
CIG sales &
marketing
rightsizing -
$6 million
annual
expense
reduction
marketing
rightsizing -
$6 million
annual
expense
reduction
2008
Excess Chicago
space vacated -
$5 million
annual expense
save
space vacated -
$5 million
annual expense
save
Q4 2007
Recapture of
Colonial Penn
Life Block
Colonial Penn
Life Block
Q3 2007
Sale of $3
billion
annuity block
billion
annuity block
Q3 2007
Completed
consolidation
of shared
services in
Carmel, Sale of
excess space in
Carmel
consolidation
of shared
services in
Carmel, Sale of
excess space in
Carmel
Q1 2009
Renegotiated
credit facility
to loosen
covenants
credit facility
to loosen
covenants
Q1 2007
Expanded
Annual
Incentive Plan
participation;
increased
weight on
shareholder
value
Annual
Incentive Plan
participation;
increased
weight on
shareholder
value
Q3 2009
Reinsurance
of CIG Life
policies to
Wilton Re
of CIG Life
policies to
Wilton Re
Q4 2010
Refinanced
$650 million
of debt
$650 million
of debt
Q4 2009
Reinsurance of
Bankers Life
policies to
Wilton Re
Bankers Life
policies to
Wilton Re
Q4 2009
Refinanced
convertible
debentures
putable in Sept
2010; issued
new equity;
paid down Sr.
Credit Facility
convertible
debentures
putable in Sept
2010; issued
new equity;
paid down Sr.
Credit Facility
Q4 2009
Renegotiated
Senior Credit
Facility to
loosen
covenants
Senior Credit
Facility to
loosen
covenants
Q4 2009
Achieved RBC
in excess of
300%
in excess of
300%
Q1 2011
Pre-paid $50
million on
Senior Credit
Facility
million on
Senior Credit
Facility
Q2 2011
Amended Senior
Credit Facility to
allow for more
flexibility &
reduced rate
125bps
Credit Facility to
allow for more
flexibility &
reduced rate
125bps
Q2 2011
Began buying
back stock
under $100
million share
repurchase
plan, and made
commensurate
prepayment of
$16.2 million
on the Senior
Credit Facility
back stock
under $100
million share
repurchase
plan, and made
commensurate
prepayment of
$16.2 million
on the Senior
Credit Facility
CNO - Timeline of Management Actions

CNO Financial Group
10
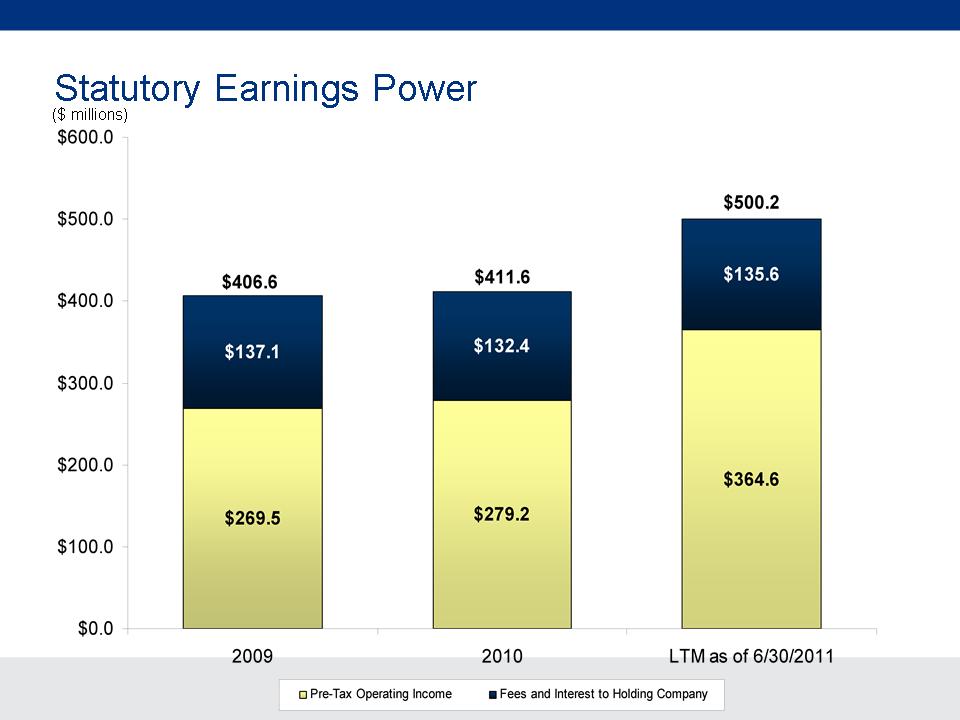
Results Demonstrate CNO’s potential
* Risk-Based Capital (“RBC”) requirements provide a tool for insurance regulators to determine the levels of statutory capital and surplus an insurer must maintain in relation to its insurance and
investment risks. The RBC ratio is the ratio of the statutory consolidated adjusted capital of our insurance subsidiaries to RBC.
investment risks. The RBC ratio is the ratio of the statutory consolidated adjusted capital of our insurance subsidiaries to RBC.
** As defined in our Senior Secured Credit Agreement. See appendix for reconciliation to GAAP measure.
*** Refer to appendix for more information regarding this non-GAAP measure
§ 2Q2011 marks tenth consecutive quarter of GAAP net income
§ Statutory Operating Earnings (net of tax):
– $180.1 million for the first half of 2011
– Up 111% over 1H2010
§ Financial strength as of 6/30/2011:
– Consolidated RBC* at 351%
– Liquidity at the holding company of $234 million
– Debt to total capitalization** at 18.7%
§ Continued focus on profitable growth
– 2010 EBIT*** up 7% over 2009
– 1H2011 EBIT up 24% over 1H2010
§ Results recognized with credit rating upgrades from four rating agencies
CNO Financial Group
11
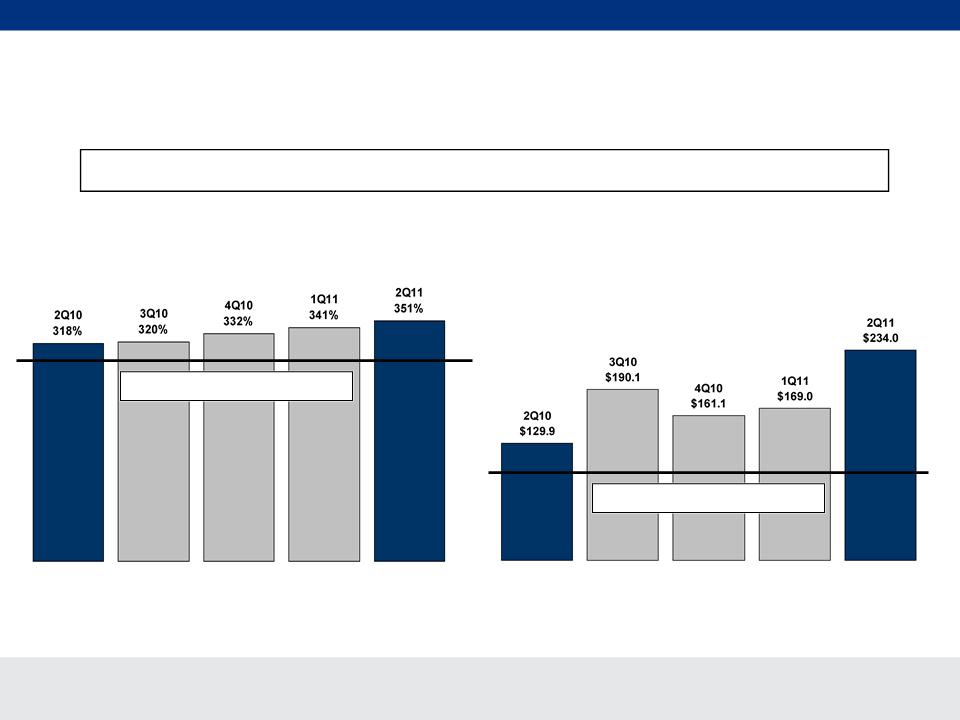
Excess Capital
Consolidated RBC Ratio
Liquidity
($ millions)
Approximately $241 million in excess
of management target
of management target
$134 million in excess of
management target
management target
Management Target = 300%
Management Target = $100
Approximately $375 million total excess capital as of 6/30/11
CNO Financial Group
12

CNO Financial Group
13
Excess Capital Utilization Opportunities
§ Debt Prepayment
§ Share Buybacks
§ Investing in Business for Additional Growth
– Growth and expansion of distribution channels
– New COO role to leverage organic growth opportunities
– Recapture reinsurance blocks
§ Build Holding Company Investment Portfolio
– Utilize non-life operating loss carryforward

CNO Financial Group
14
Share Repurchase & Debt Prepayment
§ 2Q Activity
– Purchased 2.2 million shares during 2Q 2011 for $16.2 million
– Average cost per share of $7.35
– 0.9% of outstanding shares at March 31, 2011
– Principal prepayment of $16.2 million made on Senior Secured Credit Facility on June 30, 2011
• Payment reduced scheduled principal amount due on September 30, 2016
– Resulted in a 0.2% decrease in debt to total capital as defined in our Senior Secured Credit
Agreement
Agreement
§ 3Q Activity
– Through August 26, 2011, purchased 3.7 million shares for $22.9 million
– Average cost per share of $6.22
– 1.5% of outstanding shares at June 30,2011
– Proforma debt to total capital as (defined in our Senior Secured Credit Agreement) at June 30,
2011 would reduce to 18.5% from 18.7%
2011 would reduce to 18.5% from 18.7%
– A principal prepayment will be made at the end of the third quarter of the same amount as the
share repurchases in the quarter
share repurchases in the quarter
Next scheduled principal payment under the facility of $10 million is not due until September 30, 2012
CNO Financial Group
15
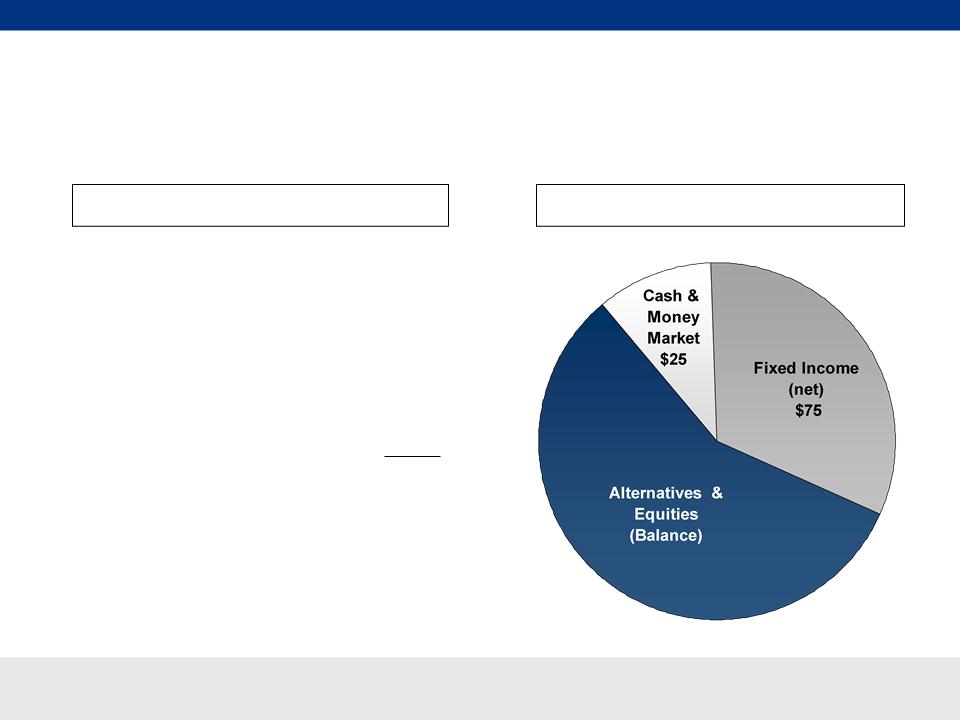
Holding Company Investments at 6/30/11
($ millions)
|
Cash and Money Market
|
$130.9
|
|
Fixed Income (net)
|
17.6
|
|
Equities
|
12.9
|
|
Alternatives*
|
72.6
|
|
TOTAL
|
$234.0
|
Target Allocation
Current Investments
* Includes $25 Paulson investment made 7/1/2011; excluded
from cash and money market
from cash and money market

CNO Financial Group
16
GAAP Balances for Deferred Tax Asset as of 6/30/11:
Loss Carryforwards - Gross1 vs. Net2
Loss Carryforwards - Gross1 vs. Net2
($ millions)
1. Gross loss carryforward equals the total life (including state operating loss carryforwards), non-life, and capital loss carryforwards multiplied by a 35% tax rate
2. Net loss carryforward equals the gross loss carryforward net of the allowance
Totals
Gross Loss Carryforwards
Net Loss Carryforwards
Valuation Allowance
Valuation Allowance Analysis:
• June 30, 2011 - Considers the
cumulative losses we have incurred
over the last 3 years
cumulative losses we have incurred
over the last 3 years
• September 30, 2011 - We expect to
no longer be in a 3 year cumulative
loss position
no longer be in a 3 year cumulative
loss position
CNO Financial Group
17
CNO Financial Group
18
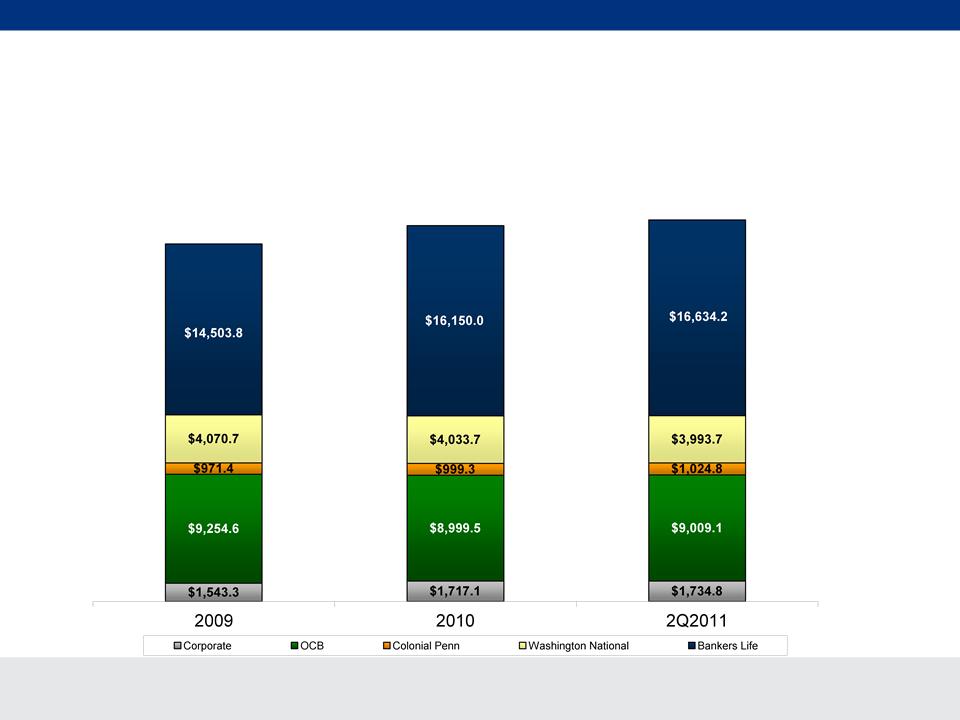
Growth in Business
($ millions)
$30,343.8
$31,899.6
$32,396.6
Total assets continue to grow with a CAGR of 4.5% since 12/31/2009

CNO Financial Group
19
Summary
§ Core business continues to perform well
– Solid, stable, growing earnings
– Key measures of financial strength continue to improve
§ CEO transition and new COO role
§ Capital generation creates unique opportunities
– Generating significant amounts of excess capital
– Moving more excess capital to holding company to generate more non-life
income and utilize operating loss carryforwards
income and utilize operating loss carryforwards
– Repurchased 5.9 million shares as of August 26, 2011 for an aggregate
purchase price of $39.1 million
purchase price of $39.1 million
• Made related debt prepayment of $16.2 million at the end of 2Q and will be
making a prepayment for the 3Q activity on September 30, 2011
making a prepayment for the 3Q activity on September 30, 2011
§ Continue emphasis on profitable organic growth
– 2011 first year baby boomers begin turning 65
– Adding 15 new locations for Bankers Life in 2011
– Created COO role to focus on growth initiatives

Questions and Answers

Appendix
Certain Non-GAAP Financial Measures
Certain Non-GAAP Financial Measures

CNO Financial Group
22
The following provides additional information regarding certain non-GAAP measures used in this
presentation. A non-GAAP measure is a numerical measure of a company’s performance, financial
position, or cash flows that excludes or includes amounts that are normally excluded or included in the
most directly comparable measure calculated and presented in accordance with GAAP. While
management believes these measures are useful to enhance understanding and comparability of our
financial results, these non-GAAP measures should not be considered as substitutes for the most
directly comparable GAAP measures. Additional information concerning non-GAAP measures is
included in our periodic filings with the Securities and Exchange Commission that are available in the
“Investor - SEC Filings” section of our website, www.CNOinc.com.
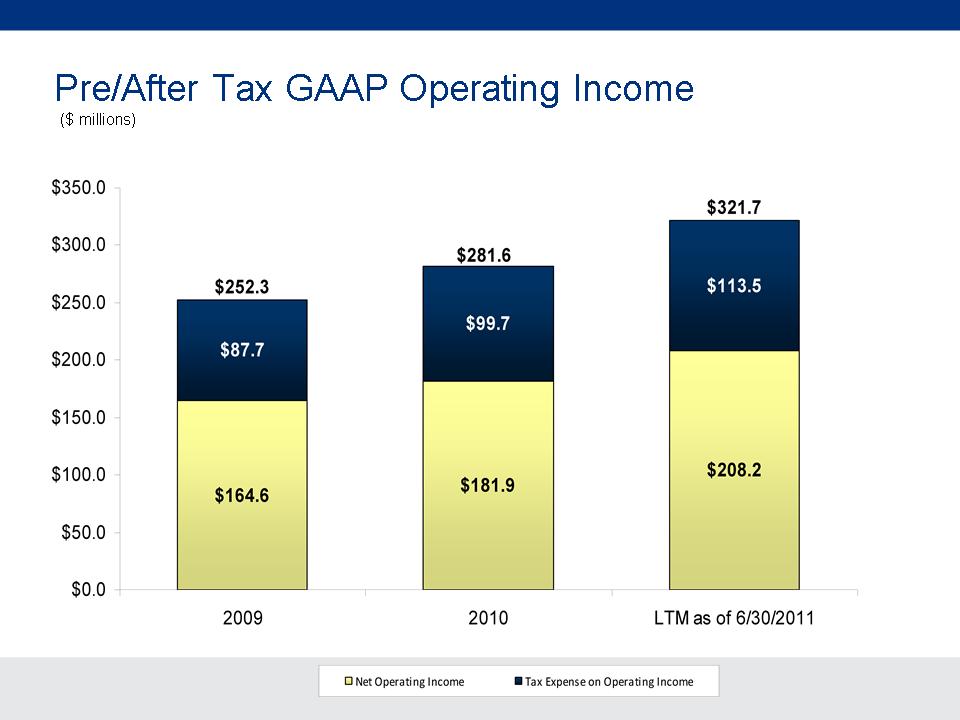
Operating earnings measures
Management believes that an analysis of net income applicable to common stock before discontinued
operations, loss on extinguishment or modification of debt, net realized gains or losses and increases
to our valuation allowance for deferred tax assets (“net operating income,” a non-GAAP financial
measure) is important to evaluate the performance of the Company and is a key measure commonly
used in the life insurance industry. Management uses this measure to evaluate performance because
discontinued operations, loss on extinguishment or modification of debt, realized investment gains or
losses and increases to our valuation allowance for deferred tax assets are unrelated to the Company’s
continuing operations.
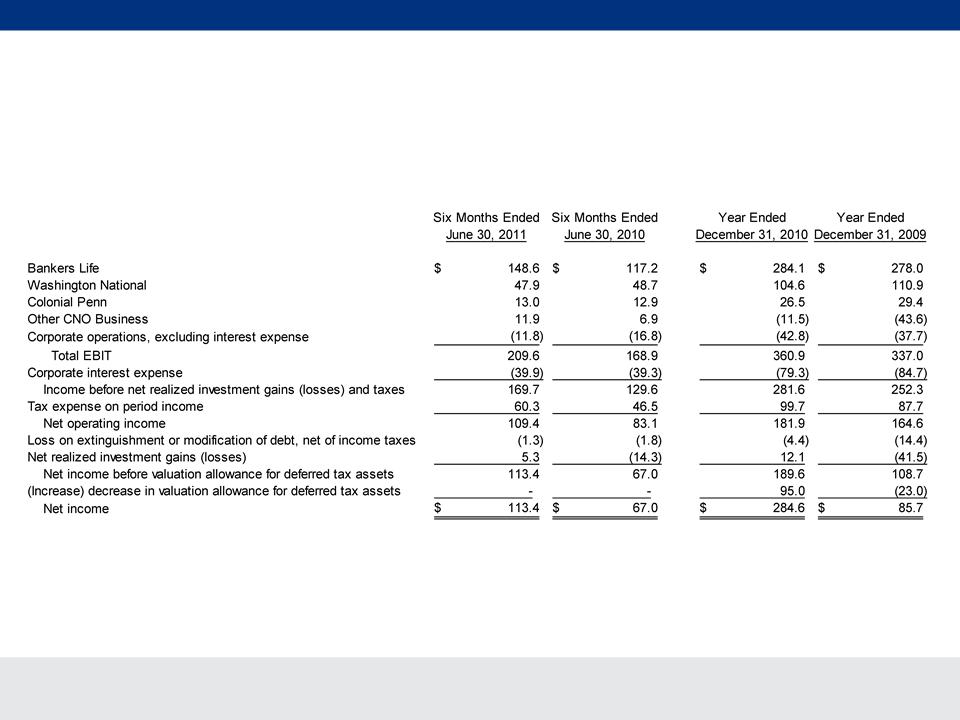
Information Related to Certain Non-GAAP Financial Measures
CNO Financial Group
23
Information Related to Certain Non-GAAP Financial Measures
A reconciliation of earnings before net realized investment gains (losses), corporate interest, loss on
extinguishment or modification of debt and taxes (“EBIT”) to net income is as follows (dollars in
millions):
extinguishment or modification of debt and taxes (“EBIT”) to net income is as follows (dollars in
millions):
CNO Financial Group
24
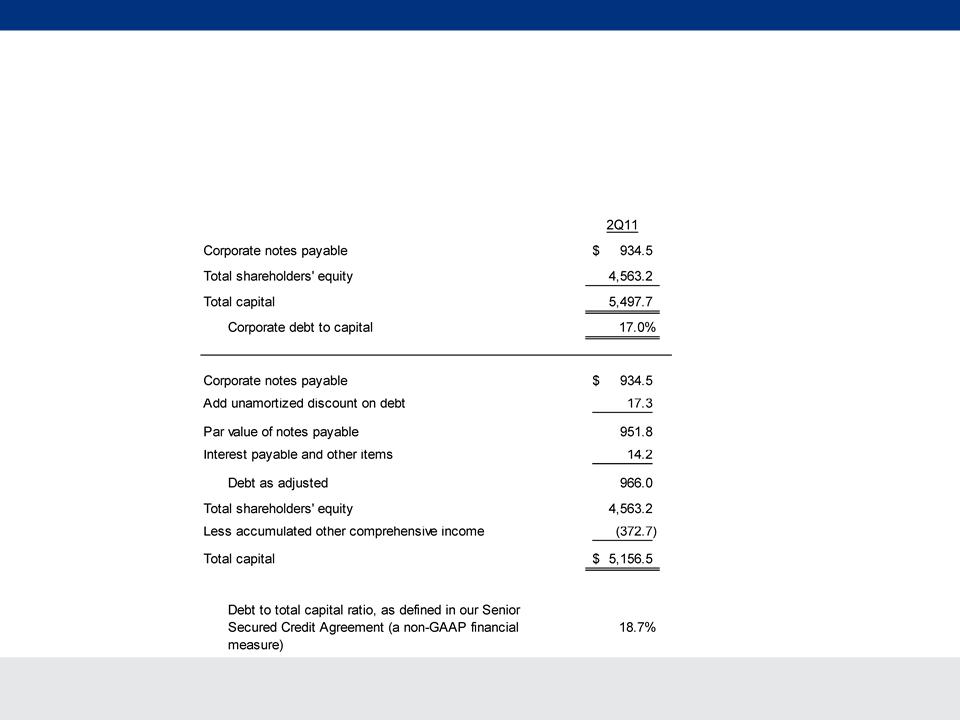
Information Related to Certain Non-GAAP Financial Measures
A reconciliation of the debt to capital ratio to debt to capital, as defined in our Senior Secured Agreement is as follows (dollars in millions)
Debt to capital ratio, excluding accumulated other comprehensive income (loss)
This non-GAAP financial measure differs from the debt to capital ratio because accumulated other comprehensive (income) loss has been
excluded from the value of capital used to determine this measure. In addition, debt is defined as par value plus accrued interest and certain
other items. Management believes this non-GAAP financial measure is useful as the level of such ratio impacts certain provisions in our Senior
Secured Credit Agreement.