Attached files
| file | filename |
|---|---|
| 8-K - FORM 8-K - STRATEGIC HOTELS & RESORTS, INC | d8k.htm |
 Investor Presentation
September 2011
Exhibit 99.1 |
 2
I.
Company Overview
II.
Industry Update
III.
Operating Trends
IV.
Financial Overview
Agenda |
 3
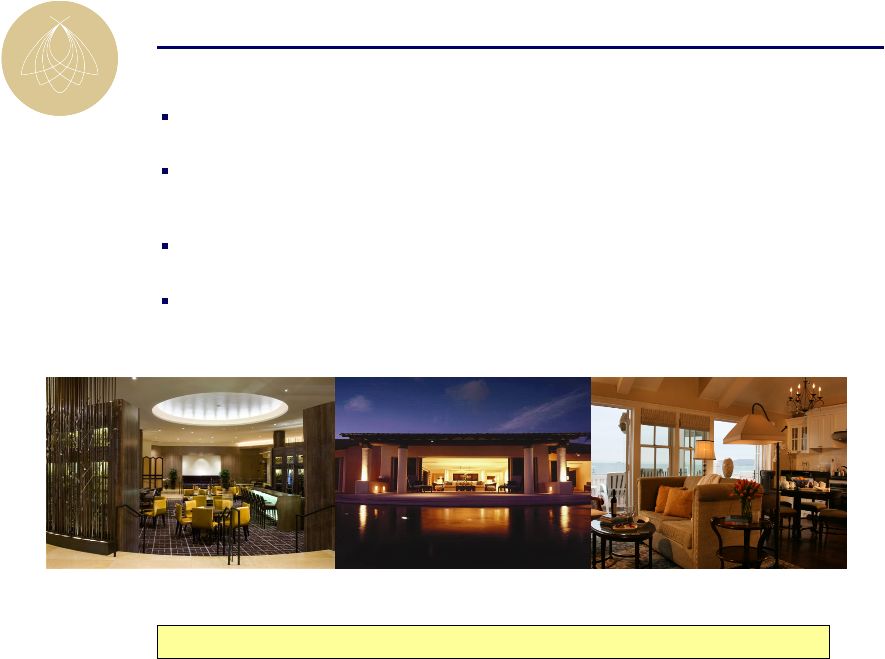
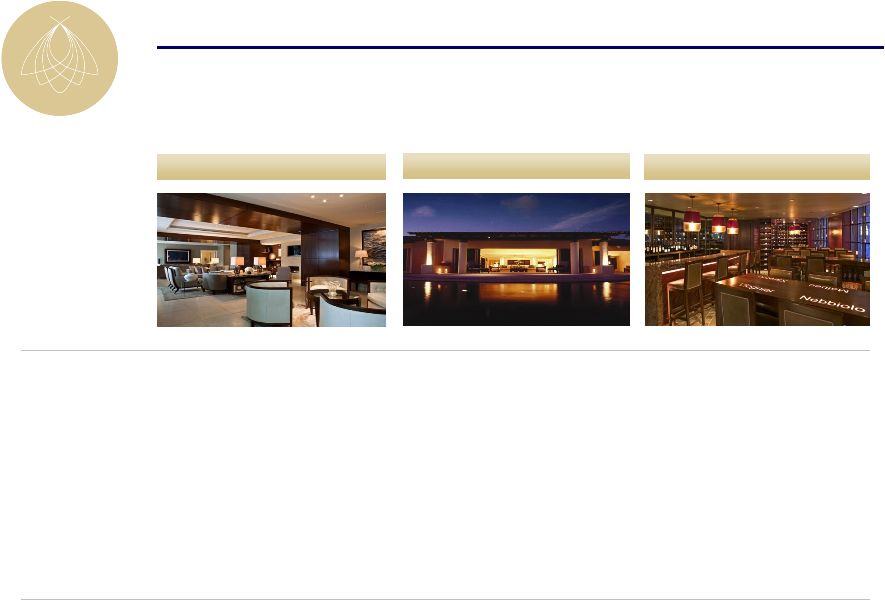
World-class luxury hotels supported by unique real-estate value
Luxury segment has historically outperformed the overall industry in a
recovery
Industry leading asset management capabilities
Management team and board members with significant hospitality
industry experience
Strategic Hotels Overview
Fairmont Chicago
Lobby and ENO Wine Bar
Four Seasons Punta Mita
Coral Suite
Hotel del Coronado
Beach Village
Highest quality hotel portfolio in the public markets |
 4
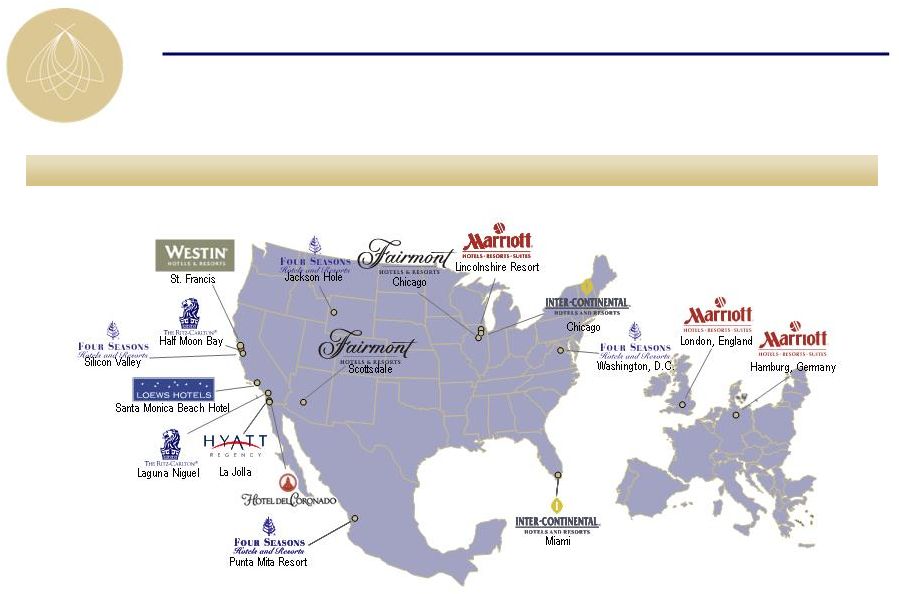
17 hotels and resorts with 7,762 rooms
World-Class Hotels in High Barrier to Entry Markets
|
 5
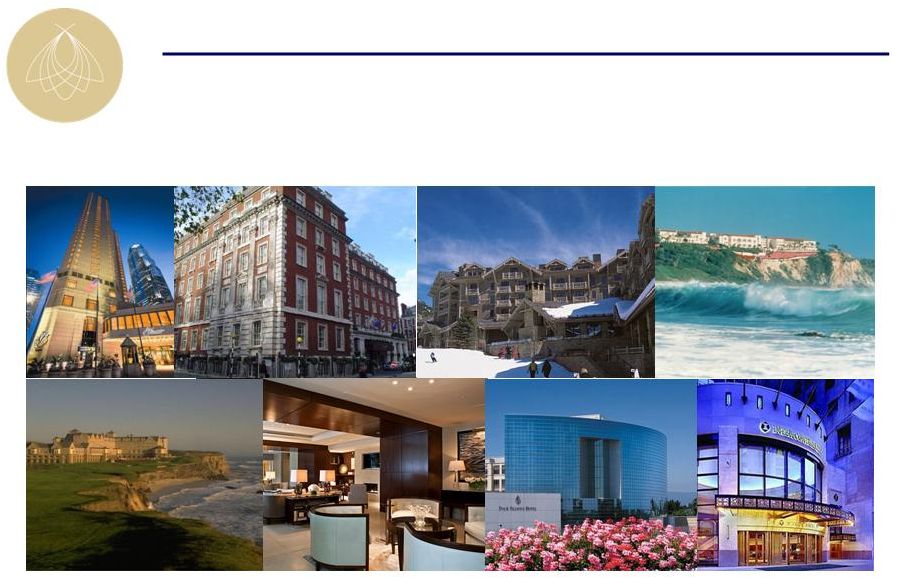
Unique and Irreplaceable Hotel Portfolio
Fairmont Chicago
Marriott Grosvenor Square
Four Seasons Jackson Hole
Ritz-Carlton Laguna Niguel
Ritz-Carlton Half Moon Bay
Four Seasons Washington, D.C.
Four Seasons Silicon Valley
InterContinental Chicago |
 6
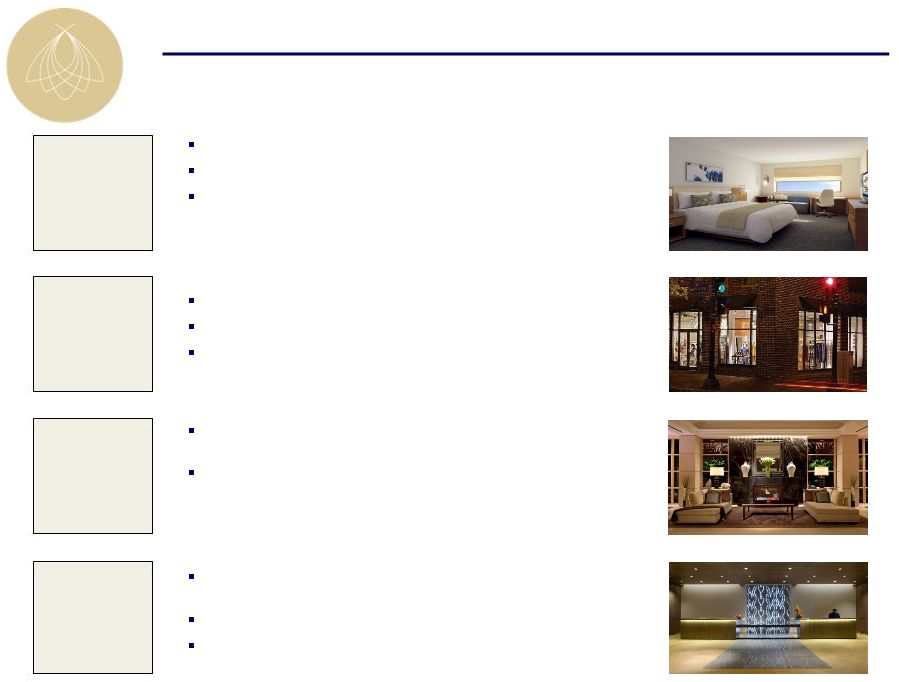
Revenue enhancement through market research based programs
Exceptional asset management supported by internally developed operating
systems
Aggressive and early cost cutting initiatives implemented in advance of the
downturn
Proactively maintaining fixed cost reduction at hotels during recovery phase
Rigorous oversight of brand managers to ensure alignment of interests
Evaluation and implementation of value add ROI projects
Industry Leading Asset Management Capabilities |
 7
Notable 2008
capital
projects
Notable 2009
capital
projects
InterContinental Miami –
Room and lobby renovation
InterContinental Chicago –
Michael Jordan Steak House addition
Four Seasons Washington, D.C. –
ENO wine tasting room
Four Seasons Washington, D.C –
Retail outlet renovation
Marriott Lincolnshire –
Lobby renovation
Westin St. Francis –
Michael Mina Steakhouse conversion
Four Seasons Washington, D.C. –
Lobby renovation, 11-room
expansion, new restaurant, 63-room and suite renovation
Westin St. Francis –
Clock Bar
Fairmont Chicago –
ENO wine tasting room, lobby renovation,
guestroom renovation, new spa and fitness center
Four Seasons Punta Mita –
New lobby bar
Ritz-Carlton Half Moon Bay –
ENO wine tasting room,
restaurant and lounge renovation, suite renovation
Notable 2010
capital
projects
2011 Planned
Projects
Fairmont Chicago Lobby
Four Seasons Washington, D.C.
Lobby
Four Seasons Washington, D.C.
Retail
InterContinental Miami Guestroom
Portfolio Well-Positioned To Enhance Cash Flow Growth
|
 8
Four Seasons Washington, D.C.
Four Seasons Punta Mita
InterContinental Chicago
Value Enhancement Projects
11.5%
8.5%
15.0%
2010 EBITDA
Description:
Bourbon Steakhouse and 11-
room expansion
Two, 5-bedroom suite expansion,
23-room expansion with river pool
ENO wine room
Year of project:
2008-2009
2006-2007
2006
Investment
($mm):
$22.1
$19.7
$1.7
yield (%): |
 9
I.
Company Overview
II.
Industry Update
Agenda |
 10
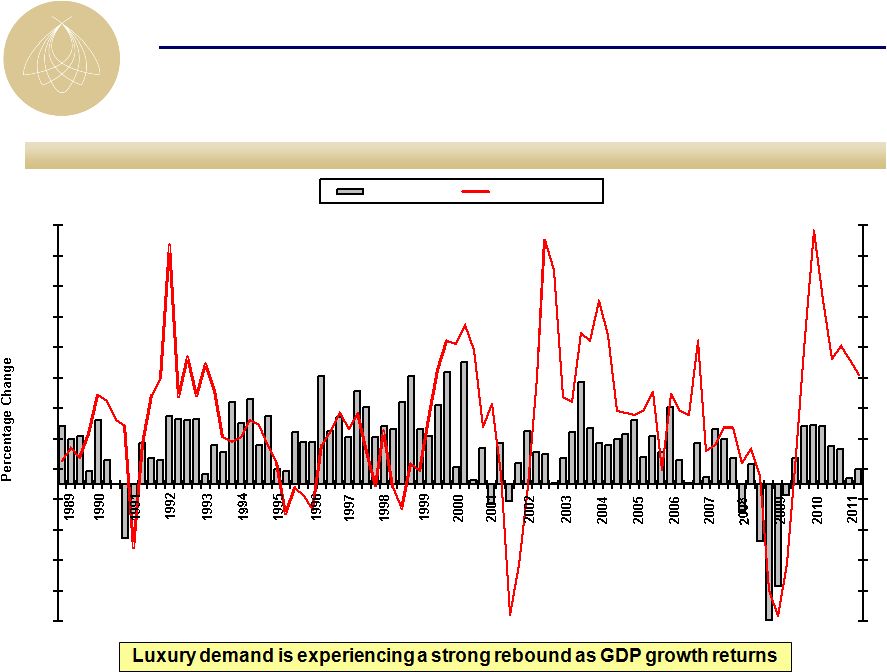
U.S. luxury demand vs. GDP growth
U.S. Luxury Demand Correlated with GDP
Quarterly percentage change to prior year
-9.0
-7.0
-5.0
-3.0
-1.0
1.0
3.0
5.0
7.0
9.0
11.0
13.0
15.0
17.0
-9.0
-7.0
-5.0
-3.0
-1.0
1.0
3.0
5.0
7.0
9.0
11.0
13.0
15.0
17.0
GDP % Change
Demand % Change |
 11
Source: Smith Travel Research
Note: Data represents trends within the United States
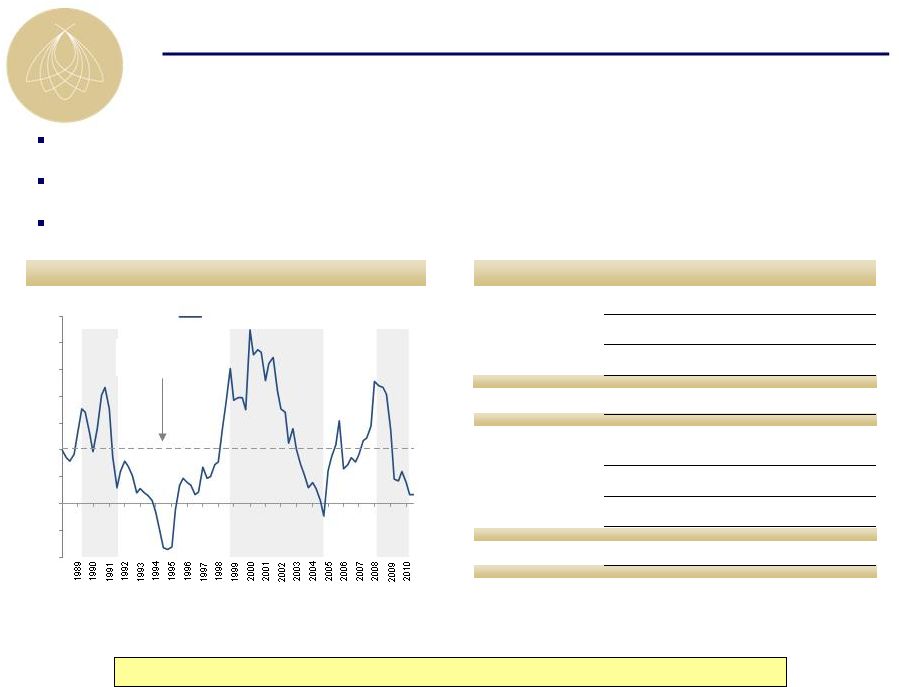
Project pipeline forecast as of 6/30/11
Supply growth was lower leading into this downturn than past downturns and remains
minimal Projects in planning and under construction have decreased
significantly Less than 1% new luxury supply projected in SHR markets
Quarterly luxury supply YoY % change
1988 –
Q2 2011
Average: 4.1%
Favorable Supply Outlook
Minimal supply growth in BEE markets
Rooms in
construction
2010
2011
% of 2011
supply
% change
Luxury
2,382
820
0.7%
(65.6%)
Upper-Upscale
6,475
9,146
1.7%
41.3%
Luxury & Upper-Upscale
8,857
9,966
1.5%
12.5%
Other
55,950
40,243
1.0%
(28.1%)
Total
73,664
60,175
1.2%
(22.5%)
Total active
pipeline
2010
2011
% of 2011
supply
% change
Luxury
5,775
4,117
3.3%
(28.7%)
Upper-Upscale
20,821
22,497
4.1%
8.0%
Luxury & Upper-Upscale
26,596
26,614
3.9%
0.1%
Other
332,143
291,327
6.9%
(12.3%)
Total
385,335
344,555
7.1%
(10.6%)
(4%)
(2%)
0%
2%
4%
6%
8%
10%
12%
14%
YoY % supply growth |
 12
Source: Smith Travel Research
Note: Data represents trends within the United States
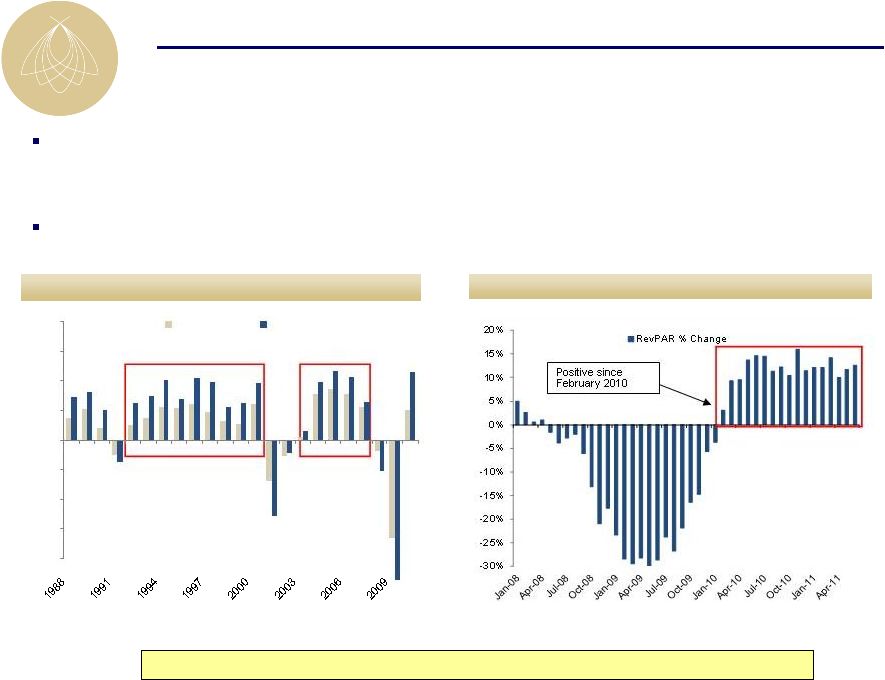
Annual % change in RevPAR
Monthly YoY % change in luxury RevPAR
Luxury
hotels
have
experienced
prolonged
RevPAR
growth
following
past
industry
downturns
–
1991: 9 consecutive years of annual luxury RevPAR growth totaling 100% or 8%
annually –
2001/2002: 5 consecutive years of annual luxury RevPAR growth totaling 47% or 8%
annually After 21 months of negative RevPAR growth, luxury RevPAR has
exhibited significant growth since February 2010
Luxury Hotels Outperform in a Recovery
Luxury RevPAR growth has remained positive since February 2010
-20%
-15%
-10%
-5%
0%
5%
10%
15%
20%
Total U.S.
Luxury |
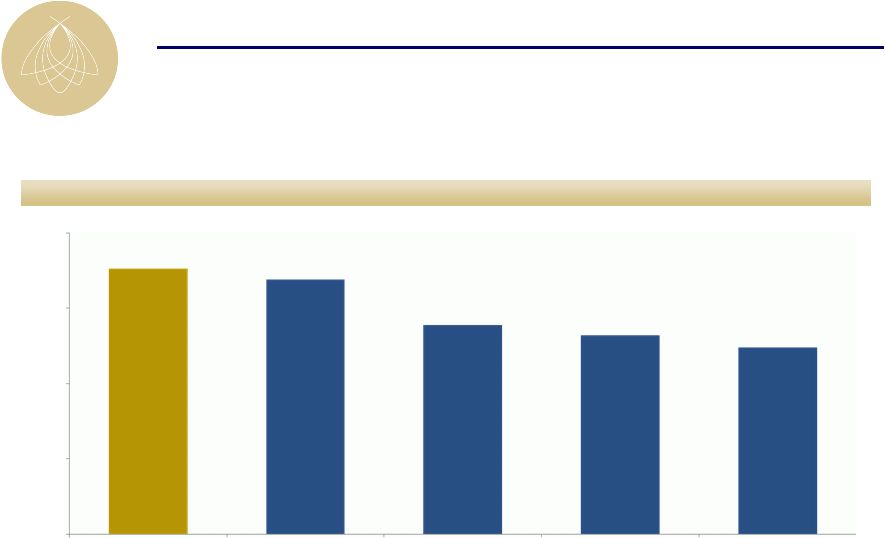 13
Second Quarter 2011 RevPAR
Source: Company filings as of 6/30/11
1
North American Same Store portfolio
#1 in RevPAR in the Public Lodging Sector
$0
$50
$100
$150
$200
BEE¹
LHO
HST
SHO
DRH |
 14
I.
Company Overview
II.
Industry Update
III.
Operating Trends
Agenda |
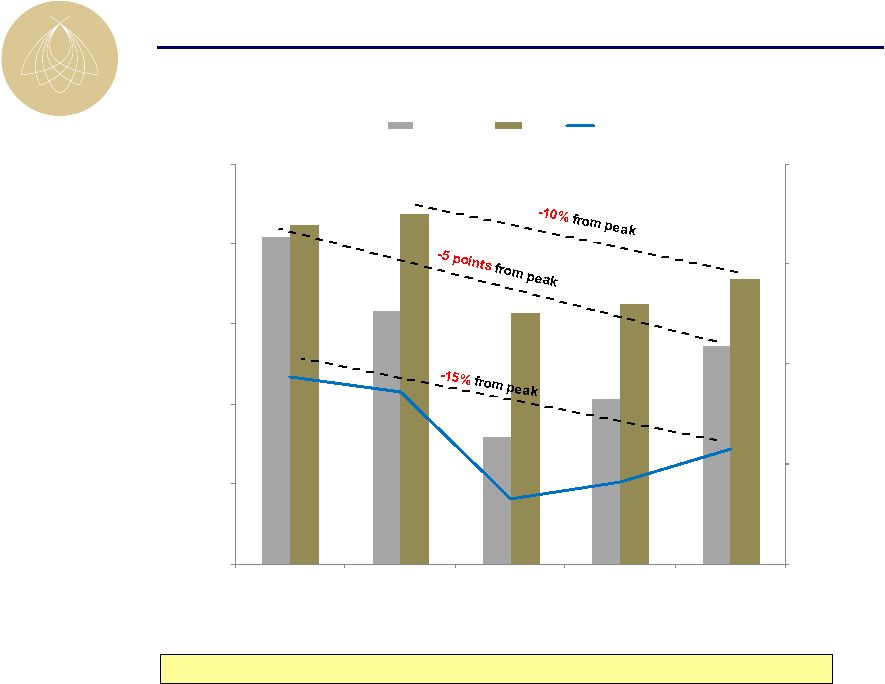 15
Historical Comparison
Operating performance improving; still significantly below peak
(Same Store North American Portfolio)
Portfolio excludes: Hotel del Coronado, Fairmont Scottsdale Princess, Four Seasons
Jackson Hole, Four Seasons Silicon Valley $120
$160
$200
$240
$280
60.0%
64.0%
68.0%
72.0%
76.0%
80.0%
2007
2008
2009
2010
2011F
ADR / RevPAR
Occupancy
Occupancy
ADR
RevPAR |
 16
(EBITDA in millions)
(a)
Excludes Fairmont Scottsdale Princess, Four Seasons Jackson Hole, Four Seasons
Silicon Valley, and Hotel del Coronado Operations
Corporate Results
Strong Second Quarter Results
Comparable EBITDA
$37.7
12.9%
$42.5
Comparable FFO /share
$0.04
25.0%
$0.05
(Same Store U.S. Portfolio)
(a)
Q2
2010
Q2
2011
ADR
$215
6.5%
$229
RevPAR
$154
12.6%
$173
Total RevPAR
EBITDA Margins
$290
20.9%
11.5%
390bps
$323
24.8% |
 17
I.
Company Overview
II.
Industry Update
III.
Operating Trends
IV.
Financial Overview
Agenda |
 18
2011 Guidance
(EBITDA in millions)
(b)
2010 results exclude $4.9 mm of real estate tax refunds and no adjustments for
cancellation fees (c)
2010 excludes $12.6 mm of VCP expense; 2011 VCP expense excluded
Operations
(a)
Corporate Results
(c)
EBITDA
$132.0
10%-17%
$145.0-$155.0
FFO / share
$0.05
60%-180%
$0.08-$0.14
(a)
Portfolio excludes Fairmont Scottsdale Princess, Four Seasons Jackson Hole, Four
Seasons Silicon Valley, and Hotel del Coronado 2010
2011
Guidance
RevPAR
$153
8%-9.5%
$165-$167
Total RevPAR
$286
8%-9%
$309-$312
EBITDA
Margins
(b)
19.0%
200 -
300 bps
21%-22% |
 19
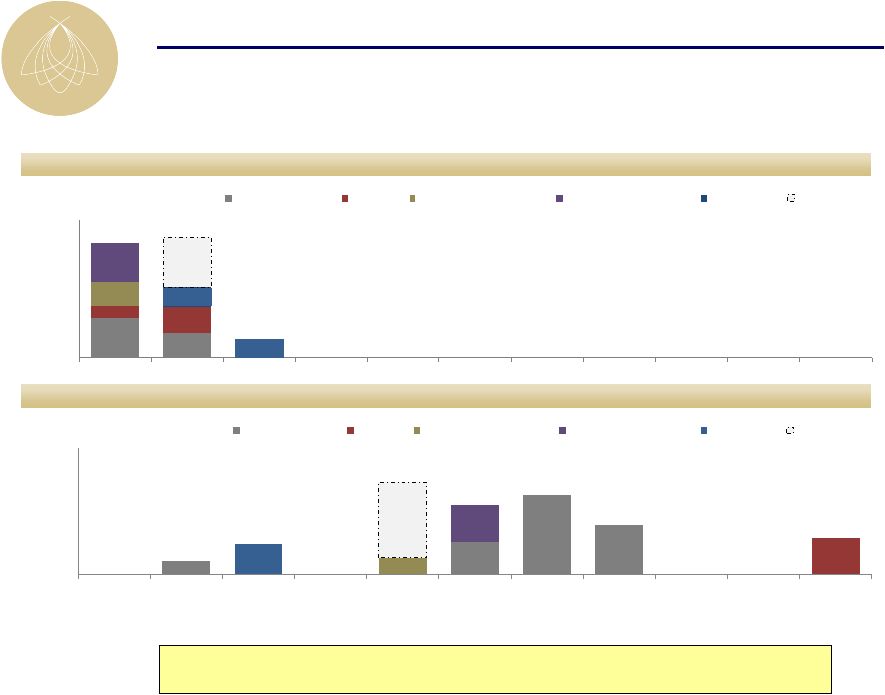
12/31/09 Actual ($mm)
Today ($mm)
Debt Maturity Profile Update
Significant accomplishments in debt maturity profile; final refinancing
stage to be executed throughout 2011
Note: Debt shown at pro rata amount of unconsolidated and consolidated joint
ventures $52.2
$130.0
$317.8
$195.0
$145.0
$66.5
$145.8
$119.0
$0.0
$100.0
$200.0
$300.0
$400.0
$500.0
2011
2012
2013
2014
2015
2016
2017
2018
2019
2020
2021
Bank / Life Co.
CMBS
Fairmont Scottsdale
Hotel del Coronado
European
Corporate
$300.0
Capacity
$275.8
$281.7
$173.5
$90.0
$194.8
$180.0
$282.8
$148.9
$124.9
$358.0
$0.0
$200.0
$400.0
$600.0
$800.0
$1,000.0
2011
2012
2013
2014
2015
2016
2017
2018
2019
2020
2021
Bank / Life Co.
CMBS
Fairmont Scottsdale
Hotel del Coronado
European
Corporate
$834.5
$875.2 |
 20
Except
for
historical
information,
the
matters
discussed
in
this
press
release
are
forward-looking
statements
subject
to
certain risks and uncertainties. Actual results could differ materially from the
Company's projections and forward-looking statements
are
not
guarantees
of
future
performance.
These
forward
looking
statements
are
identified
by
looking
their
use
of terms and phrases such as “anticipate,”
“believe,”
“could,”
“estimate,”
“expect,”
“intend,”
“may,”
“plan,”
“predict,”
“project,”
“should,”
“will,”
“continue”
and other similar terms and phrases, including references to assumptions and
forecasts of future results.
Factors that may contribute to these differences include, but are not limited to
the following: ability
to
obtain,
refinance
or
restructure
debt
or
comply
with
covenants
contained
in
our
debt
facilities;
volatility
in
equity
or
debt
markets;
availability
of
capital;
rising
interest
rates
and
operating
costs;
rising
insurance
premiums;
cash
available
for
capital
expenditures;
competition;
demand
for
hotel
rooms
in
our
current
and
proposed
market
areas;
economic
conditions
generally and in the real estate market specifically, including deterioration of
economic conditions and the extent of its effect on business and leisure
travel and the lodging industry; ability to dispose of existing properties in a manner
consistent
with
our
disposition
strategy;
delays
in
construction
and
development;
the
failure
of
closing
conditions
to
be
satisfied; risks related to natural disasters; the effect of threats of terrorism
and increased security precautions on travel patterns and hotel bookings;
the outbreak of hostilities and international political instability; legislative or regulatory
changes, including changes to laws governing the taxation of REITs; and changes in
generally accepted accounting principles, policies and guidelines
applicable to REITs. Certain of these risks and uncertainties are described in greater
detail in our filings with the Securities and Exchange Commission. Although we
believe our current expectations to be based
upon
reasonable
assumptions,
we
can
give
no
assurance
that
our
expectations
will
be
attained
or
that
actual
results
will
not
differ
materially.
We
undertake
no
obligation
to
update
any
forward-looking
statement
to
conform
the
statement
to
actual results or changes in our expectations.
Disclaimer |
 |