Attached files
| file | filename |
|---|---|
| 8-K - FORM 8-K - ASHFORD HOSPITALITY TRUST INC | d84475e8vk.htm |
Exhibit 99.1

| Investor Presentation September 2011 |
| Safe Harbor In keeping with the SEC's "Safe Harbor" guidelines, certain statements made during this presentation could be considered forward-looking and subject to certain risks and uncertainties that could cause results to differ materially from those projected. When we use the words "will likely result," "may," "anticipate," "estimate," "should," "expect," "believe," "intend," or similar expressions, we intend to identify forward-looking statements. Such forward-looking statements include, but are not limited to, our business and investment strategy, our understanding of our competition, current market trends and opportunities, projected operating results, and projected capital expenditures. These forward-looking statements are subject to known and unknown risks and uncertainties, which could cause actual results to differ materially from those anticipated including, without limitation: general volatility of the capital markets and the market price of our common stock; changes in our business or investment strategy; availability, terms and deployment of capital; availability of qualified personnel; changes in our industry and the market in which we operate, interest rates or the general economy, and the degree and nature of our competition. These and other risk factors are more fully discussed in the Company's filings with the Securities and Exchange Commission. EBITDA is defined as net income before interest, taxes, depreciation and amortization. EBITDA yield is defined as trailing twelve month EBITDA divided by the purchase price. EBITDA, FFO, AFFO, CAD and other terms are non-GAAP measures, reconciliations of which have been provided in prior earnings releases and filings with the SEC. This overview is for informational purposes only and is not an offer to sell, or a solicitation of an offer to buy or sell, any securities of Ashford Hospitality Trust, Inc. and may not be relied upon in connection with the purchase or sale of any such security. 2 |
| Agenda Favorable macro market dynamics Focused portfolio, positioned for growth Proactive debt and equity capital market strategies Outperformance Accretive Highland transaction High insider ownership 3 |
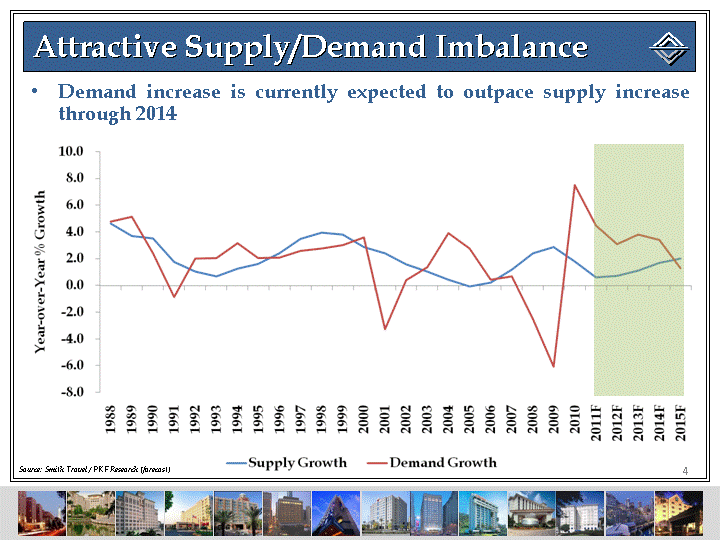
| Attractive Supply/Demand Imbalance Demand increase is currently expected to outpace supply increase through 2014 4 Source: Smith Travel / PKF Research (forecast) |
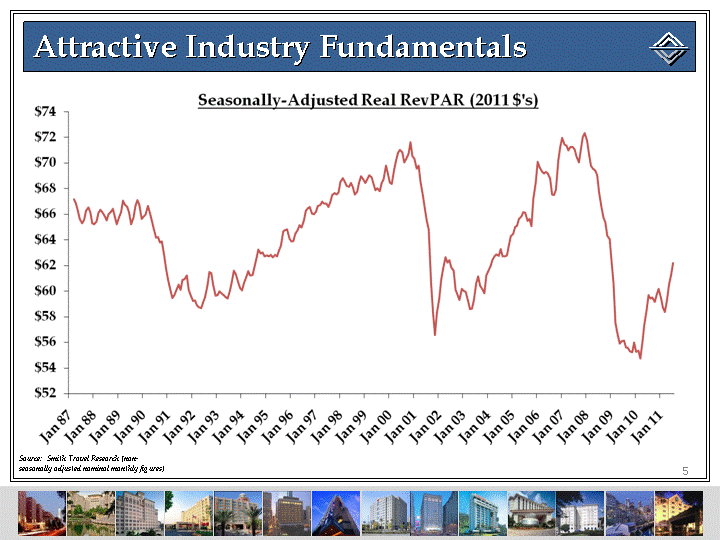
| Attractive Industry Fundamentals 5 Source: Smith Travel Research (non- seasonally adjusted nominal monthly figures) |
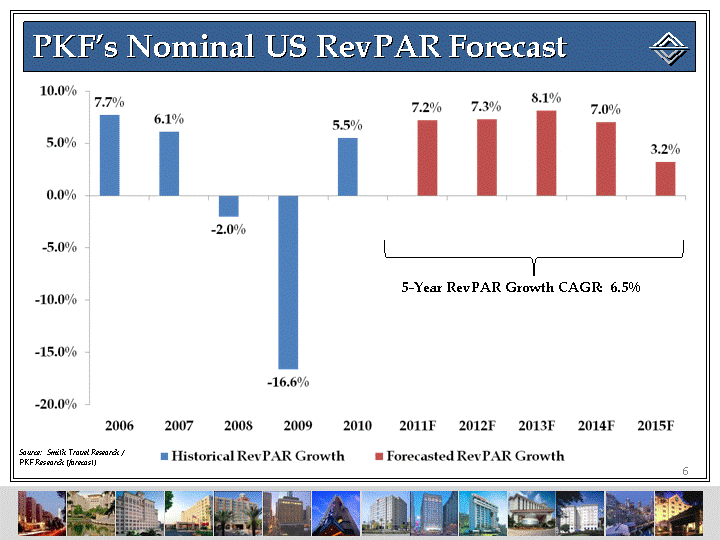
| PKF's Nominal US RevPAR Forecast 6 5-Year RevPAR Growth CAGR: 6.5% Source: Smith Travel Research / PKF Research (forecast) |
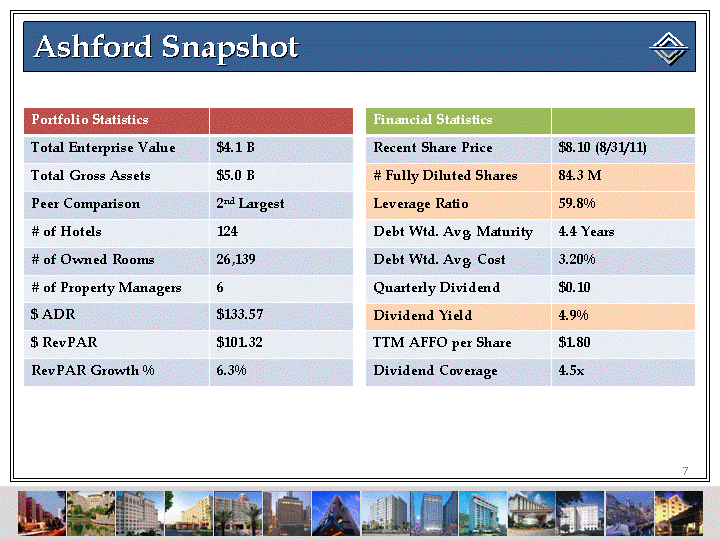
| Ashford Snapshot 7 Portfolio Statistics Total Enterprise Value $4.1 B Total Gross Assets $5.0 B Peer Comparison 2nd Largest # of Hotels 124 # of Owned Rooms 26,139 # of Property Managers 6 $ ADR $133.57 $ RevPAR $101.32 RevPAR Growth % 6.3% Financial Statistics Recent Share Price $8.10 (8/31/11) # Fully Diluted Shares 84.3 M Leverage Ratio 59.8% Debt Wtd. Avg. Maturity 4.4 Years Debt Wtd. Avg. Cost 3.20% Quarterly Dividend $0.10 Dividend Yield 4.9% TTM AFFO per Share $1.80 Dividend Coverage 4.5x |
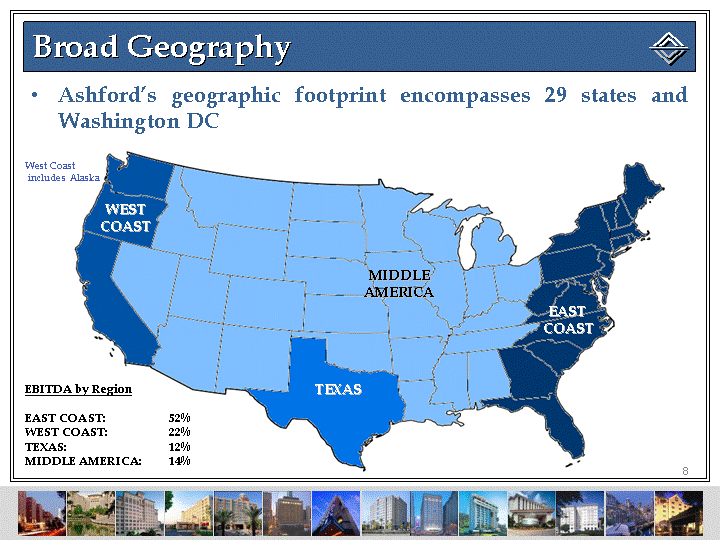
| Broad Geography Ashford's geographic footprint encompasses 29 states and Washington DC 8 WEST COAST MIDDLE AMERICA TEXAS EAST COAST West Coast includes Alaska EBITDA by Region EAST COAST: 52% WEST COAST: 22% TEXAS: 12% MIDDLE AMERICA: 14% |
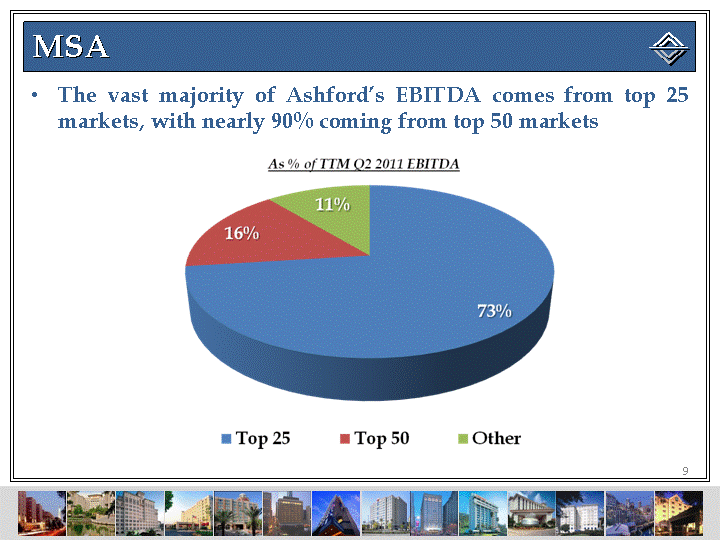
| MSA The vast majority of Ashford's EBITDA comes from top 25 markets, with nearly 90% coming from top 50 markets 9 |
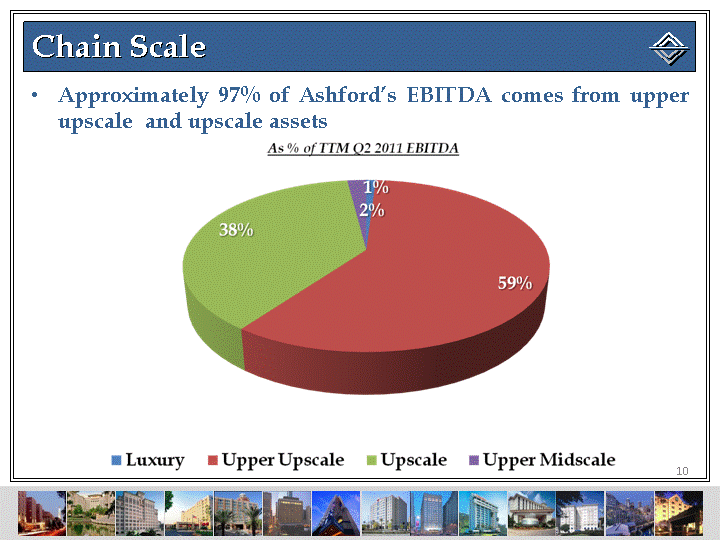
| Chain Scale Approximately 97% of Ashford's EBITDA comes from upper upscale and upscale assets 10 |
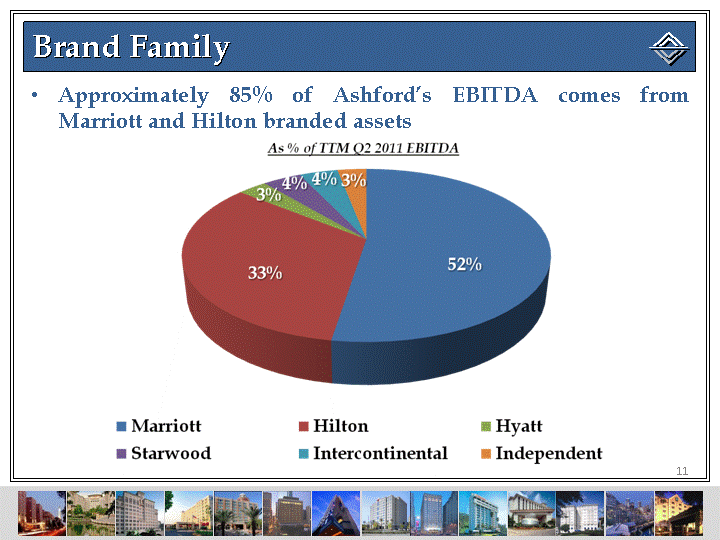
| Brand Family Approximately 85% of Ashford's EBITDA comes from Marriott and Hilton branded assets 11 |
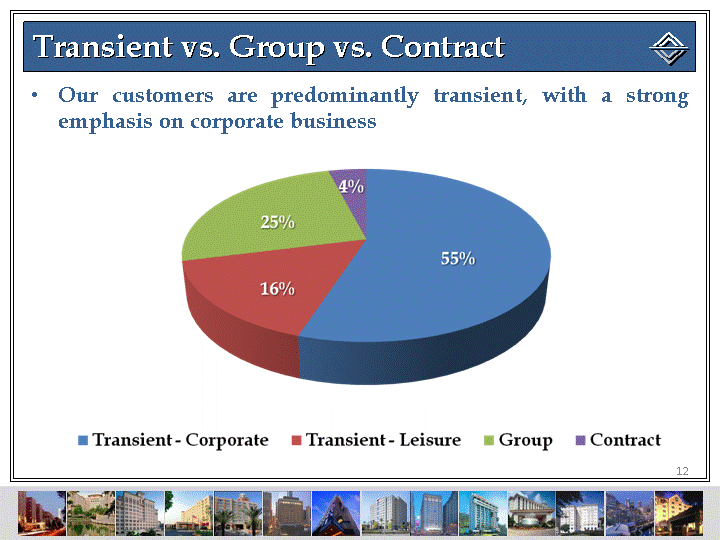
| Transient vs. Group vs. Contract Our customers are predominantly transient, with a strong emphasis on corporate business 12 |
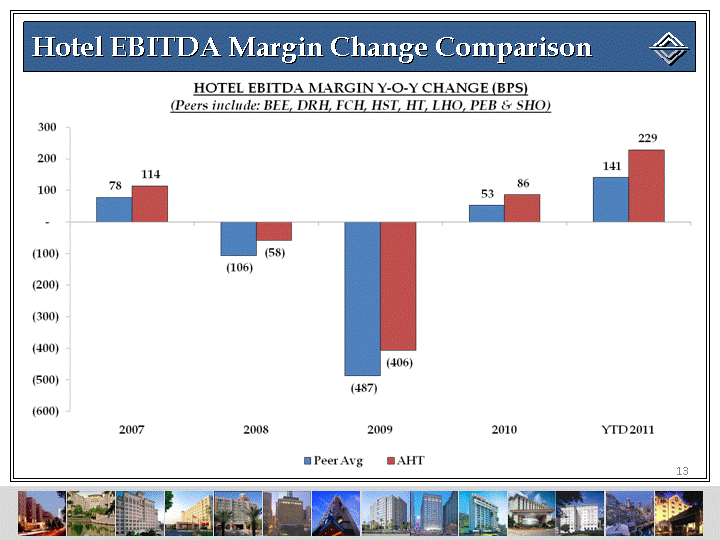
| Hotel EBITDA Margin Change Comparison 13 |
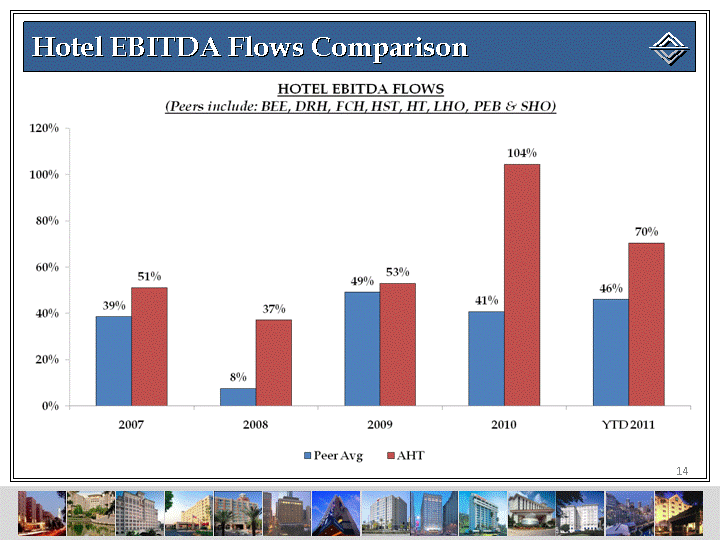
| Hotel EBITDA Flows Comparison 14 |
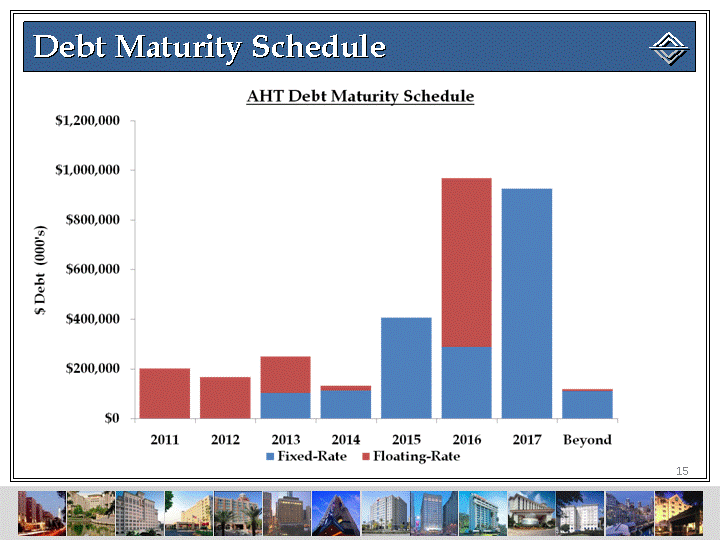
| Debt Maturity Schedule 15 |
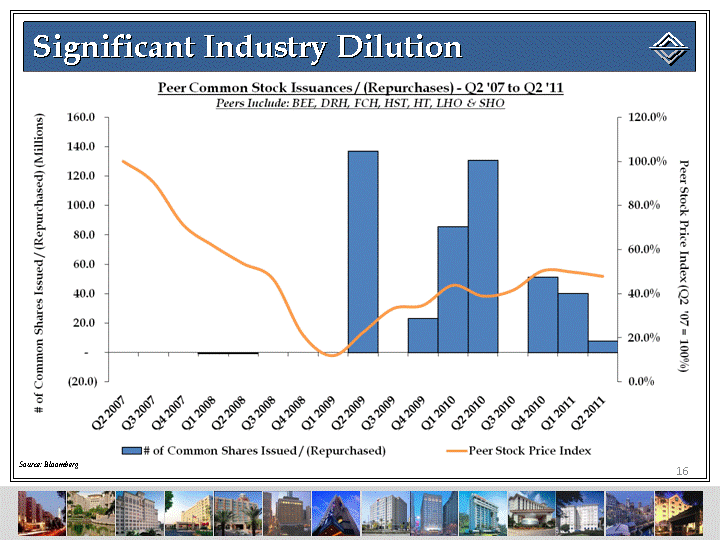
| Significant Industry Dilution 16 Source: Bloomberg |
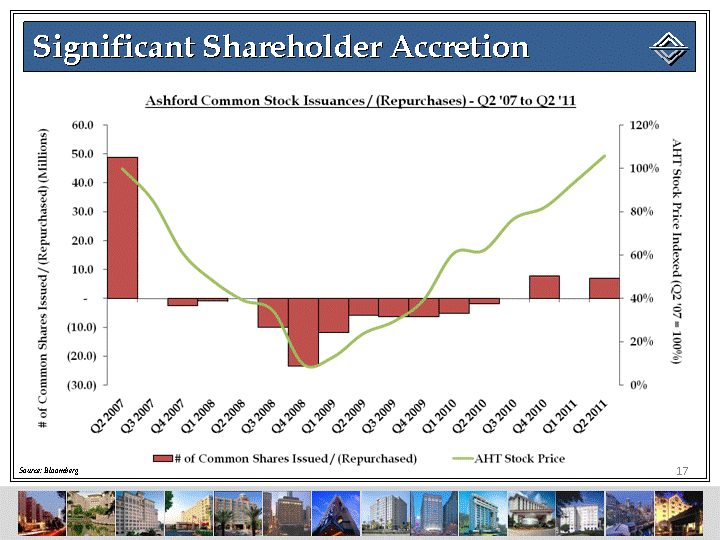
| Significant Shareholder Accretion 17 Source: Bloomberg |
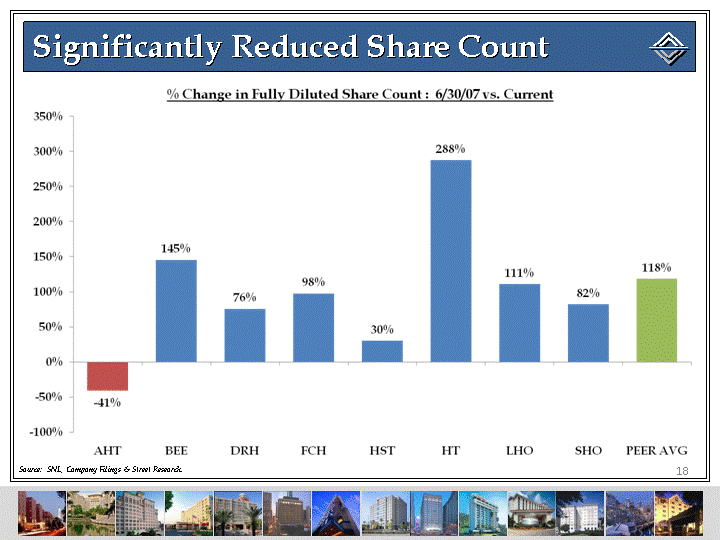
| Significantly Reduced Share Count 18 Source: SNL, Company Filings & Street Research. |
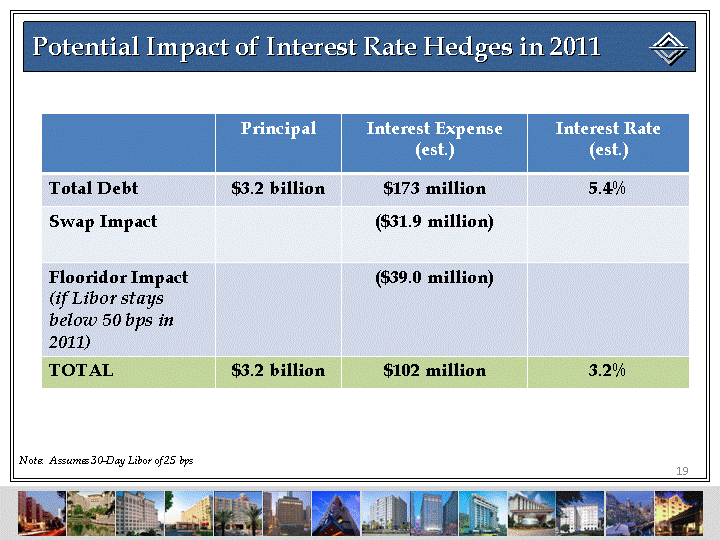
| Potential Impact of Interest Rate Hedges in 2011 19 Principal Interest Expense (est.) Interest Rate (est.) Total Debt $3.2 billion $173 million 5.4% Swap Impact ($31.9 million) Flooridor Impact (if Libor stays below 50 bps in 2011) ($39.0 million) TOTAL $3.2 billion $102 million 3.2% Note: Assumes 30-Day Libor of 25 bps |
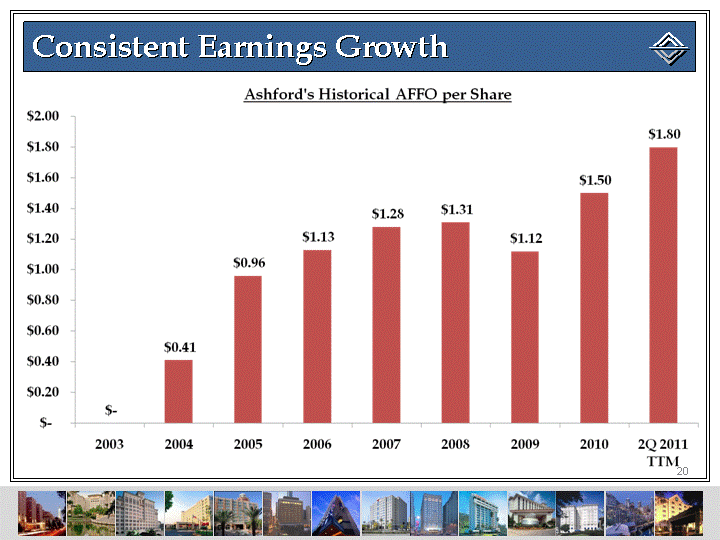
| Consistent Earnings Growth 20 |
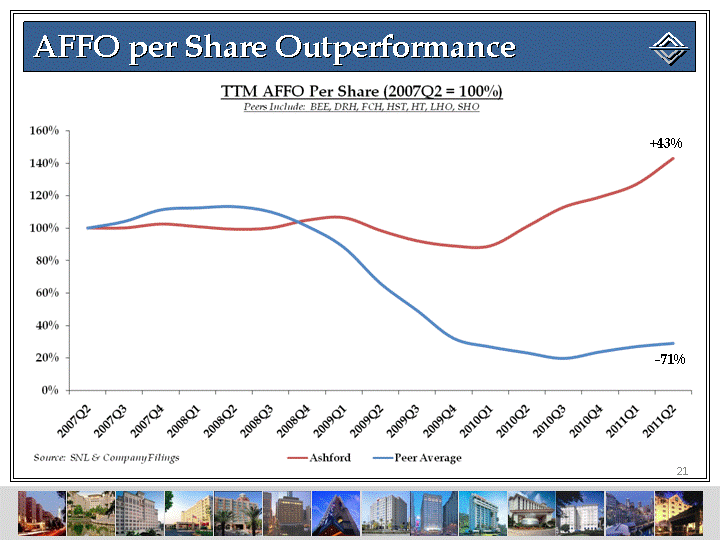
| AFFO per Share Outperformance 21 +43% -71% |
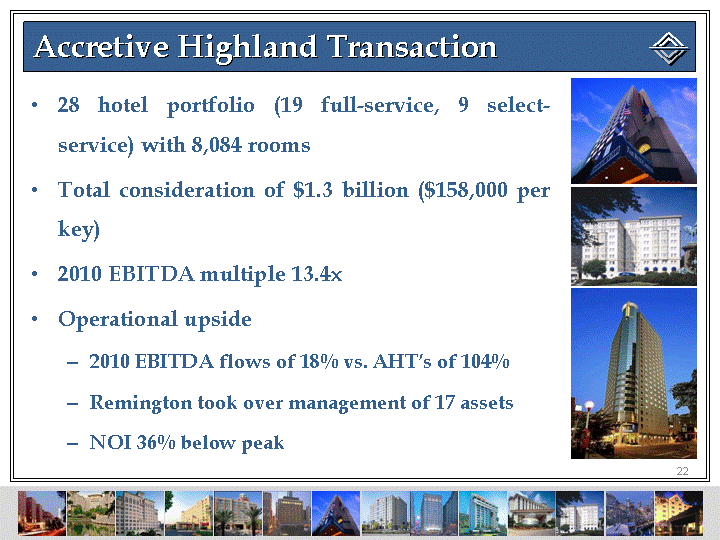
| Accretive Highland Transaction 22 28 hotel portfolio (19 full-service, 9 select- service) with 8,084 rooms Total consideration of $1.3 billion ($158,000 per key) 2010 EBITDA multiple 13.4x Operational upside 2010 EBITDA flows of 18% vs. AHT's of 104% Remington took over management of 17 assets NOI 36% below peak |
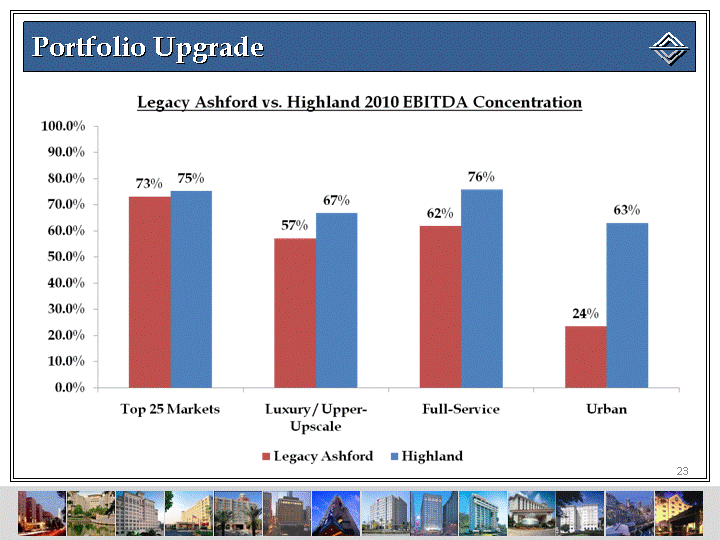
| Portfolio Upgrade 23 |
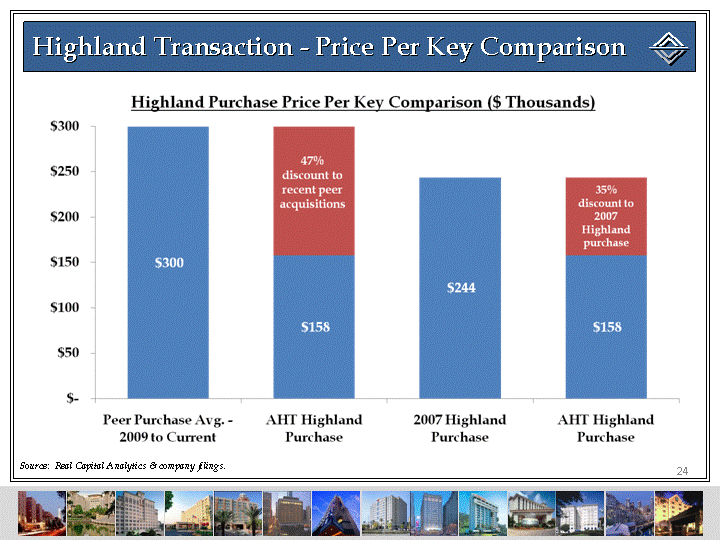
| Highland Transaction - Price Per Key Comparison 24 Source: Real Capital Analytics & company filings. |
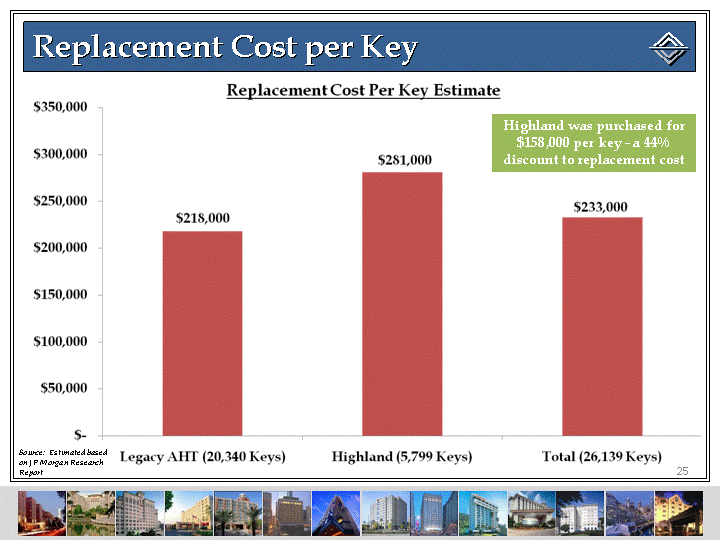
| Replacement Cost per Key 25 Source: Estimated based on JP Morgan Research Report Highland was purchased for $158,000 per key - a 44% discount to replacement cost |
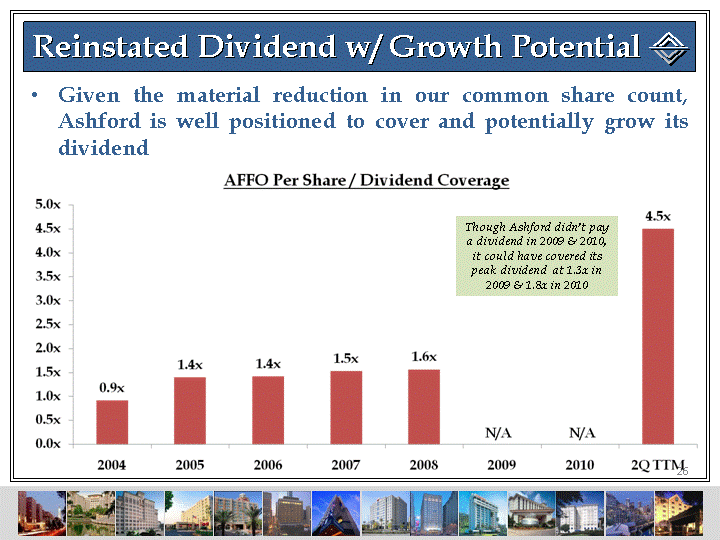
| Reinstated Dividend w/ Growth Potential Given the material reduction in our common share count, Ashford is well positioned to cover and potentially grow its dividend 26 Though Ashford didn't pay a dividend in 2009 & 2010, it could have covered its peak dividend at 1.3x in 2009 & 1.8x in 2010 |
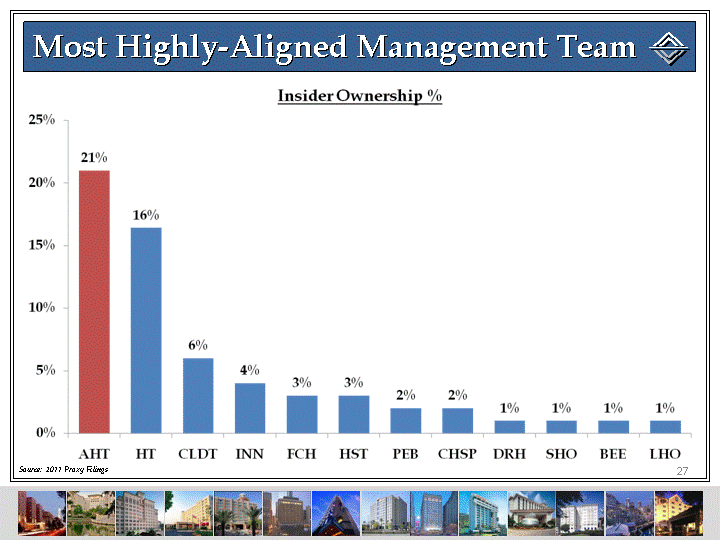
| Most Highly-Aligned Management Team 27 Source: 2011 Proxy Filings |

| Investor Presentation September 2011 |
