Attached files
| file | filename |
|---|---|
| 8-K - FORM 8-K - NuStar Energy L.P. | d8k.htm |
 August
24
&
25,
2011
2011
Citigroup
One-on-One
MLP/
Midstream
Infrastructure
Conference
1
Exhibit 99.1 |
 Statements
contained
in
this
presentation
that
state
management’s
expectations
or
predictions
of
the
future
are
forward-looking
statements
as
defined
by
federal
securities
law.
The
words
“believe,”
“expect,”
“should,”
“targeting,”
“estimates,”
and
other
similar
expressions
identify
forward-
looking
statements.
It
is
important
to
note
that
actual
results
could
differ
materially
from
those
projected
in
such
forward-looking
statements.
We
undertake
no
duty
to
update
any
forward-looking
statement
to
conform
the
statement
to
actual
results
or
changes
in
the
company’s
expectations.
For
more
information
concerning
factors
that
could
cause
actual
results
to
differ
from
those
expressed
or
forecasted,
see
NuStar
Energy
L.P.’s
and
NuStar
GP
Holdings,
LLC’s
respective
annual
reports
on
Form
10-K
and
quarterly
reports
on
Form
10-Q,
filed
with
the
Securities
and
Exchange
Commission
and
available
on
NuStar’s
websites
at
www.nustarenergy.com
and
www.nustargpholdings.com.
Forward Looking Statements
2 |
 NuStar Overview
3 |
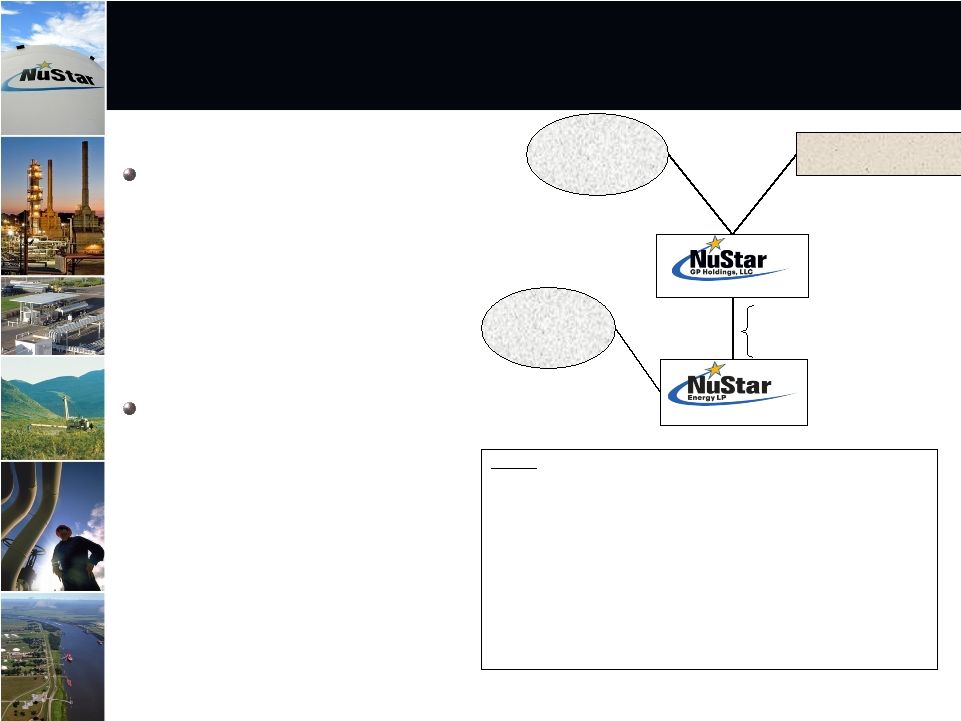 NuStar Energy L.P. (NYSE: NS) is
a leading publicly traded
partnership with a market
capitalization of around $3.6 billion
and an enterprise value of
approximately $5.9 billion
NuStar GP Holdings, LLC (NYSE:
NSH) holds the 2% general
partner interest, incentive
distribution rights and 15.5% of the
common units in NuStar Energy
L.P. with a market capitalization of
around $1.4 billion
Two Publicly Traded Companies
NSNSH
IPO Date:
4/16/2001
7/19/2006
Unit Price (08/2211):$55.99$33.10
Annualized Distribution/Unit:
$4.38
$1.98
Yield (08/22/11):7.82%5.98%
Market Capitalization:
$3,618 million
$1,409 million
Enterprise Value
$5,931million$1,417 million
Credit Ratings –
Moody’s
Baa3/Stable
n/a
S&P and Fitch
BBB-/Stable
n/a
83.0%
Membership Interest
82.5%
L.P. Interest
Public Unitholders
35.3 Million NSH Units
Public Unitholders
54.4 Million NS Units
17.0%
Membership
Interest
2.0% G.P. Interest
15.5% L.P. Interest
Incentive Distribution Rights
William E. Greehey
7.3 Million NSH Units
NYSE: NSH
NYSE: NS
4 |
 Large
and Diverse Geographic Footprint
with Assets in Key Locations
Asset Stats:
Operations in eight different
countries including the U.S.,
Mexico, the Netherlands,
including St. Eustatius in
the Caribbean, England,
Ireland, Scotland, Canada
and Turkey.
Own 90 terminal and
storage facilities
Over 94 million barrels of
storage capacity
8,417 miles of crude oil and
refined product pipelines
2 asphalt refineries and a
fuels refinery capable of
processing 118,500 bpd of
crude oil
5 |
 Percentage of 2010
Segment Operating Income
Approximately 78% of NuStar Energy’s 2010 segment operating income came
from fee-based transportation and storage segments
Approximately 80% of 2011 segment operating income should come from fee-
based transportation and storage segments
Storage: 43%
Transportation: 35%
Refined Product Terminals
Crude Oil Storage
Refined Product Pipelines*
Crude Oil Pipelines
Asphalt & Fuels Marketing: 22%
Asphalt Operations
Fuels Marketing Operations
Product Supply, Crude Oil Trading, Bunkering
and Fuel Oil Marketing
San Antonio Refinery (Beginning in 2011)
Diversified Operations from Three
Business Segments
* Includes primarily distillates, gasoline, propane, jet fuel, ammonia and
other light products. Does not include natural gas. 6
|
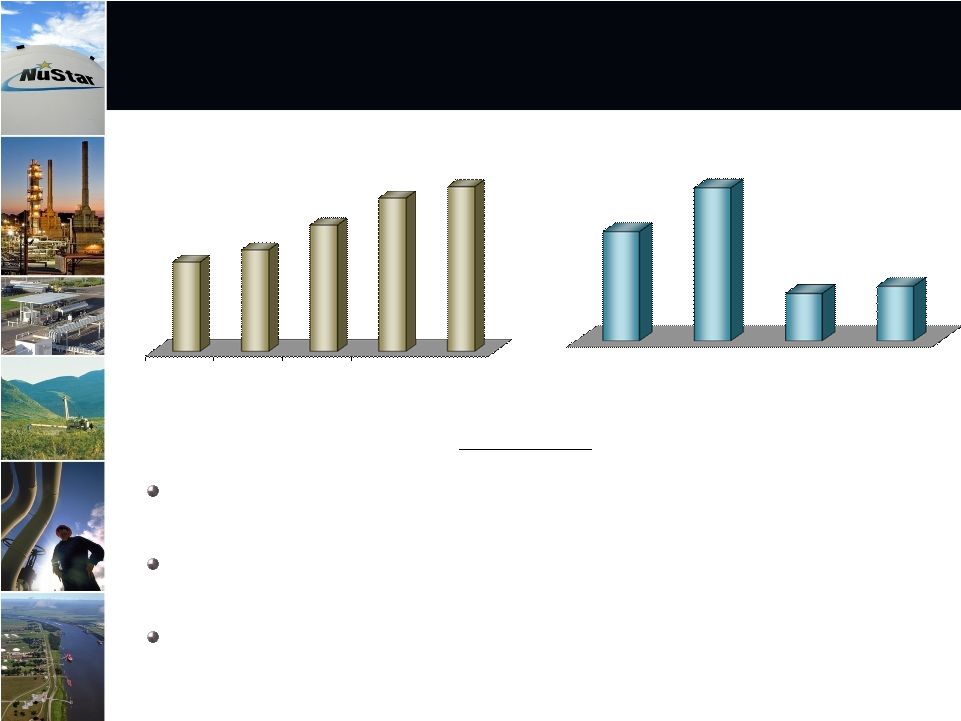
 2006
2007
2008
2009
2010
$1.28
$1.38
$1.58
$1.73
$1.87
Distributions for both NS and NSH have grown every year since IPO’s…
Expect 2011 distribution growth rate to be higher than 2010
NS Distribution ($ per Unit)
NSH Distribution ($ per Unit)
~9.9% CAGR
* Annualized Distribution
*
7 |
 Storage Segment Overview
8 |
 2011
Outlook Full
year
of
EBITDA
should
be
realized
from
May
2010
Mobile,
AL
terminal
acquisition
and
St.
Eustatius
terminal
project
completed
in
4
th
quarter
2010
Benefits
from
St.
James
Phase
1
storage
project
began
July
1
and
are
being
phased
in
during
the
3
rd
quarter
as
a
portion
of
the
planned
tanks
are
completed
2011
segment
EBITDA
expected
to
be
$20
to
$30
million
higher
than
2010
Storage Segment EBITDA ($ in Millions)
Storage Contract Renewals (% of Revenues)
1 Year
or Less
1 to 3
Years
3 to 5
Years
Greater
Than 5
Years
2011 Storage Segment
EBITDA Expected to be Higher than 2010
2006
2007
2008
2009
2010
$162
$177
$208
$242
$256
30%
42%
13%
15%
9 |
  Storage expansion projects continue at our
St. James, Louisiana terminal
Third-Party Crude Oil Storage Expansion –
Phase 1
Construct 3.2 million barrels of crude oil storage
Projected CAPEX of $125 to $145 million, with projected average annual
EBITDA of $15 to $25 million
Storage tanks in-service beginning July 1 and
phased
in
during
the
3
rd
quarter
Third-Party Crude Oil Storage Expansion –
Phase 2
Project in early planning stages
Should be similar in size to Phase 1 project
Could grow in size based on customer demand
Expected in-service last half of 2012
10 |
 Recently announced an agreement to
construct a unit train offloading facility at
our St. James terminal
Agreement with two subsidiaries of EOG Resources, Inc.
EOG is a large independent oil and natural gas company
Proved reserves in the United States, Canada, the UK and China
Project description:
New rail and unit train offloading facilities
Facility will be equipped to handle at least one 70,000-barrel train per
day Two new storage tanks with a combined capacity of 360,000 barrels
Costs and completion dates:
Rail
project
should
be
completed
in
1
st
quarter
of
2012
Tanks
are
expected
to
be
completed
and
in
service
in
2
nd
quarter
of
2012
NuStar’s
share
of
the
costs
should
be
$30
to
$40
million
11 |
 Plan
to construct new tanks for distillate service at our St. Eustatius
terminal Construct one million barrels of new storage for distillate
service Interested customers include several large oil companies
Projected CAPEX of $45 to $55 million, with projected average
annual EBITDA of $5 to $10 million
Expected in-service 4th quarter 2012
12 |
 Transportation Segment
Overview
13 |
 Transportation Segment EBITDA ($ in Millions)
2010 Pipeline Receipts by Commodity
Lower throughputs should cause
Transportation Segment EBITDA to be down in 2011
Gasoline
29%
Other*
13%
*Other includes ammonia, jet fuel, propane, naphtha
and light end refined products
2006
2007
2008
2009
2010
$170
$176
$186
$190
$199
Crude Oil
40%
Distillate
18%
2011 Outlook
Eagle Ford shale crude project with Koch Pipeline Company completed in June 2011
should increase throughputs 30,000 BPD
Throughputs projected to be down 7% to 8%. Heavy customer refinery turnaround
schedule and increased export demand for distillates could negatively impact
throughputs. Tariff increase of 6.9%, effective July 1, 2011, includes a 2.65%
FERC approved index adjustment factor that will be applicable on an annual
basis through June 30, 2016 Full year 2011 segment EBITDA expected to be $5 to
$15 million lower than 2010 14 |
 Transportation Segment Assets in close
proximity to key Shale Formations
Shale Development Strategy should increase
Transportation Segment Throughputs
Shale Development Strategy
There are key shale developments located in NuStar’s Mid-Continent and Gulf
Coast regions, including the Eagle Ford, Bakken, Granite Wash, Barnett, and
Niobrara
15 |
 Four
Eagle Ford Shale Projects have been announced to date
Previously discussed Pipeline Connection & Capacity Lease Agreement
with Koch Pipeline
In
the
2
nd
quarter
of
2011,
announced
the
signing
of
LOIs
with
TexStar
Midstream Services and Velocity Midstream Partners to develop a new
pipeline system
TexStar and Velocity both plan to construct pipelines that transport
crude and condensate to Three Rivers, TX
Pipelines should be interconnected with a new storage facility to be
constructed at Three Rivers, TX by NuStar
Plan to connect the storage facility to NuStar’s existing 16-inch pipeline
that can transport 200,000 BPD to NuStar’s Corpus Christi North Beach
storage terminal
Both projects expected to be in-service 2Q 2012
16 |
 Four
Eagle Ford Shale Projects have been announced to date (Continued)
NuStar is working with Valero Energy to finalize agreements to transport
Eagle Ford crude, other crude oils and condensate for Valero Energy
Agreements should involve several of NuStar’s existing South Texas
pipelines and could also involve the construction of a new pipeline.
A
portion
of
this
project
could
be
on-line
as
early
as
the
4
th
quarter
of
2011.
17 |
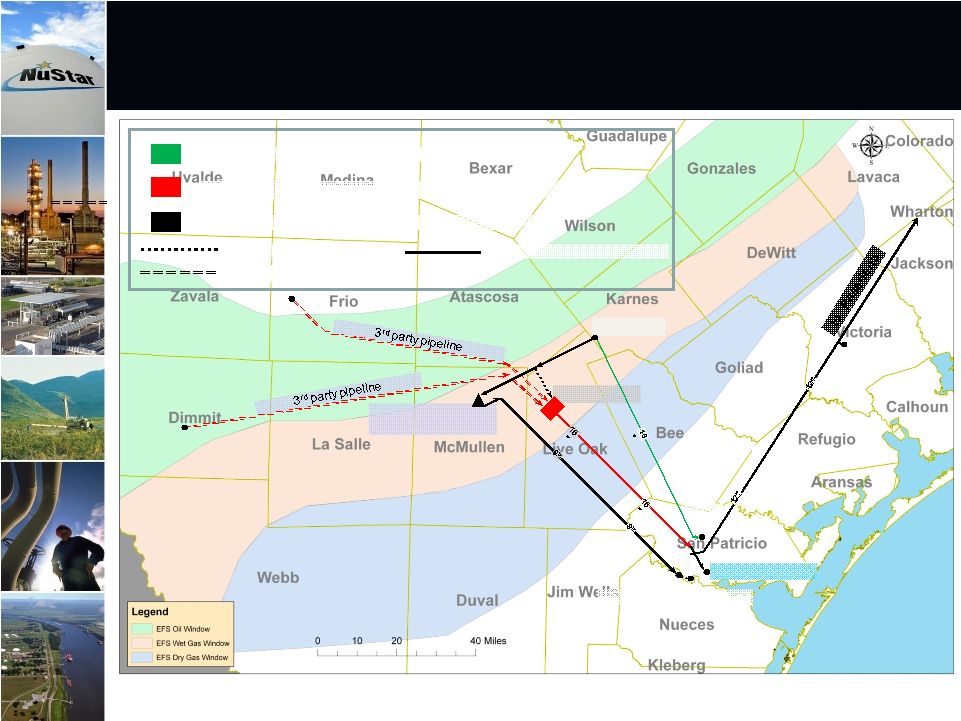      THREE
RIVERS REFINERY
CORPUS CHRISTI
PLACED
O
PETTUS
NORTH BEACH
Valero
West Plant
OAKVILLE
Koch
Mayo Sta.
Completed project for Koch Pipeline
New
3
rd
Party
Pipeline
New NuStar Pipeline
Existing NuStar Pipeline
In early development phase
Letter of Intent in place
Expect to Announce Additional Projects
In the Near Future
18 |
 Asphalt & Fuels Marketing
Segment Overview
19 |
 $27
$22
$37
$10
$37
$90
$70
$74
Asphalt
Fuels Marketing
$3.78
$8.75
$6.37
$7.73
Earnings from San Antonio refinery acquisition as well
as improved earnings in Fuels Marketing operations
should lead to improved segment results
Asphalt & Fuels Marketing
U.S. East Coast Product Margin ($ per barrel)
2009
Actual
2008
Actual
2000-2007
Average
2011 Outlook
April 2011 San Antonio refinery acquisition contributing as expected to 2011
earnings Continued weak asphalt demand and high feedstock costs should cause
EBITDA in our asphalt operations to be lower than 2010
New U.S. heavy fuels and bunker fuels markets entered in 2010 benefitting our
fuels marketing operations in 2011
Full year 2011 segment EBITDA expected to be higher than 2010
Segment EBITDA ($ in millions)
2010
Actual
2006
2007
2008
2009
2010
$80
$111
$127
20 |
 Financial Overview
21 |
 6/30/11 Revolver Availability
NuStar Revolver Availability close to $350 million….
Credit Metrics should continue to improve as earnings increase
Total Bank Credit
$1,224
Less:
Borrowings
(489)
Letters of Credit
Go Zone Financing
(294)
Other
(12)
Revolver Availability
$429
Standard & Poor’s: BBB-
(Stable
Outlook)
Moody’s: Baa3 (Stable Outlook)
Fitch: BBB-
(Stable Outlook)
Debt/EBITDA (6/30/11): 4.3x
Debt/Capitalization (6/30/11): 47.9%
Credit Ratings/Metrics
(Dollars in Millions)
5.0x Revolver Debt/EBITDA covenant limits true Revolver availability to
~$350 million at 6/30/11
22 |
 $0
$250
$500
$750
$1,000
$1
$874
$480
$350
$450
$290
No Significant Debt Maturities Until 2012
No
significant
debt
maturities
until
2012
when
some
senior
notes
and
the
revolver
will
become
due
Current
market
Credit
Revolver
terms
&
pricing
seem
to
be
improving
Current
plan
is
to
hold
off
closing
on
a
new
Revolver
until
2012
$290
million
worth
of
GO
Zone
financing
matures
in
2038
–
2040
Debt
structure
approximately
50%
fixed
rate
–
50%
variable
rate
Debt Maturities as of June 30, 2011
(Millions $)
23 |
 $20
$13
$75
$107
$159
$200
$14
$20
$25
$23
$27
$75
$43
$100
2009 Actual
2010 Actual
2011 Forecast
Acquisitions
Corporate
Asphalt & Fuels Marketing
Storage
Transportation
2011 Total Spending on Internal Growth Projects &
Acquisitions currently projected to be around
$475 million
(
Dollars in Millions)
$164
$262
$475
24 |
 High quality, large and diverse asset footprint supporting energy infrastructure
both in the U.S. and internationally
Contracted fee-based storage and transportation assets provide stable cash
flows, delivering 78% of 2010 operating income
Fourth largest independent liquids terminal operator in the world
Diverse and high quality customer base composed of large integrated oil companies,
national oil companies and refiners
Strong balance sheet, credit metrics and commitment to maintain investment grade
credit ratings
Lower cost of capital than majority of peers
Experienced and proven management team with substantial equity ownership and
industry experience
Recognized nationally for safety and environmental record as well as one of the
best places to work
NuStar Summary
25 |
 26 |
 Appendix
27 |
 Reconciliation of Non-GAAP Financial
Information: Storage Segment
28
(Unaudited, Dollars in Thousands)
The following is a reconciliation of operating income to EBITDA for the Storage Segment:
2006
2007
2008
2009
2010
Operating income
108,486
$
114,635
$
141,079
$
171,245
$
178,947
$
Plus depreciation and amortization expense
53,121
62,317
66,706
70,888
77,071
EBITDA
161,607
$
176,952
$
207,785
$
242,133
$
256,018
$
Projected incremental operating income range
$ 11,000 - 20,000
Plus projected incremental depreciation and
amortization expense range
9,000 - 10,000
Projected incremental EBITDA range
$ 20,000 - 30,000
St. James, LA
Terminal
Expansion
Phase 1
St. Eustatius
Distillate
Project
Projected annual operating income range
$ 11,000 - 20,000
$ 4,000 - 8,000
Plus projected annual depreciation and
amortization expense range
4,000 - 5,000
1,000 - 2,000
Projected annual EBITDA range
$ 15,000 - 25,000
$ 5,000 - 10,000
The
following
is
a
reconciliation
of
projected
annual
operating
income
to
projected
annual
EBITDA
for
certain
projects
in
our
storage
segment
related
to
our internal growth program:
The following is a reconciliation of projected incremental operating income to projected incremental
EBITDA: Year Ended December 31,
Year Ended
December 31, 2011
NuStar
Energy
L.P.
utilizes
a
financial
measure,
EBITDA,
that
is
not
defined
in
United
States
generally
accepted
accounting
principles.
Management
uses
this
financial
measure
because
it
is
a
widely
accepted
financial
indicator
used
by
investors
to
compare
partnership
performance.
In
addition,
management
believes
that
this
measure
provides
investors
an
enhanced
perspective
of
the
operating
performance
of
the
partnership's
assets.
EBITDA
is
not
intended
nor
presented
as
an
alternative
to
net
income.
EBITDA
should
not
be
considered
in
isolation
or
as
a
substitute
for
a
measure
of
performance
prepared
in
accordance
with
United States generally accepted accounting principles. |
 Reconciliation of Non-GAAP Financial
Information: Transportation Segment
29
(Unaudited, Dollars in Thousands)
The following is a reconciliation of operating income to EBITDA for the Transportation Segment:
2006
2007
2008
2009
2010
Operating income
122,714
$
126,508
$
135,086
$
139,869
$
148,571
$
Plus depreciation and amortization expense
47,145
49,946
50,749
50,528
50,617
EBITDA
169,859
$
176,454
$
185,835
$
190,397
$
199,188
$
The following is a reconciliation of projected decrease in operating income to projected decrease in
EBITDA: Projected decrease in operating income
($ 5,000 - 15,500)
Plus projected incremental depreciation and
amortization expense range
0 - 500
Projected decrease in EBITDA range
($ 5,000 - 15,000)
Year Ended
December 31,
2011
Year Ended December 31,
NuStar
Energy
L.P.
utilizes
a
financial
measure,
EBITDA,
that
is
not
defined
in
United
States
generally
accepted
accounting
principles.
Management
uses
this
financial
measure
because
it
is
a
widely
accepted
financial
indicator
used
by
investors
to
compare
partnership
performance.
In
addition,
management
believes
that
this
measure
provides
investors
an
enhanced
perspective
of
the
operating
performance
of
the
partnership's
assets.
EBITDA
is
not
intended
nor
presented
as
an
alternative
to
net
income.
EBITDA
should
not
be
considered
in
isolation
or
as
a
substitute
for
a
measure
of
performance
prepared
in
accordance with United States generally accepted accounting principles.
|
 Reconciliation of Non-GAAP Financial Information:
Asphalt and Fuels Marketing Segment
30
(Unaudited, Dollars in Thousands)
Asphalt
Operations
Fuels Marketing
Operations
Asphalt and Fuels
Marketing
Segment
Operating income
53,977
$
36,884
$
90,861
$
Plus depreciation and amortization expense
20,164
93
20,257
EBITDA
74,141
$
36,977
$
111,118
$
Asphalt
Operations
Fuels Marketing
Operations
Asphalt and Fuels
Marketing
Segment
Operating income
50,710
$
9,919
$
60,629
$
Plus depreciation and amortization expense
19,463
-
19,463
EBITDA
70,173
$
9,919
$
80,092
$
Year Ended
December 31, 2007
Year Ended
December 31, 2006
Asphalt
Operations
Fuels Marketing
Operations
Asphalt and Fuels
Marketing
Segment
Asphalt and Fuels
Marketing
Segment
Asphalt and Fuels
Marketing
Segment
Operating income
76,267
$
36,239
$
112,506
$
21,111
$
26,815
$
Plus depreciation and amortization expense
14,182
552
14,734
423
-
EBITDA
90,449
$
36,791
$
127,240
$
21,534
$
26,815
$
Year Ended December 31, 2009
Year Ended December 31, 2008
NuStar
Energy
L.P.
utilizes
a
financial
measure,
EBITDA,
that
is
not
defined
in
United
States
generally
accepted
accounting
principles.
Management
uses
this
financial
measure
because
it
is
a
widely
accepted
financial
indicator
used
by
investors
to
compare
partnership
performance.
In
addition,
management
believes
that
this
measure
provides
investors
an
enhanced
perspective
of
the
operating
performance
of
the
partnership's
assets.
EBITDA
is
not
intended
nor
presented
as
an
alternative
to
net
income.
EBITDA
should
not
be
considered
in
isolation
or
as
a
substitute
for
a
measure
of
performance
prepared
in
accordance
with
United
States
generally
accepted
accounting principles.
The following tables reconcile operating income to EBITDA for asphalt operations and fuels marketing
operations in our asphalt and fuels marketing segment: Year Ended December 31, 2010
|