Attached files
| file | filename |
|---|---|
| 8-K - FORM 8-K DATED AUGUST 15, 2011 - Aegion Corp | form8k08152011.htm |
INVESTOR PRESENTATION
August 2011

Safe Harbor Statement
The Private Securities Litigation Reform Act of 1995 provides a “safe harbor” for forward looking statements. The Company
makes forward-looking statements in this Investor Presentation that represent the Company’s beliefs or expectations about
future events or financial performance. These forward-looking statements are based on information currently available to the
Company and on management’s beliefs, assumptions, estimates and projections and are not guarantees of future events or
results. When used in this presentation, the words “anticipate,” “estimate,” “believe,” “plan,” “intend,” “may,” “will” and similar
expressions are intended to identify forward-looking statements, but are not the exclusive means of identifying such statements.
Such statements are subject to known and unknown risks, uncertainties and assumptions, including those referred to in the “Risk
Factors” section of the Company’s Annual Report on Form 10-K for the year ended December 31, 2010, as filed with the
Securities and Exchange Commission on February 28, 2011. In light of these risks, uncertainties and assumptions, the forward-
looking events discussed may not occur. In addition, our actual results may vary materially from those anticipated, estimated,
suggested or projected. Except as required by law, we do not assume a duty to update forward-looking statements, whether as
a result of new information, future events or otherwise. Investors should, however, review additional disclosures made by the
Company from time to time in its periodic filings with the Securities and Exchange Commission. Please use caution and do not
place reliance on forward-looking statements. All forward-looking statements made by the Company in this presentation are
qualified by these cautionary statements.
In addition, some of the market and industry date and forecast included in this Investor Presentation are based upon
independent industry sources. Although we believe that these independent sources are reliable we have not independently
verified the accuracy and completeness of this information.
independent industry sources. Although we believe that these independent sources are reliable we have not independently
verified the accuracy and completeness of this information.
Insituform®, the Insituform® logo, InsituMain®, United Pipeline Systems®, Bayou Companies™, Corrpro® and our other
trademarks referenced herein are the registered and unregistered trademarks of Insituform Technologies, Inc. and its affiliates.
trademarks referenced herein are the registered and unregistered trademarks of Insituform Technologies, Inc. and its affiliates.
2
ENERGY & MINING
•Grew significantly in size and contribution through
service and geographic expansion
service and geographic expansion
3
Strength in Numbers
NORTH AMERICAN SEWER
REHABILITATION (NAR)
REHABILITATION (NAR)
•Manufacturing optimization and growth in third-party tube
sales were primary drivers to 2010 increased profitability
sales were primary drivers to 2010 increased profitability
•In 2011, market challenges have led to significant decline
in profitability; focused on improving crew efficiency and
project management to turn around performance
in profitability; focused on improving crew efficiency and
project management to turn around performance
ASIA-PACIFIC AND EUROPEAN SEWER
REHABILITATION
REHABILITATION
•We continue to push into new markets in Asia-Pacific
and expand our footprint in Australia and other parts of
Asia
and expand our footprint in Australia and other parts of
Asia
•We made significant progress in European profitability
and returns through right-sizing of contracting operations
and increasing our focus on manufacturing
and returns through right-sizing of contracting operations
and increasing our focus on manufacturing
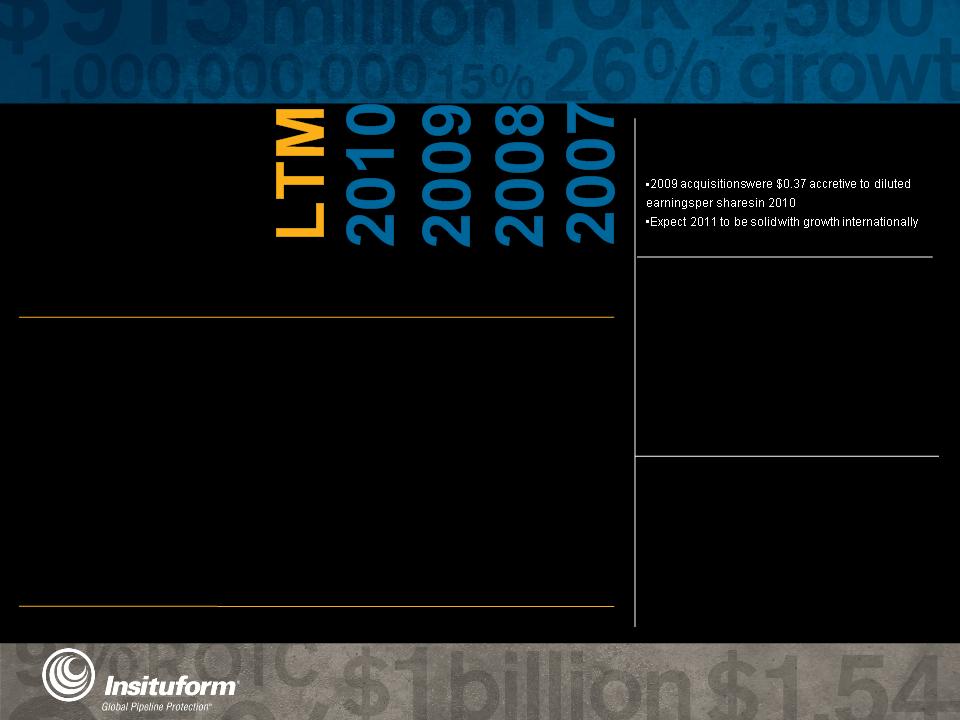
FINANCIAL HIGHLIGHTS
(IN THOUSANDS, EXCEPT PER SHARE DATA) FOR THE YEARS ENDED DECEMBER 31
Revenues
Gross Profit
Operating Income
Income from Continuing Operations
Income from Continuing Operations,
excluding restructuring charges and
acquisition-related expenses (Non-GAAP) 1
Net Income
Diluted Earnings Per Share:
Income from Continuing Operations
Income from Continuing Operations,
excluding restructuring charges and
acquisition-related expenses (Non-GAAP)1
Net Income
$921,173
208,715
65,111
46,882
47,133
47,110
$ 1.19
1.19
1.19
$914,975
229,580
87,035
60,562
60,562
60,462
$ 1.54
1.54
1.53
$726,866
190,591
49,117
30,241
38,926
26,171
$ 0.81
1.04
0.70
$536,664
129,597
33,882
24,076
24,076
21,640
$ 0.86
0.86
0.77
$495,570
99,108
13,530
12,866
12,866
2,543
$ 0.47
0.47
0.09
(1) For the 2009 Financial Reconciliation (Non-GAAP), see page A-1
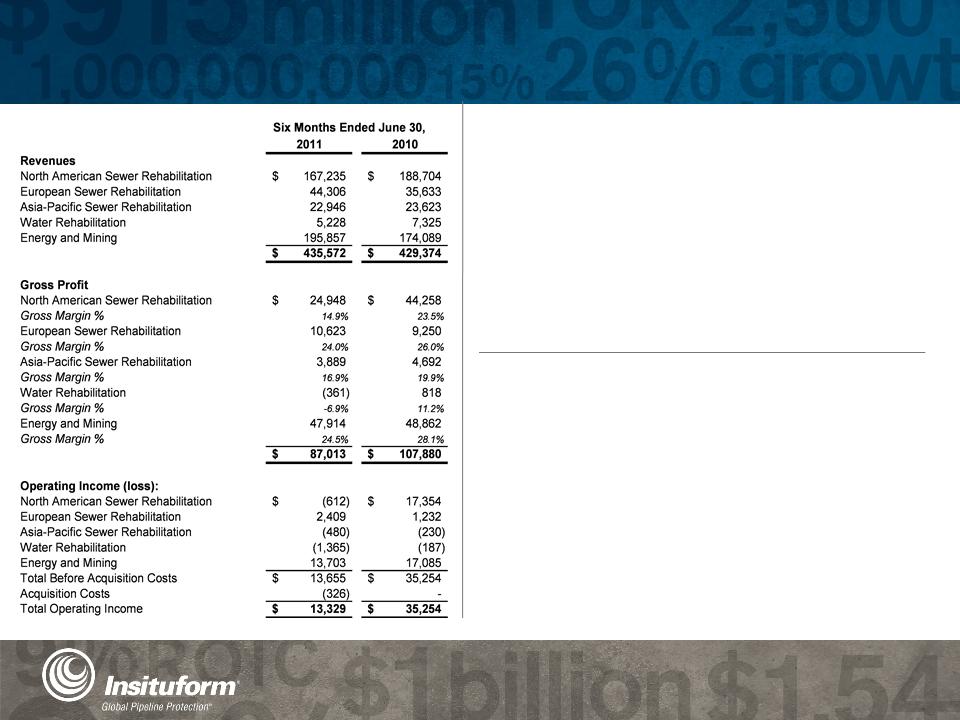
• Decline in NAR gross margins resulting from difficult market conditions
impacted project performance, magnified by a significant shift to small
diameter sizes pressured project management and crew operations
impacted project performance, magnified by a significant shift to small
diameter sizes pressured project management and crew operations
• Energy & Mining gross margin declined to 24.5% versus 28.1% in the
first half of 2010 as much of the revenue growth came from
regions/areas with lower project margins
first half of 2010 as much of the revenue growth came from
regions/areas with lower project margins
• Asia-Pacific gross profit declined as a result of weak margins of 16.9%
versus 19.9% in the same period of 2010 as older Indian projects
continued at low margins; this was partially offset by strong results in
Australia
versus 19.9% in the same period of 2010 as older Indian projects
continued at low margins; this was partially offset by strong results in
Australia
• Project bidding and release issues along with extreme weather
throughout the US significantly impacted NAR 2011 revenue,
contributing to the $21.5 million shortfall when compared to 2010
throughout the US significantly impacted NAR 2011 revenue,
contributing to the $21.5 million shortfall when compared to 2010
• Europe exceeded prior year results by 24.3% on strong results in the
Netherlands, Spain and European manufacturing offset by lower
revenue in the United Kingdom
Netherlands, Spain and European manufacturing offset by lower
revenue in the United Kingdom
• Energy & Mining increased $21.8 million when compared to the same
period of 2010 on strong growth in UPS and Corrpro
period of 2010 on strong growth in UPS and Corrpro
$87.0M
2011 YTD Review
4
$435.6M
Revenue
Gross Profit

5
Key Business Initiatives
SEWER REHABILITATION
• North America - Turn around
profitability through better disciplined
project management, estimating, bidding
and execution capabilities (both
manufacturing and contracting
businesses) and continued growth of
third-party product sales
profitability through better disciplined
project management, estimating, bidding
and execution capabilities (both
manufacturing and contracting
businesses) and continued growth of
third-party product sales
• Europe - Focus on improving
• profitability through optimizing
•installation businesses, expanding
•third-party tube sales throughout
•Europe and selectively targeting new
•lining products and services
• profitability through optimizing
•installation businesses, expanding
•third-party tube sales throughout
•Europe and selectively targeting new
•lining products and services
• Asia-Pacific - Continue growth in
Australia, Singapore, India and Hong
Kong and other parts of Asia and
expand third-party tube sales
expand third-party tube sales
through development of certified
installer program throughout Asia
ENERGY & MINING
• Expand service offering selectively
•through joint ventures and partnerships
• - specialty linings, robotic joint coating,
•through joint ventures and partnerships
• - specialty linings, robotic joint coating,
insulation coatings, double joint
welding, etc.
• Focus on selective geographic
•expansion (Middle East, Asia)
•expansion (Middle East, Asia)
• Continue investment in building
•business development opportunities for
•comprehensive service platform
•business development opportunities for
•comprehensive service platform
• Become well-positioned in key spend
•areas - Gulf of Mexico, Canadian Oil
•Sands, Middle East
•areas - Gulf of Mexico, Canadian Oil
•Sands, Middle East
OTHER INFRASTRUCTURE
• Develop broader infrastructure platform
to capitalize on growing infrastructure
needs globally with particular emphasis
on leveraging our North American
platform
to capitalize on growing infrastructure
needs globally with particular emphasis
on leveraging our North American
platform
• Build out a return-driven infrastructure
services platform to create leverage from
our existing businesses
services platform to create leverage from
our existing businesses
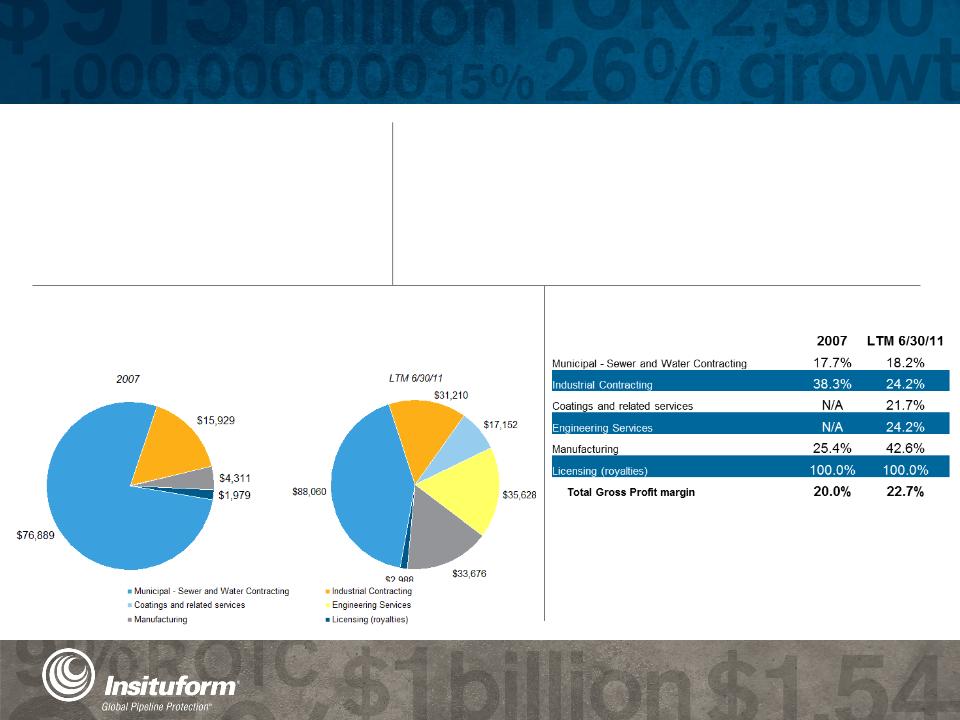
Financial Performance Trend
6
While municipal contracting remains Insituform's largest line of business, other
higher margin products and services are growing in prominence on our expanded
business platform
higher margin products and services are growing in prominence on our expanded
business platform
While Insituform's gross profit margin has improved compared
to previous years, we are focused on offering higher-margin
products and services to drive greater returns to our
stockholders. Insituform's overall LTM gross profit margin was
22.7%, a 14% increase over 2007
to previous years, we are focused on offering higher-margin
products and services to drive greater returns to our
stockholders. Insituform's overall LTM gross profit margin was
22.7%, a 14% increase over 2007
GROSS MARGIN BY PRODUCT
22.7%
LTM June 30, 2011 Gross Profit
Margin
LTM June 30, 2011 Gross Profit
Margin
GROSS PROFIT BY PRODUCT
(in thousands)
$209M
LTM June 30, 2011 Gross Profit
LTM June 30, 2011 Gross Profit
Focus on Returns
7
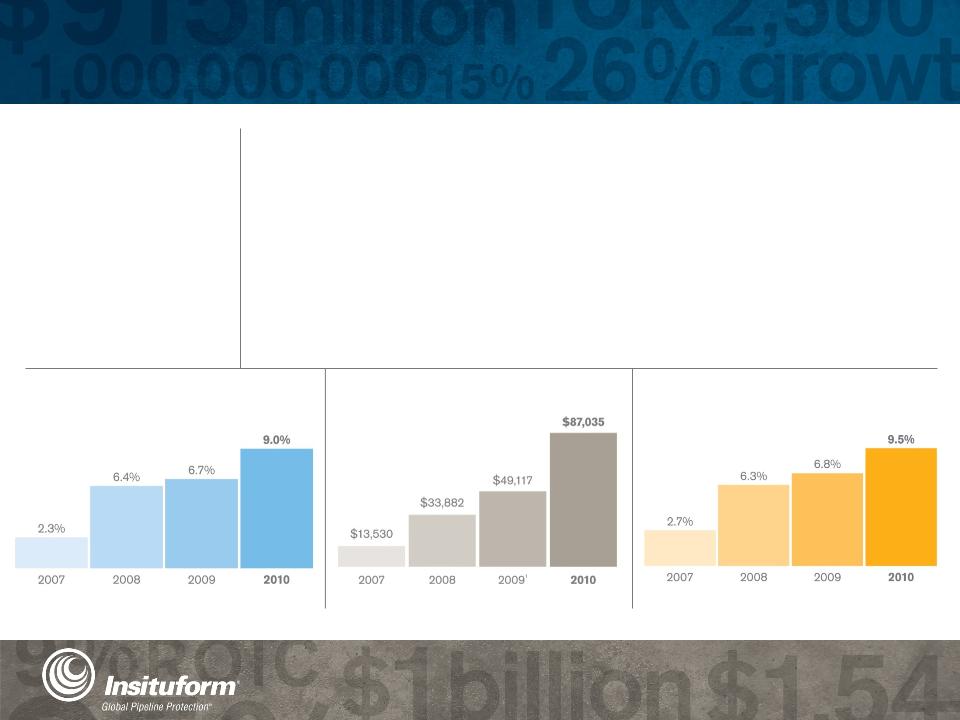
OPERATING INCOME
(in thousands)
INSITUFORM OPERATING MARGIN
OPERATING MARGIN UP 252% SINCE 2007
INSITUFORM ROIC
ROIC UP 291% SINCE 2007
• We have moved a long way towards our goal of achieving a 15% return on invested
• capital and 15% operating margin in 2012, but we have more work to do
• capital and 15% operating margin in 2012, but we have more work to do
• We anticipate achieving this target through:
15%
Target Return on Invested
Capital and Operating
Margin by 2012
Capital and Operating
Margin by 2012
- Driving profitable growth in our international markets through our Energy & Mining Platform (offshore
Gulf of Mexico, Canadian Oil Sands, Middle East and other high growth international markets)
Gulf of Mexico, Canadian Oil Sands, Middle East and other high growth international markets)
- Acquisition of higher margin, higher return profile businesses (CRTS, Fyfe and Hockway)
- Improve NAR’s execution capability and expand higher margin manufacturing
- profitability. We will continue to evaluate our contracting markets for appropriate risk/reward
- relationships
- profitability. We will continue to evaluate our contracting markets for appropriate risk/reward
- relationships
- Leveraging our operating cost structure
OPERATING INCOME UP 543% SINCE 2007
(1) For the 2009 Financial Reconciliation (Non-GAAP), see Page A-1

8
Business Units
Individually, these businesses apply their
specialized expertise to solving pipeline
challenges for the sewer, water, oil, gas and
mining industries. Collectively, they give
Insituform the comprehensive capabilities and
experience needed to serve the world’s pipeline
infrastructure. Given the synergies that exist
among them, they create a whole that is greater
than the sum of their parts
The following slides detail the
accomplishments of our primary
accomplishments of our primary
business units:
• Energy & Mining
• North American Sewer Rehabilitation
• European Sewer Rehabilitation
• Asia-Pacific Sewer Rehabilitation
The strength of Insituform’s performance is a
direct reflection of the contributions made by the
business units we operate.
direct reflection of the contributions made by the
business units we operate.

Energy & Mining
9
$404M
LTM June 30, 2011
LTM June 30, 2011
Energy & Mining Revenues
|
($ in “000”)
|
LTM
6/30/11 |
2010
|
2009(1)
|
2008
|
2007
|
|
Revenue
|
$ 404,013
|
$382,246
|
$ 241,678
|
$ 60,567
|
$ 41,606
|
|
Gross profit
|
104,361
|
105,309
|
67,185
|
18,250
|
15,929
|
|
Gross margin %
|
25.8%
|
27.5%
|
27.8%
|
30.1%
|
38.3%
|
|
Operating income
|
36,041
|
41,121
|
18,472
|
10,896
|
9,120
|
|
Operating margin %
|
8.9%
|
10.8%
|
7.6%
|
18.0%
|
21.9%
|
|
Backlog
|
168,156
|
146,095
|
180,178
|
18,703
|
26,225
|
2010 Performance Highlights
• Corrpro Companies and United Pipeline Systems (UPS)
experienced record revenues in 2010
experienced record revenues in 2010
• The Bayou Companies’ revenues significantly increased
due to expanded service offerings
due to expanded service offerings
• Backlog in the South American operation of our UPS
business increased to $20 million at December 30, 2010.
UPS’ North American operations also increased revenue by
35.2% to $37.3 million. UPS also opened an office in Oman
early in 2010
business increased to $20 million at December 30, 2010.
UPS’ North American operations also increased revenue by
35.2% to $37.3 million. UPS also opened an office in Oman
early in 2010
2011 Outlook
• For 2011 we anticipate robust growth in all of our
• Energy & Mining markets around the world
• Energy & Mining markets around the world
• Bayou’s Canadian pipe coating operation exceeded our 2010
• expectations, and we expect continued growth in 2011
• expectations, and we expect continued growth in 2011
• UPS is on track to continue the momentum of 2010 with
very strong YTD performance in 2011, with record backlog and
growing strength in South America, Australia and
very strong YTD performance in 2011, with record backlog and
growing strength in South America, Australia and
the Middle East
• Corrpro expects to grow revenues by more than 10%
(1) See Financial Reconciliation on Page A-2

2011 Outlook
• We expect municipal sewer markets to continue to be stable,
but bid table will improve in the second half of the year
but bid table will improve in the second half of the year
• We will turn around performance through:
- improve bidding and execution discipline
- Improve our project management capability
- Improve our crew deployment discipline
- focus on larger projects where risk / rewards are more
favorable
favorable
- increase efficiency of operating expenses
• We expect continued growth of our third-party tube sales
• through more aggressive market penetration
• through more aggressive market penetration
North American Sewer Rehabilitation (NAR)
10
|
($ in “000”)
|
LTM 6/30/11
|
2010
|
2009
|
2008(1)
|
2007(1)
|
|
Revenue
|
$ 379,169
|
$ 400,638
|
$ 354,418
|
$ 340,296
|
$ 348,085
|
|
Gross profit
|
73,770
|
93,078
|
91,346
|
75,435
|
58,890
|
|
Gross margin %
|
19.5%
|
23.2%
|
25.8%
|
22.2%
|
16.9%
|
|
Operating income
|
24,063
|
42,029
|
38,357
|
17,041
|
(3,367)
|
|
Operating margin %
|
6.3%
|
10.5%
|
10.8%
|
5.0%
|
-1.0%
|
|
Backlog
|
167,543
|
155,631
|
180,858
|
150,808
|
159,974
|
2010 Performance Highlights
• Operating income grew due to manufacturing profitability, increased
third-party tube sales and lower operating costs
third-party tube sales and lower operating costs
• First half 2011 results severely impacted by extreme weather
conditions along with delayed bid table; project release delays have
impacted project management and crew productivity dramatically
conditions along with delayed bid table; project release delays have
impacted project management and crew productivity dramatically
• Expect second half recovery with improved backlog and better
execution while project sizes and trend towards small diameter
projects will continue to impact margins to a certain extent
execution while project sizes and trend towards small diameter
projects will continue to impact margins to a certain extent
(1) See Financial Reconciliation on Page A-2

North American Sewer Rehabilitation (NAR)
11
Business Challenges
• Smaller project sizes (approximately $300K)
• Increased percentage of small diameter
projects (+85% ) - most competitive portion of
the market
projects (+85% ) - most competitive portion of
the market
• Volatile project / work releases
• Municipal customers constrained due to
continued economic headwinds
continued economic headwinds
Initiatives
• Improve estimating / bidding discipline
- project preparation, market intelligence and
margin thresholds
• Intense review of crew deployment
- ensure adequate production in front of crews
(reduce number of non-productive hours)
• Continuous improvement of project management talent
- better subcontractor management and project
close-out (improve cash flow)
• Vigilant review of support structure to ensure business
is competitive in a “commodity” market
is competitive in a “commodity” market
• More aggressive sales effort for third-party product
sales
sales
European Sewer Rehabilitation
12
44%
2010 Operating Income
Improvement over 2009
2010 Operating Income
Improvement over 2009
|
($ in “000”)
|
LTM 6/30/11
|
2010
|
2009(1)
|
2008(1)
|
2007
|
|
Revenue
|
$ 82,723
|
$74,050
|
$85,993
|
$104,225
|
$100,658
|
|
Gross profit
|
21,899
|
20,526
|
22,774
|
23,228
|
23,300
|
|
Gross margin %
|
26.5%
|
27.7%
|
26.5%
|
22.3%
|
23.1%
|
|
Operating income
|
6,293
|
5,116
|
3,561
|
964
|
5,368
|
|
Operating margin %
|
7.6%
|
6.9%
|
4.1%
|
0.9%
|
5.3%
|
|
Backlog
|
22,152
|
23,309
|
37,195
|
25,150
|
39,011
|
2010 Performance Highlights
• Gross margin increased from 26.5% in 2009 to 27.7% in 2010
• We achieved significant cost savings and increased
• margins through our 2009 restructuring initiative
• margins through our 2009 restructuring initiative
• Operating margins increased from 4.1% in 2009 to 6.9% for 2010
• We initiated production of the InsituMain® System, our
• cured-in-place pipe (CIPP) solution for pressure pipelines
• cured-in-place pipe (CIPP) solution for pressure pipelines
• We successfully tested a glass-fiber reinforced CIPP
• product, which will be manufactured in our UK facility
• product, which will be manufactured in our UK facility
2011 Outlook
• We anticipate growth in the Netherlands, in third-party tube
sales, and a slight recovery in the United Kingdom and France
sales, and a slight recovery in the United Kingdom and France
• We anticipate increasing second half margins through improved
• productivity and execution, lower operating costs and a mix
• shift that favors product sales over contracting revenues
• productivity and execution, lower operating costs and a mix
• shift that favors product sales over contracting revenues
• We will continue to expand our portfolio of trenchless products
• and services, including the full commercialization of our glass-
• fiber reinforced CIPP product
• and services, including the full commercialization of our glass-
• fiber reinforced CIPP product
(1) See Financial Reconciliation on Page A-2

Asia-Pacific Sewer Rehabilitation
13
323%
Revenue Growth since 2008
Revenue Growth since 2008
|
($ in “000”)
|
LTM 6/30/11
|
2010
|
2009(1)
|
2008
|
2007
|
|
Revenue
|
$ 42,816
|
$ 43,493
|
$ 33,256
|
$ 10,129
|
$ 973
|
|
Gross profit
|
9,306
|
10,108
|
9,032
|
2,938
|
544
|
|
Gross margin %
|
21.7%
|
23.2%
|
27.2%
|
29.0%
|
55.9%
|
|
Operating income
|
(146)
|
105
|
3,441
|
1,639
|
(507)
|
|
Operating margin %
|
(0.3)%
|
0.2%
|
10.3%
|
16.2%
|
-52.1%
|
|
Backlog
|
62,754
|
79,825
|
57,423
|
46,238
|
34,362
|
Performance Highlights
• We expanded our presence in Australia
• We reorganized our venture in India to become a specialty
contractor performing only lining (improved risk profile and
better cash flow)
contractor performing only lining (improved risk profile and
better cash flow)
• To promote tube sales in small-diameter markets, we
have continued our Certified Installer Program™ in
Singapore, Malaysia and China
have continued our Certified Installer Program™ in
Singapore, Malaysia and China
2011 Outlook
• Overall market growth in 2011 is expected to be strong throughout
the Asia-Pacific region. The Indian market should return to normal
conditions (recent project wins), and we anticipate achieving further
expansion into Australia and other newer markets, including Malaysia
the Asia-Pacific region. The Indian market should return to normal
conditions (recent project wins), and we anticipate achieving further
expansion into Australia and other newer markets, including Malaysia
• Demand for maintenance contracts will likely grow as more
municipalities learn of our services. Sewer pipes are generally older
and in worse condition in this region than in many parts of the world
municipalities learn of our services. Sewer pipes are generally older
and in worse condition in this region than in many parts of the world
(1) See Financial Reconciliation on Page A-2
Financial Strength
14
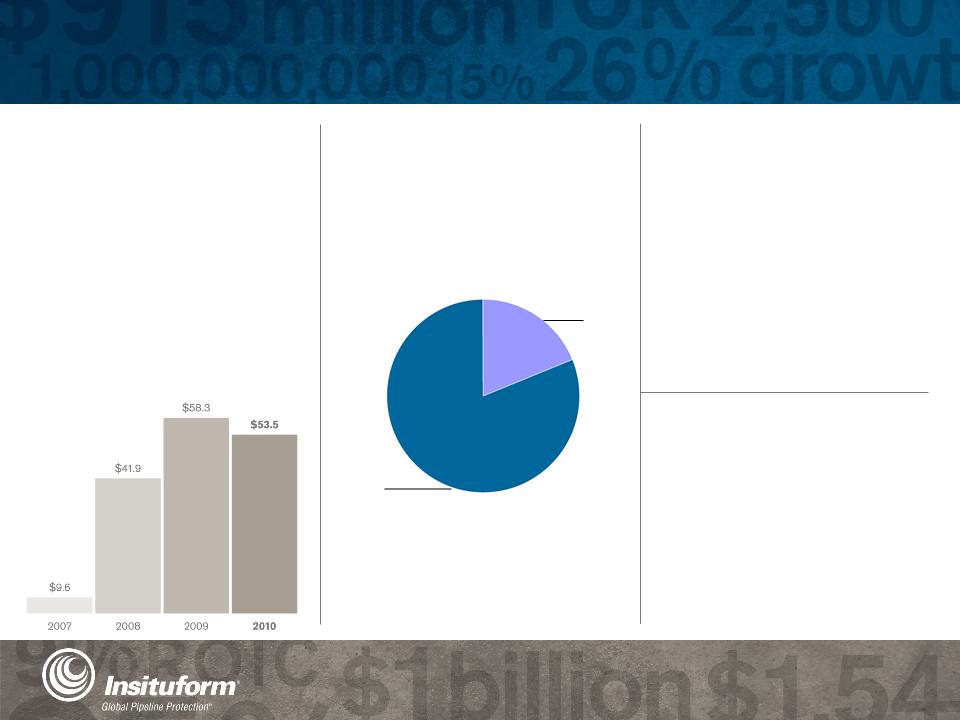
OPERATING CASH FLOW
$53.5MILLION
Insituform has historically produced strong operating
cash flows, and has increased it from $9.6 million in
2007 to $53.5 million in 2010. Operating cash flow
decreased slightly in 2010 compared to 2009 due to
an increase in our collection cycle as a result of the
global economic downturn. In 2010, many of our
customers, primarily municipalities, increased their
payment cycle
OPERATING CASH FLOW
(in millions)
INSITUFORM’S CURRENT
DEBT-TO-EQUITY 6/30/11
19%
Insituform’s debt-to-equity ratio is a sign of the
company’s financial strength. It also indicates we have
the flexibility to generate additional growth
company’s financial strength. It also indicates we have
the flexibility to generate additional growth
Total operating cash flow in 2010
UNRESTRICTED CASH
$108.0MILLION
Total unrestricted cash at
June 30, 2011
June 30, 2011
Unrestricted cash represents a company’s instant
monetary reserves. We increased Insituform’s
unrestricted cash to $108.0 million at June 30, 2011,
up from $79.0 million at year-end 2007. This 36.7%
increase in cash, together with our low debt, provides
us flexibility to pursue organic and inorganic growth
opportunities
monetary reserves. We increased Insituform’s
unrestricted cash to $108.0 million at June 30, 2011,
up from $79.0 million at year-end 2007. This 36.7%
increase in cash, together with our low debt, provides
us flexibility to pursue organic and inorganic growth
opportunities
STRONG
• A conservative capital structure and strong cash
position have enabled us to grow in uncertain
economic times
position have enabled us to grow in uncertain
economic times
• We now have the flexibility to use our balance
sheet strength to pursue growth opportunities,
including strategic acquisitions that will help us to
reach and exceed our return targets
sheet strength to pursue growth opportunities,
including strategic acquisitions that will help us to
reach and exceed our return targets
19%
Debt
81%
Equity

Growth Initiatives
15
WE ARE PURSUING OPPORTUNITIES
TO EXPAND CAPABILITY:
TO EXPAND CAPABILITY:
• Expand Energy and Mining presence in high growth geographies,
including the Middle East
including the Middle East
• Bolster our platform within infrastructure technologies and services
• Broader linings capabilities and insulation products in high spend
geographies - Gulf of Mexico, Canadian Oil Sands
geographies - Gulf of Mexico, Canadian Oil Sands
• Continue to broaden our Asia-Pacific platform positioning our
product/services to take advantage of theatre growth
product/services to take advantage of theatre growth

Acquisitions Overview:
16
CRTS, Inc. Acquisition Summary
Strategic Highlights
• Potential cross selling opportunities between Bayou, CCSI &
UPS - South America
UPS - South America
• Expands the OD Coating service line and footprint of CCSI
• Brings valuable technology, robotic capabilities, and IP
• Opportunity to bring custom coating to new customer base
in Tulsa
in Tulsa
• Possible catalyst for Bayou entry into foreign markets (i.e.
Middle East, South America)
Middle East, South America)
17
Acquisition Summary
• Stock purchase of Tulsa based business
• Transaction value $39 million ($24 million in cash at
closing and $15 million earnout opportunity)
closing and $15 million earnout opportunity)
• Closing Purchase Price was 5.7x 2010 CRTS audited
EBITDA: $4.2 million
EBITDA: $4.2 million
• Transaction closed June 30, 2011
• Awarded $48.4 million contract in Saudi Arabia in
July 2011
July 2011
Market Position
• The best proprietary robotic
coating technology in the industry
coating technology in the industry
• Experience and relationships -
CRTS has a long resume of
successful projects including $12.0
million Saudi contract completed in
2010
CRTS has a long resume of
successful projects including $12.0
million Saudi contract completed in
2010
Acquisition Summary
• Asset Purchase of Hockway Ltd. (UK Company)
• Stock Purchase of Hockway ME FZC (UAE Company)
• Purchase Price 6.5x 2010 Hockway audited EBITDA: $0.9 million
• $4.6 million cash at closing (75% of Purchase Price)
• Earnout: $1.5 million deferred as earnout (25% of Purchase Price)
• Based upon the attainment of business plan
• Additional Earnout: Seller may receive an additional 25% of Gross
Profit in excess of business plan
Profit in excess of business plan
• Closing date August 3, 2011
Hockway Acquisition Summary
18
• Strategic Highlights
• A catalyst to growth in the Middle East market.
• “Natural fit” with Corrpro operations in the United Kingdom and Middle East, will accelerate sales volume from
the region.
the region.
• Hockway's ATEX certified rectifier (explosion proof for use in hazardous areas) to be distributed worldwide
through Corrpro distribution channels.
through Corrpro distribution channels.
• Hockway’s relationships provides access to accounts and geographies that would be unattainable for Corrpro
alone in the near term (e.g. Iraq)
alone in the near term (e.g. Iraq)
• Strong ROIC - Good Backlog - Solid Reputation - Conduit to New Geographies ($140 million market).
Acquisition Summary
• Asset purchase of Fibrwrap Construction
US and Canada (installation entities)
with stock purchase of Fyfe Co
(manufacturing and engineering)
US and Canada (installation entities)
with stock purchase of Fyfe Co
(manufacturing and engineering)
• On July 26, 2011 signed definitive
agreement for to purchase Fyfe Group’s
North American operations for $115.8
million - anticipated closing August 31,
2011
agreement for to purchase Fyfe Group’s
North American operations for $115.8
million - anticipated closing August 31,
2011
• One-year option to buy Fyfe Group’s
international operations (Europe, Latin
America, Asia, Hong Kong) after
completion of satisfactory due diligence.
Anticipate closing transaction prior to
year-end 2011.
international operations (Europe, Latin
America, Asia, Hong Kong) after
completion of satisfactory due diligence.
Anticipate closing transaction prior to
year-end 2011.
FYFE Acquisition Summary
19
Highlights
• Market leader in North American FRP market and
holds 40+ patents worldwide
holds 40+ patents worldwide
• Significant barriers to entry including experience, IP,
testing, and certifications
testing, and certifications
• Good fit with existing ITI acumen - vertically
integrated fabric and resin experience
integrated fabric and resin experience
• Solution for large-diameter pressure pipe
applications
applications
• Opens new addressable markets in infrastructure
rehab - buildings, bridges, blast, waterfront, and
industrial
rehab - buildings, bridges, blast, waterfront, and
industrial

Appendix
Financial Reconciliation
(GAAP to Non-GAAP Information)
(GAAP to Non-GAAP Information)
|
2009 Financial Reconciliation (Non-GAAP)
(In thousands, except earnings per share [EPS] data)
|
|||
|
|
|
Amount
|
EPS
|
|
Income from continuing operations (as reported)
|
$ 30,241
|
$0.81
|
|
|
Restructuring charges
|
3,796
|
0.10
|
|
|
Acquisition-related expenses (credits)
|
4,889
|
0.13
|
|
|
Income from Continuing Operations, excluding
restructuring charges and acquisition-related expenses |
$ 38,926
|
$1.04
|
|
The following is a reconciliation of Insituform's financial information as shown in
presentation (GAAP to Non-GAAP) on Page 3:
presentation (GAAP to Non-GAAP) on Page 3:
A-1
|
European Sewer Rehabilitation
|
|||
|
($ in”000”)
|
As Reported 2009
|
Adjustment
|
Adjusted 2009
|
|
Revenue
|
$ 85,933
|
$ -
|
$ 85,993
|
|
Gross profit
|
22,774
|
-
|
22,774
|
|
Operating expense
|
20,430
|
(1,217)
|
19,213
|
|
Restructuring charges
|
3,349
|
(3,349)
|
-
|
|
Operating income
|
(1,005)
|
4,566
|
3,561
|
The following is a reconciliation of Insituform's financial information as shown in presentation (GAAP to Non-GAAP)
on Pages 10 through 13:
on Pages 10 through 13:
|
Asia-Pacific Sewer Rehabilitation
|
|||
|
($ in”000”)
|
As Reported 2009
|
Adjustment
|
Adjusted 2009
|
|
Revenue
|
$ 33,256
|
$ -
|
$ 33,256
|
|
Gross profit
|
9,032
|
-
|
9,032
|
|
Operating expense
|
5,591
|
-
|
5,591
|
|
Acquisition-related expenses
|
22
|
(22)
|
-
|
|
Operating income
|
3,419
|
22
|
3,441
|
|
Energy & Mining
|
|||
|
($ in”000”)
|
As Reported 2009
|
Adjustment
|
Adjusted 2009
|
|
Revenue
|
$ 241,678
|
$ -
|
$ 241,678
|
|
Gross profit
|
67,185
|
-
|
67,185
|
|
Operating expense
|
48,713
|
-
|
48,713
|
|
Restructuring charges
|
676
|
(676)
|
-
|
|
Acquisition-related expenses
|
6,872
|
(6,872)
|
-
|
|
Operating income
|
10,924
|
7,548
|
18,472
|
A-2
|
North American Sewer Rehabilitation (NAR)
|
|||
|
($ in”000”)
|
As Reported 2007
|
Adjustment
|
Adjusted 2007
|
|
Revenue
|
$ 348,085
|
$ -
|
$ 348,085
|
|
Gross profit
|
58,890
|
-
|
58,890
|
|
Operating expense
|
62,257
|
-
|
62,257
|
|
Settlement of litigation
|
(4,500)
|
4,500
|
-
|
|
Operating income
|
1,133
|
(4,500)
|
3,367
|
|
North American Sewer Rehabilitation (NAR)
|
|||
|
($ in”000”)
|
As Reported 2008
|
Adjustment
|
Adjusted 2008
|
|
Revenue
|
$ 340,296
|
$ -
|
$ 340,296
|
|
Gross profit
|
75,435
|
-
|
74,435
|
|
Operating expense
|
60,094
|
-
|
60,094
|
|
Proxy-related expenses
|
-
|
(1,700)
|
(1,700)
|
|
Operating income
|
15,341
|
1,700
|
17,041
|
|
European Sewer Rehabilitation
|
|||
|
($ in”000”)
|
As Reported 2008
|
Adjustment
|
Adjusted 2008
|
|
Revenue
|
$ 112,225
|
$ (8,000)
|
$ 104,225
|
|
Gross profit
|
31,228
|
(8,000)
|
23,228
|
|
Operating expense
|
23,564
|
-
|
23,564
|
|
Settlement of litigation
|
-
|
1,300
|
(1,300)
|
|
Operating income
|
7,664
|
(6,700)
|
964
|
Financial Reconciliation
(GAAP to Non-GAAP Information)
(GAAP to Non-GAAP Information)