Attached files
Table of Contents
UNITED STATES
SECURITIES AND EXCHANGE COMMISSION
WASHINGTON, D.C. 20549
FORM 10-K
(Mark One)
| x | ANNUAL REPORT PURSUANT TO SECTION 13 OR 15(d) OF THE SECURITIES EXCHANGE ACT OF 1934 |
For the fiscal year ended December 31, 2009
or
| ¨ | TRANSITION REPORT PURSUANT TO SECTION 13 OR 15(d) OF THE SECURITIES EXCHANGE ACT OF 1934 |
For the transition period from to
Commission File Number: 0-10786
Insituform Technologies, Inc.
(Exact name of registrant as specified in its charter)
| Delaware | 13-3032158 | |
| State or other jurisdiction of incorporation or organization |
(I.R.S. Employer Identification No.) |
| 17988 Edison Avenue, Chesterfield, Missouri | 63005-1195 | |
| (Address of principal executive offices) | (Zip Code) |
Registrant’s telephone number, including area code (636) 530-8000.
Securities registered pursuant to Section 12(b) of the Act:
| Title of each class |
Name of each exchange on which registered | |
| Class A Common Shares, $.01 par value | The Nasdaq Global Select Market | |
| Preferred Stock Purchase Rights | The Nasdaq Global Select Market |
Securities registered pursuant to Section 12(g) of the Act: None
Indicate by check mark if the registrant is a well-known seasoned issuer, as defined in Rule 405 of the Securities Act. Yes ¨ No x
Indicate by check mark if the registrant is not required to file reports pursuant to Section 13 of 15(d) of the Act. Yes ¨ No x
Indicate by a check mark whether the registrant (1) has filed all reports required to be filed by Section 13 or 15(d) of the Securities Exchange Act of 1934 during the preceding 12 months (or for such shorter period that the registrant was required to file such reports), and (2) has been subject to such filing requirements for the past 90 days. Yes x No ¨
Indicate by check mark whether the registrant has submitted electronically and posted on its corporate Web site, if any, every Interactive Data File required to be submitted and posted pursuant to Rule 405 of Regulation S-T (§232.405 of this chapter) during the preceding 12 months (or for such shorter period that the registrant was required to submit and post such files). Yes ¨ No ¨
Indicate by check mark if disclosure of delinquent filers pursuant to Item 405 of Regulation S-K(§229.405 of this chapter) is not contained herein, and will not be contained, to the best of registrant’s knowledge, in definitive proxy or information statements incorporated by reference in Part III of this Form 10-K or any amendment to this Form 10-K. x
Indicate by check mark whether the registrant is a large accelerated filer, an accelerated filer, a non-accelerated filer, or a smaller reporting company.
| Large accelerated filer | ¨ | Accelerated filer | x | |||
| Non-accelerated filer | ¨ | Smaller Reporting Company | ¨ | |||
Indicate by check mark whether the registrant is a shell company (as defined in Rule 12b-2 of the Exchange Act). Yes ¨ No x
State the aggregate market value of the voting and non-voting common equity held by non-affiliates computed by reference to the price at which the common equity was last sold, or the average bid and asked price of such common equity, as of June 30, 2009: $658,944,472
Indicate the number of shares outstanding of each of the registrant’s classes of common stock, as of the latest practicable date. Class A common shares, $.01 par value, as of February 25, 2009: 39,131,266 shares
DOCUMENTS INCORPORATED BY REFERENCE
As provided herein, portions of the documents below are incorporated by reference:
| Document |
Part – Form 10-K | |
| Registrant’s Proxy Statement for the 2010 Annual Meeting of Stockholders | Part III |
Table of Contents
| PART I |
||
| 3 | ||
| 11 | ||
| 17 | ||
| 17 | ||
| 18 | ||
| Item 4. [Reserved] |
||
| 18 | ||
| PART II |
||
| 19 | ||
| 21 | ||
| Item 7. Management’s Discussion and Analysis of Financial Condition and Results of Operations |
22 | |
| Item 7A. Quantitative and Qualitative Disclosures about Market Risk |
39 | |
| 40 | ||
| 40 | ||
| Item 9. Changes in and Disagreements with Accountants on Accounting and Financial Disclosure |
73 | |
| 73 | ||
| 73 | ||
| PART III |
||
| Item 10. Directors, Executive Officers and Corporate Governance |
74 | |
| 74 | ||
| 74 | ||
| Item 13. Certain Relationships and Related Transactions, and Director Independence |
74 | |
| 74 | ||
| PART IV |
||
| 75 | ||
| 76 | ||
2
Table of Contents
Note About Forward-Looking Information
The Private Securities Litigation Reform Act of 1995 provides a “safe harbor” for forward-looking statements. The Company makes forward-looking statements in this Annual Report on Form 10-K that represent the Company’s beliefs or expectations about future events or financial performance. These forward-looking statements are based on information currently available to the Company and on management’s beliefs, assumptions, estimates and projections and are not guarantees of future events or results. When used in this report, the words “anticipate,” “estimate,” “believe,” “plan,” “intend,” “may,” “will” and similar expressions are intended to identify forward-looking statements, but are not the exclusive means of identifying such statements. Such statements are subject to known and unknown risks, uncertainties and assumptions, including those referred to in the “Risk Factors” section of this Annual Report on Form 10-K for the year ended December 31, 2009. In light of these risks, uncertainties and assumptions, the forward-looking events discussed may not occur. In addition, our actual results may vary materially from those anticipated, estimated, suggested or projected. Except as required by law, we do not assume a duty to update forward-looking statements, whether as a result of new information, future events or otherwise. Investors should, however, review additional disclosures made by the Company from time to time in its periodic filings with the Securities and Exchange Commission. Please use caution and do not place reliance on forward-looking statements. All forward-looking statements made by the Company in this Annual Report on Form 10-K are qualified by these cautionary statements.
PART I
| Item 1. | Business. |
Overview
We are a leading worldwide provider of proprietary technologies and services for rehabilitating sewer, water, energy and mining piping systems and the corrosion protection of industrial pipelines. We offer one of the broadest portfolios of cost-effective solutions for rehabilitating aging or deteriorating pipelines and protecting new pipelines from corrosion. Our business activities include research and development, manufacturing, distribution, installation, coating and insulation, cathodic protection and licensing. Our products and services are currently utilized and performed in more than 36 countries across six continents. We believe that the depth and breadth of our products and services platform makes us a leading “one-stop” provider for the world’s pipeline rehabilitation and protection needs.
We have been an innovator in the markets we serve since our inception. In 1971, we invented a trenchless technology for rehabilitating sewer pipelines that enables municipalities and private industry to avoid the extraordinary expense and extreme disruption that can result from conventional “dig-and-replace” methods. Our platform has grown to include products and services for the rehabilitation and corrosion protection of new and existing water, oil, gas, mineral and chemical pipelines.
We were incorporated in Delaware in 1980, under the name Insituform of North America, Inc. We were originally formed to act as the exclusive licensee of the Insituform® cured-in-place-pipe (“CIPP”) process in most of the United States. When we acquired our licensor in 1992, our name changed to Insituform Technologies, Inc. Our business model has evolved from purely licensing technology and manufacturing materials to performing the entire Insituform® CIPP process and other trenchless technologies and rehabilitating and performing corrosion protection services for industrial pipelines in most geographic locations. Our business has also incorporated extensive research and development activities.
Recent Acquisitions
In early 2009, we expanded our operations in the energy and mining sector to include pipe coating and cathodic protection services. On February 20, 2009, we acquired the business of The Bayou Companies, L.L.C. and its related entities (“Bayou”). Our Bayou business provides cost-effective solutions to energy and infrastructure companies primarily in the Gulf of Mexico and North America. Bayou’s products and services include internal and external pipeline coating, lining, weighting and insulation. Bayou also provides specialty fabrication and services for offshore deepwater installations, including project management and logistics.
On March 31, 2009, we acquired Corrpro Companies, Inc. and its subsidiaries (“Corrpro”). Our Corrpro business offers a comprehensive line of fully-integrated corrosion protection products and services including: (i) engineering; (ii) product and material sales; (iii) construction and installation; (iv) inspection, monitoring and maintenance; and (v) coatings. Corrpro’s specialty in the corrosion control market is cathodic protection, an electrochemical process that prevents corrosion in new structures and stops the corrosion process for existing structures.
On June 30, 2009, we acquired the shares of our joint venture partner, VSL International Limited, in Insituform Pacific Pty Limited (“Insituform-Australia”) and Insituform Asia Limited (“Insituform-Hong Kong”), our former Australian and Hong Kong joint ventures, respectively, in order to expand our operations in both Australia and Hong Kong. These entities perform sewer and water pipeline rehabilitation services.
3
Table of Contents
On October, 30, 2009, we expanded our coating and insulation services in Canada with our acquisition of the pipe coating and insulation facility and related assets of Garneau, Inc., through our joint venture Bayou Perma-Pipe Canada, Ltd. (“BPPC”). We hold a fifty-one percent (51%) majority interest in BPPC through our wholly-owned Canadian subsidiary, Insituform Technologies Limited. BPPC serves as our pipe coating and insulation operations in Canada.
On December 3, 2009, we acquired the 25% noncontrolling interest in our CIPP tube manufacturing operation, now known as Insituform Linings Limited (“Insituform Linings”) in the United Kingdom, which had been owned by Per Aarsleff A/S, a Danish company. Insituform Linings manufactures CIPP tube for our European sewer rehabilitation operation and third-party sales.
On January 29, 2010, we acquired our Singapore CIPP licensee, Insitu Envirotech (S.E. Asia) Pte Ltd (“Insituform-Singapore”), in order to expand our Singapore operations. Insituform-Singapore performs sewer rehabilitation services in Southeast Asia.
As used in this Annual Report on Form 10-K, the terms “Company” and “Insituform Technologies” refer to Insituform Technologies, Inc. and, unless the context otherwise requires, its direct and indirect wholly-owned subsidiaries.
Available Information
Our website is www.insituform.com. We make available on this website under “Investors – SEC,” free of charge, our proxy statements used in conjunction with stockholder meetings, our annual reports on Form 10-K, quarterly reports on Form 10-Q, current reports on Form 8-K and Section 16 beneficial ownership reports (as well as any amendments to those reports) as soon as reasonably practicable after we electronically file such material with, or furnish it to, the Securities and Exchange Commission. In addition, our Code of Ethics for our Chief Executive Officer, Chief Financial Officer and senior financial employees, our Code of Conduct applicable to all of our officers, directors and employees, our Corporate Governance Guidelines and our Board committee charters are available, free of charge, on our website under “Investors – Corporate Governance.” In addition, paper copies of these documents will be furnished to any stockholder, upon request, free of charge.
Technologies
Pipeline System Rehabilitation – Sewer and Water
Our Insituform® CIPP Process for the rehabilitation of sewers, pipelines and other conduits utilizes a custom-manufactured tube, or liner, made of synthetic fiber. After the tube is saturated (impregnated) with a thermosetting resin mixture, it is installed in the host pipe by various processes, and the resin is then cured, by heat using hot water or steam, forming a new rigid pipe within a pipe.
Our iPlus Infusion® Process is a trenchless method used for the rehabilitation of small-diameter sewer pipelines, whereby a felt liner is continuously impregnated with liquid, thermosetting resin through a proprietary process. The liner is then pulled into the host pipe, inflated with air and cured with steam.
Our iPlus® Composite Process is a trenchless method used for the rehabilitation of large-diameter sewer pipelines, where the felt liner is reinforced with carbon or glass fiber, impregnated with liquid, thermosetting resin, inverted into place and cured with hot water or steam.
Our InsituMain™ System is a cured-in-place pipe solution for pressure pipes. The InsituMain™ System is for water mains and force mains up to 36-inches in diameter, can negotiate bends and is pressure-rated up to 150+ psi. The InsituMain™ System has also been certified as complying with ANSI/NSF Standard 61.
Our InsituGuard®, InsituFlex® and InsituFold® Processes are methods of rehabilitating transmission and distribution water mains using high-density polyethylene liners. Inserted into a new or existing pipeline by our proprietary installation processes, the liners are continuous and installed tightly against the inner wall of the host pipe, thereby isolating the flow stream from the host pipe wall and eliminating internal corrosion.
Our Thermopipe® Lining System is a polyester-reinforced polyethylene lining system for the rehabilitation of distribution water mains. The factory-folded “C” shape liner is winched into the host pipe from a reel and reverted with air and steam. Once inflated and heated, the liner forms a close-fit within the host pipe, creating a jointless, leak-free lining system.
Our iTAP® Process is a robotic method for reinstating service connections from inside a relined pipe. Traditionally, service connections are restored by excavating each service connection when a water distribution main is renewed with a trenchless process. iTAP™ provides a non-disruptive solution for relined pipe.
4
Table of Contents
Our Insituform RPP™ Process is a trenchless technology used for the rehabilitation of sewer force mains and industrial pressure pipelines. The felt tube is reinforced with glass and impregnated with liquid, thermosetting resin, after which it is inverted with water and cured with hot water to form a structural, jointless pipe within the host pipe.
Our Insituform PPL® Process is an ANSI/NSF 61 certified trenchless technology used for the rehabilitation of drinking water and industrial pressure pipelines. A glass-reinforced liner is impregnated with an epoxy resin, inverted with water and cured with hot water to form a jointless pipe lining within the host pipe.
Sliplining is a method used to push or pull a new pipeline into an old one. With segmented sliplining, short segments of pipe are joined to form the new pipe. For gravity sewer rehabilitation, these short segments can often be joined in a manhole or access structure, eliminating the need for a large pulling pit.
Pipeline System Rehabilitation and Protection – Energy and Mining
Our TiteLiner® process is a method of lining new and existing pipe with a corrosion and abrasion resistant high-density polyethylene pipe.
Our Safetyliner™ product is a grooved high-density polyethylene liner that is installed in an industrial pipeline using the Tite Liner® process. The Safetyliner™ liner is normally used in natural gas or CO2 pipelines to allow release of gas that permeates the HDPE liner. If gas is allowed to build in the annular space under normal operating conditions, the line can be susceptible to collapse upon sudden changes in operating pressures. The Safetyliner™ liner also has been used in pipelines as a leak detection system and for dual containment in mine water pipelines.
The Fusion-Bonded Epoxy Process utilizes heat to melt a dry powder fusion-bonded epoxy coating material into liquid form. The liquid material wets and flows onto the steel pipe and solidifies through a process called cross-linking. Once cured, this “fusion-bonded” epoxy cannot return to its original state and forms a protective barrier on the interior or exterior surface of the pipe.
Our InnerGard™ product is an internal fusion bond epoxy coating that provides corrosion protection for water injection lines and reduces costs compared to alloy pipe.
Our Enventure™ product is an internal lubricity coating for solid expandable downhole tubulars.
The Cathodic Protection process is an electrochemical process that prevents corrosion for new structures and stops the corrosion process for existing structures. Cathodic protection prevents the release of energy and reversion to its unrefined state by the cathode, the structure being protected, through the passing of an electrical current from an electrode, called an anode, placed near or connected to the cathode. In this process, the anode corrodes, sacrificing itself to protect the integrity of the cathode. Structures commonly protected by this process include oil and gas pipelines, offshore platforms, above and underground storage tanks, ships, electric power plants, bridges, parking garages, transit systems and water and wastewater treatment equipment.
Our CorrFlex® System is a linear anode system installed parallel to pipelines, often times to prevent stress corrosion cracking that can lead to ruptures on high pressure gas transmission pipelines.
Our CorrSpray® product is a metal alloy used for cathodic protection of steel reinforced concrete structures.
Our Green Rectifier™ system is an ecologically friendly method of cathodic protection using solar panels and a wind generator to power the cathodic protection process.
See “Patents” below for more information concerning these technologies.
Operations
Our operations are generally project-oriented. Our contracts are usually obtained through competitive bidding or negotiations and require performance at a fixed price or time and materials basis. The profitability of these contracts depends heavily upon the competitive bidding environment, our ability to estimate costs accurately and our ability to effectively manage and execute project performance. Project estimates may prove to be inaccurate due to unforeseen conditions or events. A substantial portion of the work on any given project may be subcontracted to third parties at a significantly lower profitability level to us than work directly performed by us.
5
Table of Contents
A majority of our installation operations are performed under contracts with municipal entities. The overall profitability of our installation operations is influenced not only by the profitability of specific project contracts, but also by the volume and timing of projects so that the installation operations are able to operate at, or near, capacity. Also, proper trenchless installation requires expertise that is acquired on the job and through training. Therefore, we provide ongoing training and appropriate equipment to our field installation crews.
Our energy and mining operations are generally performed under contracts with industrial entities. The overall profitability of our energy and mining operations is not only influenced by our execution and performance of the specific project contract, but also by the timing of the specific projects. Our energy and mining customers may elect to delay non-essential projects in response to certain market conditions, including lower commodity prices. These types of delays can affect our crew utilization and line capacity.
We are required to carry insurance and provide bonding in connection with certain projects and, accordingly, maintain comprehensive insurance policies, including workers’ compensation, general and automobile liability and property coverage. We believe that we presently maintain adequate insurance coverage for all operations. We have also arranged bonding capacity for bid, performance and payment bonds. Typically, the cost of a performance bond is less than 1% of the contract value. We are required to indemnify the surety companies against losses from third-party claims of customers and subcontractors. The indemnification obligations are collateralized by unperfected liens on our assets and the assets of those subsidiaries that are parties to the applicable indemnification agreement.
We generally invoice our customers periodically as work is completed. Under ordinary circumstances, collection from municipalities is made within 60 to 90 days of billing. In most cases, 5% to 15% of the contract value is withheld by the municipal owner pending satisfactory completion of the project. Collections from other customers are generally made within 30 to 45 days of billing.
We have five principal operating segments: North American Sewer Rehabilitation, European Sewer Rehabilitation, Asia-Pacific Sewer Rehabilitation, Water Rehabilitation and Energy and Mining. These segments have been determined based on the types of products sold and services performed by each segment, as well as geographic region, and each is regularly reviewed and evaluated separately.
Sewer Rehabilitation Operations
Our sewer rehabilitation activities are conducted principally through installation and other construction operations performed directly by us or our subsidiaries. In certain geographic regions, we have granted licenses to unaffiliated companies. As described under “Ownership Interests in Operating Licensees and Joint Ventures” below, we also have entered into contractual joint ventures from time to time to capitalize on our trenchless rehabilitation processes. Under these contractual joint venture relationships, work is bid by the joint venture entity and subcontracted to the joint venture partners or to third parties. The joint venture partners are primarily responsible for their subcontracted work, but both joint venture partners are liable to the customer for all of the work. Revenues and associated costs are recorded using percentage-of-completion accounting for our subcontracted portion of the total contract only. Our principal sewer rehabilitation activities are conducted in North America directly by us or through our wholly-owned subsidiaries. Our North American Sewer Rehabilitation operations, including research and development, engineering, training and financial support systems, are headquartered in Chesterfield, Missouri. During 2009, tube manufacturing and processing facilities for North America were maintained in nine locations, geographically dispersed throughout the United States and Canada.
Outside North America, we conduct Insituform® CIPP process rehabilitation operations in the United Kingdom, France, The Netherlands, Spain, Portugal, Switzerland, Hong Kong, Australia and Singapore through our wholly-owned subsidiaries and in India, Germany, Czech Republic, Slovakia, Hungary and Ireland through joint venture relationships. We announced the decision to close our operations in Belgium, Poland and Romania during the fourth quarter of 2009 as part of our European restructuring activities, which will allow us to concentrate our resources in geographies where we believe that we can realize a desired return on our investment. The results from these operations are included in our European Sewer Rehabilitation and Asia-Pacific Sewer Rehabilitation operating segments, as appropriate. We utilize multifunctional robotic devices developed by our French subsidiary in connection with the inspection and repair of pipelines. We also maintain a manufacturing facility in Wellingborough, England to support our European operation, which is headquartered near Paris, France.
Water Rehabilitation Operations
In addition to sewer rehabilitation, we have performed water rehabilitation operations since 2006 using our Insituform Blue® product portfolio. Under the Insituform Blue® brand, we restore water pipes using our InsituMain™, InsituGuard®, InsituFlex®, InsituFold® and Thermopipe® lining systems throughout North America, the United Kingdom and Hong Kong through our existing operations.
6
Table of Contents
Energy and Mining Operations
Our energy and mining operations perform rehabilitation and corrosion protection services for industrial, mineral, oil and gas piping systems. We also offer products for gas release and leak detection systems. Our worldwide energy and mining operations are headquartered in Chesterfield, Missouri. These operations are conducted through our United Pipeline Systems division, based in Durango, Colorado, and our Bayou and Corrpro subsidiaries, based in New Iberia, Louisiana, and Medina, Ohio, respectively. Certain of our energy and mining operations outside of the United States are conducted through our wholly-owned subsidiaries in the United Kingdom, Portugal, Chile, Canada, Kuwait, United Arab Emirates, Argentina and Brazil and through our Mexican joint venture subsidiary in which we own a 55% equity interest.
Our United Pipeline Systems division performs pipeline rehabilitation services using our proprietary Tite Liner® process. Our Bayou business performs internal and external pipeline coating, lining, weighting and insulation, as well as specialty fabrication and services for offshore deepwater installations, including project management and logistics. Our Corrpro business performs fully-integrated corrosion protection services including: (i) engineering; (ii) product and material sales; (iii) construction and installation; (iv) inspection, monitoring and maintenance; and (v) coatings; and specializes in cathodic protection.
Licensees
We have granted licenses for the Insituform® CIPP process, covering exclusive and non-exclusive territories, to licensees that provide pipe repair and rehabilitation services throughout their respective licensed territories. At December 31, 2009, the Insituform® CIPP process was licensed to six unaffiliated licensees that operate in the following countries: Bosnia, Croatia, Herzegovina, Japan, Province of Kosovo (Serbia), Malaysia, New Zealand, Norway, Singapore and Venezuela. We also have affiliated licensees in India and Ireland. As of January 29, 2010, however, we purchased our Singapore licensee, thereby terminating the license. There were no unaffiliated domestic licensees at December 31, 2009. The licenses generally grant to the licensee the right to utilize our know-how and the patent rights (where such rights exist) relating to the subject process, and to use our copyrights and trademarks.
In addition, we license our laterals patent portfolio (consisting of 16 United States patents) to six licensees in the United States for use in the United States and Canada. We also act as licensor under arrangements with approved installers relating to the use of our Thermopipe® lining process in the United Kingdom and elsewhere on a non-exclusive basis.
We have granted licenses for the Tite Liner® process, covering exclusive and non-exclusive territories, to licensees that provide pipe repair and rehabilitation services throughout their respective licensed territories. At December 31, 2009, the Tite Liner® process was licensed to four affiliated licensees that operate in the following countries: Mexico, Chile, Argentina and Brazil and two affiliated licensees in India and Ireland. There were no unaffiliated licensees. The licenses generally grant to the licensee the right to utilize our know-how and the patent rights (where such rights exist) relating to the subject process, and to use our copyrights and trademarks.
Our licensees generally are obligated to pay a royalty at a specified rate. Any improvements or modifications a licensee may make in the subject process during the term of the license agreement generally becomes our property or is licensed to us. Should a licensee fail to meet its royalty obligations or other material obligations, we may terminate the license at our discretion. Licensees, upon prior notice to us, may generally terminate the license for certain specified reasons. We may vary the terms of agreements entered into with new licensees according to prevailing conditions.
Ownership Interests in Operating Licensees and Project Ventures
We hold one-half of the equity interests in Insituform Rohrsanierungstechniken GmbH (“Insituform-Germany”), through our indirect subsidiary, Insituform Holdings (UK) Limited. Insituform-Germany provides sewer rehabilitation services in Germany and, through its subsidiaries, in Slovakia, Hungary and The Czech Republic. We license certain trademarks to Insituform-Germany for use in Germany, Hungary, Slovakia and The Czech Republic. The remaining interest in Insituform-Germany is held by Per Aarsleff A/S, an unaffiliated Danish contractor.
Through our subsidiary, Insituform Technologies Limited (UK), we hold one-half of the equity interest in Insituform Environmental Techniques Limited, a sewer rehabilitation contractor in Ireland. The remaining interest is held by Environmental Techniques Limited, an unaffiliated Irish contractor.
7
Table of Contents
We previously entered into a number of contractual joint ventures to develop joint bids on contracts for pipeline rehabilitation projects in India. The joint venture partner for each of these joint ventures is Subhash Projects and Marketing Ltd. (“SPML”), an unaffiliated Indian contractor. The joint ventures hold the contracts with the owner and subcontract that portion of the work requiring the Insituform® CIPP process to Insituform Pipeline Rehabilitation Private Limited, an entity majority owned by Insituform and minority owned by SPML (“Insituform-India”). Our more recent contracts in India are between the owner and Insituform-India.
Through our indirect subsidiary, INA Acquisition Corp., we hold fifty-five percent (55%) of the equity interest in United Pipeline de Mexico S.A. de C.V., our licensee of the Tite Liner® process in Mexico. The remaining ownership interest in United Pipeline de Mexico S.A. de C.V. is held by Miller Pipeline de Mexico S.A. de C.V., an unaffiliated Mexican company.
Through our subsidiary, Insituform Technologies Limited (Canada), we hold fifty-one percent (51%) of the equity interest in Bayou Perma-Pipe Canada, Ltd. The remaining interest is held by Perma-Pipe Canada, Inc., a subsidiary of MFRI, Inc., a U.S. company. This joint venture serves as our pipe coating and insulation operation in Canada.
Through our Bayou subsidiary, we hold forty-nine percent (49%) of the equity interest in Bayou Coating, LLC (“Bayou Coating”). The remaining interest is held by Stupp Brothers, Inc., a U.S. company (“Stupp”). Bayou Coating provides pipe coating services from its facility in Baton Rouge, Louisiana, and is adjacent to and services the Stupp pipe mill in Baton Rouge. From and after January 2014, solely during the month of January in each calendar year, Stupp has the option to acquire (i) the assets of Bayou Coating at their book value as of the end of the prior fiscal year (determined on the basis of Bayou Coating’s federal information tax return for such fiscal year), or (ii) the equity interest of Bayou in Bayou Coating at 49% of the value of Bayou Coating as determined under clause.
We have previously entered into teaming and other cooperative arrangements in various geographic regions throughout the world in order to develop cooperative bids on contracts for our HDPE pipeline rehabilitation and cathodic protection businesses. Typically, the arrangements provide for each participant to complete its respective scope of work, and we are not required to complete the other participant’s scope of work. We continue to investigate opportunities for expanding our business through such arrangements.
We previously entered into contractual joint ventures in other geographic regions in order to develop joint bids on contracts for our pipeline rehabilitation business. Typically, the joint venture entity holds the contract with the owner and subcontracts portions of the work to the joint venture partners. As part of the subcontracts, the partners usually provide bonds to the joint venture. We could be required to complete our joint venture partner’s portion of the contract if the partner were unable to complete its portion and a bond is not available. We continue to investigate opportunities for expanding our business through such arrangements.
Customers and Marketing
The marketing of sewer pipeline rehabilitation technologies is focused primarily on the municipal wastewater markets worldwide, which we expect to remain the largest part of our business for the foreseeable future. We offer our water rehabilitation products to municipal and corporate customers. We offer our energy and mining platform solutions worldwide to customers to protect new and existing pipelines and other structures. No customer accounted for more than 10% of our consolidated revenues during the years ended December 31, 2009, 2008 or 2007.
To help shape decision-making at every step, we use a highly-trained multi-level sales force structured around target markets and key accounts, focusing on engineers, consultants, administrators, technical staff and public officials. Due to the technical nature of our products and services, many of our sales personnel have engineering or technical expertise and experience. We also produce sales literature and presentations, participate in trade shows and execute other marketing programs for our own sales force and those of unaffiliated licensees. Our unaffiliated licensees are responsible for marketing and sales activities in their respective territories. See “Licensees” and “Ownership Interests in Operating Licensees and Joint Ventures” above for a description of our licensing operations and for a description of investments in licensees.
8
Table of Contents
Contract Backlog
Contract backlog is our expectation of revenues to be generated from received, signed and uncompleted contracts, the cancellation of which is not currently anticipated. Contract backlog excludes any term contract amounts for which there is not specific and determinable work released and projects where we have been advised that we are the low bidder, but have not formally been awarded the contract. The following table sets forth our consolidated backlog, by segment, as of December 31, 2009, 2008 and 2007, respectively.
| December 31, | |||||||||
| Backlog |
2009 | 2008 | 2007 | ||||||
| (In millions) | |||||||||
| North American Sewer Rehabilitation |
$ | 180.9 | $ | 150.8 | $ | 160.0 | |||
| European Rehabilitation |
37.2 | 25.2 | 35.6 | ||||||
| Asia-Pacific Sewer Rehabilitation (1) |
57.4 | 46.2 | 35.1 | ||||||
| Water Rehabilitation |
7.7 | 8.2 | 2.1 | ||||||
| Energy and Mining (2) |
180.2 | 18.7 | 26.2 | ||||||
| Total |
$ | 463.4 | $ | 249.1 | $ | 259.0 | |||
| (1) | Contract backlog for our Asia-Pacific Sewer Rehabilitation segment includes backlog for our recently acquired 100% ownership of our joint ventures in Hong Kong and Australia of $12.4 million and $34.0 million, respectively, at December 31, 2009. Contract backlog for these operations were not included prior to June 30, 2009, as they were not consolidated operations. |
| (2) | Contract backlog for our Energy and Mining segment includes backlog of our recently acquired Bayou and Corrpro businesses of $67.8 million and $55.1 million, respectively, at December 31, 2009. Such operations were not part of our Company as of December 31, 2008 or 2007. |
Although backlog represents only those contracts that are considered to be firm, there can be no assurance that cancellation or scope adjustments will not occur with respect to such contracts. We expect to perform a majority of the backlog reported above at December 31, 2009 during 2010. See “Risk Factors” in Item 1A of this report for further discussion regarding backlog.
Product Development
By using our own laboratories and test facilities, as well as outside consulting organizations and academic institutions, we continue to develop improvements to our proprietary processes, including the materials used and the methods of manufacturing and installing pipe. During the years ended December 31, 2009, 2008 and 2007, we spent $2.6 million, $3.0 million and $4.2 million, respectively, on research and development related activities, including engineering.
Manufacturing and Suppliers
We maintain our North American Insituform® CIPP process liner manufacturing facility in Batesville, Mississippi. In Europe, Insituform Linings, our now wholly-owned subsidiary, manufactures and sells Insituform® CIPP process liners from its plant located in Wellingborough, United Kingdom. In December 2009, we acquired the outstanding 25% interest of Per Aarsleff A/S, an unaffiliated Danish contractor, in Insituform Linings.
Although raw materials used in Insituform® CIPP Process products are typically available from multiple sources, our historical practice has been to purchase materials from a limited number of suppliers. We maintain our own felt manufacturing facility in Batesville. Substantially all of our fiber requirements are purchased from two sources, but there are alternate vendors readily available. We source our resin supply from multiple vendors.
We believe that the sources of supply for our Insituform® CIPP operations in both North America and Europe are adequate for our needs. Our pricing of raw materials is subject to fluctuations in the underlying commodity prices.
We currently source the manufacture and supply of our Thermopipe® lining products through a single vendor.
We sell Insituform® CIPP process liners and related products to third parties and certain licensees pursuant to fixed-term supply contracts.
We also manufacture certain equipment used in our Insituform® CIPP and Tite Liner® businesses.
9
Table of Contents
We are in the process of developing an Insituform® CIPP process liner manufacturing facility in Asia, which is anticipated to be operational during the second half of 2010.
Product and service revenues for our Bayou business are derived principally from internal and external pipeline coating, lining, weighting and insulation. Bayou also provides specialty fabrication services for offshore deepwater installations, including project management and logistics. Bayou facilities are located in New Iberia, Louisiana; Conroe, Texas; and Camrose, Alberta. The primary raw materials used in the coating process include fusion-bonded epoxy, paint, concrete, iron ore, sand and gravel. Although our historical practice has been to purchase materials from a limited numbers of suppliers, we believe that the raw materials used in the coating process are typically available from multiple sources.
Product and material revenues for our Corrpro business are derived principally from the sale of products that are purchased from select outside vendors or from assembling components that are sourced from suppliers. We conduct light assembly for a number of our Corrpro products in our production facilities in Sand Springs, Oklahoma; Edmonton, Canada; and the United Kingdom. In addition, we manufacture our own line of rectifiers and other power supplies in Canada. The primary products and raw materials used by our Corrpro businesses include zinc, aluminum, magnesium and other metallic anodes, as well as wire and cable. We maintain relationships with our vendors for these products and are not dependent on any single vendor to meet our supply needs.
Patents
As of December 31, 2009, we held 58 United States patents relating to the Insituform® CIPP process, the last of which will expire in 2023. As of December 31, 2009, we had 22 pending United States non-provisional patent applications relating to the Insituform® CIPP process.
We have obtained and are pursuing patent protection in our principal foreign markets covering various aspects of the Insituform® CIPP process. As of December 31, 2009, there were 83 issued foreign patents and utility models relating to the Insituform® CIPP processes, and 149 applications pending in foreign jurisdictions. Of these applications, ten are pending before the European Patent Office (designating all 34 member states) and one is a Patent Cooperation Treaty application that covers multiple jurisdictions in Europe and throughout the world. The specifications and/or rights granted in relation to each patent will vary from jurisdiction to jurisdiction. In addition, as a result of differences in the nature of the work performed and in the climate of the countries in which the work is carried out, not every licensee uses each patent, and we do not necessarily seek patent protection for all of our inventions in every jurisdiction in which we do business.
There can be no assurance that the validity of our patents will not be successfully challenged. Our business could be adversely affected by increased competition upon expiration of the patents or if one or more of our Insituform® CIPP process patents were adjudicated to be invalid or inadequate in scope to protect our operations. We believe in either case that our long experience with the Insituform® CIPP process, our continued commitment to support and develop the Insituform® CIPP process, the strength of our trademark and our degree of market penetration should enable us to continue to compete effectively in the pipeline rehabilitation market.
For our energy and mining operations, we hold twelve issued patents and one pending patent in the United States and 23 issued patents in foreign jurisdictions that relate to our cathodic protection business operated through our Corrpro subsidiaries. We believe that the success of our TiteLiner® process business, operated through our United Pipeline Systems division, depends primarily upon our proprietary know-how and our installation, marketing and sales skills. The success of our pipeline coatings process operating through our Bayou subsidiaries depends primarily on our know-how and manufacturing expertise as well as our marketing and sales skills.
See “Risk Factors” in Item 1A of this report for further discussion.
Competition
The markets in which we operate are highly competitive, primarily on the basis of price, quality of service and capacity to perform. Most of our products face direct competition from competitors offering similar or essentially equivalent products or services. In addition, customers can select a variety of methods to meet their pipe installation and rehabilitation, coating and cathodic protection needs, including a number of methods that we do not offer.
Most of our competitors are local or regional companies and may be either specialty contractors or general contractors. There can be no assurance as to the success of our processes in competition with these companies and alternative technologies for pipeline rehabilitation.
10
Table of Contents
Seasonality
Our operations can be affected by seasonal variations. Seasonal variations over the past five years have been minimal; however, our results tend to be stronger in the second and third quarters of each year due to milder weather. We are more likely to be impacted by weather extremes, such as excessive rain or hurricanes, snow and ice or frigid temperatures, which may cause temporary, short-term anomalies in our operational performance in certain localized geographic regions. However, these impacts usually have not been material to our operations as a whole. See “Risk Factors” in Item 1A of this report for further discussion.
Employees
As of December 31, 2009, we had approximately 3,000 employees. Certain of our subsidiaries and divisions are parties to collective bargaining agreements covering an aggregate of approximately 132 employees. We generally consider our relations with our employees and unions to be good.
Government Regulation
We are required to comply with all applicable United States federal, state and local, and all applicable foreign statutes, regulations and ordinances. In addition, our installation and other operations have to comply with various relevant occupational safety and health regulations, transportation regulations, code specifications, permit requirements, and bonding and insurance requirements, as well as with fire regulations relating to the storage, handling and transporting of flammable materials. Our manufacturing and coatings facilities, as well as our installation and other operations, are subject to federal and state environmental protection regulations, none of which presently have any material effect on our capital expenditures, earnings or competitive position in connection with our present business. However, although our installation and other operations have established monitoring programs and safety procedures, further restrictions could be imposed on the manner in which installation and other activities are conducted, on equipment used in installation and other activities and on the use of solvents or the thermosetting resins used in the Insituform® CIPP process.
The use of both thermoplastics and thermosetting resin materials in contact with drinking water is strictly regulated in most countries. In the United States, a consortium led by NSF International, under arrangements with the United States Environmental Protection Agency, establishes minimum requirements for the control of potential human health effects from substances added indirectly to water via contact with treatment, storage, transmission and distribution system components, by defining the maximum permissible concentration of materials that may be leached from such components into drinking water, and methods for testing them. In April 1997, the Insituform® PPL® liner was certified by NSF for use in drinking water systems, followed in April 1999 by NSF certification of the Insituform® RPP™ liner for such use. Our drinking water lining products also are NSF certified. NSF assumes no liability for use of any products, and NSF’s arrangements with the EPA do not constitute the EPA’s endorsement of NSF, NSF’s policies or its standards. Dedicated equipment is needed in connection with use of these products in drinking water applications.
| Item 1A. | Risk Factors. |
You should carefully consider the following risks and other information contained or incorporated by reference into this Annual Report on Form 10-K when evaluating our business and financial condition. Although the risks described below are risks that we face in our business that we believe are material, there may also be risks of which we are currently unaware or that we may view as immaterial based on the information currently available to us that may prove to be material in the future. There can be no assurance that we have correctly identified and appropriately assessed all factors affecting our business or that publicly available and other information with respect to these matters is complete and correct. Should any risks or uncertainties develop into actual events, such developments could have material adverse effects on our business, financial condition, cash flows and results of operations.
Our business is dependent on obtaining work through a competitive bidding process.
The markets in which we operate are highly competitive. Most of our products and services, including the Insituform® CIPP process, face direct competition from companies offering similar or essentially equivalent products or services. In addition, customers can select a variety of methods to meet their pipe installation and rehabilitation, coating and cathodic protection needs, including a number of methods that we do not offer. Competition also places downward pressure on our contract prices and profit margins. Intense competition is expected to continue in these markets, and we face challenges in our ability to maintain strong growth rates. If we are unable to meet these competitive challenges, we could lose market share to our competitors and experience an overall reduction in our profits.
11
Table of Contents
We may experience cost overruns on our projects.
We typically conduct our business under guaranteed maximum price or fixed price contracts, where we bear a significant portion of the risk for cost overruns. Under such contracts, prices are established in part on cost and scheduling estimates, which are based on a number of assumptions, including assumptions about future economic conditions, prices and availability of materials and other exigencies. Our profitability depends heavily on our ability to make accurate estimates. Inaccurate estimates, or changes in other circumstances, such as unanticipated technical problems, difficulties obtaining permits or approvals, changes in local laws or labor conditions, weather delays, cost of raw materials or our suppliers’ or subcontractors’ inability to perform could result in substantial losses, as such changes adversely affect the revenue and gross profit recognized on each project.
The preparation of our consolidated financial statements requires us to make estimates and judgments, which are subject to an inherent degree of uncertainty and which may differ from actual results.
Our consolidated financial statements are prepared in accordance with accounting principles generally accepted in the United States, which accounting principles require us to make estimates and judgments that affect the reported amounts of assets, liabilities, revenues and expenses and related disclosure of contingent assets and liabilities. Some accounting policies require the application of significant judgment by management in selecting the appropriate assumptions for calculating financial estimates. By their nature, these estimates and judgments are subject to an inherent degree of uncertainty and actual results may differ from these estimates and judgments under different assumptions or conditions, which may have an adverse effect on our financial condition or results of operations in subsequent periods.
Our use of the percentage-of-completion method of accounting could result in a reduction or reversal of previously recorded results.
We employ the percentage-of-completion method of accounting for our construction projects. This methodology recognizes revenues and profits over the life of a project based on costs incurred to date compared to total estimated project costs. Revisions to revenues and profits are made once amounts are known and/or can be reasonably estimated. Given the uncertainties associated with some of our contracts, it is possible for actual costs to vary from estimates previously made. Revisions to estimates could result in the reversal of revenues and gross profit previously recognized.
Our success and growth strategy depends on our senior management and our ability to attract and retain qualified personnel.
We depend on our senior management for the success and future growth of the operations and revenues of our Company, and the loss of any member of our senior management could have an adverse impact on our operations. Such a loss may be a distraction to senior management as we search for a qualified replacement, could result in significant recruiting, relocation, training and other costs and could cause operational inefficiencies as a replacement becomes familiar with our business and operations.
In addition, we use a multi-level sales force structured around target markets and key accounts, focusing on marketing our products and services to engineers, consultants, administrators, technical staff and elected officials; we are dependent on our personnel to continue to develop improvements to our proprietary processes, including materials used and the methods of manufacturing, installation, coating and cathodic protection; and we require quality field personnel to effectively and profitably perform our work. Our success in attracting and retaining qualified personnel is dependent on the resources available in individual geographic areas and the impact on the labor supply of general economic conditions, as well as our ability to provide a competitive compensation package and work environment. Our failure to attract, train, integrate and retain qualified personnel could have a significant effect on our financial condition and results of operations.
Our recognition of revenues from change orders, extra work or variations in the scope of work could be subject to reversal in future periods.
We recognize revenues from change orders, extra work or variations in the scope of work as set forth in our written contracts with our clients when management believes that realization of these revenues is probable and the recoverable amounts can be reasonably estimated. Prior to our decision to recognize these revenues, we consult with legal counsel to determine the likelihood of recovery and the amount of the recovery that can be estimated. We also factor in all other information that we possess with respect to the claim to determine whether the claim should be recognized at all and, if recognition is appropriate, what dollar amount of the claim should be recognized. Due to factors that we may not anticipate at the time of recognition, however, revenues ultimately received on these claims could be less than revenues that we recognized in a prior reporting period or periods, which could require us in subsequent reporting periods to reduce or reverse revenues and gross profit previously recognized.
12
Table of Contents
Extreme weather conditions may adversely affect our operations.
We are likely to be impacted by weather extremes, such as excessive rain or hurricanes, typhoons, snow and ice or frigid temperatures, which may cause temporary, short-term anomalies in our operational performance in certain localized geographic regions. Although we can make no assurances as to the future, historically, these impacts have not been material to our operations as a whole. Delays and other weather impacts could adversely affect our ability to meet project deadlines and may increase a project’s cost and decrease its profitability.
Certain of our Bayou facilities are located in a region that may be affected by natural disasters.
Certain of our Bayou facilities are located on the Gulf Coast in Louisiana. This region is subject to increased hurricane activity that can result in substantial flooding. Our Bayou facilities have in the past experienced damage due to floods. Although we maintain flood loss insurance where necessary, a hurricane, flood or other natural disaster could result in significant damage to our facilities, recovery costs and interruption to certain of our operations.
We may be liable to complete the work of our joint venture partners under our joint venture arrangements.
We enter into contractual joint ventures in order to develop joint bids on certain contracts. The success of these joint ventures depends largely on the satisfactory performance by our joint venture partners of their obligations under the joint venture. Under these joint venture arrangements, we may be required to complete our joint venture partner’s portion of the contract if the partner is unable to complete its portion and a bond is not available. In such case, the additional obligations could result in reduced profits or, in some cases, significant losses for us with respect to the joint venture.
A substantial portion of our raw materials is from a limited number of vendors, and we are subject to market fluctuations in the prices of certain commodities.
We purchase the majority of our fiber requirements for tube manufacturing from two sources. We believe, however, that alternate sources are readily available, and we continue to negotiate with other supply sources. The manufacture of the tubes used in our rehabilitation business is dependent upon the availability of resin, a petroleum-based product. We currently have qualified four resin suppliers from which we intend to purchase the majority of our resin requirements for our North American operations. For our European operations, we currently have qualified four resin suppliers and are in the process of qualifying additional suppliers. We believe that these and other sources of resin supply are readily available. Historically, resin prices have fluctuated on the basis of the prevailing prices of oil, and we anticipate that prices will continue to be heavily influenced by the events affecting the oil market.
The primary products and raw materials used by our Corrpro operations include zinc, aluminum, magnesium and other metallic anodes, as well as wire and cable. We believe that Corrpro has multiple sources available for these raw materials and is not dependent on any single vendor to meet its supply needs. The prices of these raw materials have historically been affected by the prices of energy, petroleum, steel and other commodities, tariffs and duties on imported materials and foreign currency and exchange rates. A significant increase in the prices of these raw materials could adversely affect our results of operations.
In addition, we purchase a significant volume of fuel to operate our trucks and equipment. At present, we do not engage in any type of hedging activities to mitigate the risks of fluctuating market prices for oil or fuel. A significant increase in the price of oil could cause an adverse effect on our cost structure that we may not be able to recover from our customers.
International trade tariffs and restrictions in the steel market may adversely affect our Bayou business.
The business of our subsidiary, Bayou, is heavily dependent on providing products and services to customers that import steel pipe into the United States from the international markets. To the extent that trade tariffs and other restrictions imposed by the United States increase the price of, or limit the amount of, steel pipe imported into the United States, the demand from Bayou’s customers for Bayou’s products and services will be diminished, which will adversely affect Bayou’s revenues and profitability.
Our business depends upon the maintenance of our proprietary technologies and information.
We depend upon our proprietary technologies and information, most of which are no longer subject to patent protection. We rely principally upon trade secret and copyright laws to protect our proprietary technologies. We regularly enter into confidentiality agreements with our key employees, customers and potential customers and limit access to and distribution of our trade secrets and other proprietary information. These measures may not be adequate to prevent misappropriation of our technologies or to assure that our competitors will not independently develop technologies that are substantially equivalent or superior to our technologies. In addition, the laws of other countries in which we operate may not protect our proprietary rights to the same extent as the laws of the United States. We are also subject to the risk of adverse claims and litigation alleging infringement of intellectual property rights.
13
Table of Contents
We are subject to a number of restrictive debt covenants under our senior notes and line of credit facility.
At December 31, 2009, we had $65.0 million in senior notes outstanding due April 2013. On March 31, 2009, we entered into a $115.0 million credit facility with a lending syndicate headed by Bank of America, N.A., which expires on March 31, 2012. The credit facility consists of a $65.0 million revolving line of credit and a $50.0 million three-year term loan. The entire amount of the term loan was drawn on March 31, 2009, in connection with our acquisition of Corrpro. At December 31, 2009, $42.5 million of the term loan was outstanding. At December 31, 2009, we had $22.5 million in letters of credit issued and outstanding and no other outstanding borrowings under our revolving line of credit. Our senior notes and our line of credit facility contain certain restrictive debt covenants and other customary events of default. These covenants limit the amount and type of debt we can incur and fixed charges as a measure of operating cash flow. Our ability to comply with these restrictive covenants may be affected by the factors described in this “Risk Factors” section of this Annual Report on Form 10-K and other factors outside our control. Failure to comply with one or more of these restrictive covenants may result in an event of default.
Upon an event of default, if not waived by our lenders, our lenders may declare all amounts outstanding as due and payable. At December 31, 2009, we were in compliance with all of our debt covenants as required under the senior notes and credit facility. If we are unable to comply with the restrictive covenants in the future, we would be required to obtain amendments or waivers from our lenders or secure another source of financing. If our current lenders accelerate the maturity of our indebtedness, we may not have sufficient capital available at that time to pay the amounts due to our lenders on a timely basis. In addition, these restrictive covenants may prevent us from engaging in transactions that benefit us, including responding to changing business and economic conditions and taking advantage of attractive business opportunities.
Our senior notes can be repaid at any time at par value plus a make-whole payment. The make-whole payment is calculated as the present value of the principal and remaining interest payments discounted at a reinvestment rate equal to the yield on the United States Treasury security with a maturity equal to the average life to maturity plus 50 basis points. At December 31, 2009, this make-whole payment would have approximated $7.7 million.
Our sewer and water rehabilitation revenues are substantially dependent on municipal government spending.
Many of our customers are municipal governmental agencies, and as such, we are dependent on municipal spending. Spending by our municipal customers can be affected by local political circumstances, budgetary constraints and other factors. Consequently, future municipal spending may not be allocated to projects that would benefit our business or may not be allocated in the amounts or for the size of the projects that we anticipated. A decrease in municipal spending on such projects would adversely impact our revenues, results of operations and cash flows.
Cyclical downturns in the mining, oil and natural gas industries, or in the oilfield and mining services businesses, may have a material adverse effect on our financial condition or results of operations.
The mining, oil and natural gas industries are highly cyclical. Demand for the majority of our oilfield and mining products and services is substantially dependent on the level of expenditures by the mining, oil and natural gas industries for the exploration, development and production of mined minerals, crude oil and natural gas reserves, which are sensitive to the prices of these commodities and generally dependent on the industry’s view of future mined mineral, oil and natural gas prices. There are numerous factors affecting the supply of and demand for our products and services, which include, but are not limited to:
| • | market prices of mined minerals, oil and natural gas and expectations about future prices; |
| • | cost of producing mined minerals, oil and natural gas; |
| • | the level of mining, drilling and production activity; |
| • | the discovery rate of new oil and gas reserves; |
| • | mergers, consolidations and downsizing among our clients; |
| • | coordination by the Organization of Petroleum Exporting Countries (OPEC); |
| • | the impact of commodity prices on the expenditure levels of our clients; |
| • | financial condition of our client base and their ability to fund capital and maintenance expenditures; |
| • | adverse weather conditions; |
| • | civil unrest in oil-producing countries; |
| • | level of consumption of minerals, oil, natural gas and petrochemicals by consumers; and |
| • | availability of services and materials for our clients to grow their capital expenditures. |
14
Table of Contents
The mining, oil and natural gas industries have historically experienced periodic downturns, which have been characterized by diminished demand for our oilfield and mining products and services and downward pressure on the prices we charge. A significant downturn in the mining, oil and natural gas industries could result in a reduction in demand for oilfield services and could adversely affect our operating results.
Our Corrpro business is party to certain contracts with the U.S. government that may be terminated by the U.S. government at any time without cause.
Our Corrpro business sells products and services to the U.S. government, including the U.S. Navy and U.S. Army. These government contracts generally contain standard provisions that permit the U.S. government to terminate these contracts without cause. In the event of such a termination, we are entitled to receive reimbursement for costs plus a reasonable profit on the basis of our work completed. In addition, these contracts may contain certain completion schedule requirements that would require our payment of liquidated damages if such requirements are not met as a result of circumstances within our control. The government procurement programs under which these contracts are issued are also subject to budget reductions and reallocations as well as policy changes that could alter the demand for our products and services under these contracts. Such cutbacks or policy changes could, therefore, adversely impact our revenues.
The general downturn in U.S. economic conditions, and specifically a downturn in the municipal bond market, may reduce our business prospects and decrease our revenues and cash flows.
Our business is affected by general economic conditions. Any extended weakness in the U.S. economy could reduce our business prospects and could cause decreases in our revenues and operating cash flows. Specifically, a downturn in the municipal bond market caused by an actual downgrade of monoline insurers could result in our municipal customers being required to spend municipal funds previously allocated to projects that would benefit our business to pay off outstanding bonds.
We have international operations that are subject to foreign economic and political uncertainties and foreign currency fluctuation.
Through our international subsidiaries and joint ventures, our business is subject to fluctuations in demand and changing international economic and political conditions that are beyond our control. For the years ended December 31, 2009 and 2008, 33.9% and 39.2%, respectively, of our revenues were derived from international operations. We expect a significant portion of our revenues and profits to come from international operations and joint ventures for the foreseeable future and to continue to grow over time. Operating in the international marketplace exposes us to a number of risks, including abrupt changes in foreign government policies and regulations, demands for payments that may be illegal under U.S. law and, in some cases, international hostilities. To the extent that our international operations are affected by unexpected and adverse foreign economic and political conditions, we may experience project disruptions and losses that could significantly reduce our revenues and profits.
From time to time, our contracts may be denominated in foreign currencies, which will result in additional risk of fluctuating currency values and exchange rates, hard currency shortages and controls on currency exchange. Changes in the value of foreign currencies could increase our U.S. dollar costs for, or reduce our U.S. dollar revenues from, our foreign operations. Any increased costs or reduced revenues as a result of foreign currency fluctuations could affect our profits.
Our backlog is an uncertain indicator of our future earnings.
Our backlog, which at December 31, 2009 was approximately $463.4 million, is subject to unexpected adjustments and cancellation. The revenues projected in this backlog may not be realized or, if realized, may not result in profits. We may be unable to complete some projects included in our backlog in the estimated time and, as a result, such projects could remain in the backlog for extended periods of time. To the extent that we experience project cancellation or scope adjustments, we could face a reduction in the dollar amount of our backlog and the revenues that we actually receive from such backlog.
Our bonding capacity may be limited in certain circumstances.
A significant portion of our projects require us to procure a bond to secure performance. From time to time, it may be difficult to find sureties who will provide the contract-required bonding at acceptable rates for reasons beyond our control (for example, as a result of changing political or economic conditions in a foreign country). With respect to our joint ventures, our ability to obtain a bond also may depend on the credit and performance risks of our joint venture partners, some of whom may not be as financially strong as we are. Our inability to obtain bonding on favorable terms could have a material adverse effect on our business.
15
Table of Contents
Our efforts to develop new products and services or enhance existing products and services involve substantial research, development and marketing expenses, and the resulting new or enhanced products or services may not generate sufficient revenues to justify such expenses.
We place a high priority on developing new products and services, as well as enhancing our existing products and services. As a result of these efforts, we may be required to expend substantial research, development and marketing resources, and the time and expense required to develop a new product or service or enhance an existing product or service are difficult to predict. We cannot assure that we will succeed in developing, introducing and marketing new products or services or product or service enhancements. In addition, we cannot be certain that any new or enhanced product or service will generate sufficient revenues to justify the expenses and resources devoted to this product diversification effort.
We occasionally access the financial markets to finance a portion of our working capital requirements and support our liquidity needs. Our ability to access these markets may be adversely affected by factors beyond our control and could negatively impact our ability to finance our operations, meet certain obligations or implement our operating strategy.
We occasionally borrow under our existing credit facility to fund operations, including working capital investments. Market disruptions such as those recently experienced in the United States and abroad have materially impacted liquidity in the credit and debt markets, making financing terms for borrowers less attractive and, in certain cases, resulting in the unavailability of certain types of financing. Continued uncertainty in the financial markets may negatively impact our ability to access additional financing or to refinance our existing credit facility or existing debt arrangements on favorable terms or at all, which could negatively affect our ability to fund current and future expansion as well as future acquisitions and development. These disruptions may include turmoil in the financial services industry, volatility in the markets where our outstanding securities trade and general economic downturns in the areas where we do business. If we are unable to access funds at competitive rates, or if our short-term or long-term borrowing costs increase, our ability to finance our operations, meet our short-term obligations and implement our operating strategy could be adversely affected.
The execution of our growth strategy is dependent upon the continued availability of third-party financing arrangements for our customers.
The recent economic downturn has resulted in tighter credit markets, which could adversely affect our customers’ ability to secure the financing necessary to proceed or continue with pipe installation, rehabilitation, coating or cathodic protection projects. Our customers’ or potential customers’ inability to secure financing for projects could result in the delay, cancellation or downsizing of new projects or the suspension of projects already under contract, which could cause a decline in the demand for our services and negatively impact our revenues and earnings.
The market price of our common stock is highly volatile and may result in investors selling shares of our common stock at a loss.
The trading price of our common stock is highly volatile and subject to wide fluctuations in price in response to various factors, many of which are beyond our control, including:
| • | actual or anticipated variations in quarterly operating results; |
| • | changes in financial estimates by securities analysts that cover our stock or our failure to meet these estimates; |
| • | conditions or trends in the U.S. sewer rehabilitation market; |
| • | conditions or trends in mined materials, oil and natural gas markets; |
| • | changes in municipal and corporate spending practices; |
| • | a downturn of the municipal bond market or lending markets generally; |
| • | changes in market valuations of other companies operating in our industries; |
| • | announcements by us or our competitors of a significant acquisition or divestiture; and |
| • | additions or departures of key personnel. |
In addition, the stock market in general and the Nasdaq Global Select Market in particular have experienced extreme price and volume fluctuations that may be unrelated or disproportionate to the operating performance of listed companies. Industry factors may seriously harm the market price of our common stock, regardless of our operating performance. Such stock price volatility could result in investors selling shares of our common stock at a loss.
16
Table of Contents
Future sales of our common stock or equity-linked securities in the public market could adversely affect the trading price of our common stock and our ability to raise funds in new stock offerings.
Sales of substantial numbers of additional shares of our common stock or any shares of our preferred stock, including sales of shares in connection with any future acquisitions, or the perception that such sales could occur, may have a harmful effect on prevailing market prices for our common stock and our ability to raise additional capital in the financial markets at a time and price favorable to us. We may issue equity securities in the future for a number of reasons, including to finance our operations and business strategy, to adjust our ratio of debt to equity, to satisfy obligations upon exercise of outstanding warrants or options or for other reasons. Our restated certificate of incorporation, as amended, provides that we have authority to issue 60,000,000 shares of common stock. As of December 31, 2009, 38,933,944 shares of common stock were issued and outstanding.
Provisions in our restated certificate of incorporation, as amended, could make it more difficult for a third party to acquire us or could adversely affect the rights of holders of our common stock or the market price of our common stock.
Our restated certificate of incorporation, as amended, provides that our Board of Directors has the authority, without any action of our stockholders, to issue up to 2,000,000 shares of preferred stock. Preferred stock may be issued upon such terms and with such designations as our Board of Directors may fix in its discretion, including with respect to: the payment of dividends upon our liquidation, dissolution or winding up; voting rights that dilute the voting power of our common stock; dividend rates; redemption or conversion rights; liquidation preferences; or voting rights.
In addition, our restated certificate of incorporation, as amended, provides that subject to the rights of the holders of any class or series of preferred stock set forth in our restated certificate of incorporation, as amended, the certificate of designation relating to such class or series of preferred stock, or as otherwise required by law, any stockholder action may be taken only at a meeting of stockholders and may not be effected by any written consent by such stockholders. The affirmative vote of the holders of at least 80% of the capital stock entitled to vote for the election of directors is required to amend, repeal or adopt any provision inconsistent with such arrangement.
These provisions could potentially be used to discourage attempts by others to obtain control of our Company through merger, tender offer, proxy, consent or otherwise by making such attempts more difficult or more costly, even if the offer may be considered beneficial by our stockholders. These provisions also may make it more difficult for stockholders to take action opposed by our Board of Directors or otherwise adversely affect the rights of holders of our common stock or the market price of our common stock.
We do not intend to pay cash dividends on our common stock in the foreseeable future.
We do not anticipate paying cash dividends on our common stock in the foreseeable future. Our present policy is to retain earnings to provide for the operation and expansion of our business. Any payment of cash dividends will depend upon our earnings, financial condition, cash flows, financing agreements and other factors deemed relevant by our Board of Directors. Furthermore, under the terms of certain debt arrangements to which we are a party, we are subject to certain limitations on paying dividends.
| Item 1B. | Unresolved Staff Comments. |
None.
| Item 2. | Properties. |
We own our executive offices located in Chesterfield, Missouri, a suburb of St. Louis, at 17988 Edison Avenue. We also own our research and development and training facilities in Chesterfield.
We own a liner manufacturing facility and a contiguous felt manufacturing facility in Batesville, Mississippi. Insituform Linings, our U.K. manufacturing company, owns certain premises in Wellingborough, United Kingdom, where its liner manufacturing facility is located.
Our wholly-owned subsidiary, Bayou Welding Works, L.L.C. owns a pipe yard in New Iberia, Louisiana. Commercial Coating Services International, Ltd, another wholly-owned subsidiary, owns property in Bakersfield, California and Conroe, Texas that are used as office space. Our subsidiary, Bayou Coating, L.L.C, owns a manufacturing facility in Baton Rouge, Louisiana. Our subsidiary, The Bayou Companies, Inc., leases approximately 217 acres from the Port of Iberia and other property owners in Louisiana of which certain portions have been subleased to our other Bayou subsidiaries.
Our joint venture subsidiary, Bayou Perma-Pipe Canada, Ltd., owns a pipe coating and insulation facility in Camrose, Alberta Canada.
17
Table of Contents
Corrpro, our wholly-owned subsidiary, owns certain office and warehouse space in Medina, Ohio. Its subsidiary, Corrpro Canada Inc, also owns certain premises in Edmonton, Alberta, Canada and Estevan, Saskatchewan, Canada used for office and warehouse space. In addition, our Corrpro subsidiary in the United Kingdom, Corrpro Europe Limited, owns an office and production facility in Stockton-on-Tees, United Kingdom.
We own or lease various operational facilities in the United States, Canada, Europe, Latin America and Asia.
The foregoing facilities are regarded by management as adequate for the current requirements of our business.
| Item 3. | Legal Proceedings. |
We are involved in certain actions incidental to the conduct of our business and affairs. Management, after consultation with legal counsel, does not believe that the outcome of any such actions will have a material adverse effect on our consolidated financial condition, results of operations or cash flows.
| Item 4A. | Executive Officers of the Registrant. |
Our executive officers, and their respective ages and positions with us, are as follows:
| J. Joseph Burgess | 51 | President and Chief Executive Officer | ||
| David F. Morris | 48 | Senior Vice President, Chief Administrative Officer, General Counsel and Secretary | ||
| David A. Martin | 42 | Senior Vice President and Chief Financial Officer | ||
| Holly S. Sharp | 38 | Vice President – Human Resources and Environmental, Health and Safety | ||
| Kenneth L. Young | 58 | Vice President and Treasurer |
J. Joseph Burgess has served as our President and Chief Executive Officer since April 2008. Mr. Burgess previously served as President and Chief Executive Officer of Veolia Water North America (a leading provider of water and wastewater services to municipal, federal and industrial customers) from 2005 until joining our Company in 2008. Prior to that, he was Chief Operating Officer of Veolia Water North America from 2003 to 2005 and Vice President and General Manager for the Northeast business center from 2002 to 2003. Previously, he was Executive Vice President for Water Systems Operations for Ogden Projects (later renamed Covanta Water; a subsidiary of Ogden Corporation that specialized in waste-to-energy projects for municipalities) from 1998 to 2003.
David F. Morris serves as our Senior Vice President, Chief Administrative Officer, General Counsel and Secretary. Mr. Morris served as our Vice President, General Counsel and Secretary beginning in January 2005 through April 2007, at which time he was promoted to Senior Vice President. Mr. Morris became our Chief Administrative Officer in August 2007. From March 1993 until January 2005, Mr. Morris was an attorney with the law firm of Thompson Coburn LLP, St. Louis, Missouri, most recently as a partner in its corporate and securities practice areas. Mr. Morris also served as Senior Vice President, Associate General Counsel and Secretary of Unified Financial Services, Inc., a diversified financial services company, from December 1999 to March 2004.
David A. Martin serves as our Senior Vice President and Chief Financial Officer. Mr. Martin served as our Vice President and Chief Financial Officer from August 2007 through April 2009, at which time he was promoted to Senior Vice President. Previously, he was Vice President and Controller since January 2006. Mr. Martin also served as our Corporate Controller for two years, following two and one-half years as finance director of our European operations. Mr. Martin joined our Company in 1993 from BDO Seidman, LLP, where he was a senior accountant.
Holly S. Sharp has served as our Vice President—Human Resources and Environmental, Health and Safety since June 2008. Previously, she served as our Senior Director—Human Resources and Environmental, Health and Safety and Director of Human Resources for our former tunneling operations. Prior to joining our Company in 2004, Ms. Sharp was Director of Labor Relations for Rental Service Corporation, a North American construction equipment rental company.
Kenneth L. Young has served as our Vice President and Treasurer since April 2009. He most recently served as the Chief Financial Officer, Secretary and Treasurer for Huttig Building Products, Inc., a public company based in St. Louis, Missouri, from 2005 to 2009. Prior to that, he served as Corporate Treasurer for MEMC Electronic Materials, a public company based in St. Louis, Missouri, from 1989 to 2005.
18
Table of Contents
PART II
| Item 5. | Market for Registrant’s Common Equity, Related Stockholder Matters and Issuer Purchases of Equity Securities. |
The Company’s common shares, $.01 par value, are traded on The Nasdaq Global Select Market under the symbol “INSU”. The following table sets forth the range of quarterly high and low sales prices for the years ended December 31, 2009 and 2008, as reported on The Nasdaq Global Select Market. Quotations represent prices between dealers and do not include retail mark-ups, mark-downs or commissions.
| Period |
High | Low | ||||
| 2009 |
||||||
| First Quarter |
$ | 21.28 | $ | 11.42 | ||
| Second Quarter |
17.35 | 13.03 | ||||
| Third Quarter |
20.50 | 15.10 | ||||
| Fourth Quarter |
24.22 | 16.81 | ||||
| 2008 |
||||||
| First Quarter |
$ | 15.46 | $ | 11.01 | ||
| Second Quarter |
19.15 | 14.13 | ||||
| Third Quarter |
18.57 | 13.66 | ||||
| Fourth Quarter |
20.82 | 9.26 | ||||
During the quarter ended December 31, 2009, we did not make any repurchases of our common stock, nor offer any equity securities that were not registered under the Securities Act of 1933, as amended. As of February 25, 2010, the number of holders of record of our common stock was 747.
Holders of common stock are entitled to receive dividends as and when they may be declared by our Board of Directors. Our present policy is to retain earnings to provide for the operation and expansion of our business. However, our Board of Directors will review our dividend policy from time to time and will consider our earnings, financial condition, cash flows, financing agreements and other relevant factors in making determinations regarding future dividends, if any. Under the terms of certain debt arrangements to which we are a party, we are subject to certain limitations on paying dividends. See “Management’s Discussion and Analysis of Financial Condition and Results of Operations – Liquidity and Capital Resources – Long-Term Debt” for further discussion of such limitations.
The following table provides information as of December 31, 2009 with respect to the shares of common stock that may be issued under our existing equity compensation plans:
Equity Compensation Plan Information
| Plan Category |
Number of securities to be issued upon exercise of outstanding options, warrants and rights (a) |
Weighted-average exercise price of outstanding options, warrants and rights (b) |
Number of securities remaining available for future issuance under equity compensation plans (excluding securities reflected in column (a)) (c) | ||||
| Equity compensation plans approved by security holders (1) |
1,847,384 | $ | 16.48 | 2,552,312 | |||
| Equity compensation plans not approved by security holders (2) |
274,273 | 14.55 | — | ||||
| Total |
2,121,657 | $ | 16.43 | 2,552,312 | |||
| (1) | The number of securities to be issued upon exercise of granted/awarded options, warrants and rights includes 1,049,243 stock options, 650,767 stock awards and 147,374 deferred and restricted stock units outstanding at December 31, 2009. |
| (2) | On April 14, 2008, the Company granted J. Joseph Burgess a non-qualified stock option to purchase 118,397 shares of the Company’s common stock, a performance-based award of 52,784 shares of restricted stock and a one-time award of 103,092 shares of restricted stock in connection with his appointment as the Company’s President and Chief Executive Officer. These awards were issued as “inducement grants” under the rules of the Nasdaq Global Select Market and, as such, were not issued pursuant to our 2006 Employee Equity Incentive Plan. |
19
Table of Contents
Performance Graph
The following performance graph compares the total stockholder return on our common stock to the S&P 500 Index and a peer group index of the companies noted below for the past five years.
| • | Michael Baker Corporation |
| • | Layne Christensen Company |
| • | Chicago Bridge & Iron Company N.V. |
| • | Granite Construction, Inc. |
| • | Vectren Corporation |
| • | MasTec, Inc. |
| • | ENGlobal Corporation |
| • | Sterling Construction Company, Inc. |
| • | Quanta Services, Inc. |
| • | Foster Wheeler, Ltd. |
| • | Dycom Industries, Inc. |
| • | American States Water Company |
| • | Preformed Line Products Company |
| • | Kennametal, Inc. |
Perini Corporation was acquired during 2009, and therefore was removed from the peer group. The graph assumes that $100 was invested in our common stock and each index on December 31, 2004 and that all dividends were reinvested.
Comparison of Five-Year Cumulative Return
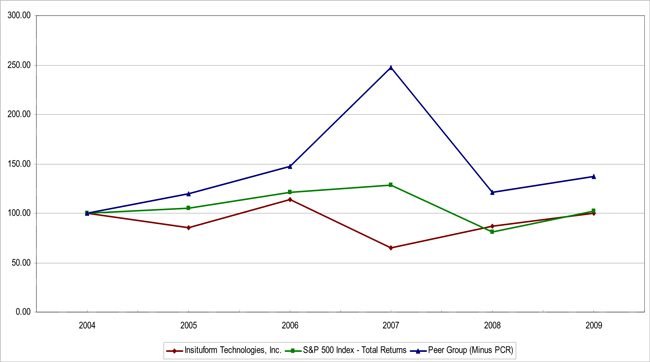
| 2004 | 2005 | 2006 | 2007 | 2008 | 2009 | |||||||||||||
| Insituform Technologies, Inc. |
$ | 100.00 | $ | 85.45 | $ | 114.08 | $ | 65.28 | $ | 86.85 | $ | 100.22 | ||||||
| S&P 500 Total Returns |
100.00 | 104.89 | 121.46 | 128.13 | 80.73 | 102.08 | ||||||||||||
| Peer Group |
100.00 | 119.68 | 147.49 | 247.56 | 121.52 | 137.42 | ||||||||||||
Notwithstanding anything set forth in any of our previous filings under the Securities Act of 1933 or the Securities Exchange Act of 1934 which might incorporate future filings, including this Annual Report on Form 10-K, in whole or in part, the preceding performance graph shall not be deemed incorporated by reference into any such filings.
20
Table of Contents
| Item 6. | Selected Financial Data. |
The selected financial data set forth below has been derived from our consolidated financial statements contained in “Item 8. Financial Statements and Supplementary Data” of this Annual Report on Form 10-K and previously published historical financial statements not included in this Annual Report on Form 10-K. The selected financial data set forth below should be read in conjunction with “Management’s Discussion and Analysis of Financial Condition and Results of Operations” and our consolidated financial statements, including the footnotes, contained in this report.
| Year Ended December 31, | ||||||||||||||||||||
| 2009(1) (2) (3) | 2008(1) | 2007(1)(4) | 2006(1) | 2005 | ||||||||||||||||
| (In thousands, except per share amounts) | ||||||||||||||||||||
| INCOME STATEMENT DATA(5): |
||||||||||||||||||||
| Revenues |
$ | 726,866 | $ | 536,664 | $ | 495,570 | $ | 527,419 | $ | 483,595 | ||||||||||
| Operating income |
49,117 | 33,882 | 13,530 | 36,311 | 35,545 | |||||||||||||||
| Income from continuing operations |
30,241 | 24,076 | 12,866 | 26,303 | 20,160 | |||||||||||||||
| Loss from discontinued operations |
(4,070 | ) | (2,436 | ) | (10,323 | ) | (1,625 | ) | (7,000 | ) | ||||||||||
| Net income |
26,171 | 21,640 | 2,543 | 24,678 | 13,160 | |||||||||||||||
| Basic earnings (loss) per share: |
||||||||||||||||||||
| Income from continuing operations |
0.81 | 0.87 | 0.47 | 0.97 | 0.75 | |||||||||||||||
| Loss from discontinued operations |
(0.11 | ) | (0.09 | ) | (0.38 | ) | (0.06 | ) | (0.26 | ) | ||||||||||
| Net income |
0.70 | 0.78 | 0.09 | 0.91 | 0.49 | |||||||||||||||
| Diluted earnings (loss) per share: |
||||||||||||||||||||
| Income from continuing operations |
0.81 | 0.86 | 0.47 | 0.96 | 0.75 | |||||||||||||||
| Loss from discontinued operations |
(0.11 | ) | (0.09 | ) | (0.38 | ) | (0.06 | ) | (0.26 | ) | ||||||||||
| Net income |
0.70 | 0.77 | 0.09 | 0.90 | 0.49 | |||||||||||||||
| BALANCE SHEET DATA: |
||||||||||||||||||||
| Unrestricted cash and cash equivalents |
$ | 106,064 | $ | 99,321 | $ | 78,961 | $ | 96,389 | $ | 77,063 | ||||||||||
| Working capital, net of unrestricted cash |
125,088 | 115,681 | 117,862 | 77,466 | 70,114 | |||||||||||||||
| Current assets(6) |
403,633 | 324,672 | 309,289 | 310,364 | 274,024 | |||||||||||||||
| Property, plant and equipment |
148,435 | 71,423 | 73,368 | 76,432 | 75,814 | |||||||||||||||
| Total assets(6) |
862,779 | 549,306 | 541,140 | 550,069 | 518,328 | |||||||||||||||
| Current maturities of long-term debt and notes payable |
12,742 | 938 | 1,097 | 16,814 | 18,264 | |||||||||||||||
| Long-term debt, less current maturities |
101,500 | 65,000 | 65,000 | 65,046 | 80,768 | |||||||||||||||
| Total liabilities(6) |
319,257 | 178,317 | 185,882 | 209,277 | 213,106 | |||||||||||||||
| Total stockholders’ equity |
538,052 | 367,977 | 352,241 | 338,611 | 303,496 | |||||||||||||||
| (1) | Effective January 1, 2006, we adopted Financial Accounting Standards Board (“FASB”) Accounting Standards Codification TM (“FASB ASC”), “Compensation – Stock Compensation” (“FASB ASC 718”), which requires the recording of expense for stock option and other equity compensation awards. We recorded $1.1 million, $1.3 million, $2.0 million and $2.9 million in incremental expense for stock options in 2009, 2008, 2007 and 2006, respectively. |
| (2) | 2009 results include expenses of $6.9 million related to the acquisitions of Bayou and Corrpro and $5.2 million recorded in the fourth quarter of 2009 in connection with the restructuring of our European operations and the closure of the Corrpro paint team business ($4.0 million of which is classified on the restructuring line of the income statement and $1.2 million of which is classified in operating expenses on the income statement). |
| (3) | 2009 results include amounts from our acquisitions of Bayou and Corrpro from their respective acquisition dates of February 20, 2009 and March 31, 2009, respectively. |
| (4) | Includes $17.9 million of exit charges in 2007 recorded in connection with the closure of the tunneling business. |
| (5) | All amounts have been restated for the impact of discontinued operations. |
| (6) | Includes current assets, total assets and total liabilities of discontinued operations for all periods. |
21
Table of Contents
| Item 7. | Management’s Discussion and Analysis of Financial Condition and Results of Operation. |
Overview
We are a leading worldwide provider of proprietary technologies and services for rehabilitating sewer, water, energy and mining piping systems and the corrosion protection of industrial pipelines. We offer one of the broadest portfolios of cost-effective solutions for rehabilitating aging or deteriorating pipelines and protecting new pipelines from corrosion. Our business activities include research and development, manufacturing, distribution, installation, coating and insulation, cathodic protection and licensing. Our products and services are currently utilized and performed in more than 36 countries across six continents. We believe that the depth and breadth of our products and services platform makes us a leading “one-stop” provider for the world’s pipeline rehabilitation and protection needs.
We are organized into five reportable segments: North American Sewer Rehabilitation, European Sewer Rehabilitation, Asia-Pacific Sewer Rehabilitation, Water Rehabilitation and Energy and Mining. We regularly review and evaluate our reportable segments. Market changes between the segments are typically independent of each other, unless a macroeconomic event affects both the sewer and water rehabilitation markets and the oil, mining and gas markets. These changes exist for a variety of reasons, including, but not limited to, local economic conditions, weather-related issues and levels of government funding.
Our long-term strategy consists of: first, streamlining our rehabilitation operations in North America and in Europe by improving project execution, cost management practices, including the reduction of redundant fixed costs, and product mix; and by identifying opportunities to streamline key management functions and processes to improve our profitability; second, growing our water rehabilitation business by leveraging our premier brand and experience of successfully innovating and delivering technologies and services; third, expanding all of our businesses in key emerging markets such India and Asia; and fourth, expanding our position in the growing and profitable energy and mining sector through organic growth, selective acquisitions of companies, which may be significant in size, and by conducting complimentary product and technology acquisitions.
Recent Acquisitions
In early 2009, we expanded our operations in the energy and mining sector to include pipe coating and cathodic protection services. On February 20, 2009, we acquired the business of The Bayou Companies, L.L.C. and its related entities (“Bayou”). Our Bayou business provides cost-effective solutions to energy and infrastructure companies primarily in the Gulf of Mexico and North America. Bayou’s products and services include internal and external pipeline coating, lining, weighting and insulation. Bayou also provides specialty fabrication and services for offshore deepwater installations, including project management and logistics.
On March 31, 2009, we acquired Corrpro Companies, Inc. and its subsidiaries (“Corrpro”). Our Corrpro business offers a comprehensive line of fully-integrated corrosion protection products and services including: (i) engineering; (ii) product and material sales; (iii) construction and installation; (iv) inspection, monitoring and maintenance; and (v) coatings. Corrpro’s specialty in the corrosion control market is cathodic protection, an electrochemical process that prevents corrosion in new structures and stops the corrosion process for existing structures.
On June 30, 2009, we acquired the shares of our joint venture partner, VSL International Limited, in Insituform Pacific Pty Limited (“Insituform-Australia”) and Insituform Asia Limited (“Insituform-Hong Kong”), our former Australian and Hong Kong joint ventures, respectively, in order to expand our operations in both Australia and Hong Kong.
On October, 30, 2009, we further expanded our coating and insulation services in Canada with our acquisition of the pipe coating and insulation facility and related assets of Garneau, Inc. through our joint venture Bayou Perma-Pipe Canada, Ltd. (“BPPC”). We hold a fifty-one percent (51%) majority interest in BPPC through our wholly-owned Canadian subsidiary, Insituform Technologies Limited. BPPC serves as our pipe coating and insulation operations in Canada.
On December 3, 2009,we acquired the 25% noncontrolling interest in our CIPP tube manufacturing operation, now known as Insituform Linings Limited (“Insituform Linings”) in the United Kingdom, which had been owned by Per Aarsleff A/S, a Danish company. Insituform Linings manufactures CIPP tube for our European sewer rehabilitation operation and third-party sales.
On January 29, 2010, we acquired our Singapore CIPP licensee, Insitu Envirotech (S.E. Asia) Pte Ltd (“Insituform-Singapore”), in order to expand our Singapore operations. Insituform-Singapore performs sewer rehabilitation services in Southeast Asia.
22
Table of Contents
Results of Operations
2009 Compared to 2008
| Years Ended December 31, | Increase (Decrease) | |||||||||||||
| 2009 | 2008 | $ | % | |||||||||||
| (Dollars in thousands) | ||||||||||||||
| Revenues |
$ | 726,866 | $ | 536,664 | $ | 190,202 | 35.4 | % | ||||||
| Gross profit |
190,591 | 129,597 | 60,994 | 47.1 | ||||||||||
| Gross profit margin |
26.2 | % | 24.1 | % | n/a | 2.1 | ||||||||
| Operating expenses |
130,555 | 95,715 | 34,840 | 36.4 | ||||||||||
| Restructuring charges |
4,025 | — | 4,025 | 100.0 | ||||||||||
| Acquisition-related expenses |
6,894 | — | 6,894 | 100.0 | ||||||||||
| Operating income |
49,117 | 33,882 | 15,235 | 45.0 | ||||||||||
| Operating margin |
6.8 | % | 6.3 | % | n/a | 0.5 | ||||||||
| Net income from continuing operations attributable to common stockholders |
30,241 | 24,076 | 6,165 | 25.6 | ||||||||||
Consolidated net income from continuing operations attributable to common stockholders was $30.2 million in 2009, an increase of $6.2 million, or 25.6%, over 2008. Net income from continuing operations attributable to common stockholders was unfavorably impacted in 2009 by acquisition-related expenses of $6.9 million and restructuring charges of $5.2 million. The restructuring expenses included $4.0 million, which is classified on the restructuring line of the income statement, and $1.2 million, which is classified in operating expenses on the income statement. In 2008, results were favorably impacted by a $6.7 million gain (net of related costs) from a litigation settlement. Excluding the 2009 restructuring charges, net income from continuing operations attributable to common stockholders increased $14.9 million, or 61.7%, year over year. The improvement was driven by an increase in revenues of $190.2 million, or 35.4%, due primarily to the inclusion of revenues from our recently acquired Bayou and Corrpro operations. The increase in revenues was partially offset by declines in revenues in our European Sewer Rehabilitation segment and United Pipeline Systems business. The increase in revenues was also partially offset by unfavorable impacts relating to foreign currencies on a consolidated basis. The increase in net income from continuing operations attributable to common stockholders was also attributable to improved margins in our North American Sewer Rehabilitation and European Sewer Rehabilitation segments. Margins improvement in these segments was primarily due to project execution improvements and lower costs for fuel and resin.
Consolidated operating expenses increased by $34.8 million, or 36.4%, to $130.6 million in 2009 from $95.7 million in 2008. The increase was due to the inclusion of $41.3 million of operating expenses for Corrpro and Bayou, partially offset by expense reductions realized in our other operations. Approximately $11.3 million of operating expenses from our Bayou and Corrpro operations was for amortization and depreciation expense. The increase in operating expenses was partially offset by cost reduction measures implemented by our North American Sewer Rehabilitation business in the fourth quarter of 2008 and in 2009 and lower operating expenses in our European Sewer Rehabilitation business in 2009.
In 2009, we incurred $6.9 million of acquisition-related expenses. Approximately $6.6 million of this amount was related to the acquisitions of Bayou and Corrpro. We also incurred $4.0 million in restructuring charges related to our European Sewer Rehabilitation business and the closure of the Corrpro paint team operation. The European restructuring charge was incurred to reorganize the business and position it for profitable growth. The reorganization includes exiting low-return geographies, combining operations and realigning responsibilities and functions in our European headquarters office. The restructuring charge was comprised of severance, lease termination, asset impairment and legal costs. We expect to realize approximately $3.2 million in annualized savings from this reorganization. The Corrpro paint team business, which painted United States Navy ships, was non-core to our other businesses. The amount of the charge was approximately $0.7 million and was primarily comprised of severance and asset impairment costs.
23
Table of Contents
2008 Compared to 2007
| Years Ended December 31, | Increase (Decrease) | ||||||||||||||
| 2008 | 2007 | $ | % | ||||||||||||
| (Dollars in thousands) | |||||||||||||||
| Revenues |
$ | 536,664 | $ | 495,570 | $ | 41,094 | 8.3 | % | |||||||
| Gross profit |
129,597 | 99,108 | 30,489 | 30.8 | |||||||||||
| Gross profit margin |
24.1 | % | 20.0 | % | n/a | 4.1 | |||||||||
| Operating expenses |
95,715 | 90,078 | 5,637 | 6.3 | |||||||||||
| Gain on settlement of litigation |
— | (4,500 | ) | (4,500 | ) | (100.0 | ) | ||||||||
| Operating income |
33,882 | 13,530 | 20,352 | 152.6 | |||||||||||
| Operating margin |
6.3 | % | 2.7 | % | n/a | 3.6 | |||||||||
| Net income from continuing operations attributable to common stockholders |
24,076 | 12,866 | 11,210 | 88.1 | |||||||||||
Consolidated net income from continuing operations was $11.2 million, or 88.1%, higher in 2008 than in 2007, principally due to improved margins in our North American Sewer Rehabilitation segment, income growth in our Asia-Pacific Sewer Rehabilitation segment and a $6.7 million gain (net of related costs) from a litigation settlement. The 2007 results were favorably impacted by a $4.5 million gain from the settlement of a patent infringement litigation.
Consolidated operating expenses were $5.3 million, or 5.9%, higher in 2008 than in 2007. Operating expenses for 2008 included $1.7 million incurred in connection with a proxy contest initiated by a dissident stockholder and its affiliates in early 2008, $0.8 million related to compensation in connection with the transition of the office of the chief executive, $1.6 million related to growth initiatives in our Asia-Pacific Sewer Rehabilitation and Water Rehabilitation businesses and $1.3 million due to one-time costs stemming from a reduction in force during the fourth quarter of 2008. As a percentage of revenues, consolidated operating expenses were 17.8% in 2008 versus 18.2% in 2007.
Segment Results
North American Sewer Rehabilitation Segment
| Years Ended December 31, | ||||||||||||
| 2009 | 2008 | 2007 | ||||||||||
| (Dollars in thousands) | ||||||||||||
| Revenues |
$ | 354,418 | $ | 340,296 | $ | 348,085 | ||||||
| Gross profit |
91,346 | 75,435 | 58,890 | |||||||||
| Gross profit margin |
25.8 | % | 22.2 | % | 16.9 | % | ||||||
| Operating expenses |
52,989 | 60,094 | 62,257 | |||||||||
| Gain on settlement of litigation |
— | — | (4,500 | ) | ||||||||
| Operating income |
38,357 | 15,341 | 1,133 | |||||||||
| Operating margin |
10.8 | % | 4.5 | % | 0.3 | % | ||||||
Revenues
Revenues increased by 4.1% in our North American Sewer Rehabilitation segment in 2009 to $354.4 million from $340.3 million in the prior year. The increase was primarily due to increased workable backlog in the second half of 2009. Third-party product sales in this segment were $11.5 million and $9.8 million in 2009 and 2008, respectively.
Contract backlog in our North American Sewer Rehabilitation segment at December 31, 2009 was $180.9 million. This represented a $30.1 million, or 20.0%, increase from backlog at December 31, 2008. Overall increasing levels of backlog compared to December 31, 2008 are a result of slightly increased market activity, some of which is attributable to federal stimulus programs. The stimulus programs are expected to have a favorable impact on the market in the upcoming quarters.
In 2008, revenues decreased by 2.2% in our North American Sewer Rehabilitation segment to $340.3 million from $348.1 million in 2007 primarily due to weak market conditions in the United States. The decrease in revenues was partially offset by a $4.9 million increase in third-party product sales in 2008 compared to 2007.
24
Table of Contents
Gross Profit and Gross Margin
Gross profit in our North American Sewer Rehabilitation segment increased by 21.1% to $91.3 million in 2009 compared to $75.4 million in 2008. The increase in gross profit was primarily due to our continued project execution improvements, profitability improvement initiatives and lower pricing for fuel and resin. Gross margins increased 360 basis points from 22.2% in 2008 to 25.8% in 2009. In addition, gross margins were boosted by increased third-party product sales.
We expect to continue to drive profitability and returns through enhanced project management and crew training and the continued implementation of technologies and improved logistics management. In addition, we continue to seek avenues for taking advantage of our vertical integration and manufacturing capabilities by further expanding our third-party product sales efforts.
North American Sewer Rehabilitation segment gross profit increased by 28.1% in 2008 compared to 2007, despite a decrease in revenues for the period. The increase in gross profit was primarily due to project execution improvements and cost-cutting initiatives. In addition, positive pricing trends, improved cost management practices and product mix improvements contributed to the growth in gross profit. Separately, our results were very poor in the first quarter of 2007 in the United States, due to a variety of reasons, including competitive pricing pressures, poor productivity, installation problems in several geographic regions and a high level of small diameter installations with lower margins. Gross margins increased 530 basis points from 16.9% in 2007 to 22.2% in 2008.
A large portion of the profitability improvements made during 2008 related to the initiatives we implemented with our cost structure and crew productivity.
Operating Expenses
Operating expenses decreased 11.8% in 2009 compared to 2008 due to the cost-cutting and performance improvement initiatives described above. Operating expenses, as a percentage of revenues, were 15.0% in 2009 compared to 17.7% in 2008.
Operating expenses decreased 3.5% in 2008 compared to 2007, partially due to the cost-cutting and performance improvement initiatives described above. This decrease was slightly offset by one-time costs associated with a proxy contest and one-time compensation matters. Additionally, one-time costs related to a reduction in force totaled $1.0 million for this segment. The compensation matters included the allocation of expenses in connection with the transition of the office of the chief executive. While corporate costs are allocated across all segments, our North American Sewer Rehabilitation segment receives the largest allocation of this cost due to its relative size. Operating expenses, as a percentage of revenues, were 17.7% in 2008 compared to 17.9% in 2007.
Operating Income and Operating Margin
Operating income in this segment increased to $38.4 million in 2009 compared to $15.3 million in 2008, a 150.0% increase, primarily due to improved gross profit and lower operating expenses. The North American Sewer Rehabilitation segment operating margin improved to 10.8% in 2009 compared to 4.5% in 2008.
Operating income in this segment increased to $15.3 million in 2008 compared to $1.1 million in 2007, primarily due to improved gross profit and lower operating expenses as well as substantial improvement in first quarter results in 2008 versus 2007, which were particularly weak. The North American Sewer Rehabilitation operating margin improved to 4.5% in 2008 compared to 0.3% in 2007.
25
Table of Contents
European Sewer Rehabilitation Segment
| Years Ended December 31, | ||||||||||||
| 2009 | 2008 | 2007 | ||||||||||
| (Dollars in thousands) | ||||||||||||
| Revenues |
$ | 85,993 | $ | 112,225 | $ | 100,658 | ||||||
| Gross profit |
22,774 | 31,228 | 23,300 | |||||||||
| Gross profit margin |
26.5 | % | 27.8 | % | 23.1 | % | ||||||
| Operating expenses |
20,430 | 23,564 | 17,932 | |||||||||
| Restructuring charges |
3,349 | — | — | |||||||||
| Operating income (loss) |
(1,005 | ) | 7,664 | 5,368 | ||||||||
| Operating margin |
(1.2 | )% | 6.8 | % | 5.3 | % | ||||||
Revenues
Revenues in our European Sewer Rehabilitation segment decreased by 23.4% in 2009 to $86.0 million from $112.2 million in the prior year. This decrease was due primarily to market weakness in the United Kingdom and unfavorable foreign currency impacts. In 2008, our revenues were favorably impacted by a $6.7 million gain on a litigation settlement (net of related costs).
Contract backlog in this segment was $37.2 million at December 31, 2009. This represented an increase of $12.0 million, or 47.6%, compared to December 31, 2008. The increase was principally due to higher backlog in France, the Netherlands and the United Kingdom. European orders and backlog have been fairly steady for the past several quarters, and we believe this trend will continue in 2010.
During the fourth quarter of 2009, we announced a reorganization of our European business, whereby we decided to exit the contracting markets in Belgium, Romania, Poland and Austria. We also realigned responsibilities and functions and combined operations, thereby reducing administrative overhead costs. The reorganization included the elimination of 35 positions throughout our operations in Europe. As part of the reorganization, we acquired the 25% minority interest in our CIPP tube manufacturing operation in the United Kingdom, which had been owned by Per Aarsleff A/S, a Danish company. We and Per Aarsleff also agreed upon new regulations and guidelines for our joint venture in Germany, which should ensure better cooperation between us going forward and should lead to improved profitability. Under the new organizational structure, our European operation is divided into four geographic regions, plus our German joint venture. We also are now in the position to expand our third-party tube sales through our 100% owned manufacturing operation.
As a result of these initiatives, we recorded a pre-tax restructuring charge of $4.6 million in the fourth quarter of 2009, of which $1.2 million was recorded in operating expenses. The restructuring charge consisted of employee severance and lease cancellation costs, along with write-downs of certain assets as a result of the exit from various markets. As discussed earlier, we expect annualized costs savings of approximately $3.2 million with virtually all to be realized starting in 2010. These initiatives should position the business unit to continue the trend of increasing gross margins and declining operating expenses. It will also allow us to increase our focus on areas of profitable growth and reduce our risk in countries that have historically experienced poorer performance.`
Revenues in our European Sewer Rehabilitation segment increased by 11.5% in 2008 to $112.2 million from $100.7 million in the prior year. This increase consisted primarily of a $6.7 million gain on a litigation settlement (net of related costs), favorable impacts of foreign currencies and revenue increases from operations in Eastern Europe. Without the litigation settlement, revenues would have increased by $4.8 million, or 4.8%.
Gross Profit and Gross Profit Margin
Gross profit declined by $8.5 million, or 27.1%, to $22.8 million in 2009 compared to $31.2 million in 2008 due to the decrease in revenues as well as the inclusion in our 2008 results of the gain from the litigation settlement. Excluding the effects of the litigation settlement, gross profit margin increased from 21.9% to 26.5% due to increased profitability in manufacturing, better project execution and more disciplined cost management.
We expect that our gross profit margin will continue to increase in 2010, as we are exiting unprofitable businesses and are pursuing initiatives focused on receiving an appropriate level of return.
26
Table of Contents
Gross profit increased by $7.9 million, or 34.0%, in 2008 compared to 2007 due primarily to the revenue increase as a result of the litigation settlement. Without the settlement, gross profit would have increased by $1.2 million, or 5.3%, with gross profit margin declining from 23.1% to 21.9%.
Operating Expenses
Excluding the $4.6 million in restructuring charges, of which $1.2 million was recorded in operating expenses, operating expenses decreased by $4.4 million, or 18.5%, due to cost reduction efforts in France, Switzerland and the United Kingdom. We expect the restructuring to generate $3.2 million in ongoing annualized savings, as discussed earlier, the majority of which is classified as operating expenses.
Operating expenses increased 31.4% to $23.6 million in 2008 compared to $17.9 million in 2007. The increase was due in part to higher administrative costs in our European headquarters, strong European currencies and the severance costs associated with the departure of two members of our European senior management team.
Operating Income (Loss) and Gross Profit Margin
Lower revenues and gross profit in 2009 led to a $8.7 million, or 113.1%, operating income decline compared to 2008. Excluding restructuring charges in 2009 and the legal settlement in 2008, operating income increased $2.6 million, or 269.4%, from 2008 to 2009, due to gross profit margin expansion and lower operating expenses. In the same context, operating margin increased from 0.9% to 4.1%.
Excluding the effects of the legal settlement in 2008, operating income decreased from $5.4 million in 2007 to $1.0 million in 2008 due to compressed gross margins and higher operating expenses.
Asia-Pacific Sewer Rehabilitation Segment
| Years Ended December 31, | ||||||||||||
| 2009 | 2008 | 2007 | ||||||||||
| (Dollars in thousands) | ||||||||||||
| Revenues |
$ | 33,256 | $ | 10,129 | $ | 973 | ||||||
| Gross profit |
9,032 | 2,938 | 544 | |||||||||
| Gross profit margin |
27.2 | % | 29.0 | % | 55.9 | % | ||||||
| Operating expenses |
5,591 | 1,299 | 1,051 | |||||||||
| Acquisition-related expenses |
22 | — | — | |||||||||
| Operating income (loss) |
3,419 | 1,639 | (507 | ) | ||||||||
| Operating margin |
10.3 | % | 16.2 | % | (52.1 | )% | ||||||
Revenues
Revenues in our Asia-Pacific Sewer Rehabilitation segment increased by $23.1 million, or 228.3%, to $33.3 million in 2009 compared to $10.1 million in 2008. The increase was due primarily to increased volume in our Indian operation and the inclusion of revenues from our Australia and Hong Kong operations, which had not been previously consolidated. We acquired 100% of each of these operations on June 30, 2009 (we previously owned 50% of each company). In 2009, Australia and Hong Kong contributed revenues of $3.1 million and $4.1 million, respectively. In India, we secured several large revenue projects in 2008 and 2009 that we believe will lead to continued revenue growth in this segment into 2010. In addition, we improved the geographic diversification of our Asia-Pacific business with the acquisition of our Singapore licensee in January 2010.
Contract backlog in our Asia-Pacific Sewer Rehabilitation segment increased to $57.4 million at December 31, 2009 from $46.2 million at December 31, 2008, an increase of 24.2%. This increase was principally due to the inclusion of backlog from our Australian and Hong Kong operations, which operations have been consolidated with our results since June 30, 2009. We continue to believe that the market opportunity in India is very robust, and we expect growth to continue as we gain momentum with sales penetration in major Indian cities. We also are pursuing other growth opportunities throughout the Asia-Pacific region, including significant opportunities in Singapore, Australia and China.
Revenues in our Asia-Pacific Sewer Rehabilitation segment increased by $9.2 million, or 940.8%, in 2008 compared to 2007. We improved the geographic diversification of our business in both 2008 and 2007 with significant new business wins in India, Hong Kong and Australia through our joint ventures.
27
Table of Contents
Gross Profit and Gross Profit Margin
Gross profit in our Asia-Pacific Sewer Rehabilitation segment increased by $6.1 million, or 207.4%, in 2009 compared to 2008. Our gross profit margin decreased to 27.2% compared to 29.0% in 2008. Gross margins were lower due to work being performed on installation projects in the current year versus more third-party tube sales in 2008 at higher margins. In addition, gross profit margins were lower due to slower than anticipated progress on projects in India due to heavy rains during the monsoon season. Gross profit increased substantially in 2009 as a result of the increase in revenues, albeit at slightly lower margins.
Gross profit in our Asia-Pacific Sewer Rehabilitation segment increased by $2.4 million, or 439.9%, in 2008 compared to 2007. Our gross profit margin decreased to 29.0% compared to 55.9% in the same period, principally due to a majority of revenues being driven by contracting revenues in India related to early-stage cleaning contracts during 2008, whereas in 2007 revenues were primarily from royalties and tube and equipment sales, which carried higher margins.
Operating Expenses
Operating expenses increased by 332.1%, or $4.3 million, in 2009 compared to 2008 due principally to our continuing investments in our operations in India and the inclusion of expenses upon consolidation of our Australia and Hong Kong operations. In 2009, Australia and Hong Kong had operating expenses of $0.7 million and $0.6 million, respectively. We are continuing our focus on business development efforts in international markets, which will require us to dedicate additional resources to these efforts. Operating expenses, as a percentage of revenues, increased to 16.9% in 2009 compared to 12.8% in 2008.
Operating expenses increased by 23.6%, or $0.2 million, in 2008 compared to 2007. Operating expenses, as a percentage of revenues, decreased to 12.8% in 2008 compared to 108.0% in 2007.
Operating Income (Loss) and Operating Margin
Improved revenues and gross profit, partially offset by higher operating expenses, led to an increase in operating income of $1.8 million in 2009 compared to 2008. Operating margin declined to 10.3% in 2009 compared to 16.2% in 2008. The decrease in operating margin was primarily the result of current year work being comprised of lower margin installation work versus more third-party tube sales in the prior year.
Improved revenues partially offset by higher operating expenses led to an increase in operating income of $2.1 million in 2008 compared to 2007. Operating margin improved to 16.2% in 2008 compared to (52.1) % in 2007.
Water Rehabilitation Segment
| Years Ended December 31, | ||||||||||||
| 2009 | 2008 | 2007 | ||||||||||
| (Dollars in thousands) | ||||||||||||
| Revenues |
$ | 11,521 | $ | 13,447 | $ | 4,248 | ||||||
| Gross profit |
254 | 1,745 | 445 | |||||||||
| Gross profit margin |
2.2 | % | 13.0 | % | 10.5 | % | ||||||
| Operating expenses |
2,832 | 3,403 | 2,029 | |||||||||
| Operating loss |
(2,578 | ) | (1,658 | ) | (1,584 | ) | ||||||
| Operating margin |
(22.4 | )% | (12.3 | )% | (37.3 | )% | ||||||
Revenues
Revenues decreased by $1.9 million, or 14.3%, in our Water Rehabilitation segment in 2009 to $11.5 million from $13.4 million in 2008, due primarily to low workable backlog levels especially in Europe. Our Water Rehabilitation segment contract backlog was $7.7 million at December 31, 2009. This represented a decrease of $0.5 million, or 6.1%, compared to December 31, 2008. Backlog at December 31, 2009 increased $0.2 million, or 2.4%, compared to September 30, 2009. During 2009, we launched InsituMain™, our new pressure-rated, cured-in-place pipe system for the rehabilitation of water transmission and distribution mains. We believe this new product, coupled with our other Insituform Blue® water pipe rehabilitation products, firmly establishes us in the marketplace. We continue to believe that prospects for new orders and growth are strong, and we anticipate growth in backlog over the coming quarters.
The financial results for our Water Rehabilitation segment were not strong in 2009, but we made solid progress with respect to the introduction of InsituMain™ through pilot testing. We will continue to demonstrate the commercial viability of InsituMain™ through the execution of pilot projects in North America, all scheduled to begin in the first half of 2010.
28
Table of Contents
Revenues increased by $9.2 million, or 216.6%, in our Water Rehabilitation segment in 2008 to $13.4 million from $4.2 million in 2007, due primarily to work completed on the Madison Avenue project in New York City. During 2008, we performed water rehabilitation projects in the U.S., Europe and Asia. The expansion of this segment is consistent with our long-term strategy to grow our water rehabilitation business by leveraging our premier brand and introducing innovative technologies and services that we have been able to advance successfully in the last two years.
Gross Profit and Gross Profit Margin
In 2009, gross profit decreased by $1.5 million, or 85.4%, to $0.3 million from $1.7 million in 2008. This decrease was due principally to isolated project execution issues. Our gross profit margin percentage decreased by 1080 basis points for the same period. Our water rehabilitation business is still in an early growth stage. We continue to validate and test our newly-developed water rehabilitation products.
In 2008, gross profit increased by $1.3 million, or 292.3%, to $1.7 million compared to $0.4 million in 2007. In addition, our gross margin percentage increased by 250 basis points for the same period. Margins were lower than our other reporting segments as this business was in an early growth stage.
Operating Expenses
Operating expenses decreased by $0.6 million to $2.8 million in 2009 from $3.4 million in 2008 due to combining operations and project management resources with our North American Sewer Rehabilitation structure during the first half of 2009. Operating expenses as a percentage of revenues declined to 24.6% in 2009 compared to 25.3% in 2008.
The continued growth of this business led to an increase in operating expenses in the segment of $1.4 million, or 67.7%, in 2008 compared to 2007. Operating expenses as a percentage of revenues declined to 25.3% in 2008 compared to 47.8% in 2007. The overall increase in operating expenses was due to the addition of necessary sales, administrative and project management resources to support and grow this important new line of business.
Operating Loss and Operating Margin
Operating loss increased by $0.9 million, or 55.3%, to $2.6 million in 2009 compared to $1.7 million in 2008. Operating margin declined to (22.4) % in 2009 compared to (12.3) % in 2008.
Operating loss increased by $0.1 million, or 4.7%, to $1.7 million in 2008 compared to $1.6 million in 2007. Operating margin improved to (12.3) % in 2008 compared to (37.3) % in 2007.
Energy and Mining Segment
| Years Ended December 31, | ||||||||||||
| 2009 | 2008 | 2007 | ||||||||||
| (Dollars in thousands) | ||||||||||||
| Revenues |
$ | 241,678 | $ | 60,567 | $ | 41,606 | ||||||
| Gross profit |
67,185 | 18,250 | 15,929 | |||||||||
| Gross profit margin |
27.8 | % | 30.1 | % | 38.3 | % | ||||||
| Operating expenses |
48,713 | 7,354 | 6,809 | |||||||||
| Acquisition-related expenses |
6,872 | — | — | |||||||||
| Restructuring charges |
676 | — | — | |||||||||
| Operating income |
10,924 | 10,896 | 9,120 | |||||||||
| Operating margin |
4.5 | % | 18.0 | % | 21.9 | % | ||||||
Revenues
2009 results for our Energy and Mining segment include our recently acquired Bayou and Corrpro businesses. Comparing 2009 revenues in our Energy and Mining segment of $241.7 million to revenues of $60.6 million in 2008 (prior to acquisitions) reflects an increase of 299.0%. Revenues attributed to these acquisitions were $199.4 million in 2009. The increase in revenues was partially offset by a decline in revenues for our United Pipeline Systems business, referred to herein as “UPS,” of $18.3 million, or 30.2%, compared to 2008 due primarily to the election by our customers to hold back larger projects and only proceed on projects deemed imperative as a result of lower commodity prices.
29
Table of Contents
Our Energy and Mining segment is divided into five primary geographic regions: the United States, Canada, Mexico, South America and Europe, and includes pipeline rehabilitation, pipe coating, design and installation of cathodic protection systems and welding services. During 2009, each of these five geographic regions experienced growth in revenues, due to the aforementioned acquisitions of Bayou and Corrpro. Unlike our sewer rehabilitation segments and our Water Rehabilitation segment, revenues in our Energy and Mining segment are responsive to market conditions in the oil, gas and mining industries. The prices of certain energy commodities have been volatile in recent periods, which have adversely affected the results in our Energy and Mining segment.
Our Energy and Mining segment contract backlog at December 31, 2009 increased by $161.5 million, or 863.7%, compared to December 31, 2008. This significant increase was primarily driven by the inclusion of backlog of our recently acquired Bayou and Corrpro businesses. Backlog attributed to these acquisitions was $122.9 million. Backlog in our UPS business increased significantly to $57.3 million at December 31, 2009, an increase of $38.6 million, or 206.1%, from $18.7 million at December 31, 2008 due to large contract awards in Mexico. We believe that improved commodity prices could result in significant opportunities for our Energy and Mining segment for future periods, particularly as it relates to new spending in the sector.
Revenues in our Energy and Mining segment increased by 45.6% to $60.6 million in 2008 compared to $41.6 million in 2007. During 2008, each of our regions experienced growth in revenues, with the largest actual increase in South America. In South America, revenues increased $10.2 million, or 121.0%, in 2008 compared to 2007. In addition, revenues in our United States operations increased $5.8 million in 2008 compared to 2007.
Gross Profit and Gross Profit Margin
Our Energy and Mining segment gross profit increased by $48.9 million, or 268.1%, to $67.2 million in 2009 compared to $18.3 million in 2008. The contribution to gross profit from our newly acquired Bayou and Corrpro businesses was $52.7 million. Gross profit from our UPS business decreased by $3.8 million in 2009 compared to 2008, due primarily to lower revenues. Gross margin percentage declined 230 basis points from the prior year to 27.8% from 30.1%. This decline was principally due to the lower gross margin structure of our Bayou business. The gross margin percentage for our UPS business increased 410 basis points to 34.2% in 2009 compared to 30.1% in 2008 due to higher margin work in the United States during 2009.
Our Energy and Mining segment gross profit increased by $2.3 million, or 14.6%, in 2008 compared to 2007. Gross margin percentage declined from the prior year to 30.1% from 38.3%. This decline was principally due to the lower margin, large revenue projects in South America as well as the favorable impact on results in 2007 from a gain of $1.3 million realized from project closeouts in South America and Africa. The decrease in margins for South America was also partially due to an increase in the percentage of revenue from subcontractors as well as an increase in competitive bidding. The gross margin level experienced in 2008 was more in line with the normal range of expectations, while still subject to variability due to different market prices in various locations throughout the world.
Operating Expenses
Operating expenses in our Energy and Mining segment increased by $48.9 million, or 665.1%, in 2009 compared to 2008. This significant increase in operating expenses was attributable to our acquisitions of Bayou and Corrpro. The contribution to operating expenses from Bayou and Corrpro was $48.9 million, of which $6.9 million were acquisition-related expenses. Also included in the $49.1 million are certain costs relating to identifying synergies in the newly acquired businesses. Our UPS business saw a decrease in operating expenses of $0.8 million to $6.6 million in 2009 from $7.4 million in 2008 due to cost cutting initiatives put in place in response to the economic downturn. As a percentage of revenues, our Energy and Mining operating expenses were 23.3% in 2009 compared to 12.1% in 2008.
Operating expenses in the Energy and Mining segment increased by only $0.5 million, or 8.0%, in 2008 compared to 2007 despite a 45.6% increase in revenues. The increase was due to additional staffing costs in the early part of 2008 to support our ongoing geographic expansion initiatives. As a percentage of revenues, operating expenses were 12.1% in 2008 compared to 16.4% in 2007.
Operating Income and Operating Margin
Operating income remained relatively flat in 2009 compared to 2008. Operating income as a percentage of revenues decreased to 4.4% in 2009 compared to 18.0% in 2008. This decrease was due to acquisition costs allocated to the Energy & Mining segment and with the drop in gross profit margins described above.
Operating income increased by $1.8 million, or 19.5%, in 2008 compared to 2007. Operating income as a percentage of revenues decreased to 18.0% in 2008 compared to 21.9% in 2007, remaining consistent with the drop in our gross profit margins described above.
30
Table of Contents
Other Income (Expense)
Interest expense increased to $8.2 million in 2009 compared to $5.4 million in 2008 primarily related to interest on our new credit facility, which includes our three-year term loan. Interest expense remained flat at $5.4 million in 2008 compared to 2007. See “Liquidity and Capital Resources – Long-Term Debt” under this Item 7 for further discussion of debt instruments and related amendments.
Interest income decreased $3.3 million to $0.5 million in 2009 compared to $3.8 million in 2008, due primarily to lower deposit balances throughout the year and significantly lower interest rates on collected balances. Interest income increased $0.3 million from $3.5 million in 2007 to $3.8 million in 2008 primarily due to higher cash balances offset by lower interest rates.
Other income decreased $0.2 million to $1.4 million in 2009 compared to $1.6 million in 2008 primarily due to the lower income received from disposition of property and equipment. This decrease was partially offset by management fees received by Bayou for management services provided to Bayou Coatings, a company in which Bayou has a 49% ownership interest. Other income increased $0.1 million from $1.5 million in 2007 to $1.6 million in 2008 primarily due to gains on property and asset disposals in 2008.
Taxes on Income (Tax Benefits)
Our effective tax rate in 2009 was 29.4% and was lower than the federal statutory rate due primarily to the benefit of higher income in jurisdictions with rates lower than the U.S. rate.
Our deferred tax liabilities in excess of deferred tax assets were $16.2 million, including a $4.9 million valuation allowance primarily related to foreign net operating losses. Deferred tax assets include $2.3 million of foreign tax credit carryforwards, which begin expiring in 2015, and $8.5 million in federal, state and foreign net operating loss carryforwards, net of applicable valuation allowances.
The 2008 effective tax rate of 25.5% was lower than the federal statutory rate due to the benefit of higher income in jurisdictions with rates lower than the U.S. rate, the recognition of uncertain tax positions and the benefit of a federal motor fuels excise tax credit.
Our effective tax rate in any given year is dependent in part on the level of taxable income we generate in each of the foreign jurisdictions in which we operate.
Noncontrolling Interests
Noncontrolling interests were $(1.1) million, $(0.9) million and $(0.5) million in 2009, 2008 and 2007, respectively, and are related to the 25% interest in the net income of Insituform Linings held by Per Aarsleff until December 2009, the 49.5% interest in the net income of the contractual joint venture in India held by SPML and the 49% interest in the net income of BPPC held by Perma-Pipe. In the fourth quarter of 2009, we purchased the remaining 25% noncontrolling interest in Insituform Linings.
Equity in Earnings (Losses) of Affiliated Companies
Equity in earnings (losses) of affiliated companies was $1.1 million, $(0.2) million and $0.2 million in 2009, 2008 and 2007, respectively. The increase during 2009 was due to improved results from our joint venture in Germany and the contribution of Bayou’s equity earnings of affiliated companies. On June 30, 2009, we acquired the outstanding ownership interests of our joint venture partner, VSL International Limited, in Insituform-Hong Kong and Insituform-Australia. For all periods prior to June 30, 2009, these joint ventures were reported as equity in earnings (losses) of affiliated companies, net of tax. At June 30, 2009, Insituform-Hong Kong and Insituform-Australia were accounted for as fully consolidated entities and are no longer included in equity in earnings (losses) of affiliated companies for periods after June 30, 2009. Equity losses from Insituform-Hong Kong and Insituform-Australia prior to June 30, 2009 was $(0.3) million for 2009. In 2008 and 2007, we invested in Insituform-Hong Kong and Insituform-Australia, as start-up joint ventures and incurred losses in the early development stages.
Loss from Discontinued Operations
Revenues from discontinued operations were $(4.6) million, $6.5 million and $62.1 million in 2009, 2008 and 2007, respectively. Losses from discontinued operations, net of income taxes, were $4.1 million, $2.4 million and $10.3 million in 2009, 2008 and 2007, respectively. The results in discontinued operations were due to the winding down of our tunneling business, which shut down was announced in March 2007. The losses and expenses in this segment are primarily related to the settlement of certain outstanding claims and legal expenses to pursue the remaining outstanding claims. We recorded a $4.6 million write-down associated with the settlement of a previously recorded claim during 2009, which resulted in a reversal of $4.6 million in previously recorded revenues.
31
Table of Contents
Discontinued operations experienced a net loss of $(4.1) million, or $(0.11), per diluted share in 2009. All tunneling projects have been completed. At December 31, 2009, receivables, including retention, totaled $1.2 million. This amount is being held pending the final close-out of two projects. While there can be no certainty, these matters are expected to be concluded in the first half of 2010, and we believe that the receivables will be collected. Approximately $1.3 million in equipment relating to discontinued operations remained as of December 31, 2009, and we continue to pursue the sale of the equipment through a variety of sources.
Contract Backlog
Contract backlog is our expectation of revenues to be generated from received, signed and uncompleted contracts, the cancellation of which is not anticipated at the time of reporting. Contract backlog excludes any term contract amounts for which there is not specific and determinable work released and projects where we have been advised that we are the low bidder, but have not formally been awarded the contract. The following table sets forth our consolidated backlog by segment:
| December 31, | |||||||||
| Backlog |
2009 | 2008 | 2007 | ||||||
| (In millions) | |||||||||
| North American Sewer Rehabilitation |
$ | 180.9 | $ | 150.8 | $ | 160.0 | |||
| European Rehabilitation |
37.2 | 25.2 | 35.6 | ||||||
| Asia-Pacific Sewer Rehabilitation (1) |
57.4 | 46.2 | 35.1 | ||||||
| Water Rehabilitation |
7.7 | 8.2 | 2.1 | ||||||
| Energy and Mining (2) |
180.2 | 18.7 | 26.2 | ||||||
| Total |
$ | 463.4 | $ | 249.1 | $ | 259.0 | |||
| (1) | Contract backlog for our Asia-Pacific Sewer Rehabilitation segment includes backlog for our recently acquired 100% ownership of our joint ventures in Hong Kong and Australia of $12.4 million and $34.0 million, respectively, at December 31, 2009. Contract backlog for these operations were not included prior to June 30, 2009, as they were not consolidated operations. |
| (2) | Contract backlog for our Energy and Mining segment includes backlog of our recently acquired Bayou and Corrpro businesses of $67.8 million and $55.1 million, respectively, at December 31, 2009. Such operations were not part of our Company as of December 31, 2008. |
Although backlog represents only those contracts that are considered to be firm, there can be no assurance that cancellation or scope adjustments will not occur with respect to such contracts.
Liquidity and Capital Resources
Cash and Cash Equivalents
| December 31, | ||||||
| 2009 | 2008 | |||||
| (In thousands) | ||||||
| Cash and equivalents |
$ | 106,064 | $ | 99,321 | ||
| Restricted cash – in escrow |
1,339 | 1,829 | ||||
Restricted cash held in escrow relates to deposits made in lieu of retention on specific projects performed for municipalities and state agencies or advance customer payments and compensating balances for bank undertakings in Europe.
Sources and Uses of Cash
We expect the principal use of funds for the foreseeable future will be for capital expenditures, working capital and debt servicing. During 2009, capital expenditures were primarily for an increase in crew resources for our Indian joint venture, our growing operation in Australia and the replacement of older equipment across all segments. We expect capital expenditures to trend higher in the coming year as we continue to grow our operations in Asia-Pacific. We also expect to see growth in our Energy and Mining segment as markets return to normalcy, which will require further investment in equipment.
32
Table of Contents
Our primary source of cash is operating activities. We occasionally borrow under our line of credit to fund operating activities, including working capital investments. Information regarding our cash flows for 2009 and 2008 is discussed below and is presented in our consolidated statements of cash flows contained in this report. Operating cash flow in 2009 improved dramatically over the prior year as a result of improved profitability and cash management practices. This improved cash flow, coupled with existing cash balances and other resources, should be sufficient to fund our operations in 2010.
We completed a public offering of our common stock in February 2009, from which we received net proceeds of $127.8 million. These proceeds were used to pay the purchase prices for our acquisition of selected assets and liabilities of Bayou and the noncontrolling interests of certain subsidiaries of Bayou.
Cash Flows from Operations
Cash flows from continuing operating activities provided $55.6 million in 2009, which represented a $17.2 million, or 44.9%, increase compared to 2008. The increase in cash provided by continuing operating activities was primarily due to a $6.4 million increase in net income from continuing operations as well as an $11.1 million increase in depreciation and amortization in 2009 compared to the prior year period. The increase in depreciation and amortization was due to the acquisitions of Bayou and Corrpro. In addition, while revenues increased during 2009 compared to 2008, working capital only increased by 8.1% during the same time period. As a result, working capital growth used $8.3 million of cash in 2009 compared to $7.4 million of cash used in 2008.
Unrestricted cash increased to $106.1 million at December 31, 2009 from $99.3 million at December 31, 2008, despite the cash paid for the acquisitions of Bayou and Corrpro.
Days sales outstanding (referred to as DSOs) from continuing operations decreased by 1 day to 95 at December 31, 2009 from 96 at September 30, 2009. Compared to December 31, 2008, DSOs at December 31, 2009 decreased by 2 days from 97 days.
The liquidation of our discontinued operations provided $6.2 million and $1.6 million in operating cash flows in 2009 and 2008, respectively, as we collected receivables, including contract claims.
Cash Flows from Investing Activities
Investing activities from continuing operations used $234.5 million in 2009 compared to $13.2 million in 2008. The largest component of cash used by investing activities was the use of cash to purchase Bayou and Corrpro. We used $209.7 million, net of cash acquired, to acquire these two companies. The other main component of investing activities was capital expenditures of $21.8 million and $15.0 million in 2009 and 2008, respectively, as well as the $11.3 million used to acquire certain assets of Garneau, Inc. and $0.3 million used to acquire our joint venture partner’s interests in Insituform-Hong Kong and Insituform-Australia. Capital expenditures were primarily for an increase in crew resources for our Indian joint venture and our Australian operation and the replacement of older equipment across all business segments. Capital expenditures in 2009 and 2008 were partially offset by $1.9 million and $1.8 million, respectively, in proceeds received from asset disposals. The investing activities of our discontinued operations provided $0.8 million and $1.3 million of cash in 2009 and 2008, respectively, and represented proceeds from the sale of fixed assets. In 2010, we expect to spend approximately $30.0 million on capital expenditures.
Cash Flows from Financing Activities
Cash flows from financing activities from continuing operations provided $172.8 million in 2009 compared to $0.7 million in 2008. In 2009, we received proceeds of $53.7 million from new debt issuances. In addition, we received $127.8 million from our public offering of common stock. During 2009, we paid dividends of $1.0 million to the holder of the noncontrolling interest in Insituform Linings, our United Kingdom manufacturing operation. During the fourth quarter of 2009, we used $4.0 million to purchase the remaining 25% noncontrolling interest of Insituform Lining. Also, we received an aggregate of $4.1 million as investments from the holders of the noncontrolling interests in Insituform-India and Bayou Perma-Pipe Canada Ltd.
Long-Term Debt
On March 31, 2009, we entered into a Credit Agreement with Bank of America, N.A., as Administrative Agent, Fifth Third Bank, U.S. Bank, National Association, Compass Bank, JPMorgan Chase Bank, N.A., Associated Bank, N.A. and Capital One, N.A. (the “New Facility”). The New Facility is unsecured and consists of a $50.0 million term loan and a $65.0 million revolving line of credit, each with a maturity date of March 31, 2012. We have the ability to increase the amount of the borrowing commitment under the New Facility by up to $25.0 million in the aggregate upon the consent of the lenders.
33
Table of Contents
At our election, borrowings under the New Facility bear interest at either (i) a fluctuating rate of interest equal on any day to the higher of Bank of America, N.A.’s announced prime rate, the Federal Funds Rate plus 0.50% or the one-month LIBOR plus 1.0%, plus in each case a margin ranging from 1.75% to 3.00%, or (ii) rates of interest fixed for one, two, three or nine months at the British Bankers Association LIBOR Rate for such period plus a margin ranging from 2.75% to 4.00%. The applicable margins are determined quarterly based upon our consolidated leverage ratio. The current annualized rate on outstanding borrowings under the New Facility at December 31, 2009 was 3.74%.
The New Facility is subject to certain financial covenants, including a consolidated financial leverage ratio and consolidated fixed charge coverage ratio. The New Facility also provides for events of default, including in the event of non-payment or certain defaults under other outstanding indebtedness. The Company was in compliance with each of these covenants at December 31, 2009.
This New Facility replaced our credit facility that was due to expire on April 30, 2009. Letters of credit that were outstanding as of March 31, 2009 under the expiring facility were converted to letters of credit under the New Facility. As of December 31, 2009, we had $22.5 million in letters of credit issued and outstanding under the New Facility. Of such amount, (i) $13.6 million was collateral for the benefit of certain of our insurance carriers, (ii) $1.5 million was collateral for work performance obligations, (iii) $4.5 million was for security in support of working capital needs of Insituform Pipeline Rehabilitation Private Limited, our Indian joint venture, and the working capital and performance bonding needs of our operations in Australia and Hong Kong and (iv) $2.9 million was in support of international trade transactions. See Note 5 to the consolidated financial statements.
In connection with our acquisition of Corrpro on March 31, 2009, we borrowed the entire amount of the term loan of $50.0 million and approximately $7.5 million under the revolving line of credit. See Note 5 to the consolidated financial statements contained in this report for more information.
Our total indebtedness as of December 31, 2009 consisted of the Company’s $65.0 million 6.54% Senior Notes, Series 2003-A, due April 24, 2013, $42.5 million of the original $50.0 million term loan and $2.7 million of third party notes and other bank debt. In connection with the formation of Bayou Perma-Pipe Canada, Ltd., we and Perma-Pipe Inc. loaned the company an aggregate of $8.0 million for the purchase of capital assets and for operating purposes. Of such amount, $4.0 million is included in our consolidated financial statements as third-party debt. Our total indebtedness at December 31, 2008 consisted of the Company’s $65.0 million 6.54% Senior Notes, Series 2003-A, due April 24, 2013, and $0.9 million of other notes related to the financing of certain insurance premiums. Under the terms of the Senior Notes, Series 2003-A, prepayment could cause us to incur a “make-whole” payment to the holder of the notes. At December 31, 2009, this make-whole payment would have approximated $7.7 million.
We believe that we have adequate resources and liquidity to fund future cash requirements and debt repayments with cash generated from operations, existing cash balances, additional short- and long-term borrowings and the sale of assets for the next twelve months. We expect cash generated from operations to continue to improve going forward due to increased profitability, improved working capital management initiatives and additional cash flows generated from newly acquired businesses.
Disclosure of Contractual Obligations and Commitments
We have entered into various contractual obligations and commitments in the course of our ongoing operations and financing strategies. Contractual obligations are considered to represent known future cash payments that we are required to make under existing contractual arrangements, such as debt and lease agreements. These obligations may result from both general financing activities or from commercial arrangements that are directly supported by related revenue-producing activities. Commercial commitments represent contingent obligations, which become payable only if certain pre-defined events were to occur, such as funding financial guarantees. See Note 10 to the consolidated financial statements contained in this report for further discussion regarding our commitments and contingencies.
We have entered into several contractual joint ventures in order to develop joint bids on contracts for our installation business. In these cases, we could be required to complete the joint venture partner’s portion of the contract if the partner were unable to complete its portion. We would be liable for any amounts for which we could not complete the work and for which a third-party contractor could not be located to complete the work for the amount awarded in the contract. While we would be liable for additional costs, these costs would be offset by any related revenues due under that portion of the contract. We have not experienced any material adverse results from such arrangements. Based on these facts, we currently do not anticipate any future material adverse impact on our consolidated financial position, results of operations or cash flows from our contractual joint ventures.
34
Table of Contents
The following table provides a summary of our contractual obligations and commercial commitments as of December 31, 2009 (in thousands). This table includes cash obligations related to principal outstanding under existing debt arrangements and operating leases.
Payments Due by Period
| Cash Obligations(1)(2)(3)(4)(5) |
Total | 2010 | 2011 | 2012 | 2013 | 2014 | Thereafter | ||||||||||||||
| Long-term debt |
$ | 111,500 | $ | 10,000 | $ | 10,000 | $ | 26,500 | $ | 65,000 | $ | — | $ | — | |||||||
| Interest on long-term debt |
18,217 | 5,914 | 5,539 | 4,639 | 2,125 | — | — | ||||||||||||||
| Operating leases |
36,259 | 11,709 | 10,519 | 6,908 | 3,813 | 1,994 | 1,316 | ||||||||||||||
| Total contractual cash obligations |
$ | 165,976 | $ | 27,623 | $ | 26,058 | $ | 38,047 | $ | 70,938 | $ | 1,994 | $ | 1,316 | |||||||
| (1) | Cash obligations are not discounted. See Notes 5 and 10 to the consolidated financial statements contained in this report regarding our long-term debt and credit facility and commitments and contingencies, respectively. |
| (2) | We borrowed the entire amount of the $50.0 million term loan upon inception, of which $42.5 million was outstanding at December 31, 2009. We also had $22.5 million for non-interest bearing letters of credit outstanding as of December 31, 2009, $13.6 million of which was collateral for insurance, $1.5 million of which was collateral for work performance obligations, $4.5 million of which was for security in support of working capital and performance bonding needs for our operations in Australia and Hong Kong and $2.9 million of which was in support of international trade transactions. |
| (3) | Liabilities related to Financial Accounting Standards Board Accounting Standards Codification 740, Income Taxes, have not been included in the table above because we are uncertain as to if or when such amounts may be settled. |
| (4) | There were no material purchase commitments at December 31, 2009. |
| (5) | The Corrpro pension funding was excluded from this table as the amounts are immaterial. |
Off-Balance Sheet Arrangements
We use various structures for the financing of operating equipment, including borrowings, operating leases and sale-leaseback arrangements. All debt is presented in the balance sheet. Our future commitments were $166.0 million at December 31, 2009. We also have exposure under performance guarantees by contractual joint ventures and indemnification of our surety. However, we have never experienced any material adverse effects to our consolidated financial position, results of operations or cash flows relative to these arrangements. All of our unconsolidated joint ventures are accounted for using the equity method. We have no other off-balance sheet financing arrangements or commitments. See Note 10 to our consolidated financial statements contained in this report regarding commitments and contingencies.
Critical Accounting Policies
Discussion and analysis of our financial condition and results of operations are based upon our consolidated financial statements, which have been prepared in accordance with accounting principles generally accepted in the United States of America. The preparation of these financial statements requires us to make estimates and judgments that affect the reported amount of assets and liabilities, revenues and expenses, and related disclosure of contingent assets and liabilities at the financial statement dates. Actual results may differ from these estimates under different assumptions or conditions.
Some accounting policies require the application of significant judgment by management in selecting the appropriate assumptions for calculating financial estimates. By their nature, these judgments are subject to an inherent degree of uncertainty. We believe that our critical accounting policies are those described below. For a detailed discussion on the application of these and other accounting policies, see Note 2 to the consolidated financial statements contained in this report.
35
Table of Contents
Revenue Recognition – Percentage-of-Completion Method
We recognize revenues and costs as construction, engineering and installation contracts progress using the percentage-of-completion method of accounting, which relies on total expected contract revenues and estimated total costs. Under this method, estimated contract revenues and resulting gross profit margin are recognized based on actual costs incurred to date as a percentage of total estimated costs. We follow this method since reasonably dependable estimates of the revenues and costs applicable to various elements of a contract can be made. Since the financial reporting of these contracts depends on estimates, which are assessed continually during the term of these contracts, recognized revenues and gross profit are subject to revisions as the contract progresses to completion. Total estimated costs, and thus contract gross profit, are impacted by changes in productivity, scheduling and the unit cost of labor, subcontracts, materials and equipment. Additionally, external factors such as weather, customer needs, customer delays in providing approvals, labor availability, governmental regulation and politics also may affect the progress and estimated cost of a project’s completion and thus the timing of revenue recognition and gross profit. Revisions in profit estimates are reflected in the period in which the facts that give rise to the revision become known. When current estimates of total contract costs indicate that the contract will result in a loss, the projected loss is recognized in full in the period in which the loss becomes evident. Revenues from change orders, extra work, variations in the scope of work and claims are recognized when it is probable that they will result in additional contract revenue and when the amount can be reliably estimated.
Many of our contracts provide for termination of the contract at the convenience of the customer. If a contract were terminated prior to completion, we would typically be compensated for progress up to the time of termination and any termination costs. In addition, many contracts are subject to certain completion schedule requirements with liquidated damages in the event schedules are not met as the result of circumstances that are within our control. Losses on terminated contracts and liquidated damages have historically not been significant.
We recognize revenues from product sales upon shipment and transfer of ownership. Certain contracts performed by our Bayou business involve the storage of customer-supplied pipes on our property following the completion of our services. We do not take ownership of the pipe subjected to coating and bending services. The title and risk of loss associated with the pipe remains with the customer at all times. Accordingly, the customer-supplied pipes are not included in the consolidated financial statements. In the event that we store pipe at our customer’s request, title and risk of loss remain with the customer during any storage period and our only remaining obligation, which is inconsequential, is to load the stored pipe on third-party carriers when the customer requests delivery. When pipe storage is requested by the customer, our normal billing and credit terms are not modified. In these bill and hold arrangements, we continue to recognize revenues as coating services are completed. We are also subject to certain Bayou contracts that contain multiple deliverables, and revenue is recognized for each deliverable as certain accounting requirements are met.
Equity-Based Compensation
We record expense for equity-based compensation awards, including stock appreciation rights, restricted shares of common stock, performance awards, stock options and stock units based on the fair value recognition provisions contained in Financial Accounting Standards Board (“FASB”) Accounting Standards Codification (“ASC”) 718, Compensation—Stock Compensation (“FASB ASC 718”). Fair value of stock option awards is determined using an option pricing model that is based on established principles of financial economic theory. Assumptions regarding volatility, expected term, dividend yield and risk-free rate are required for valuation of stock option awards. Volatility and expected term assumptions are based on our historical experience. The risk-free rate is based on a U.S. Treasury note with a maturity similar to the option award’s expected term. Fair value of restricted stock, restricted stock unit and deferred stock unit awards is determined using our closing stock price on the grant date. The shares of restricted stock and restricted stock units that are awarded are subject to performance and service restrictions. We make forfeiture rate assumptions in connection with the valuation of restricted stock and restricted stock unit awards that could be different than actual experience. Discussion of our application of FASB ASC 718 is described in Note 7 to the consolidated financial statements contained in this report.
Taxation
We provide for estimated income taxes payable or refundable on current year income tax returns, as well as the estimated future tax effects attributable to temporary differences and carryforwards, in accordance with FASB ASC 740, Income Taxes (“FASB ASC 740”). FASB ASC 740 also requires that a valuation allowance be recorded against any deferred tax assets that are not likely to be realized in the future. The determination is based on our ability to generate future taxable income and, at times, is dependent on our ability to implement strategic tax initiatives to ensure full utilization of recorded deferred tax assets. Should we not be able to implement the necessary tax strategies, we may need to record valuation allowances for certain deferred tax assets, including those related to foreign income tax benefits. Significant management judgment is required in determining the provision for income taxes, deferred tax assets and liabilities and any valuation allowances recorded against net deferred tax assets.
36
Table of Contents
In accordance with FASB ASC 740, tax benefits from an uncertain tax position may be recognized when it is more likely than not that the position will be sustained upon examination, including resolutions of any related appeals or litigation processes, based on the technical merits. Income tax positions must meet a more likely than not recognition threshold at the effective date to be recognized upon the adoption of FASB ASC 740 and in subsequent periods. In addition, this recognition model includes a measurement attribute that measures the position as the largest amount of tax that is greater than 50% likely of being ultimately realized upon ultimate settlement in accordance with FASB ASC 740. This interpretation also provides guidance on derecognition, classification, interest and penalties, accounting in interim periods, disclosure and transition. We adopted FASB ASC 740 effective January 1, 2007 as discussed below.
We recognize tax liabilities in accordance with FASB ASC 740 and we adjust these liabilities when our judgment changes as a result of the evaluation of new information not previously available. Due to the complexity of some of these uncertainties, the ultimate resolution may result in a payment that is materially different from our current estimate of the tax liabilities. These differences will be reflected as increases or decreases to income tax expense in the period in which they are determined. While we believe the resulting tax balances as of December 31, 2009 and 2008 are appropriately accounted for in accordance with FASB ASC 740, the ultimate outcome of such matters could result in favorable or unfavorable adjustments to the consolidated financial statements and such adjustments could be material.
Long-Lived Assets (including Goodwill)
Property, plant and equipment, goodwill and other identified intangibles (primarily patents, trademarks, licenses and non-compete agreements) are recorded at cost and, except for goodwill, are amortized on a straight-line basis over their estimated useful lives. Changes in circumstances such as technological advances, changes to our business model or changes in our capital strategy can result in the actual useful lives differing from our estimates. If we determine that the useful life of our property, plant and equipment or our identified intangible assets should be changed, we would depreciate or amortize the net book value in excess of the salvage value over its revised remaining useful life, thereby increasing or decreasing depreciation or amortization expense.
Long-lived assets, including property, plant and equipment and other intangibles, are reviewed for impairment whenever events or changes in circumstances indicate that the carrying amount of an asset may not be recoverable. Factors we consider important which could trigger an impairment review include:
| • | significant underperformance in a region relative to expected historical or projected future operating results; |
| • | significant changes in the use of the assets of a region or the strategy for the region; |
| • | significant negative industry or economic trends; |
| • | significant decline in our stock price for a sustained period; and |
| • | market capitalization significantly less than net book value. |
Such impairment tests are based on a comparison of undiscounted cash flows to the recorded value of the asset. The estimate of cash flow is based upon, among other things, assumptions about expected future operating performance. Our estimates of undiscounted cash flow may differ from actual cash flow due to, among other things, technological changes, economic conditions, changes to our business model or changes in our operating performance. If the sum of the undiscounted cash flows (excluding interest) is less than the carrying value, we recognize an impairment loss, measured as the amount by which the carrying value exceeds the fair value of the asset.
Under FASB ASC 350, Intangibles – Goodwill and Other (“FASB ASC 350”), we assess recoverability of goodwill on an annual basis or when events or changes in circumstances indicate that the carrying amount of goodwill may not be recoverable. Our annual assessment was last completed as of October 1, 2009. Factors that could potentially trigger an impairment review include (but are not limited to):
| • | significant underperformance of a segment relative to expected, historical or projected future operating results; |
| • | significant negative industry or economic trends; |
| • | significant changes in the strategy for a segment including extended slowdowns in the segment’s market; and |
| • | a decrease in our market capitalization below our book value for an extended period of time. |
37
Table of Contents
Our recorded goodwill by reportable segment was as follows at December 31, 2009 (in millions):
| North American Sewer Rehabilitation |
$ | 102.3 | |
| European Sewer Rehabilitation |
19.8 | ||
| Asia-Pacific Sewer Rehabilitation |
3.4 | ||
| Energy and Mining |
55.0 | ||
| Total goodwill |
$ | 180.5 | |
No goodwill was recorded for the Water Rehabilitation segment at December 31, 2009. In accordance with the provisions of FASB ASC 350, we determined the fair value of our reporting units at the annual impairment assessment date and compared such fair value to the carrying value of those reporting units to determine if there was any indication of goodwill impairment. Our reporting units for purposes of assessing goodwill are North American Sewer Rehabilitation, European Sewer Rehabilitation, Asia-Pacific Sewer Rehabilitation, UPS, Bayou and Corrpro.
Fair value of reporting units is determined using a combination of two valuation methods: a market approach and an income approach with each method given equal weight in determining the fair value assigned to each reporting unit. Absent an indication of fair value from a potential buyer or similar specific transaction, we believe the use of these two methods provides a reasonable estimate of a reporting unit’s fair value. Assumptions common to both methods are operating plans and economic projections, which are used to project future revenues, earnings and after-tax cash flows for each reporting unit. These assumptions are applied consistently for both methods.
The market approach estimates fair value by first determining earnings before interest, taxes, depreciation and amortization (“EBITDA”) multiples for comparable publicly-traded companies with similar characteristics of the reporting unit. The EBITDA multiples for comparable companies are based upon current enterprise value. The enterprise value is based upon current market capitalization and includes a 15% control premium. Management believes this approach is appropriate because it provides a fair value estimate using multiples from entities with operations and economic characteristics comparable to our reporting units.
The income approach is based on projected future (debt-free) cash flows that are discounted to present value using factors that consider timing and risk of future cash flows. Management believes this approach is appropriate because it provides a fair value estimate based upon the reporting unit’s expected long-term operating cash flow performance. Discounted cash flow projections are based on financial forecasts developed from operating plans and economic projections, growth rates, estimates of future expected changes in operating margins, terminal value growth rates, future capital expenditures and changes in working capital requirements. Estimates of discounted cash flows may differ from actual cash flows due to, among other things, changes in economic conditions, changes to business models, changes in our weighted average cost of capital or changes in operating performance. An impairment charge will be recognized to the extent that the implied fair value of the goodwill balances for each reporting unit is less than the related carrying value. In performing this analysis, we revised our estimated future cash flows and discount rates, as appropriate, to reflect a variety of market conditions. In each case, no impairment was indicated.
Given the continued distressed global market and economic conditions, we carefully considered whether an interim assessment of our goodwill was necessary during the quarter ended December 31, 2009. In management’s judgment, we do not believe the fair value of our reporting units was below their carrying value at December 31, 2009. Accordingly, an interim impairment assessment was not performed. A future decline in the fair value of North American Sewer Rehabilitation, European Sewer Rehabilitation, Asia Pacific Sewer Rehabilitation or Energy and Mining operations could lead to impairment of their respective goodwill balances. The recorded goodwill related to the Asia-Pacific Sewer Rehabilitation segment is the result of our recent acquisitions of Insituform-Hong Kong and Insituform-Australia (see Note 1 to our consolidated financial statements contained in this report). The recorded goodwill related to our Energy and Mining segment is the result of our recent acquisitions of Bayou and Corrpro (see Note 1 to our consolidated financial statements contained in this report). While not currently anticipated, any significant deterioration in the earnings of those businesses compared to the forecasted earnings assumptions used in the determination of their fair value could lead to the need for us to assess the recoverability of the recorded goodwill and potential impairment.
Significant assumptions used in the October 2009 review included: (i) five- to eight-year compound annual growth rates ranging from 2% to 36%; (ii) terminal values for each reporting unit using a long-term growth rate of 3%; and (iii) discount rates ranging from 13.5% to17.5%. If actual results differ from estimates used in these calculations, we could incur future impairment charges. During our assessment of the reporting units’ fair values in relation to their respective carrying values, we had two reporting units that had a fair value within 20% percent of their carrying value. The total value of goodwill recorded for these reporting units was $54.1 million. We had four reporting units that had a fair value in excess of 20% of their carrying value. The total goodwill recorded for these reporting units was $126.4 million.
38
Table of Contents
Recently Adopted Accounting Pronouncements
See Note 2 to the consolidated financial statements contained in this report.
| Item 7A. | Quantitative and Qualitative Disclosures about Market Risk. |
Market Risk
We are exposed to the effect of interest rate changes and of foreign currency and commodity price fluctuations. We currently do not use derivative contracts to manage interest rate and commodity risks. From time to time, we may enter into foreign currency forward contracts to fix exchange rates for net investments in foreign operations to hedge our foreign exchange risk.
Interest Rate Risk
The fair value of our cash and short-term investment portfolio at December 31, 2009 approximated carrying value. Given the short-term nature of these instruments, market risk, as measured by the change in fair value resulting from a hypothetical 100 basis point change in interest rates, would not be material.
Our objectives in managing exposure to interest rate changes are to limit the impact of interest rate changes on earnings and cash flows and to lower overall borrowing costs. To achieve these objectives, we maintain fixed rate debt whenever favorable. At December 31, 2009 and 2008, the estimated fair value of our long-term debt was approximately $114.5 million and $68.0 million, respectively. Fair value was estimated using market rates for debt of similar risk and maturity. Market risk related to the potential increase in fair value resulting from a hypothetical 100 basis point increase in our debt specific borrowing rates at December 31, 2009 would result in a $0.4 million increase in interest expense. The increase in interest expense would be offset by the interest rate swap agreement discussed below.
In May 2009, we entered into an interest rate swap agreement, for a notional amount of $25.0 million, which expires in March 2012. The swap notional amount mirrors the amortization of $25.0 million of our $50.0 million term loan. The swap requires us to make a monthly fixed rate payment of 1.63% calculated on the amortizing $25.0 million notional amount, and provides for us to receive a payment based upon a variable monthly LIBOR interest rate calculated on the amortizing $25.0 million notional amount. The receipt of the monthly LIBOR-based payment offsets a variable monthly LIBOR-based interest cost on a corresponding $25.0 million portion of our term loan. This interest rate swap is used to hedge the interest rate risk associated with the volatility of monthly LIBOR rate movement, and is accounted for as a cash flow hedge.
Foreign Exchange Risk
We operate subsidiaries and are associated with licensees and affiliated companies operating solely outside of the U.S. and in foreign currencies. Consequently, we are inherently exposed to risks associated with the fluctuation in the value of the local currencies compared to the U.S. dollar. At December 31, 2009, a substantial portion of our cash and cash equivalents were denominated in foreign currencies, and a hypothetical 10.0% change in currency exchange rates could result in an approximate $6.0 million impact to our equity through accumulated other comprehensive income.
In order to help mitigate this risk, we may enter into foreign exchange forward contracts to minimize the short-term impact of foreign currency fluctuations. We do not engage in hedging transactions for speculative investment reasons. There can be no assurance that our hedging operations will eliminate or substantially reduce risks associated with fluctuating currencies. At December 31, 2009, there were no material foreign currency hedge instruments outstanding. See Note 11 to the consolidated financial statements contained in this report for additional information and disclosures regarding our derivative financial instruments.
Commodity Risk
We have exposure to the effect of limitations on supply and changes in commodity pricing relative to a variety of raw materials that we purchase and use in our operating activities, most notably resin, chemicals, staple fiber, fuel and pipe. We manage this risk by entering into agreements with certain suppliers utilizing a request for proposal, or RFP, format and purchasing in bulk, when possible. We also manage this risk by continuously updating our estimation systems for bidding contracts so that we are able to price our products and services appropriately to our customers. However, we face exposure on contracts in process that have already been priced and are not subject to any cost adjustments in the contract. This exposure is potentially more significant on our longer-term projects.
We obtain a majority of our global resin requirements, one of our primary raw materials, from multiple suppliers in order to diversify our supplier base and thus reduce the risks inherent in concentrated supply streams. We have qualified a number of vendors in North America that can deliver, and are currently delivering, proprietary resins that meet our specifications.
39
Table of Contents
| Item 8. | Financial Statements and Supplementary Data. |
INDEX TO CONSOLIDATED FINANCIAL STATEMENTS
40
Table of Contents
Management’s Report on Internal Control Over Financial Reporting
The Company’s management is responsible for establishing and maintaining adequate internal control over financial reporting, as such term is defined in Exchange Act Rule 13a-15(f).
Under the supervision and with the participation of Company management, including the Chief Executive Officer (the principal executive officer) and the Chief Financial Officer (the principal financial officer), an evaluation was performed of the effectiveness of the Company’s internal control over financial reporting as of December 31, 2009. In performing this evaluation, management employed the criteria set forth by the Committee of Sponsoring Organizations of the Treadway Commission in Internal Control – Integrated Framework.
Based on the criteria set forth in Internal Control – Integrated Framework, management, including the Company’s Chief Executive Officer and its Chief Financial Officer, has concluded that the Company’s internal control over financial reporting was effective as of December 31, 2009.
The scope of management’s evaluation did not include our recent acquisitions of the selected assets and liabilities of The Bayou Companies, L.L.C and its related entities (“Bayou”) on February 20, 2009 or of Corrpro Companies Inc. (“Corrpro”) on March 31, 2009. Bayou and Corrpro are significant subsidiaries of our Company.
Company management does not expect that its system of internal control over financial reporting and procedures will prevent all misstatements due to inherent limitations. Therefore, management’s assessment provides reasonable, but not absolute, assurance that misstatements will be prevented and/or detected by the established internal control and procedures over financial reporting.
The effectiveness of the Company’s internal control over financial reporting as of December 31, 2009 has been audited by PricewaterhouseCoopers LLP, an independent registered public accounting firm, as stated in its report which appears herein.
| /s/ J. Joseph Burgess |
| J. Joseph Burgess |
| Chief Executive Officer |
| (Principal Executive Officer) |
| /s/ David A. Martin |
| David A. Martin |
| Senior Vice President and Chief Financial Officer |
| (Principal Financial Officer) |
41
Table of Contents
Report of Independent Registered Public Accounting Firm
To the Board of Directors and Stockholders of Insituform Technologies, Inc.,
In our opinion, the accompanying consolidated balance sheets and the related consolidated statements of income, stockholders’ equity and cash flows present fairly, in all material respects, the financial position of Insituform Technologies, Inc. and its subsidiaries at December 31, 2009 and 2008, and the results of their operations and their cash flows for each of the three years in the period ended December 31, 2009 in conformity with accounting principles generally accepted in the United States of America. Also in our opinion, the Company maintained, in all material respects, effective internal control over financial reporting as of December 31, 2009, based on criteria established in Internal Control—Integrated Framework issued by the Committee of Sponsoring Organizations of the Treadway Commission (COSO). The Company’s management is responsible for these financial statements, for maintaining effective internal control over financial reporting and for its assessment of the effectiveness of internal control over financial reporting, included in the accompanying Management’s Report on Internal Control Over Financial Reporting. Our responsibility is to express opinions on these financial statements and on the Company’s internal control over financial reporting based on our integrated audits. We conducted our audits in accordance with the standards of the Public Company Accounting Oversight Board (United States). Those standards require that we plan and perform the audits to obtain reasonable assurance about whether the financial statements are free of material misstatement and whether effective internal control over financial reporting was maintained in all material respects. Our audits of the financial statements included examining, on a test basis, evidence supporting the amounts and disclosures in the financial statements, assessing the accounting principles used and significant estimates made by management, and evaluating the overall financial statement presentation. Our audit of internal control over financial reporting included obtaining an understanding of internal control over financial reporting, assessing the risk that a material weakness exists, and testing and evaluating the design and operating effectiveness of internal control based on the assessed risk. Our audits also included performing such other procedures as we considered necessary in the circumstances. We believe that our audits provide a reasonable basis for our opinions.
As discussed in Note 2 to the consolidated financial statements, the Company changed its method of accounting for noncontrolling interests as of January 1, 2009.
A company’s internal control over financial reporting is a process designed to provide reasonable assurance regarding the reliability of financial reporting and the preparation of financial statements for external purposes in accordance with generally accepted accounting principles. A company’s internal control over financial reporting includes those policies and procedures that (i) pertain to the maintenance of records that, in reasonable detail, accurately and fairly reflect the transactions and dispositions of the assets of the company; (ii) provide reasonable assurance that transactions are recorded as necessary to permit preparation of financial statements in accordance with generally accepted accounting principles, and that receipts and expenditures of the company are being made only in accordance with authorizations of management and directors of the company; and (iii) provide reasonable assurance regarding prevention or timely detection of unauthorized acquisition, use, or disposition of the company’s assets that could have a material effect on the financial statements.
Because of its inherent limitations, internal control over financial reporting may not prevent or detect misstatements. Also, projections of any evaluation of effectiveness to future periods are subject to the risk that controls may become inadequate because of changes in conditions, or that the degree of compliance with the policies or procedures may deteriorate.
As described in Management’s Report on Internal Control Over Financial Reporting, management has excluded The Bayou Companies, Inc. and Corrpro Companies, Inc. from its assessment of internal control over financial reporting as of December 31, 2009 because these entities were acquired by the Company in purchase business combinations during 2009. We have also excluded The Bayou Companies, Inc. and Corrpro Companies, Inc. from our audit of internal control over financial reporting. The Bayou Companies, Inc. and Corrpro Companies, Inc. are wholly-owned subsidiaries whose combined total assets and total revenues represented 25% and 26%, respectively, of the related consolidated financial statement amounts as of and for the year ended December 31, 2009.
/s/ PricewaterhouseCoopers LLP
PricewaterhouseCoopers LLP
Saint Louis, Missouri
March 1, 2010
42
Table of Contents
Insituform Technologies, Inc. and Subsidiaries
Consolidated Statements of Income
For the Years Ended December 31, 2009, 2008 and 2007
(In thousands, except per share amounts)
| 2009 | 2008 | 2007 | ||||||||||
| Revenues |
$ | 726,866 | $ | 536,664 | $ | 495,570 | ||||||
| Cost of revenues |
536,275 | 407,067 | 396,462 | |||||||||
| Gross profit |
190,591 | 129,597 | 99,108 | |||||||||
| Operating expenses |
130,555 | 95,715 | 90,078 | |||||||||
| Restructuring charges |
4,025 | — | — | |||||||||
| Acquisition-related expenses |
6,894 | — | — | |||||||||
| Gain on settlement of litigation |
— | — | (4,500 | ) | ||||||||
| Operating income |
49,117 | 33,882 | 13,530 | |||||||||
| Other income (expense): |
||||||||||||
| Interest expense |
(8,296 | ) | (5,398 | ) | (5,368 | ) | ||||||
| Interest income |
520 | 3,761 | 3,458 | |||||||||
| Other |
1,423 | 1,627 | 1,451 | |||||||||
| Total other expense |
(6,353 | ) | (10 | ) | (459 | ) | ||||||
| Income before taxes on income |
42,764 | 33,872 | 13,071 | |||||||||
| Taxes on income (tax benefits) |
12,561 | 8,625 | (149 | ) | ||||||||
| Income before equity in earnings (losses) of affiliated companies |
30,203 | 25,247 | 13,220 | |||||||||
| Equity in earnings (losses) of affiliated companies, net of tax |
1,192 | (246 | ) | 171 | ||||||||
| Income before discontinued operations |
31,395 | 25,001 | 13,391 | |||||||||
| Loss from discontinued operations, net of tax |
(4,070 | ) | (2,436 | ) | (10,323 | ) | ||||||
| Net income |
27,325 | 22,565 | 3,068 | |||||||||
| Less: net income attributable to noncontrolling interests |
(1,154 | ) | (925 | ) | (525 | ) | ||||||
| Net income attributable to common stockholders |
$ | 26,171 | $ | 21,640 | $ | 2,543 | ||||||
| Earnings per share attributable to common stockholders: |
||||||||||||
| Basic: |
||||||||||||
| Income from continuing operations |
$ | 0.81 | $ | 0.87 | $ | 0.47 | ||||||
| Loss from discontinued operations |
(0.11 | ) | (0.09 | ) | (0.38 | ) | ||||||
| Net income |
$ | 0.70 | $ | 0.78 | $ | 0.09 | ||||||
| Diluted: |
||||||||||||
| Income from continuing operations |
$ | 0.81 | $ | 0.86 | $ | 0.47 | ||||||
| Loss from discontinued operations |
(0.11 | ) | (0.09 | ) | (0.38 | ) | ||||||
| Net income |
$ | 0.70 | $ | 0.77 | $ | 0.09 | ||||||
The accompanying notes are an integral part of the consolidated financial statements.
43
Table of Contents
Insituform Technologies, Inc. and Subsidiaries
Consolidated Balance Sheets
As of December 31, 2009 and 2008
(In thousands, except share information)
| December 31, 2009 |
December 31, 2008 |
||||||
| Assets |
|||||||
| Current assets |
|||||||
| Cash and cash equivalents |
$ | 106,064 | $ | 99,321 | |||
| Restricted cash |
1,339 | 1,829 | |||||
| Receivables, net |
147,835 | 97,257 | |||||
| Retainage |
22,656 | 21,380 | |||||
| Costs and estimated earnings in excess of billings |
64,821 | 37,224 | |||||
| Inventories |
32,125 | 16,320 | |||||
| Prepaid expenses and other assets |
27,604 | 37,637 | |||||
| Current assets of discontinued operations |
1,189 | 13,704 | |||||
| Total current assets |
403,633 | 324,672 | |||||
| Property, plant and equipment, less accumulated depreciation |
148,435 | 71,423 | |||||
| Other assets |
|||||||
| Goodwill |
180,506 | 122,961 | |||||
| Identified intangible assets, less accumulated amortization |
78,311 | 10,353 | |||||
| Investments in affiliated companies |
27,581 | 6,769 | |||||
| Deferred income tax assets |
11,203 | 3,190 | |||||
| Other assets |
8,827 | 4,095 | |||||
| Total other assets |
306,428 | 147,368 | |||||
| Non-current assets of discontinued operations |
4,283 | 5,843 | |||||
| Total Assets |
$ | 862,779 | $ | 549,306 | |||
| Liabilities and Equity |
|||||||
| Current liabilities |
|||||||
| Accounts payable and accrued expenses |
$ | 146,702 | $ | 97,593 | |||
| Billings in excess of costs and estimated earnings |
12,697 | 9,596 | |||||
| Current maturities of long-term debt, line of credit and notes payable |
12,742 | 938 | |||||
| Current liabilities of discontinued operations |
339 | 1,541 | |||||
| Total current liabilities |
172,480 | 109,668 | |||||
| Long-term debt, less current maturities |
101,500 | 65,000 | |||||
| Deferred income tax liabilities |
31,449 | — | |||||
| Other liabilities |
12,849 | 2,831 | |||||
| Non-current liabilities of discontinued operations |
979 | 818 | |||||
| Total liabilities |
319,257 | 178,317 | |||||
| Stockholders’ equity |
|||||||
| Preferred stock, undesignated, $.10 par – shares authorized 2,000,000; none outstanding |
— | — | |||||
| Common stock, $.01 par – shares authorized 60,000,000; shares issued and outstanding 38,933,944 and 27,977,785 |
389 | 280 | |||||
| Additional paid-in capital |
242,563 | 109,235 | |||||
| Retained earnings |
286,787 | 260,616 | |||||
| Accumulated other comprehensive income (loss) |
8,313 | (2,154 | ) | ||||
| Total stockholders’ equity before noncontrolling interests |
538,052 | 367,977 | |||||
| Noncontrolling interests |
5,470 | 3,012 | |||||
| Total equity |
543,522 | 370,989 | |||||
| Total Liabilities and Equity |
$ | 862,779 | $ | 549,306 | |||
The accompanying notes are an integral part of the consolidated financial statements.
44
Table of Contents
Insituform Technologies, Inc. and Subsidiaries
Consolidated Statements of Stockholders’ Equity
For the Years Ended December 31, 2009, 2008 and 2007
(In thousands, except number of shares)
| Common Stock | Additional | Accumulated Other |
Total | ||||||||||||||||||||||||||||||||
| Shares | $ | Paid-In Capital |
Retained Earnings |
Treasury Stock |
Comprehensive Income (Loss) |
Non-controlling Interests |
Stockholders’ Equity |
Comprehensive Income |
|||||||||||||||||||||||||||
| BALANCE Dec. 31, 2006 |
29,597,044 | $ | 296 | $ | 149,802 | $ | 236,763 | $ | (51,596 | ) | $ | 3,346 | $ | 2,181 | $ | 340,792 | |||||||||||||||||||
| Net income |
— | — | — | 2,543 | — | — | 525 | 3,068 | $ | 3,068 | |||||||||||||||||||||||||
| FIN No. 48 adjustment |
— | — | — | (330 | ) | — | — | — | (330 | ) | — | ||||||||||||||||||||||||
| Issuance of common stock |
231,043 | 2 | 4,395 | — | — | — | — | 4,397 | — | ||||||||||||||||||||||||||
| Restricted stock units issued |
68,247 | 1 | (1 | ) | — | — | — | — | — | — | |||||||||||||||||||||||||
| Amortization and forfeitures of restricted stock shares and units |
(68,247 | ) | (0 | ) | (1,058 | ) | — | — | — | — | (1,058 | ) | — | ||||||||||||||||||||||
| Common stock retired |
(2,357,464 | ) | (24 | ) | (51,572 | ) | — | 51,596 | — | — | — | — | |||||||||||||||||||||||
| Equity based compensation |
— | — | 2,766 | — | — | — | — | 2,766 | — | ||||||||||||||||||||||||||
| Currency translation adjustment including derivative transactions |
— | — | — | — | — | 5,612 | 11 | 5,623 | 5,623 | ||||||||||||||||||||||||||
| Total comprehensive income |
— | — | — | — | — | — | — | — | 8,691 | ||||||||||||||||||||||||||
| Less: total comprehensive income attributable to NCI |
(536 | ) | |||||||||||||||||||||||||||||||||
| Total comprehensive income attributable to common stockholder |
$ | 8,155 | |||||||||||||||||||||||||||||||||
| BALANCE Dec. 31, 2007 |
27,470,623 | $ | 275 | $ | 104,332 | $ | 238,976 | $ | — | $ | 8,958 | $ | 2,717 | $ | 355,258 | ||||||||||||||||||||
| Net income |
— | — | — | 21,640 | — | — | 925 | 22,565 | $ | 22,565 | |||||||||||||||||||||||||
| Issuance of common stock |
47,950 | (0 | ) | 887 | — | — | — | — | 887 | — | |||||||||||||||||||||||||
| Distribution of deferred stock unit |
58,953 | 1 | (452 | ) | (451 | ) | |||||||||||||||||||||||||||||
| Restricted stock units issued |
471,679 | 5 | (5 | ) | — | — | — | — | — | — | |||||||||||||||||||||||||
| Amortization and forfeitures of restricted stock shares and units |
(71,420 | ) | (1 | ) | (1 | ) | — | — | — | — | (2 | ) | — | ||||||||||||||||||||||
| Equity based compensation |
— | — | 4,474 | — | — | — | — | 4,474 | — | ||||||||||||||||||||||||||
| Currency translation adjustment including derivative transactions |
— | — | — | — | — | (11,112 | ) | (630 | ) | (11,742 | ) | (11,742 | ) | ||||||||||||||||||||||
| Total comprehensive income |
10,823 | ||||||||||||||||||||||||||||||||||
| Less: total comprehensive income attributable to NCI |
(295 | ) | |||||||||||||||||||||||||||||||||
| Total comprehensive income attributable to common stockholder |
$ | 10,528 | |||||||||||||||||||||||||||||||||
| BALANCE Dec. 31, 2008 |
27,977,785 | $ | 280 | $ | 109,235 | $ | 260,616 | $ | — | $ | (2,154 | ) | $ | 3,012 | $ | 370,989 | |||||||||||||||||||
| Net income |
— | — | — | 26,171 | — | — | 1,154 | 27,325 | $ | 27,325 | |||||||||||||||||||||||||
| Issuance of common stock |
10,573,540 | 106 | 130,291 | — | — | — | — | 130,397 | — | ||||||||||||||||||||||||||
| Restricted stock issued |
429,725 | 4 | — | 4 | |||||||||||||||||||||||||||||||
| Distribution of deferred stock units |
21,645 | — | — | — | — | — | — | — | — | ||||||||||||||||||||||||||
| Amortization and forfeitures of restricted stock shares and units |
(68,751 | ) | (1 | ) | — | — | — | — | — | (1 | ) | — | |||||||||||||||||||||||
| Equity-based compensation |
— | — | 4,839 | — | — | — | — | 4,839 | — | ||||||||||||||||||||||||||
| Dividend to NCI |
— | — | — | — | — | — | (959 | ) | (959 | ) | — | ||||||||||||||||||||||||
| Purchase of Insituform Linings |
— | — | (1,808 | ) | — | — | — | (2,171 | ) | (3,979 | ) | — | |||||||||||||||||||||||
| Investments by NCI |
— | — | — | — | — | — | 4,107 | 4,107 | — | ||||||||||||||||||||||||||
| Currency translation adjustment including derivative transactions |
— | — | 6 | — | — | 10,467 | 327 | 10,800 | 10,800 | ||||||||||||||||||||||||||
| Total comprehensive income |
— | — | — | — | — | — | — | — | 38,125 | ||||||||||||||||||||||||||
| Less: total comprehensive income attributable to NCI |
(2,458 | ) | |||||||||||||||||||||||||||||||||
| Total comprehensive income attributable to common stockholder |
$ | 35,667 | |||||||||||||||||||||||||||||||||
| BALANCE Dec. 31, 2009 |
38,933,944 | $ | 389 | $ | 242,563 | $ | 286,787 | $ | — | $ | 8,313 | $ | 5,470 | $ | 543,522 | ||||||||||||||||||||
The accompanying notes are an integral part of the consolidated financial statements.
45
Table of Contents
Insituform Technologies, Inc. and Subsidiaries
Consolidated Statements of Cash Flows
For the Years Ended December 31, 2009, 2008 and 2007
(In thousands)
| 2009 | 2008 | 2007 | ||||||||||
| Cash flows from operating activities: |
||||||||||||
| Net income |
$ | 27,325 | $ | 22,565 | $ | 3,068 | ||||||
| Loss from discontinued operations |
(4,070 | ) | (2,436 | ) | (10,323 | ) | ||||||
| Income from continuing operations |
31,395 | 25,001 | 13,391 | |||||||||
| Adjustments to reconcile to net cash provided by operating activities: |
||||||||||||
| Depreciation and amortization |
28,440 | 17,307 | 16,252 | |||||||||
| (Gain) loss on sale of fixed assets |
641 | (1,607 | ) | 389 | ||||||||
| Equity-based compensation expense |
4,839 | 4,474 | 2,766 | |||||||||
| Deferred income taxes |
3,994 | 2,780 | (4,205 | ) | ||||||||
| Dividends received from equity investments, net of equity earnings |
1,345 | — | — | |||||||||
| Patent expenditures |
(2,705 | ) | (3,489 | ) | (1,893 | ) | ||||||
| Other |
(3,998 | ) | 1,311 | 1,087 | ||||||||
| Changes in operating assets and liabilities: |
||||||||||||
| Restricted cash |
567 | 354 | (1,569 | ) | ||||||||
| Receivables net, retainage and costs and estimated earnings in excess of billings |
(19,363 | ) | (9,921 | ) | (2,039 | ) | ||||||
| Inventories |
954 | 635 | 2,008 | |||||||||
| Prepaid expenses and other assets |
8,991 | (11,104 | ) | (2,857 | ) | |||||||
| Accounts payable and accrued expenses |
491 | 12,629 | (13,755 | ) | ||||||||
| Net cash provided by operating activities of continuing operations |
55,591 | 38,370 | 9,575 | |||||||||
| Net cash provided by (used in) operating activities of discontinued operations |
6,162 | 1,558 | (1,532 | ) | ||||||||
| Net cash provided by operating activities |
61,753 | 39,928 | 8,043 | |||||||||
| Cash flows from investing activities: |
||||||||||||
| Capital expenditures |
(21,837 | ) | (15,022 | ) | (14,978 | ) | ||||||
| Proceeds from sale of fixed assets |
1,855 | 1,786 | 2,610 | |||||||||
| Purchase of remaining interests in Hong Kong and Australian joint ventures |
(278 | ) | — | — | ||||||||
| Purchase of Garneau, Inc. assets |
(11,346 | ) | — | — | ||||||||
| Proceeds from net foreign investment hedges |
6,818 | — | — | |||||||||
| Purchase of Bayou and Corrpro, net of cash acquired |
(209,714 | ) | — | — | ||||||||
| Net cash used in investing activities of continuing operations |
(234,502 | ) | (13,236 | ) | (12,368 | ) | ||||||
| Net cash provided by investing activities of discontinued operations |
798 | 1,339 | 1,530 | |||||||||
| Net cash used in investing activities |
(233,704 | ) | (11,897 | ) | (10,838 | ) | ||||||
| Cash flows from financing activities: |
||||||||||||
| Proceeds from issuance of common stock |
128,969 | 887 | 4,247 | |||||||||
| Additional tax (benefit) expense from stock option exercises recorded in additional paid-in capital |
29 | (16 | ) | 148 | ||||||||
| Proceeds from notes payable |
2,637 | 2,582 | 1,966 | |||||||||
| Principal payments on notes payable |
(4,159 | ) | (2,742 | ) | (1,959 | ) | ||||||
| Investments from noncontrolling interests |
4,107 | — | — | |||||||||
| Purchase of noncontrolling interests in Insituform Linings |
(3,979 | ) | — | — | ||||||||
| Dividend paid to noncontrolling interest |
(959 | ) | — | — | ||||||||
| Principal payments on long-term debt |
(7,500 | ) | — | (15,768 | ) | |||||||
| Proceeds from long-term debt |
53,700 | — | — | |||||||||
| Net cash provided by (used in) financing activities |
172,845 | 711 | (11,366 | ) | ||||||||
| Effect of exchange rate changes on cash |
5,849 | (8,382 | ) | (3,271 | ) | |||||||
| Net increase (decrease) in cash and cash equivalents for the period |
6,743 | 20,360 | (17,432 | ) | ||||||||
| Cash and cash equivalents, beginning of year |
99,321 | 78,961 | 96,393 | |||||||||
| Cash and cash equivalents, end of year |
$ | 106,064 | $ | 99,321 | $ | 78,961 | ||||||
| Supplemental disclosures of cash flow information: |
||||||||||||
| Cash paid for: |
||||||||||||
| Interest |
$ | 8,173 | $ | 4,307 | $ | 5,037 | ||||||
| Net income taxes paid |
7,143 | 1,229 | 6,389 | |||||||||
The accompanying notes are an integral part of the consolidated financial statements.
46
Table of Contents
Insituform Technologies, Inc. and Subsidiaries
Notes to Consolidated Financial Statements
1. DESCRIPTION OF BUSINESS
Insituform Technologies, Inc., a Delaware corporation (the “Company”), is a leading worldwide provider of proprietary technologies and services for rehabilitating sewer, water, energy and mining piping systems and the corrosion protection of industrial pipelines. The Company offers one of the broadest portfolios of cost-effective solutions for rehabilitating aging or deteriorating pipelines and protecting new pipelines from corrosion. The Company’s business activities include research and development, manufacturing, distribution, installation, coating and insulation, cathodic protection and licensing. The Company’s products and services are currently utilized and performed in more than 36 countries across six continents.
Acquisitions
During the first quarter of 2009, the Company acquired two companies that significantly expanded the range of products and services the Company offers in the energy and mining sector.
On February 20, 2009, the Company acquired the business of The Bayou Companies, L.L.C. and its related entities (“Bayou”) and the noncontrolling interests of certain subsidiaries of Bayou. Bayou provides cost-effective solutions to energy and infrastructure companies primarily in the Gulf of Mexico and North America. Bayou’s products and services include internal and external pipeline coating, lining, weighting, insulation, project management and logistics. Bayou also provides specialty fabrication services for offshore deepwater installations. The purchase price for Bayou was $127.9 million in cash. Pursuant to the acquisition agreement, the Company agreed to pay up to an additional $7.5 million plus 50% of Bayou’s excess earnings if the Bayou business achieves certain financial performance targets over a three-year period (the “earnout”). The aggregate purchase price for the noncontrolling interests was $8.5 million and consisted of $4.5 million in cash, a $1.5 million promissory note and 149,016 shares of our common stock. The Company used proceeds from its equity offering completed in February 2009 to fund the cash purchase price for Bayou and a portion of the purchase price for the noncontrolling interests.
On March 31, 2009, the Company acquired Corrpro Companies, Inc. (“Corrpro”). Corrpro is a premier provider of corrosion protection and pipeline maintenance services in North America and the United Kingdom. Corrpro’s comprehensive line of fully-integrated corrosion protection products and services includes: (i) engineering; (ii) product and material sales; (iii) construction and installation; (iv) inspection, monitoring and maintenance; and (v) coatings. The purchase price for Corrpro consisted of cash consideration paid to the Corrpro shareholders of $65.2 million. In addition, the Company repaid $26.3 million of indebtedness of Corrpro. The total acquisition cost for Corrpro was approximately $91.5 million. The Company paid the purchase price for Corrpro with borrowings under its credit facility entered into in March 2009, along with cash on hand.
The Company has completed its initial accounting for these acquisitions in accordance with the guidance included in the Financial Accounting Standards Board (“FASB”) Accounting Standards Codification (“ASC”) ASC 805, Business Combinations (“FASB ASC 805”). The Company has recorded finite-lived intangible assets at their determined fair value related to non-compete agreements, customer relationships, licenses, backlog, favorable lease terms, tradenames and trademarks. The acquisitions resulted in goodwill related to, among other things, growth opportunities and unidentified intangible assets. Approximately $15.4 million of goodwill is expected to be deductible for tax purposes. Additionally, the Company recorded its estimate of the fair value of the Bayou earnout at $5.0 million as part of the acquisition accounting in March 2009. In the third quarter of 2009, the Company revised its estimate of the fair value of the Bayou earnout to $3.4 million and reduced operating expenses in the third quarter of 2009 by $1.6 million. This reduction primarily related to the Company’s expectation that the Bayou earnings target in year one of the three-year earnout would not be met due to developments that occurred in the third quarter of 2009.
The Company has substantially completed its purchase price accounting of the acquisitions with the exception of income taxes and other certain items, some of which may be material.
The Company performed an evaluation of the guidance included in FASB ASC 280, Segment Reporting (“FASB ASC 280”), and FASB ASC 350, Intangibles – Goodwill and Other (“FASB ASC 350”). Based on that evaluation, the Company included Bayou and Corrpro as part of its Energy and Mining reportable segment. See Note 10 for additional information regarding the Company’s segments.
47
Table of Contents
In accordance with FASB ASC 805, the Company expensed all costs related to the acquisitions in the first quarter of 2009. The total costs related to the Bayou and Corrpro acquisitions were $8.2 million, which consisted of acquisition costs of $7.3 million and severance costs for certain Corrpro employees of $0.9 million. For presentation purposes, the Company included the $1.6 million reduction in earnout discussed above as a reduction to the acquisition-related expenses line on the consolidated statement of income. In addition, the Company incurred $1.2 million in costs directly related to its stock offering. These costs were recorded as a reduction to additional paid-in capital on the consolidated balance sheet.
Bayou contributed revenues and net income to the Company for the period from February 20, 2009 through December 31, 2009 of $66.4 million and $0.5 million, respectively. Corrpro contributed revenues and net income to the Company for the period from March 31, 2009 through December 31, 2009 of $132.9 million and $6.6 million, respectively. The following unaudited pro forma summary presents combined information of the Company as if these business combinations had occurred on January 1, 2008 and January 1, 2009 (in thousands):
| Twelve Months Ended December 31, | ||||||
| 2009 (1) | 2008 | |||||
| Revenues |
$ | 778,059 | $ | 857,552 | ||
| Net income(2) |
8,358 | 45,755 | ||||
| (1) | Includes $9.7 million of expense items related to after-tax acquisition-related costs incurred by the Company, Bayou and Corrpro and $8.2 million of after-tax expenses related to mark-to-market of Corrpro warrants prior to the acquisition, early termination fees and the write-off of deferred financing fees related to previously outstanding Corrpro debt. |
| (2) | Includes amortization of identified intangibles and depreciation of the excess of fair value of acquired fixed assets over their pre-acquired recorded value from purchase price allocation. |
These amounts have been calculated after applying the Company’s accounting policies and adjusting the results to reflect additional depreciation and amortization that would have been charged assuming the fair value adjustments to property, plant and equipment and intangible assets had been applied on January 1, 2008 and January 1, 2009, together with the incremental interest expense and consequential tax effects.
The following table summarizes the consideration transferred to acquire Bayou and Corrpro at the respective acquisition date (in thousands):
| Bayou | Corrpro | ||||||
| Cash and repayment of debt |
$ | 132,419 | $ | 91,549 | |||
| Issuance of Insituform shares to Bayou’s noncontrolling interest shareholders |
2,500 | — | |||||
| Six-month note payable to noncontrolling interest shareholders |
1,500 | — | |||||
| Estimated earnout payments to Bayou shareholders |
5,000 | — | |||||
| Adjustment for net working capital |
(722 | ) | — | ||||
| Total consideration transferred |
$ | 140,697 | $ | 91,549 | |||
48
Table of Contents
The following table summarizes the amounts of identified assets acquired and liabilities assumed from Bayou and Corrpro at their respective acquisition date fair value, as well as the fair value of the noncontrolling interests in Bayou at the acquisition date (in thousands):
| Bayou | Corrpro | |||||||
| Cash |
$ | 68 | $ | 14,186 | ||||
| Receivables and cost and estimated earnings in excess of billings |
17,543 | 31,824 | ||||||
| Inventory |
3,349 | 10,498 | ||||||
| Prepaid expenses and other current assets |
556 | 2,886 | ||||||
| Property, plant and equipment |
50,816 | 14,966 | ||||||
| Identified intangible assets |
32,111 | 38,786 | ||||||
| Investments |
21,286 | — | ||||||
| Other assets |
59 | 11,169 | ||||||
| Accounts payable, accrued expenses and billings in excess of cost and estimated earnings |
(8,191 | ) | (30,747 | ) | ||||
| Other long-term liabilities |
(8,002 | ) | (25,028 | ) | ||||
| Total identifiable net assets |
109,595 | 68,540 | ||||||
| Total consideration transferred |
$ | 140,697 | $ | 91,549 | ||||
| Less: total identifiable net assets |
109,595 | 68,540 | ||||||
| Goodwill at acquisition date |
$ | 31,102 | $ | 23,009 | ||||
The following adjustments were made subsequent to the initial purchase price allocation at the acquisition dates (in thousands):
| Bayou | Corrpro | |||||||
| Total identifiable net assets at acquisition date |
$ | 114,809 | $ | 62,039 | ||||
| Inventory |
(45 | ) | (1,345 | ) | ||||
| Property, plant and equipment |
(61 | ) | 4,459 | |||||
| Identifiable intangible assets |
490 | 5,436 | ||||||
| Investments |
(11,814 | ) | — | |||||
| Other long-term liabilities |
6,275 | (7,503 | ) | |||||
| Other adjustments to working capital |
(59 | ) | 5,454 | |||||
| Total identifiable net assets at December 31, 2009 |
109,595 | 68,540 | ||||||
| Goodwill at acquisition dates |
$ | 26,610 | $ | 29,510 | ||||
| Increase (decrease) in goodwill related to acquisitions |
4,492 | (6,501 | ) | |||||
| Goodwill at December 31, 2009 |
$ | 31,102 | $ | 23,009 | ||||
During 2009, the Bayou purchase price was reduced by $0.7 million due to certain amounts owed back to the Company for working capital targets at the acquisition date that were not met by Bayou. The reduction of the Bayou purchase price allocated to investments and other long-term liabilities resulted from a change in the preliminary valuation and purchase price allocation. The reduction of the Corrpro purchase price allocated to property, plant and equipment, other long-term liabilities and changes to working capital resulted from a change in the preliminary valuation and adjustments to the deferred tax assets and liabilities recorded on the opening balance sheet.
In accordance with FASB ASC 820, Fair Value Measurements (“FASB ASC 820”), the Company determined that the non-financial assets and liabilities summarized above are derived from significant unobservable inputs (“Level 3 inputs”) and that such assets and liabilities approximated their fair value.
In connection with its acquisition of Corrpro, the Company assumed an obligation associated with a contributory defined benefit pension plan sponsored by a subsidiary of Corrpro located in the United Kingdom. Employees of this Corrpro subsidiary no longer accrue benefits under the plan; however, Corrpro continues to be obligated to fund prior period benefits. Corrpro funds the plan in accordance with recommendations from an independent actuary. The benefit obligation and plan assets at March 31, 2009, the date of acquisition, approximated $6.0 million and $4.6 million, respectively. The Company recorded the unfunded status of this plan of approximately $1.4 million as part of its purchase accounting for the acquisition of Corrpro. Plan assets consist of investments in equity and debt securities as well as cash. See Note 10 for additional discussion regarding the Corrpro pension plan.
On June 30, 2009, the Company acquired the shares of its joint venture partner, VSL International Limited (“VSL”), in Insituform Asia Limited (“Insituform-Hong Kong”), the Company’s Hong Kong joint venture, and Insituform Pacific Pty Limited (“Insituform-Australia”), the Company’s Australian joint venture, in order to expand the Company’s operations in both Hong Kong and Australia. Prior to these acquisitions, the Company owned 50% of the shares in each entity and VSL owned the other 50% interest in each entity. The aggregate purchase price for VSL’s 50% interests in both companies was approximately $0.3 million.
49
Table of Contents
The Company recorded $3.4 million of goodwill in its Asia-Pacific Sewer Rehabilitation segment as a result of the Insituform-Hong Kong and Insituform-Australia transactions. The preliminary goodwill amount exceeds the aggregate purchase price because the Company’s investment in Insituform-Hong Kong and Insituform-Australia prior to the acquisitions was a deficit. The Company also contributed additional capital into these entities in order to allow Insituform-Hong Kong and Insituform-Australia to make payments to VSL in relation to approximately $1.5 million of intercompany debt. In addition, the Company took responsibility to provide support under its credit facility for Insituform-Hong Kong’s and Insituform-Australia’s existing working capital and performance bonding needs. The Company has completed its final purchase price accounting for the acquisitions. In accordance with FASB ASC 805, the Company expensed all costs related to these acquisitions in the second quarter of 2009. As a result of the acquisitions, the financial statements of Insituform-Hong Kong and Insituform-Australia are included in the Company’s consolidated financial statements as of and for the year ended December 31, 2009. For all periods prior to June 30, 2009, the Company accounted for these entities using the equity method of accounting.
On October, 30, 2009, the Company further expanded its coating and insulation services in Canada with the acquisition of the pipe coating and insulation facility and related assets of Garneau, Inc. through its joint venture Bayou Perma-Pipe Canada, Ltd. (“BPPC”). The Company holds a fifty-one percent (51%) majority interest in BPPC through its wholly-owned Canadian subsidiary, Insituform Technologies Limited. The aggregate purchase price was $11.3 million, of which the Company paid $5.8 million. In accordance with FASB ASC 805, the Company expensed all costs related to the acquisition in the fourth quarter of 2009. The Company did not record any goodwill related to this purchase. As a result of the acquisition, the financial statements of BPPC are included in the Company’s consolidated financial statements as of and for the year ended December 31, 2009.
On December 3, 2009, the Company acquired the 25% noncontrolling interest in its CIPP tube manufacturing operation, now known as Insituform Linings Limited (“Insituform Linings”) in the United Kingdom, which had been owned by Per Aarsleff, a Danish company. The aggregate purchase price for the remaining 25% interest in Insituform Linings was $3.9 million. The Company did not record any goodwill related to this purchase and the excess of the purchase price over the carrying value of the noncontrolling interest was recorded as a reduction to equity.
On January 29, 2010, the Company acquired its Singapore licensee, Insitu Envirotech (S.E. Asia) Pte Ltd, in order to expand its Singapore operations. The purchase price was $1.3 million. This entity is now a wholly-owned subsidiary.
2. SUMMARY OF ACCOUNTING POLICIES
Principles of Consolidation
The consolidated financial statements include the accounts of the Company, its wholly-owned subsidiaries and its majority-owned subsidiaries in which the Company is deemed to be the primary beneficiary. For contractual joint ventures, the Company recognizes revenue, costs and profits on its portion of the contract using percentage-of-completion accounting. All significant intercompany transactions and balances have been eliminated. Investments in entities in which the Company does not have significant control nor meet the characteristics of a variable interest entity, and for which the Company has 20% to 50% ownership are accounted for by the equity method. We have classified the results of operations of our tunneling business as discontinued operations for all periods presented.
Accounting Estimates
The preparation of financial statements in conformity with accounting principles generally accepted in the United States requires management to make estimates and assumptions that affect the reported amounts of assets and liabilities and disclosure of contingent assets and liabilities at the date of the financial statements and the reported amounts of revenues and expenses during the reporting period. Actual results could differ from those estimates.
Equity-Based Compensation
The Company records expense for equity-based compensation awards, including stock appreciation rights, restricted shares of common stock, performance awards, stock options and stock units based on the fair value recognition provisions contained in FASB ASC 718, Compensation – Stock Compensation (“FASB ASC 718”). Fair value of stock option awards is determined using an option pricing model. Assumptions regarding volatility, expected term, dividend yield and risk-free rate are required for valuation of stock option awards. Volatility and expected term assumptions are based on the Company’s historical experience. The risk-free rate is based on a U.S. Treasury note with a maturity similar to the option award’s expected term. Fair value of restricted stock, restricted stock unit and deferred stock unit awards is determined using the Company’s closing stock price on the award date. The shares of restricted stock and restricted stock units that are awarded are subject to performance and service restrictions. The Company makes forfeiture rate assumptions in connection with the valuation of restricted stock and restricted stock unit awards that could be different than actual experience. Discussion of the Company’s application of FASB ASC 718 is described in Note 7.
50
Table of Contents
Revenues
Revenues include construction and installation revenues that are recognized using the percentage-of-completion method of accounting in the ratio of costs incurred to estimated final costs. Contract costs include all direct material and labor costs and those indirect costs related to contract performance, such as indirect labor, supplies, tools and equipment costs. Since the financial reporting of these contracts depends on estimates, which are assessed continually during the term of these contracts, recognized revenues and profit are subject to revisions as the contract progresses to completion. Revisions in profit estimates are reflected in the period in which the facts that give rise to the revision become known. When estimates indicate that a loss will be incurred on a contract on completion, a provision for the expected loss is recorded in the period in which the loss becomes evident. At December 31, 2009 and 2008, the Company had provided $0.3 million and $0.2 million for expected losses on contracts. Revenues from change orders, extra work, variations in the scope of work and claims are recognized when it is probable that they will result in additional contract revenue and when the amount can be reliably estimated. Revenues for the year ended December 31, 2008 include $8.0 million of royalty revenues pursuant to a settlement agreement (See Note 10 for additional information).
The Company recognizes revenues from product sales upon shipment and transfer of ownership. Certain contracts performed by the Company’s Bayou business involve the storage of customer-supplied pipes on Company property following the completion of services. The Company does not take ownership of the pipe for which Bayou provides services. The title and risk of loss associated with the pipe remains with the customer at all times. Accordingly, the customer-supplied pipes are not included in the Company’s consolidated financial statements. In the event that the Company stores pipe at a customer’s request, title and risk of loss remain with the customer during any storage period and the Company’s only remaining obligation, which is inconsequential, is to load the stored pipe on third-party carriers when the customer requests delivery. When pipe storage is requested by a customer, the Company’s normal billing and credit terms are not modified. In these bill and hold arrangements, the Company continues to recognize revenues as coating services are completed. The Company is also subject to certain Bayou contracts that contain multiple deliverables, and revenue is recognized for each deliverable as certain accounting requirements are met.
Research and Development
The Company expenses research and development costs as incurred. Research and development costs of $2.6 million, $3.0 million and $4.2 million for the years ended December 31, 2009, 2008 and 2007, respectively, are included in operating expenses in the accompanying consolidated statements of income.
Taxation
The Company provides for estimated income taxes payable or refundable on current year income tax returns as well as the estimated future tax effects attributable to temporary differences and carryforwards, based upon enacted tax laws and tax rates, and in accordance with FASB ASC 740, Income Taxes (“FASB ASC 740”). FASB ASC 740 also requires that a valuation allowance be recorded against any deferred tax assets that are not likely to be realized in the future. Refer to Note 9 for additional information regarding taxes on income.
Earnings Per Share
Earnings per share have been calculated using the following share information:
| 2009 | 2008 | 2007 | ||||
| Weighted average number of common shares used for basic EPS |
37,134,295 | 27,537,702 | 27,330,835 | |||
| Effect of dilutive stock options, stock appreciation rights, restricted stock and deferred stock units (Note 7) |
379,232 | 642,229 | 314,094 | |||
| Weighted average number of common shares and dilutive potential common stock used in diluted EPS |
37,513,527 | 28,179,931 | 27,644,929 | |||
The Company excluded 408,515, 491,083 and 443,085 stock options in 2009, 2008 and 2007, respectively, from the diluted earnings per share calculations for the Company’s common stock because they were anti-dilutive as their exercise prices were greater than the average market price of common shares for each period.
Classification of Current Assets and Current Liabilities
The Company includes in current assets and current liabilities certain amounts realizable and payable under construction contracts that may extend beyond one year. The construction periods on projects undertaken by the Company generally range from less than one month to 24 months.
51
Table of Contents
Cash, Cash Equivalents and Restricted Cash
The Company classifies highly liquid investments with original maturities of 90 days or less as cash equivalents. Recorded book values are reasonable estimates of fair value for cash and cash equivalents. Restricted cash consists of payments from certain customers placed in escrow in lieu of retention in case of potential issues regarding future job performance by the Company or advance customer payments and compensating balances for bank undertakings in Europe. Restricted cash is similar to retainage and is therefore classified as a current asset, consistent with the Company’s policy on retainage.
Retainage
Many of the contracts under which the Company performs work contain retainage provisions. Retainage refers to that portion of revenue earned by the Company but held for payment by the customer pending satisfactory completion of the project. Unless reserved, the Company assumes that all amounts retained by customers under such provisions are fully collectible. Retainage on active contracts is classified as a current asset regardless of the term of the contract. Retainage is generally collected within one year of the completion of a contract, although collection can take up to two years in Europe. There was no material retainage due after one year at December 31, 2009 and 2008.
Allowance for Doubtful Accounts
Management makes estimates of the uncollectibility of accounts receivable and retainage. The Company records an allowance based on specific accounts to reduce receivables, including retainage, to the amount that is expected to be collected. The specific allowances are reevaluated and adjusted as additional information is received. After all reasonable attempts to collect the receivable or retainage have been explored, the account is written off against the allowance.
Inventories
Inventories are stated at the lower of cost (first-in, first-out) or market. Actual cost is used to value raw materials and supplies. Standard cost, which approximates actual cost, is used to value work-in-process, finished goods and construction materials. Standard cost includes direct labor, raw materials and manufacturing overhead based on normal capacity.
Long-Lived Assets
Property, plant and equipment, goodwill and other identified intangibles (primarily patents, trademarks, licenses and non-compete agreements) are recorded at cost and, except for goodwill, are depreciated or amortized on a straight-line basis over their estimated useful lives. Changes in circumstances such as technological advances, changes to the Company’s business model or changes in the Company’s capital strategy can result in the actual useful lives differing from the Company’s estimates. If the Company determines that the useful life of its property, plant and equipment or its identified intangible assets should be changed, the Company would depreciate or amortize the net book value in excess of the salvage value over its revised remaining useful life, thereby increasing or decreasing depreciation or amortization expense.
Long-lived assets, including property, plant and equipment and other intangibles, are reviewed for impairment whenever events or changes in circumstances indicate that the carrying amount of an asset may not be recoverable. Such impairment tests are based on a comparison of undiscounted cash flows to the recorded value of the asset. The estimate of cash flow is based upon, among other things, assumptions about expected future operating performance. The Company’s estimates of undiscounted cash flow may differ from actual cash flow due to, among other things, technological changes, economic conditions, changes to its business model or changes in its operating performance. If the sum of the undiscounted cash flows (excluding interest) is less than the carrying value, the Company recognizes an impairment loss, measured as the amount by which the carrying value exceeds the fair value of the asset. The Company did not identify any long-lived assets of its continuing operations as being impaired during 2009, 2008 or 2007.
Goodwill
Under FASB ASC 350, Intangibles – Goodwill and Other, the Company assesses recoverability of goodwill on an annual basis or when events or changes in circumstances indicate that the carrying amount of goodwill may not be recoverable. The annual assessment was last completed as of October 1, 2009. Factors that could potentially trigger an impairment review include (but are not limited to):
| • | significant underperformance of a segment relative to expected, historical or projected future operating results; |
| • | significant negative industry or economic trends; |
| • | significant changes in the strategy for a segment including extended slowdowns in a segment’s market; and |
| • | a decrease in the Company’s market capitalization below its book value for an extended period of time. |
52
Table of Contents
The following table presents a reconciliation of the beginning and ending balances of the Company’s goodwill at December 31, 2009 and 2008 (in millions):
| 2009 | 2008 | |||||
| Beginning balance |
$ | 123.0 | $ | 122.6 | ||
| Additions to goodwill through acquisitions(1) |
57.5 | — | ||||
| Other changes (2) |
— | 0.4 | ||||
| Goodwill at end of period |
$ | 180.5 | $ | 123.0 | ||
| (1) | During 2009, the Company recorded goodwill of $54.1 million related to the acquisitions of Bayou and Corrpro and $3.4 million related to the acquisition of its joint venture partner’s interests in Insituform-Australia and Insituform-Hong Kong. |
| (2) | The Company does not have any accumulated impairment charges. |
The Company’s recorded goodwill by reportable segment was as follows at December 31, 2009 and 2008 (in millions):
| 2009 | 2008 | |||||
| North American Sewer Rehabilitation |
$ | 102.3 | $ | 102.3 | ||
| European Sewer Rehabilitation |
19.8 | 19.8 | ||||
| Asia-Pacific Sewer Rehabilitation |
3.4 | — | ||||
| Energy and Mining |
55.0 | 0.9 | ||||
| Total goodwill |
$ | 180.5 | $ | 123.0 | ||
No goodwill was recorded for the Water Rehabilitation segment at December 31, 2009. In accordance with the provisions of FASB ASC 350, the Company determined the fair value of its reporting units at the annual impairment assessment date and compared such fair value to the carrying value of those reporting units to determine if there were any indication of goodwill impairment. The Company’s reporting units for purposes of assessing goodwill are North American Sewer Rehabilitation, European Sewer Rehabilitation, Asia-Pacific Sewer Rehabilitation, UPS, Bayou and Corrpro.
Fair value of reporting units is determined using a combination of two valuation methods: a market approach and an income approach with each method given equal weight in determining the fair value assigned to each reporting unit. Absent an indication of fair value from a potential buyer or similar specific transaction, the Company believes the use of these two methods provides a reasonable estimate of a reporting unit’s fair value. Assumptions common to both methods are operating plans and economic projections, which are used to project future revenues, earnings and after tax cash flows for each reporting unit. These assumptions are applied consistently for both methods.
The market approach estimates fair value by first determining earnings before interest, taxes, depreciation and amortization (“EBITDA”) multiples for comparable publicly-traded companies with similar characteristics of the reporting unit. The EBITDA multiples for comparable companies is based upon current enterprise value. The enterprise value is based upon current market capitalization and includes a 15% control premium. Management believes this approach is appropriate because it provides a fair value estimate using multiples from entities with operations and economic characteristics comparable to the Company’s reporting units.
The income approach is based on projected future (debt-free) cash flows that are discounted to present value using factors that consider timing and risk of future cash flows. Management believes this approach is appropriate because it provides a fair value estimate based upon the reporting unit’s expected long-term operating cash flow performance. Discounted cash flow projections are based on financial forecasts developed from operating plans and economic projections, growth rates, estimates of future expected changes in operating margins, terminal value growth rates, future capital expenditures and changes in working capital requirements. Estimates of discounted cash flows may differ from actual cash flows due to, among other things, changes in economic conditions, changes to business models, changes in the Company’s weighted average cost of capital or changes in operating performance. An impairment charge will be recognized to the extent that the implied fair value of the goodwill balances for each reporting unit is less than the related carrying value. In performing this analysis, the Company revised its estimated future cash flows and discount rates, as appropriate, to reflect a variety of market conditions. In each case, no impairment was indicated.
53
Table of Contents
Given the continued distressed global market and economic conditions, the Company carefully considered whether an interim assessment of its goodwill was necessary during the quarter ended December 31, 2009. In management’s judgment, the Company does not believe the fair value of its reporting units is below their carrying value at December 31, 2009. Accordingly, an interim impairment assessment was not performed. A future decline in the fair value of North American Sewer Rehabilitation, European Sewer Rehabilitation, Asia-Pacific Sewer Rehabilitation and Energy and Mining operations could lead to impairment of their respective goodwill balances. The recorded goodwill related to the Asia-Pacific Sewer Rehabilitation segment is the result of the Company’s recent acquisitions of Insituform-Hong Kong and Insituform-Australia (see Note 1 to our consolidated financial statements contained in this report). The recorded goodwill related to our Energy and Mining segment is the result of the Company’s recent acquisitions of Bayou and Corrpro (see Note 1 to our consolidated financial statements contained in this report). While not currently anticipated, any significant deterioration in the earnings of those businesses compared to the forecasted earnings assumptions used in the determination of their fair value could lead to the need for the Company to assess the recoverability of the recorded goodwill and potential impairment.
Significant assumptions used in the October 2009 review included: (i) five- to eight-year compound annual growth rates ranging from 2% to 36%; (ii) terminal values for each reporting unit using a long-term growth rate of 3%; and (iii) discount rates ranging from 13.5% to 17.5%. If actual results differ from estimates used in these calculations, the Company could incur future impairment charges. During the Company’s assessment of the reporting units fair values in relation to their respective carrying values, the Company had two reporting units that had a fair value within 20% of their carrying value. The total value of goodwill recorded for these reporting units was $54.1 million. The Company had four reporting units that had a fair value in excess of 20% of their carrying value. The total goodwill recorded for these reporting units was $126.4 million.
Investments in Variable Interest Entities
The Company evaluates all transactions and relationships with variable interest entities (“VIE”) to determine whether the Company is the primary beneficiary of the entities in accordance with FASB ASC 805.
The Company’s overall methodology for evaluating transactions and relationships under the VIE requirements includes the following two steps:
| • | determine whether the entity meets the criteria to qualify as a VIE; and |
| • | determine whether the Company is the primary beneficiary of the VIE. |
In performing the first step, the significant factors and judgments that the Company considers in making the determination as to whether an entity is a VIE include:
| • | the design of the entity, including the nature of its risks and the purpose for which the entity was created, to determine the variability that the entity was designed to create and distribute to its interest holders; |
| • | the nature of the Company’s involvement with the entity; |
| • | whether control of the entity may be achieved through arrangements that do not involve voting equity; |
| • | whether there is sufficient equity investment at risk to finance the activities of the entity; and |
| • | whether parties other than the equity holders have the obligation to absorb expected losses or the right to receive residual returns. |
If the Company identifies a VIE based on the above considerations, it then performs the second step and evaluates whether it is the primary beneficiary of the VIE by considering the following significant factors and judgments:
| • | whether the Company’s variable interest absorbs the majority of the VIE’s expected losses; |
| • | whether the Company’s variable interest absorbs the majority of the VIE’s expected returns; and |
| • | whether the Company has the ability to make decisions that significantly affect the VIE’s results and activities. |
Based on its evaluation of the above factors and judgments, as of December 31, 2009, the Company did not consolidate any VIEs. Also, as of December 31, 2009, the Company has significant interests in several VIEs primarily through its joint venture arrangements for which it did not have controlling financial interests and, accordingly, was not the primary beneficiary. There were no changes in the status of the Company’s VIE or primary beneficiary designations that occurred during 2009.
The Company develops joint bids on certain contracts with its joint venture partners. The success of the joint venture depends largely on the satisfactory performance of the Company’s joint venture partner of its obligations under the contract. The Company may be required to complete its joint venture partner’s portion of the contract if the joint venture partner were unable to complete its portion and a bond was not available. In such case, the additional obligations could result in reduced profits or, in some cases, significant losses for the Company’s joint ventures. The Company currently assesses the impact of these joint ventures to its consolidated financial position, financial performance and cash flows to be immaterial.
54
Table of Contents
Foreign Currency Translation
Results of operations for foreign entities are translated using the average exchange rates during the period. Current assets and liabilities are translated to U.S. dollars using the exchange rates in effect at the balance sheet date, and the related translation adjustments are reported as a separate component of stockholders’ equity.
Newly Adopted Accounting Pronouncements
Effective July 1, 2009, FASB issued Statement of Financial Accounting Standards No. 168, The FASB Accounting Standards Codification TM and the Hierarchy of Generally Accepted Accounting Principles – a replacement of FASB Statement No. 162” (the “FASB ASC”). The FASB ASC will be the single source of authoritative nongovernmental U.S. GAAP. The FASB ASC was effective for financial statements that cover interim and annual periods ending after September 15, 2009. The FASB ASC does not change GAAP; instead, it introduces a new structure that is organized in an easily accessible, user-friendly online research system. Technical references to GAAP included in this report are provided under the new FASB ASC structure.
FASB ASC 820, Fair Value Measurements and Disclosures (“FASB ASC 820”), defines fair value, establishes a framework for measuring fair value, and expands disclosures about fair value measurements. FASB ASC 820 clarifies that fair value is a market-based measurement that should be based on the assumptions that market participants would use in pricing an asset or liability. See Note 8 for additional information on the Company’s adoption of FASB ASC 820. The Company adopted FASB ASC 820 as of January 1, 2008 for financial assets and liabilities and as of January 1, 2009 for non-financial assets and liabilities, except those already reported at fair value on a recurring basis. The impact of the adoption of FASB ASC 820 for financial assets and liabilities at January 1, 2008 was not material. The impact of the adoption of FASB ASC 820 for non-financial assets and liabilities at January 1, 2009 impacted the purchase accounting for the Company’s acquisitions discussed in Note 1 to the consolidated financial statements.
FASB ASC 805, Business Combinations (“FASB ASC 805”), introduced significant changes in the accounting for and reporting of business acquisitions and noncontrolling interests in a subsidiary. FASB ASC 805 requires the acquiring entity in a business combination to recognize assets acquired and liabilities assumed in the transaction at fair value; it requires certain contingent assets and liabilities acquired be recognized at their fair values on the acquisition date; and it requires expensing of acquisition-related costs as incurred, among other provisions. FASB ASC 805 was effective as of January 1, 2009. It applies prospectively to business combinations completed on or after that date. Refer to Note 1 for further information regarding the application of FASB ASC 805 to the Company’s recent acquisitions.
FASB ASC 810, Consolidation (“FASB ASC 810”), establishes accounting and reporting standards for minority interests, which are recharacterized as noncontrolling interests. Under the provisions of FASB ASC 810, noncontrolling interests are classified as a component of equity separate from the parent’s equity; purchases or sales of equity interests that do not result in a change in control are accounted for as equity transactions; net income attributable to the noncontrolling interest are included in consolidated net income in the statement of operations; and upon a loss of control, the interest sold, as well as any interest retained, is recorded at fair value, with any gain or loss recognized in earnings. FASB ASC 810 was effective for the Company as of January 1, 2009. It applies prospectively, except for the presentation and disclosure requirements, for which it applies retroactively. In addition, FASB ASC 810, amends the consolidation guidance applicable to variable interest entities. The amendments will significantly affect the overall consolidation analysis under FASB ASC 810. This phase of FASB ASC 810 becomes effective for the Company on January 1, 2010. The Company is still assessing the potential impact of the adoption of this phase of FASB ASC 810 but does not expect the impact to be material.
FASB ASC 815, Derivatives and Hedging (“FASB ASC 815”), changes the disclosure requirements for derivative instruments and hedging activities to include enhanced disclosures about how and why an entity uses derivative instruments, how derivative instruments and related hedged items are accounted for under FASB ASC 815 and how derivative instruments and related hedged items affect an entity’s financial position, financial performance and cash flows. FASB ASC 815 was effective for the Company as of January 1, 2009. Refer to Note 11 for further information regarding our derivative instruments.
FASB ASC 825, Financial Instruments (“FASB ASC 825”), increases the frequency of fair value disclosures for financial instruments that are within the scope of FASB ASC 825, requiring public entities to provide these disclosures on a quarterly basis rather than just annually. FASB ASC 825 became effective for the Company during the second quarter of 2009. Refer to Note 5 for further information related to the Company’s adoption of FASB ASC 825 in relation to its long-term debt. All other recorded book values of assets and liabilities within the scope of FASB ASC 825 are reasonable estimates of their fair value.
FASB ASC 855, Subsequent Events (“FASB ASC 855”), established principles and requirements for subsequent events. The statement details the period after the balance sheet date during which the Company should evaluate events or transactions that may occur for potential recognition or disclosure in the financial statements, the circumstances under which the Company should recognize events or transactions occurring after the balance sheet date in its financial statements and the required disclosures for such events. FASB ASC 855 is effective for interim or annual reporting periods ending after June 15, 2009.
55
Table of Contents
3. SUPPLEMENTAL BALANCE SHEET INFORMATION
Allowance for Doubtful Accounts
Activity in the allowance for doubtful accounts is summarized as follows for the years ended December 31 (in thousands):
| 2009 | 2008 | 2007 | |||||||||
| Balance, at beginning of year |
$ | 1,700 | $ | 2,418 | $ | 2,600 | |||||
| Charged to expense |
396 | 46 | 110 | ||||||||
| Write-offs and adjustments |
309 | (764 | ) | (292 | ) | ||||||
| Balance, at end of year |
$ | 2,405 | $ | 1,700 | $ | 2,418 | |||||
Costs and Estimated Earnings on Uncompleted Contracts
Costs and estimated earnings on uncompleted contracts consisted of the following at December 31 (in thousands):
| 2009 | 2008 | |||||||
| Costs incurred on uncompleted contracts |
$ | 495,691 | $ | 430,754 | ||||
| Estimated earnings to date |
139,885 | 54,178 | ||||||
| Subtotal |
635,576 | 484,932 | ||||||
| Less – billings to date |
(583,452 | ) | (457,304 | ) | ||||
| Total |
$ | 52,124 | $ | 27,628 | ||||
| Included in the accompanying balance sheets: |
||||||||
| Costs and estimated earnings in excess of billings |
64,821 | $ | 37,224 | |||||
| Billings in excess of costs and estimated earnings |
(12,697 | ) | (9,596 | ) | ||||
| Total |
$ | 52,124 | $ | 27,628 | ||||
Costs and estimated earnings in excess of billings represent work performed that could not be billed either due to contract stipulations or the lack of required contractual documentation. Substantially all unbilled amounts are expected to be billed and collected within one year.
Inventories
Inventories are summarized as follows at December 31 (in thousands):
| 2009 | 2008 | |||||
| Raw materials and supplies |
$ | 7,551 | $ | 2,844 | ||
| Work-in-process |
3,324 | 4,101 | ||||
| Finished products |
6,245 | 996 | ||||
| Construction materials |
15,005 | 8,379 | ||||
| Total |
$ | 32,125 | $ | 16,320 | ||
Property, Plant and Equipment
Property, plant and equipment consisted of the following at December 31 (in thousands):
| Estimated Useful Lives (Years) |
2009 | 2008 | ||||||||
| Land and land improvements |
$ | 12,379 | $ | 8,242 | ||||||
| Buildings and improvements |
5 – 40 | 59,943 | 31,024 | |||||||
| Machinery and equipment |
4 – 10 | 142,386 | 85,889 | |||||||
| Furniture and fixtures |
3 – 10 | 13,188 | 11,928 | |||||||
| Autos and trucks |
3 – 10 | 38,869 | 35,132 | |||||||
| Construction in progress |
5,764 | 6,404 | ||||||||
| Subtotal |
272,529 | 178,619 | ||||||||
| Less – Accumulated depreciation |
(124,094 | ) | (107,196 | ) | ||||||
| Total |
$ | 148,435 | $ | 71,423 | ||||||
56
Table of Contents
Depreciation expense was $22.6 million, $15.7 million and $16.0 million for the years ended December 31, 2009, 2008 and 2007, respectively.
Other Assets
Other assets are summarized as follows at December 31 (in thousands):
| 2009 | 2008 | |||||
| Notes receivable from affiliated companies |
$ | 1,854 | $ | 1,464 | ||
| Non-current tax receivable |
615 | 761 | ||||
| Other |
6,358 | 1,870 | ||||
| Total |
$ | 8,827 | $ | 4,095 | ||
Accounts Payable and Accrued Expenses
Accounts payable and accrued expenses consisted of the following at December 31 (in thousands):
| 2009 | 2008 | |||||
| Accounts payable – trade |
$ | 102,985 | $ | 62,271 | ||
| Estimated casualty and healthcare liabilities |
16,894 | 17,872 | ||||
| Job costs |
16,321 | 9,310 | ||||
| Compensation and bonus accruals |
9,260 | 7,121 | ||||
| Interest |
894 | 791 | ||||
| Job loss reserves |
348 | 181 | ||||
| Other |
— | 47 | ||||
| Total |
$ | 146,702 | $ | 97,593 | ||
Casualty Insurance and Healthcare Liabilities
The Company obtains actuarial estimates of its liabilities on a quarterly basis and adjusts its reserves accordingly. Estimated casualty insurance and healthcare benefits liabilities are summarized as follows at December 31 (in thousands):
| 2009 | 2008 | |||||
| Casualty insurance |
$ | 14,799 | $ | 16,368 | ||
| Healthcare benefits |
2,095 | 1,504 | ||||
| Total |
$ | 16,894 | $ | 17,872 | ||
4. ACQUIRED INTANGIBLE ASSETS
Amortized intangible assets were as follows (in thousands):
| As of December 31, 2009 | As of December 31, 2008 | |||||||||||||||||||||
| Weighted Average Useful Lives (Years) |
Gross Carrying Amount |
Accumulated Amortization |
Net Carrying Amount |
Gross Carrying Amount |
Accumulated Amortization |
Net Carrying Amount | ||||||||||||||||
| License agreements |
10 | $ | 3,894 | $ | (2,302 | ) | $ | 1,592 | $ | 3,894 | $ | (2,139 | ) | $ | 1,755 | |||||||
| Contract backlog |
1 | 3,010 | (1,737 | ) | 1,273 | — | — | — | ||||||||||||||
| Leases |
21 | 1,237 | (44 | ) | 1,193 | — | — | — | ||||||||||||||
| Trademarks and tradenames |
19 | 14,400 | (569 | ) | 13,831 | — | — | — | ||||||||||||||
| Non-compete agreements |
2 | 740 | (257 | ) | 483 | — | — | — | ||||||||||||||
| Customer relationships |
16 | 53,307 | (3,276 | ) | 50,031 | 1,797 | (633 | ) | 1,164 | |||||||||||||
| Patents |
17 | 24,173 | (14,265 | ) | 9,908 | 21,431 | (13,997 | ) | 7,434 | |||||||||||||
| Total |
$ | 100,761 | $ | (22,450 | ) | $ | 78,311 | $ | 27,122 | $ | (16,769 | ) | $ | 10,353 | ||||||||
57
Table of Contents
Amortization expense was $5.7 million and $0.7 million for the years ended December 31, 2009 and 2008, respectively. Estimated amortization expense is as follows (in thousands):
| For year ending December 31, 2010 |
$ | 6,102 | |
| For year ending December 31, 2011 |
4,784 | ||
| For year ending December 31, 2012 |
4,464 | ||
| For year ending December 31, 2013 |
4,459 | ||
| For year ending December 31, 2014 |
4,459 |
5. LONG-TERM DEBT AND CREDIT FACILITY
Long-term debt, line of credit and notes payable consisted of the following at December 31 (in thousands):
| 2009 | 2008 | |||||
| 6.54% Senior Notes, Series 2003-A, due April 24, 2013 |
65,000 | 65,000 | ||||
| Credit agreement with Bank of America as administrative agent, current annualized rate 3.74% due March 31, 2012 |
42,500 | — | ||||
| Other notes with interest rates from 5.0% to 10.5% |
6,742 | 938 | ||||
| Subtotal |
114,242 | 65,938 | ||||
| Less – Current maturities and notes payable |
12,742 | 938 | ||||
| Total |
$ | 101,500 | $ | 65,000 | ||
Principal payments required to be made for each of the next five years and thereafter are summarized as follows (in thousands):
| Year |
Amount | ||
| 2010 |
$ | 12,742 | |
| 2011 |
10,000 | ||
| 2012 |
26,500 | ||
| 2013 |
65,000 | ||
| 2014 |
— | ||
| Total |
$ | 114,242 | |
At December 31, 2009 and 2008, the estimated fair value of the Company’s long-term debt was approximately $115 million and $68 million, respectively. Fair value was estimated using market rates for debt of similar risk and maturity.
Financing Arrangements
On March 31, 2009, the Company entered into a Credit Agreement with Bank of America, N.A., as Administrative Agent, Fifth Third Bank, U.S. Bank, National Association, Compass Bank, JPMorgan Chase Bank, N.A., Associated Bank, N.A. and Capital One, N.A (the “New Facility”). The New Facility is unsecured and consisted of a $50.0 million term loan and a $65.0 million revolving line of credit, each with a maturity date of March 31, 2012. The Company has the ability to increase the amount of the borrowing commitment under the New Facility by up to $25.0 million in the aggregate upon the consent of the lenders.
At the Company’s election, borrowings under the New Facility bear interest at either (i) a fluctuating rate of interest equal on any day to the higher of Bank of America, N.A.’s announced prime rate, the Federal Funds Rate plus 0.50% or the one-month LIBOR plus 1.0%, plus in each case a margin ranging from 1.75% to 3.00%, or (ii) rates of interest fixed for one, two, three or nine months at the British Bankers Association LIBOR Rate for such period plus a margin ranging from 2.75% to 4.00%. The applicable margins are determined quarterly based upon the Company’s consolidated leverage ratio. The current annualized rate on outstanding borrowings under the New Facility at December 31, 2009 was 3.74%.
The New Facility is subject to certain financial covenants, including a consolidated financial leverage ratio and consolidated fixed charge coverage ratio. The New Facility also provides for events of default, including in the event of non-payment or certain defaults under other outstanding indebtedness of the Company. The Company was in compliance with each of these covenants at December 31, 2009.
58
Table of Contents
This New Facility replaced the Company’s credit facility that was due to expire on April 30, 2009. Letters of credit that were outstanding as of March 31, 2009 under the expiring facility were converted to letters of credit under the New Facility. As of December 31, 2009, the Company had $22.5 million in letters of credit issued and outstanding under the New Facility. Of such amount, (i) $13.6 million was collateral for the benefit of certain of the Company’s insurance carriers, (ii) $1.5 million was collateral for work performance obligations, (iii) $4.5 million was for security in support of working capital needs of Insituform Pipeline Rehabilitation Private Limited, the Company’s Indian joint venture, and the working capital and performance bonding needs of the Company’s Australian and Hong Kong operations and (iv) $2.9 million was in support of international trade transactions.
In connection with its acquisition of Corrpro on March 31, 2009, the Company borrowed the entire amount of the term loan of $50.0 million and approximately $7.5 million under the revolving line of credit. The line of credit borrowing of $7.5 million was subsequently repaid.
The Company’s total indebtedness at December 31, 2009 consisted of the Company’s $65.0 million 6.54% Senior Notes, Series 2003-A, due April 24, 2013, $42.5 million of the original, $50.0 million term loan and $2.7 million of third party notes and bank debt in connection with the working capital requirements of Insituform-India. In connection with the formation of Bayou Perma-Pipe Canada, as discussed in Note 1, the Company and Perma-Pipe Inc. loaned the joint venture an aggregate of $8.0 million for the purchase of capital assets and for operating purposes. Of such amount, $4.0 million is designated in our consolidated financial statements as third-party debt. The Company’s total indebtedness at December 31, 2008 consisted of the Company’s $65.0 million 6.54% Senior Notes, Series 2003-A, due April 24, 2013, and $0.9 million of other notes related to the financing of certain insurance premiums.
Debt Covenants
At December 31, 2009, the Company was in compliance with all of its debt covenants as required under the Senior Notes and the New Facility. The Company believes it has adequate resources to fund future cash requirements and debt repayments for at least the next twelve months with cash generated from operations, existing cash balances, additional short- and long-term borrowings and the sale of assets.
6. STOCKHOLDERS’ EQUITY
Equity Offering
On February 17, 2009, the Company completed a secondary offering of 10,350,000 shares of the Company’s common stock. The Company used proceeds from the equity offering to fund the cash purchase price for Bayou as discussed in Note 1 to the financial statements.
Equity Compensation Plans
In April 2009, the Company’s stockholders approved the 2009 Employee Equity Incentive Plan (the “2009 Employee Plan”), which replaced the 2006 Employee Equity Incentive Plan (“Employee Plan”), and provides for equity-based compensation awards, including stock appreciation rights, restricted shares of common stock, performance awards, stock options and stock units. There are 2,500,000 shares of the Company’s common stock registered for issuance under the 2009 Employee Plan. The 2009 Employee Plan is administered by the compensation committee of the Board of Directors, which determines eligibility, timing, pricing, amount and other terms or conditions of awards. At December 31, 2009, there were 15,822 options and 35,967 unvested shares of restricted stock and restricted stock units outstanding under the 2009 Employee Plan.
At December 31, 2009, there were 716,790 options and 614,800 unvested shares of restricted stock and restricted stock units outstanding under the Employee Plan.
The Employee Plan replaced the 2001 Employee Equity Incentive Plan, and contained substantially the same provisions as the former plan. At December 31, 2009, there were 249,049 options outstanding under the 2001 Employee Equity Incentive Plan.
The 2006 Non-Employee Director Equity Incentive Plan (“Director Plan”) provides for equity-based compensation awards, including non-qualified stock options and stock units. There are 200,000 shares of the Company’s common stock registered for issuance under the Director Plan. The Board of Directors administers the Director Plan and has the authority to establish, amend and rescind any rules and regulations related to the Director Plan. At December 31, 2009, there were 80,074 deferred stock units outstanding under the Director Plan.
59
Table of Contents
The Director Plan replaced the 2001 Non-Employee Director Equity Incentive Plan, and contains substantially the same provisions as the former plan. At December 31, 2009, there were 37,500 options and 67,300 deferred stock units outstanding under the 2001 Non-Employee Director Equity Incentive Plan.
At December 31, 2009, there were 148,479 options outstanding under the 1992 Employee Stock Option Plan and the 1992 Director Stock Option Plan.
Activity and related expense associated with these plans are described in Note 7.
Shareholders’ Rights Plan
In February 2002, the Company’s Board of Directors adopted a Shareholders’ Rights Plan. Pursuant to the Shareholders’ Rights Plan, the Board of Directors declared a dividend distribution of one preferred stock purchase right for each outstanding share of the Company’s common stock, payable to the Company’s stockholders of record as of March 13, 2002. Each right, when exercisable, entitles the holder to purchase from the Company one one-hundredth of a share of a new series of voting preferred stock, designated as Series A Junior Participating Preferred Stock, $0.10 par value, at an exercise price of $116.00 per one one-hundredth of a share.
The rights will trade in tandem with the common stock until 10 days after a “distribution event” (i.e., the announcement of an intention to acquire or the actual acquisition of 20% or more of the outstanding shares of common stock), at which time the rights would become exercisable. Upon exercise, the holders of the rights (other than the person who triggered the distribution event) will be able to purchase for the exercise price, shares of common stock (or the common stock of the entity which acquires the Company) having the then market value of two times the aggregate exercise price of the rights. The rights expire on March 12, 2012, unless redeemed, exchanged or otherwise terminated at an earlier date.
7. EQUITY-BASED COMPENSATION
Stock Awards
Stock awards, which include restricted stock shares and restricted stock units, of the Company’s common stock are awarded from time to time to executive officers and certain key employees of the Company. Stock award compensation is recorded based on the award date fair value and charged to expense ratably through the restriction period. Forfeitures of unvested stock awards cause the reversal of all previous expense recorded as a reduction of current period expense.
A summary of stock award activity during the year ended December 31, 2009, 2008 and 2007 is as follows:
| For the Years Ended December 31, | ||||||||||||||||||
| 2009 | 2008 | 2007 | ||||||||||||||||
| Stock Awards |
Weighted Average Award Date Fair Value |
Stock Awards |
Weighted Average Award Date Fair Value |
Stock Awards |
Weighted Average Award Date Fair Value | |||||||||||||
| Outstanding, beginning of period |
475,787 | $ | 14.25 | 102,089 | $ | 19.31 | 131,500 | $ | 17.73 | |||||||||
| Awarded |
429,725 | 13.29 | 471,679 | 13.41 | 68,247 | 22.96 | ||||||||||||
| Vested |
(47,087 | ) | 16.75 | (37,763 | ) | 16.91 | (61,022 | ) | 18.15 | |||||||||
| Forfeited |
(51,782 | ) | 13.49 | (60,218 | ) | 14.61 | (36,636 | ) | 22.39 | |||||||||
| Outstanding, end of period |
806,643 | $ | 13.64 | 475,787 | $ | 14.25 | 102,089 | $ | 19.31 | |||||||||
Expense associated with stock awards was $3.1 million, $1.9 million and $0.9 million in 2009, 2008 and 2007, respectively. Unrecognized pre-tax expense of $6.5 million related to stock awards is expected to be recognized over the weighted average remaining service period of 1.8 years for awards outstanding at December 31, 2009.
Deferred Stock Units
Deferred stock units generally are awarded to directors of the Company and represent the Company’s obligation to transfer one share of the Company’s common stock to the grantee at a future date and generally are fully vested on the date of grant. The expense related to the issuance of deferred stock units is recorded according to this vesting schedule.
60
Table of Contents
The following table summarizes information about deferred stock unit activity during the years ended December 31, 2009, 2008 and 2007:
| For the Years Ended December 31, | |||||||||||||||||
| 2009 | 2008 | 2007 | |||||||||||||||
| Deferred Stock Units |
Weighted Average Award Date Fair Value |
Deferred Stock Units |
Weighted Average Award Date Fair Value |
Deferred Stock Units |
Weighted Average Award Date Fair Value | ||||||||||||
| Outstanding, beginning of period |
130,018 | $ | 18.46 | 155,098 | $ | 18.51 | 93,807 | $ | 18.53 | ||||||||
| Awarded |
39,001 | 16.85 | 51,364 | 15.72 | 61,291 | 18.48 | |||||||||||
| Shares distributed |
(21,645 | ) | 17.14 | (58,953 | ) | 19.37 | — | — | |||||||||
| Forfeited |
— | — | (17,491 | ) | 13.56 | — | — | ||||||||||
| Outstanding, end of period |
147,374 | $ | 18.22 | 130,018 | $ | 18.46 | 155,098 | $ | 18.51 | ||||||||
Expense associated with awards of deferred stock units was $0.7 million, $1.1 million and $0.6 million in 2009, 2008 and 2007, respectively.
Stock Options
Stock options on the Company’s common stock are awarded from time to time to executive officers and certain key employees of the Company. Stock options granted generally have a term of seven to ten years and an exercise price equal to the market value of the underlying common stock on the date of grant. The Company uses a binomial option-pricing model for valuation purposes to reflect the features of stock options granted. The fair value of stock options awarded during 2009, 2008 and 2007 was estimated at the date of grant based on the assumptions presented in the table below. Volatility, expected term and dividend yield assumptions were based on the Company’s historical experience. The risk-free rate was based on a U.S. treasury note with a maturity similar to the option award’s expected term.
| 2009 | 2008 | 2007 | |||||||||||||
| Range | Weighted Average |
Range | Weighted Average |
Range | Weighted Average |
||||||||||
| Volatility |
49.4% – 50.1% | 50.1 | % | 37.3% – 41.9% | 40.6 | % | 44.6% – 46.4% | 45.1 | % | ||||||
| Expected term (years) |
7.0 | 7.0 | 4.5 – 5.0 | 4.9 | 4.5 – 4.8 | 4.7 | |||||||||
| Dividend yield |
0.0% | 0.0 | % | 0.0% | 0.0 | % | 0.0 % | 0.0 | % | ||||||
| Risk-free rate |
2.5% – 3.2% | 2.5 | % | 4.0% | 4.0 | % | 4.0% – 4.6% | 4.5 | % | ||||||
A summary of stock option activity during the years ended December 31, 2009, 2008 and 2007:
| 2009 | 2008 | 2007 | ||||||||||||||||
| Shares | Weighted Average Exercise Price |
Shares | Weighted Average Exercise Price |
Shares | Weighted Average Exercise Price | |||||||||||||
| Outstanding at January 1 |
1,032,773 | $ | 19.18 | 909,987 | $ | 21.27 | 1,298,392 | $ | 19.85 | |||||||||
| Granted |
340,609 | 12.83 | 424,021 | 13.42 | 417,607 | 23.77 | ||||||||||||
| Exercised |
(74,524 | ) | 15.30 | (47,950 | ) | 13.98 | (231,043 | ) | 14.34 | |||||||||
| Forfeited/expired |
(131,218 | ) | 18.20 | (242,345 | ) | 17.84 | (574,966 | ) | 22.59 | |||||||||
| Outstanding at December 31 |
1,167,640 | $ | 17.71 | 1,032,773 | $ | 19.18 | 909,987 | $ | 21.27 | |||||||||
| Exercisable at December 31 |
633,789 | $ | 21.30 | 601,572 | $ | 22.21 | 685,428 | $ | 21.91 | |||||||||
61
Table of Contents
The weighted average grant-date fair value per share for each option granted was $5.98, $5.31 and $10.22 during 2009, 2008 and 2007, respectively. The Company collected $1.1 million, $0.9 million and $4.2 million from stock option exercises that had a total intrinsic value of $0.4 million, $0.2 million and $0.7 million in 2009, 2008 and 2007, respectively. The aggregate intrinsic value of stock options outstanding was $6.9 million, $3.1 million and $0.1 million at December 31, 2009, 2008 and 2007, respectively. The aggregate intrinsic value of exercisable stock options was $2.0 million, $0.8 million and $0.1 million at December 31, 2009, 2008 and 2007, respectively. These intrinsic values were based on the Company’s closing stock price of $22.72, $19.69 and $14.80 on December 31, 2009, 2008 and 2007, respectively.
In 2009, 2008 and 2007, the Company recorded expense of $1.1 million, $1.3 million and $2.0 million, respectively, related to stock option awards. Unrecognized pre-tax expense of $1.8 million, $0.9 million and $0.6 million related to stock options is expected to be recognized over the weighted average remaining service period of 1.9 years, 1.5 years and 1.6 years for awards outstanding at December 31, 2009, 2008 and 2007, respectively. In 2009, the Company recorded tax expense from stock option exercises of $0.03 million. In 2008 and 2007, the Company recorded a tax expense of $0.02 million and a tax benefit of $0.1 million, respectively, in additional paid-in capital on the consolidated balance sheets and cash flows from financing activities on the consolidated statements of cash flows.
At December 31, 2009, 2,500,000 and 200,000 shares of common stock were reserved for equity-based compensation awards pursuant to the 2009 Employee Equity Incentive Plan and the 2006 Non-Employee Director Equity Incentive Plan, respectively.
8. OTHER INCOME
Other income was comprised of the following for the years ended December 31 (in thousands):
| 2009 | 2008 | 2007 | |||||||||
| Gain (loss) on sale of fixed assets |
$ | (641 | ) | $ | 1,607 | $ | (389 | ) | |||
| Other |
2,064 | 20 | 1,840 | ||||||||
| Total |
$ | 1,423 | $ | 1,627 | $ | 1,451 | |||||
9. TAXES ON INCOME (TAX BENEFITS)
Income (loss) from continuing operations before taxes on income (tax benefits) was as follows for the years ended December 31 (in thousands):
| 2009 | 2008 | 2007 | ||||||||
| Domestic |
$ | 23,569 | $ | 14,369 | $ | (4,424 | ) | |||
| Foreign |
19,195 | 19,503 | 17,495 | |||||||
| Total |
$ | 42,764 | $ | 33,872 | $ | 13,071 | ||||
Provisions (benefits) for taxes on income (tax benefit) from continuing operations consisted of the following components for the years ended December 31 (in thousands):
| 2009 | 2008 | 2007 | ||||||||||
| Current: |
||||||||||||
| Federal |
$ | 2,745 | $ | 141 | $ | (1,348 | ) | |||||
| Foreign |
8,280 | 6,053 | 5,538 | |||||||||
| State |
1,132 | 1,357 | (134 | ) | ||||||||
| Subtotal |
12,157 | 7,551 | 4,056 | |||||||||
| Deferred: |
||||||||||||
| Federal |
1,094 | 2,165 | (2,137 | ) | ||||||||
| Foreign |
(1,416 | ) | (612 | ) | (1,845 | ) | ||||||
| State |
726 | (479 | ) | (223 | ) | |||||||
| Subtotal |
404 | 1,074 | (4,205 | ) | ||||||||
| Total tax provision (benefit) |
$ | 12,561 | $ | 8,625 | $ | (149 | ) | |||||
62
Table of Contents
Income tax (benefit) expense differed from the amounts computed by applying the U.S. federal income tax rate of 35% to income (loss) before income taxes, equity in income (loss) of joint ventures and minority interests as a result of the following (in thousands):
| 2009 | 2008 | 2007 | ||||||||||
| Income taxes at U.S. federal statutory tax rate |
$ | 14,967 | $ | 11,855 | $ | 4,575 | ||||||
| Increase (decrease) in taxes resulting from: |
||||||||||||
| State income taxes, net of federal income tax benefit |
1,208 | 581 | (235 | ) | ||||||||
| Amortization of intangibles |
(4 | ) | 2 | (635 | ) | |||||||
| Fuels tax credit |
(291 | ) | (285 | ) | (314 | ) | ||||||
| Stock options |
25 | 123 | 307 | |||||||||
| Changes in taxes previously accrued |
(621 | ) | (577 | ) | (715 | ) | ||||||
| Foreign tax matters |
(2,453 | ) | (2,524 | ) | (2,113 | ) | ||||||
| Valuation allowance on net operating loss carryforwards (NOL) |
114 | 340 | (1,150 | ) | ||||||||
| Non-deductible meals and entertainment |
365 | 202 | 206 | |||||||||
| Recognition of uncertain tax positions |
(191 | ) | (900 | ) | (18 | ) | ||||||
| Other matters |
(558 | ) | (192 | ) | (57 | ) | ||||||
| Total tax provision |
$ | 12,561 | $ | 8,625 | $ | (149 | ) | |||||
| Effective tax rate |
29.4 | % | 25.5 | % | (1.1 | )% | ||||||
Net deferred taxes consisted of the following at December 31 (in thousands):
| 2009 | 2008 | |||||||
| Deferred income tax assets: |
||||||||
| Foreign tax credit carryforwards |
$ | 2,336 | $ | 784 | ||||
| Net operating loss carryforwards |
13,327 | 6,978 | ||||||
| Accrued expenses |
9,870 | 9,632 | ||||||
| Other |
5,592 | 2,253 | ||||||
| Total gross deferred income tax assets |
31,125 | 19,647 | ||||||
| Less valuation allowance |
(4,857 | ) | (2,993 | ) | ||||
| Net deferred income tax assets |
26,268 | 16,654 | ||||||
| Deferred income tax liabilities: |
||||||||
| Property, plant and equipment |
(10,047 | ) | (4,048 | ) | ||||
| Intangible assets |
(19,419 | ) | (2,195 | ) | ||||
| Undistributed foreign earnings |
(7,051 | ) | – | |||||
| Other |
(5,917 | ) | (6,166 | ) | ||||
| Total deferred income tax liabilities |
(42,434 | ) | (12,409 | ) | ||||
| Net deferred income tax assets (liabilities) |
$ | (16,166 | ) | $ | 4,245 | |||
The Company’s tax assets and liabilities, netted by taxing location, are in the following captions in the balance sheets (in thousands):
| 2009 | 2008 | ||||||
| Current deferred income tax assets, net |
$ | 4,079 | $ | 1,056 | |||
| Noncurrent deferred income tax assets (liabilities), net |
(20,245 | ) | 3,189 | ||||
| Net deferred income tax assets (liabilities) |
$ | (16,166 | ) | $ | 4,245 | ||
The Company’s deferred tax assets at December 31, 2009 included $13.3 million in federal, state and foreign net operating loss (“NOL”) carryforwards. These NOLs include $6.7 million, which if not used will expire between the years 2010 and 2029, and $6.6 million that have no expiration dates. The Company also has foreign tax credit carryforwards of $2.3 million, which will begin to expire in 2015.
For financial reporting purposes, a valuation allowance of $4.9 million has been recognized to reduce the deferred tax assets related to certain federal, state and foreign net operating loss carryforwards, for which it is more likely than not that the related tax benefits will not be realized, due to uncertainties as to the timing and amounts of future taxable income. The valuation allowance at December 31, 2008, was $3.0 million relating to the same items described above.
63
Table of Contents
The Company has recorded income tax expense at U.S. tax rates on all profits, except for undistributed profits of non-U.S. subsidiaries of approximately $133.0 million, which are considered indefinitely reinvested. Determination of the amount of unrecognized deferred tax liability related to the indefinitely reinvested profits is not feasible. A deferred tax asset is recognized only if we have definite plans to generate a U.S. tax benefit by repatriating earnings in the foreseeable future.
FASB ASC 740, Income Taxes (“FASB ASC 740”), prescribes a more-likely-than-not threshold for the financial statement recognition and measurement of a tax position taken or expected to be taken in a tax return. FASC ASC 740 also provides guidance on de-recognition, classification, interest and penalties, accounting in interim periods and disclosure of uncertain tax positions in financial statements.
Upon the adoption of FASB ASC 740, the Company increased its liability for unrecognized tax benefits by $2.8 million of which $0.3 million was recorded as a reduction of the beginning balance of retained earnings. A reconciliation of the beginning and ending balance of unrecognized tax benefits is as follows (in thousands):
| 2009 | 2008 | 2007 | ||||||||||
| Balance at January 1, |
$ | 1,010 | $ | 3,458 | $ | 3,506 | ||||||
| Additions for tax positions of prior years related to acquisitions |
1,904 | — | — | |||||||||
| Additions for tax positions of prior years |
148 | — | 553 | |||||||||
| Reductions for tax positions of prior years |
— | (736 | ) | — | ||||||||
| Lapse in statute of limitations |
(618 | ) | (809 | ) | (729 | ) | ||||||
| Settlements |
— | (650 | ) | — | ||||||||
| Foreign currency translation |
180 | (253 | ) | 128 | ||||||||
| Balance at December 31, total tax provision |
$ | 2,624 | $ | 1,010 | $ | 3,461 | ||||||
The total amount of unrecognized tax benefits, if recognized, that would affect the effective tax rate was $1.3 million at December 31, 2009.
The Company recognizes interest and penalties, if any, accrued related to unrecognized tax benefits in income tax expense. During 2009, approximately $0.2 million was accrued for interest.
The Company believes that it is reasonably possible that the total amount of unrecognized tax benefits will change in 2010. The Company has certain tax return years subject to statutes of limitation that will expire within twelve months. Unless challenged by tax authorities, the expiration of those statutes of limitation is expected to result in the recognition of uncertain tax positions in the amount of approximately $0.7 million.
The Company is subject to taxation in the United States, various states and foreign jurisdictions. The Company’s tax years for 2002 through 2009 are subject to examination by the tax authorities. During the fourth quarter of 2008, the Canada Revenue Agency initiated a review of the Company’s Canadian income tax returns for the calendar years 2002 through 2005 and a limited review for the calendar year 2007. In addition, six state examinations are currently ongoing. With few exceptions, the Company is no longer subject to U.S. federal, state, local or foreign examinations by tax authorities for years before 2005.
64
Table of Contents
10. COMMITMENTS AND CONTINGENCIES
Leases
The Company leases a number of its administrative and operations facilities under non-cancellable operating leases expiring at various dates through 2030. In addition, the Company leases certain construction, automotive and computer equipment on a multi-year, monthly or daily basis. Rental expense in 2009, 2008 and 2007 was $18.9 million, $12.1 million and $16.8 million, respectively.
At December 31, 2009, the future minimum lease payments required under the non-cancellable operating leases were as follows (in thousands):
| Year |
Minimum Lease Payments | ||
| 2010 |
$ | 11,709 | |
| 2011 |
10,519 | ||
| 2012 |
6,908 | ||
| 2013 |
3,813 | ||
| 2014 |
1,994 | ||
| Thereafter |
1,316 | ||
| Total |
$ | 36,259 | |
Litigation
Boston Installation
In August 2003, the Company began a CIPP process installation in Boston. The $1.0 million project required the Company to line 5,400 feet of a 109-year-old, 36- to 41-inch diameter unusually shaped hand-laid rough brick pipe. Many aspects of this project were atypical of the Company’s normal CIPP process installations. Following installation, the owner rejected approximately 4,500 feet of the liner and all proposed repair methods. All rejected liner was removed and re-installed, and the Company recorded a loss of $5.1 million on this project in the year ended December 31, 2003. During the first quarter of 2005, the Company, in accordance with its agreement with the client, inspected the lines. During the course of such inspection, it was determined that the segment of the liner that was not removed and re-installed in early 2004 was in need of replacement in the same fashion as all of the other segments replaced in 2004. The Company completed its assessment of the necessary remediation and related costs and began work with respect to such segment late in the second quarter of 2005. The Company’s remediation work with respect to this segment was completed during the third quarter of 2005. The Company incurred costs of approximately $2.3 million with respect to the 2005 remediation work, which costs were recorded in the second quarter of 2005.
Under the Company’s “Contractor Rework” special endorsement to its primary comprehensive general liability insurance policy, the Company filed a claim with its primary insurance carrier relative to rework of the Boston project. The carrier paid the Company the primary coverage of $1.0 million, less a $250,000 deductible, in satisfaction of its obligations under the policy.
The Company’s excess comprehensive general liability insurance coverage was in an amount far greater than the costs associated with the liner removal and re-installation. The Company believed the “Contractor Rework” special endorsement applied to the excess insurance coverage; it incurred costs in excess of the primary coverage and it notified its excess carrier of the claim in 2003. The excess insurance carrier denied coverage.
In March 2004, the Company filed a lawsuit in United States District Court in Boston, Massachusetts against its excess insurance carrier for such carrier’s failure to acknowledge coverage and to indemnify the Company for the entire loss in excess of the primary coverage. On March 31, 2008, the Court entered a judgment (the “Judgment”) in favor of the Company and against the excess insurance carrier in the amount of $7.7 million ($6.1 million in actual damages and $1.6 million in prejudgment interest). The excess insurance carrier appealed the judgment to the United States Court of Appeals for the First Circuit. On May 22, 2009, the Court of Appeals vacated the Judgment and remanded the case to the District Court for dismissal of the Company’s complaint against the excess insurance carrier, finding that the excess policy did not follow form to the primary policy. On July 17, 2009, the District Court entered its final order in the case, dismissing the Company’s complaint against the excess insurance carrier.
65
Table of Contents
During 2005 and 2006, the Company recorded a $6.1 million insurance claim receivable related to this matter, which was based on actual remediation costs for the Boston project. In addition, in subsequent periods, the Company recorded pre-judgment and post-judgment interest associated with the claim. Based on several factors, including but not limited to favorable court decisions prior to when the Company recorded the claim receivable amount, the Company believed the realizability of this claim amount was probable.
On December 19, 2008, the Company purchased a judgment protection insurance policy (the “Judgment Protection Policy”) to insure the Judgment in the event of reversal by the Court of Appeals. The full amount of the Judgment was insured, subject to a $0.5 million retention.
Based upon the Court of Appeals’ adverse ruling in May 2009, during the second quarter of 2009 the Company reduced the amount of the insurance claim receivable previously recorded to the amount of the proceeds the Company expected to receive pursuant to the Judgment Protection Policy. On September 24, 2009, the Company received $7.2 million under the Judgment Protection Policy.
Environmental Infrastructure Group Litigation Settlement
In December 2003, Environmental Infrastructure Group, L.P. (“EIG”) filed suit in the District Court of Harris County, Texas, against several defendants, including Kinsel Industries, Inc. (“Kinsel”), a wholly-owned subsidiary of the Company, seeking unspecified damages. The suit alleged, among other things, that Kinsel failed to pay EIG monies due under a subcontractor agreement. In February 2004, Kinsel filed a counter-claim against EIG based upon EIG’s failure to perform work required of it under the subcontract. In June 2004, EIG amended its complaint to add the Company as an additional defendant and included a claim for lost opportunity damages. In December 2004, the Company and Kinsel filed third-party petitions against the City of Pasadena, Texas, on the one hand, and Greystar-EIG, LP, Grey General Partner, LLC and Environmental Infrastructure Management, LLC (collectively, the “Greystar Entities”), on the other hand. EIG also amended its petition to add a fraud claim against Kinsel and the Company and also requested exemplary damages. The original petition filed by EIG against Kinsel sought damages for funds that EIG claims should have been paid to EIG on a wastewater treatment plant built for the City of Pasadena. Kinsel’s third-party petition against the City of Pasadena sought approximately $1.6 million in damages. In December 2009, the parties settled their respective claims against each other in this matter. Under the settlement agreement, all parties dismissed their claims and counterclaims against the other parties. In connection with the settlement, the City of Pasadena paid Kinsel $1.2 million and Kinsel paid EIG $0.2 million.
Per Aarsleff Litigation Settlement
On June 3, 2005, the Company filed a lawsuit in the United States District Court in Memphis, Tennessee against Per Aarsleff A/S, a publicly traded Danish company, and certain of its subsidiaries and affiliates. Since approximately 1980, Per Aarsleff and its subsidiaries held licenses for the Insituform® CIPP process in various countries in Northern and Eastern Europe, Taiwan, Russia and South Africa. The Company’s lawsuit sought, among other things, monetary damages in an unspecified amount for the breach by Per Aarsleff of its license and implied license agreements with the Company and for royalties owed by Per Aarsleff under the license and implied license agreements. On October 25, 2006, Per Aarsleff filed a two count counterclaim against the Company seeking to recover royalty payments paid to the Company. On December 29, 2006, the Company and Per Aarsleff’s 50%-owned Taiwanese subsidiary (“PIEC”) settled their respective claims against each other in exchange for PIEC paying the Company $375,000, which amount was paid on December 29, 2006. On November 16, 2008, following the first week of an anticipated two-week trial, the Company and Per Aarsleff settled their respective claims against each other in this matter. Under the settlement agreement, the Company dismissed its claims against Per Aarsleff and its subsidiaries and Per Aarsleff and its subsidiaries dismissed their counterclaims against the Company. In connection with the settlement, Per Aarsleff paid the Company $8.5 million.
Other Litigation
The Company is involved in certain other litigation incidental to the conduct of its business and affairs. Management, after consultation with legal counsel, does not believe that the outcome of any such other litigation will have a material adverse effect on the Company’s consolidated financial condition, results of operations or cash flows.
66
Table of Contents
Guarantees
The Company has entered into several contractual joint ventures in order to develop joint bids on contracts for its installation business. In these cases, the Company could be required to complete the joint venture partner’s portion of the contract if the partner were unable to complete its portion. The Company would be liable for any amounts for which the Company itself could not complete the work and for which a third-party contractor could not be located to complete the work for the amount awarded in the contract. While the Company would be liable for additional costs, these costs would be offset by any related revenues due under that portion of the contract. The Company has not experienced material adverse results from such arrangements. Based on these facts, while there can be no assurances, the Company currently does not anticipate any future material adverse impact on its consolidated financial position, results of operations or cash flows.
The Company also has many contracts that require the Company to indemnify the other party against loss from claims of patent or trademark infringement. The Company also indemnifies its surety against losses from third-party claims of subcontractors. The Company has not experienced material losses under these provisions and, while there can be no assurances, currently does not anticipate any future material adverse impact on its consolidated financial position, results of operations or cash flows.
The Company regularly reviews its exposure under all its engagements, including performance guarantees by contractual joint ventures and indemnification of its surety. As a result of the most recent review, the Company has determined that the risk of material loss is remote under these arrangements and has not recorded a liability for these risks at December 31, 2009 on its consolidated balance sheet.
Retirement Plans
Substantially all of the Company’s U.S. employees are eligible to participate in the Company’s sponsored defined contribution savings plan, which is a qualified plan under the requirements of Section 401(k) of the Internal Revenue Code. Total Company contributions to the domestic plan were $2.5 million, $2.0 million and $1.9 million for the years ended December 31, 2009, 2008 and 2007, respectively.
In addition, certain foreign subsidiaries maintain various other defined contribution retirement plans. Company contributions to such plans for the years ended December 31, 2009, 2008 and 2007 were $1.3 million, $1.4 million and $1.3 million, respectively.
In connection with its acquisition of Corrpro, the Company assumed an obligation associated with a contributory defined benefit pension plan sponsored by a subsidiary of Corrpro located in the United Kingdom. Employees of this Corrpro subsidiary no longer accrue benefits under the plan; however, Corrpro continues to be obligated to fund prior period benefits. Corrpro funds the plan in accordance with recommendations from an independent actuary. Both the pension expense and funding requirements for the year ended December 31, 2009 were immaterial to the Company’s consolidated financial position and results of operations. The benefit obligation and plan assets at December 31, 2009 approximated $7.6 million and $5.9 million, respectively. The Company used a discount rate of 5.7% for the evaluation of the pension. The Company has recorded a liability associated with the unfunded status of this plan of approximately $1.7 million which is included in other long-term liabilities on the consolidated balance sheet. Plan assets consist of investments in equity and debt securities as well as cash, which are primarily Level 3 investments under the fair value hierarchy of U.S. GAAP.
11. DERIVATIVE FINANCIAL INSTRUMENTS
From time to time, the Company may enter into foreign currency forward contracts to fix exchange rates for net investments in foreign operations. At December 31, 2009, the Company did not have any material open foreign currency forward contracts. During the third quarter of 2009, the Company settled its existing outstanding hedges. For foreign currency contracts that settled in 2009, the Company recorded a cumulative gain since inception in other comprehensive income (loss) of $6.8 million related to the settlement of its foreign currency forward contracts.
In May 2009, the Company entered into an interest rate swap agreement, for a notional amount of $25.0 million, which expires in March 2012. The swap notional amount mirrors the amortization of $25.0 million of the Company’s $50.0 million term loan. The swap requires the Company to make a monthly fixed rate payment of 1.63% calculated on the amortizing $25.0 million notional amount, and provides for the Company to receive a payment based upon a variable monthly LIBOR interest rate calculated on the amortizing $25.0 million notional amount. The receipt of the monthly LIBOR-based payment offsets a variable monthly LIBOR-based interest cost on a corresponding $25.0 million portion of the Company’s term loan. This interest rate swap is used to hedge the interest rate risk associated with the volatility of monthly LIBOR rate movement, and is accounted for as a cash flow hedge. At December 31, 2009, a net deferred loss of $0.1 million related to this interest rate swap was recorded in other current liabilities and other comprehensive loss on the consolidated balance sheet. This hedge was effective, and therefore, no gain or loss was recorded in the consolidated statements of operations.
67
Table of Contents
The following table summarizes the Company’s foreign currency forward contracts at December 31, 2008:
| Position | Notional Amount |
Weighted Average Remaining Maturity in Months |
Average Exchange Rate | ||||||
| Canadian Dollar |
Sell | $ | 13,500,000 | 0.4 | 1.012 | ||||
| Canadian Dollar |
Buy | $ | 10,500,000 | 0.2 | 1.294 | ||||
| Euro |
Sell | € | 18,500,000 | 1.8 | 1.472 | ||||
| Pound Sterling |
Buy | £ | 5,000,000 | 0.2 | 1.445 | ||||
| Pound Sterling |
Sell | £ | 10,000,000 | 3.2 | 1.745 | ||||
In accordance with FASB ASC 820, the Company determined that the instruments summarized above are derived from significant unobservable inputs, referred to as Level 3 inputs. The following table presents a reconciliation of the beginning and ending balances of the Company’s assets and liabilities measured at fair value on a recurring basis using Level 3 inputs at December 31, 2009, which consisted only of the items summarized above (in thousands):
| Twelve Months Ended December 31, |
||||||||
| 2009 | 2008 | |||||||
| Beginning balance, January 1 |
$ | 7,161 | $ | (55 | ) | |||
| Expiration of prior foreign currency forward contracts included in other comprehensive income |
(6,818 | ) | — | |||||
| (Loss)/gain included in other comprehensive income |
(440 | ) | 7,216 | |||||
| Ending balance, December 31 |
$ | (97 | ) | $ | 7,161 | |||
The provisions of FASB ASC 820 were adopted for non-financial assets and liabilities on January 1, 2009. See Note 1 to the consolidated financial statements contained in this report for more information about the adoption of this standard as it relates to the Company’s recent acquisitions.
12. DISCONTINUED OPERATIONS
The Company has classified the results of operations of its tunneling business as discontinued operations for all periods presented. Substantially all existing tunneling business activity had been completed in early 2008.
Operating results for discontinued operations are summarized as follows for the years ended December 31 (in thousands):
| 2009 | 2008 | 2007 | ||||||||||
| Revenues |
$ | (4,604 | ) | $ | 6,516 | $ | 62,062 | |||||
| Gross profit (loss) |
(3,798 | ) | (1,614 | ) | 3,386 | |||||||
| Operating expenses |
2,234 | 1,816 | 2,479 | |||||||||
| Closure charges (reversals) of tunneling business |
— | (777 | ) | 17,917 | ||||||||
| Operating loss |
(6,032 | ) | (3,430 | ) | (17,010 | ) | ||||||
| Loss before tax benefits |
(5,813 | ) | (3,895 | ) | (15,298 | ) | ||||||
| Tax benefits |
1,743 | 1,459 | 4,975 | |||||||||
| Net loss |
(4,070 | ) | (2,436 | ) | (10,323 | ) | ||||||
68
Table of Contents
Balance sheet data for discontinued operations was as follows at December 31 (in thousands):
| 2009 | 2008 | |||||
| Receivables, net |
$ | 21 | $ | 2,235 | ||
| Retainage |
647 | 5,917 | ||||
| Costs and estimated earnings in excess of billings |
521 | 5,104 | ||||
| Prepaid expenses and other current assets |
— | 448 | ||||
| Property, plant and equipment, less accumulated depreciation |
1,283 | 3,256 | ||||
| Deferred income tax assets |
3,000 | 2,587 | ||||
| Total assets |
$ | 5,472 | $ | 19,547 | ||
| Accounts payable and accrued expenses and billings in excess of costs and estimated earnings |
$ | 339 | $ | 1,541 | ||
| Deferred income tax liabilities |
979 | 818 | ||||
| Total liabilities |
$ | 1,318 | $ | 2,359 | ||
13. SEGMENT AND GEOGRAPHIC INFORMATION
The Company operates in three distinct markets: sewer rehabilitation, water rehabilitation and energy and mining services. Management organizes the enterprise around differences in products and services, as well as by geographic areas. Within the sewer rehabilitation market, the Company operates in three distinct geographies: North America, Europe and internationally outside of North America and Europe. As such, the Company is organized into five reportable segments: North American Sewer Rehabilitation, European Sewer Rehabilitation, Asia-Pacific Sewer Rehabilitation, Water Rehabilitation and Energy and Mining. Each segment is regularly reviewed and evaluated separately.
The following disaggregated financial results have been prepared using a management approach that is consistent with the basis and manner with which management internally disaggregates financial information for the purpose of making internal operating decisions. The Company evaluates performance based on stand-alone operating income (loss).
Corporate expenses previously allocated to the Company’s discontinued tunneling business have been re-allocated to the remaining five segments, North American Sewer Rehabilitation, European Sewer Rehabilitation, Asia-Pacific Sewer Rehabilitation, Water Rehabilitation and Energy and Mining, for all periods presented. Re-allocated expenses were $3.7 million in 2007. Re-allocated expenses were allocated proportionally based on previously allocated expenses. Since the tunneling business was discontinued prior to 2008, no corporate expenses were allocated to the tunneling business during 2008 or 2009.
There were no customers that accounted for more than 10% of the Company’s revenues during any year in the three-year period ended December 31, 2009.
69
Table of Contents
Financial information by segment was as follows at December 31 (in thousands):
| 2009 | 2008 | 2007 | ||||||||||
| Revenues: |
||||||||||||
| North American Sewer Rehabilitation |
$ | 354,418 | $ | 340,296 | $ | 348,085 | ||||||
| European Sewer Rehabilitation |
85,993 | 112,225 | 100,658 | |||||||||
| Asia-Pacific Sewer Rehabilitation |
33,256 | 10,129 | 973 | |||||||||
| Water Rehabilitation |
11,521 | 13,447 | 4,248 | |||||||||
| Energy and Mining |
241,678 | 60,567 | 41,606 | |||||||||
| Total revenues |
$ | 726,866 | $ | 536,664 | $ | 495,570 | ||||||
| Operating income (loss): |
||||||||||||
| North American Sewer Rehabilitation |
$ | 38,357 | $ | 15,341 | $ | 1,133 | ||||||
| European Sewer Rehabilitation |
(1,005 | ) | 7,664 | 5,368 | ||||||||
| Asia-Pacific Sewer Rehabilitation |
3,419 | 1,639 | (507 | ) | ||||||||
| Water Rehabilitation |
(2,578 | ) | (1,658 | ) | (1,584 | ) | ||||||
| Energy and Mining |
10,924 | 10,896 | 9,120 | |||||||||
| Total operating income |
$ | 49,117 | $ | 33,882 | $ | 13,530 | ||||||
| Total assets: |
||||||||||||
| North American Sewer Rehabilitation |
$ | 296,138 | $ | 311,420 | $ | 330,547 | ||||||
| European Sewer Rehabilitation |
70,136 | 75,702 | 51,925 | |||||||||
| Asia-Pacific Sewer Rehabilitation |
51,287 | 10,849 | 952 | |||||||||
| Water Rehabilitation |
5,628 | 5,882 | 2,386 | |||||||||
| Energy and Mining |
332,361 | 26,653 | 20,027 | |||||||||
| Corporate |
101,756 | 99,253 | 94,643 | |||||||||
| Discontinued operations |
5,473 | 19,547 | 40,660 | |||||||||
| Total assets |
$ | 862,779 | $ | 549,306 | $ | 541,140 | ||||||
| Capital expenditures: |
||||||||||||
| North American Sewer Rehabilitation |
$ | 7,794 | $ | 7,744 | $ | 5,319 | ||||||
| European Sewer Rehabilitation |
1,858 | 1,921 | 3,287 | |||||||||
| Asia-Pacific Sewer Rehabilitation |
5,567 | 451 | 70 | |||||||||
| Water Rehabilitation |
1,194 | 1,012 | 12 | |||||||||
| Energy and Mining |
3,890 | 1,451 | 719 | |||||||||
| Corporate |
1,534 | 2,443 | 5,571 | |||||||||
| Total capital expenditures |
$ | 21,837 | $ | 15,022 | $ | 14,978 | ||||||
| Depreciation and amortization: |
||||||||||||
| North American Sewer Rehabilitation |
$ | 9,761 | $ | 11,695 | $ | 11,408 | ||||||
| European Sewer Rehabilitation |
2,347 | 2,350 | 1,899 | |||||||||
| Asia-Pacific Sewer Rehabilitation |
1,313 | – | – | |||||||||
| Water Rehabilitation |
345 | 21 | 1 | |||||||||
| Energy and Mining |
12,129 | 735 | 720 | |||||||||
| Corporate |
2,545 | 2,506 | 2,224 | |||||||||
| Total depreciation and amortization |
$ | 28,440 | $ | 17,307 | $ | 16,252 | ||||||
70
Table of Contents
Financial information by geographic area was as follows at December 31 (in thousands):
| 2009 | 2008 | 2007 | |||||||||
| Revenues: |
|||||||||||
| United States |
$ | 480,684 | $ | 326,381 | $ | 329,136 | |||||
| Europe |
95,910 | 127,192 | 106,881 | ||||||||
| Canada |
95,761 | 49,769 | 46,307 | ||||||||
| Other foreign |
54,511 | 33,322 | 13,246 | ||||||||
| Total revenues |
$ | 726,866 | $ | 536,664 | $ | 495,570 | |||||
| Operating income (loss): |
|||||||||||
| United States |
$ | 25,004 | $ | 263 | $ | (4,443 | ) | ||||
| Europe |
(11 | ) | 18,674 | 7,614 | |||||||
| Canada |
17,790 | 10,030 | 8,428 | ||||||||
| Other foreign |
6,334 | 4,915 | 1,931 | ||||||||
| Total operating income |
$ | 49,117 | $ | 33,882 | $ | 13,530 | |||||
| Long-lived assets: (1) |
|||||||||||
| United States |
$ | 131,447 | $ | 60,881 | $ | 67,196 | |||||
| Europe |
20,297 | 19,394 | 18,575 | ||||||||
| Canada |
24,934 | 1,379 | 1,977 | ||||||||
| Other foreign |
8,165 | 1,452 | 1,031 | ||||||||
| Total long-lived assets |
$ | 184,843 | $ | 83,106 | $ | 88,779 | |||||
| (1) | Long lived assets as of December 31, 2009, 2008 and 2007 do not include intangible assets or deferred tax assets. |
71
Table of Contents
14. SELECTED QUARTERLY FINANCIAL DATA (UNAUDITED)
Unaudited quarterly financial data was as follows for the years ended December 31, 2009 and 2008 (in thousands, except per share data):
| First Quarter |
Second Quarter |
Third Quarter |
Fourth Quarter |
|||||||||||||
| Year ended December 31, 2009: |
||||||||||||||||
| Revenues |
$ | 128,012 | $ | 183,196 | $ | 201,852 | $ | 213,806 | ||||||||
| Gross profit |
30,673 | 47,916 | 53,122 | 58,880 | ||||||||||||
| Operating income |
79 | 13,470 | 17,704 | 17,864 | ||||||||||||
| Income (loss) from continuing operations |
(1,107 | ) | 7,738 | 11,793 | 11,817 | |||||||||||
| Loss from discontinued operations |
(98 | ) | (1,192 | ) | (2,646 | ) | (134 | ) | ||||||||
| Net income (loss) |
(1,205 | ) | 6,546 | 9,147 | 11,683 | |||||||||||
| Basic earnings (loss) per share: |
||||||||||||||||
| Income (loss) from continuing operations |
$ | (0.04 | ) | $ | 0.20 | $ | 0.31 | $ | 0.31 | |||||||
| Loss from discontinued operations |
(0.00 | ) | (0.03 | ) | (0.07 | ) | (0.01 | ) | ||||||||
| Net income (loss) |
$ | (0.04 | ) | $ | 0.17 | $ | 0.24 | $ | 0.30 | |||||||
| Diluted earnings (loss) per share |
||||||||||||||||
| Income (loss) from continuing operations |
$ | (0.04 | ) | $ | 0.20 | $ | 0.30 | $ | 0.31 | |||||||
| Loss from discontinued operations |
(0.00 | ) | (0.03 | ) | (0.07 | ) | (0.01 | ) | ||||||||
| Net income (loss) |
$ | (0.04 | ) | $ | 0.17 | $ | 0.23 | $ | 0.30 | |||||||
| Year ended December 31, 2008: |
||||||||||||||||
| Revenues |
$ | 125,927 | $ | 135,585 | $ | 137,878 | $ | 137,274 | ||||||||
| Gross profit |
26,886 | 31,130 | 32,222 | 39,359 | ||||||||||||
| Operating income (loss) |
3,255 | 6,216 | 10,274 | 14,138 | ||||||||||||
| Income from continuing operations |
2,030 | 3,914 | 7,790 | 10,342 | ||||||||||||
| Loss from discontinued operations |
(87 | ) | (516 | ) | (1,141 | ) | (692 | ) | ||||||||
| Net income |
1,943 | 3,398 | 6,649 | 9,650 | ||||||||||||
| Basic earnings (loss) per share: |
||||||||||||||||
| Income from continuing operations |
$ | 0.07 | $ | 0.14 | $ | 0.29 | $ | 0.37 | ||||||||
| Income (loss) from discontinued operations |
0.00 | (0.02 | ) | (0.04 | ) | (0.03 | ) | |||||||||
| Net income |
$ | 0.07 | $ | 0.12 | $ | 0.25 | $ | 0.34 | ||||||||
| Diluted earnings (loss) per share |
||||||||||||||||
| Income from continuing operations |
$ | 0.07 | $ | 0.14 | $ | 0.28 | $ | 0.37 | ||||||||
| Income (loss) from discontinued operations |
0.00 | (0.02 | ) | (0.04 | ) | (0.03 | ) | |||||||||
| Net income |
$ | 0.07 | $ | 0.12 | $ | 0.24 | $ | 0.34 | ||||||||
72
Table of Contents
| Item 9. | Changes in and Disagreements with Accountants on Accounting and Financial Disclosure. |
Not applicable.
| Item 9A. | Controls and Procedures. |
Our management, under the supervision and with the participation of our Chief Executive Officer (our principal executive officer) and Chief Financial Officer (our principal financial officer), has conducted an evaluation of the effectiveness of the design and operation of our disclosure controls and procedures (as defined in Rules 13a-15(e) and 15d-15(e) of the Securities Exchange Act of 1934, as amended (the “Exchange Act”), as of December 31, 2009. Based upon and as of the date of this evaluation, our Chief Executive Officer and Chief Financial Officer have concluded that our disclosure controls were effective to ensure that the information required to be disclosed by us in the reports that we file or submit under the Exchange Act (a) is recorded, processed, summarized and reported within the time period specified in the Securities and Exchange Commission’s rules and forms and (b) is accumulated and communicated to our management, including our principal executive and principal financial officers, as appropriate to allow timely decisions regarding required disclosure.
Pursuant to Section 404 of the Sarbanes-Oxley Act, we have included a report that provides management’s assessment of our internal control over financial reporting as part of this Annual Report on Form 10-K for the year ended December 31, 2009. Management’s report is included in Item 8 of this report under the caption entitled “Management’s Report on Internal Control Over Financial Reporting,” and is incorporated herein by reference. Our independent registered public accounting firm has issued an attestation report on the effectiveness of our internal control over financial reporting. This attestation report is included in Item 8 of this report under the caption entitled “Report of Independent Registered Public Accounting Firm” and is incorporated herein by reference.
The scope of management’s evaluation did not include our recent acquisitions of the selected assets and liabilities of The Bayou Companies, L.L.C and its related entities (“Bayou”) on February 20, 2009 or of Corrpro Companies, Inc. (“Corrpro”) on March 31, 2009. Bayou and Corrpro are significant subsidiaries of our Company.
There were no changes in our internal control over financial reporting that occurred during the quarter ended December 31, 2009 that materially affected, or are reasonably likely to materially affect, our internal control over financial reporting.
| Item 9B. | Other Information. |
Not applicable.
73
Table of Contents
PART III
| Item 10. | Directors, Executive Officers and Corporate Governance. |
Information concerning this item is included in “Item 4A. Executive Officers of the Registrant” of this report and under the captions “Certain Information Concerning Director Nominees,” “Section 16(a) Beneficial Ownership Reporting Compliance,” “Corporate Governance—Corporate Governance Documents,” “Corporate Governance—Board Meetings and Committees—Audit Committee” and “Corporate Governance—Board Meetings and Committees—Audit Committee Financial Expert” in our Proxy Statement for our 2010 Annual Meeting of Shareholders (“2010 Proxy Statement”) and is incorporated herein by reference.
| Item 11. | Executive Compensation. |
Information concerning this item is included under the captions “Executive Compensation,” “Compensation in Last Fiscal Year,” “Director Compensation,” “Corporate Governance—Board Meetings and Committees—Compensation Committee Interlocks and Insider Participation” and “Compensation Committee Report” in the 2010 Proxy Statement and is incorporated herein by reference.
| Item 12. | Security Ownership of Certain Beneficial Owners and Management and Related Stockholder Matters. |
Information concerning this item is included in Item 5 of this report under the caption “Equity Compensation Plan Information” and under the caption “Information Concerning Certain Stockholders” in the 2010 Proxy Statement and is incorporated herein by reference.
| Item 13. | Certain Relationships and Related Transactions, and Director Independence. |
Information concerning this item is included under the caption “Corporate Governance—Independent Directors” in the 2010 Proxy Statement and is incorporated herein by reference.
| Item 14. | Principal Accountant Fees and Services. |
Information concerning this item is included under the caption “Independent Auditors’ Fees” in the 2010 Proxy Statement and is incorporated herein by reference.
74
Table of Contents
PART IV
| Item 15. | Exhibits and Financial Statement Schedules. |
1. Financial Statements:
The consolidated financial statements filed in this Annual Report on Form 10-K are listed in the Index to Consolidated Financial Statements included in “Item 8. Financial Statements and Supplementary Data,” which information is incorporated herein by reference.
2. Financial Statement Schedules:
No financial statement schedules are included herein because of the absence of conditions under which they are required or because the required information is contained in the consolidated financial statements or notes thereto contained in this report.
3. Exhibits:
The exhibits required to be filed as part of this Annual Report on Form 10-K are listed in the Index to Exhibits attached hereto.
75
Table of Contents
Pursuant to the requirements of Section 13 or 15(d) of the Securities Exchange Act of 1934, the registrant has duly caused this report to be signed on its behalf by the undersigned, thereunto duly authorized.
| Dated: March 1, 2010 | INSITUFORM TECHNOLOGIES, INC. | |||||
| By: | /s/ J. Joseph Burgess | |||||
| J. Joseph Burgess | ||||||
| President and Chief Executive Officer | ||||||
POWER OF ATTORNEY
The registrant and each person whose signature appears below hereby appoint J. Joseph Burgess and David F. Morris as attorneys-in-fact with full power of substitution, severally, to execute in the name and on behalf of the registrant and each such person, individually and in each capacity stated below, one or more amendments to the annual report which amendments may make such changes in the report as the attorney-in-fact acting deems appropriate and to file any such amendment to the report with the Securities and Exchange Commission.
Pursuant to the requirements of the Securities Exchange Act of 1934, this report has been signed below by the following persons on behalf of the registrant and in the capacities and on the dates indicated.
| Signature |
Title |
Date | ||
| /s/ J. Joseph Burgess |
Principal Executive Officer and Director |
March 1, 2010 | ||
| J. Joseph Burgess | ||||
| /s/ David A. Martin |
Principal Financial Officer and Principal Accounting Officer |
March 1, 2010 | ||
| David A. Martin | ||||
| /s/ Stephen P. Cortinovis |
Director |
March 1, 2010 | ||
| Stephen P. Cortinovis | ||||
| /s/ Stephanie A. Cuskley |
Director |
March 1, 2010 | ||
| Stephanie A. Cuskley | ||||
| /s/ John P. Dubinsky |
Director |
March 1, 2010 | ||
| John P. Dubinksy | ||||
| /s/ Charles R. Gordon |
Director |
March 1, 2010 | ||
| Charles R. Gordon | ||||
| /s/ Juanita H. Hinshaw |
Director |
March 1, 2010 | ||
| Juanita H. Hinshaw | ||||
| /s/ M. Richard Smith |
Director |
March 1, 2010 | ||
| M. Richard Smith | ||||
| /s/ Alfred L. Woods |
Director |
March 1, 2010 | ||
| Alfred L. Woods | ||||
76
Table of Contents
Index to Exhibits (1)
| 3.1 | Restated Certificate of Incorporation of the Company, as amended through April 27, 2005 (incorporated by reference to Exhibit 3.1 to the quarterly report on Form 10-Q for the quarter ended March 31, 2007), and Certificate of Designation, Preferences and Rights of Series A Junior Participating Preferred Stock (incorporated by reference to Exhibit 3.1 to the annual report on Form 10-K for the year ended December 31, 2001). | |
| 3.2 | Amended and Restated By-Laws of the Company, as amended through January 31, 2009 (incorporated by reference to Exhibit 3.1 to the current report on Form 8-K filed February 2, 2009). | |
| 4 | Rights Agreement dated as of February 26, 2002 between Insituform Technologies, Inc. and American Stock Transfer & Trust Company (incorporated by reference to Exhibit 1 to the Registration Statement on Form 8-A filed March 8, 2002). | |
| 10.1 | Note Purchase Agreement dated as of April 24, 2003 among the Company and each of the lenders listed therein (incorporated by reference to Exhibit 10.1 to the quarterly report on Form 10-Q for the quarter ended March 31, 2003), as further amended by First Amendment dated as of March 12, 2004 (incorporated by reference to Exhibit 10.3 to the annual report on Form 10-K for the year ended December 31, 2003), as further amended by Second Amendment and Waiver dated as of March 16, 2005 (incorporated by reference to Exhibit 10.3 to the annual report on Form 10-K for the year ended December 31, 2004), as further amended by Third Amendment dated as of March 28, 2007 (incorporated by reference to Exhibit 10.1 to the current report on Form 8-K filed April 3, 2007). | |
| 10.2 | 1992 Employee Stock Option Plan of the Company, as amended February 17, 2000 (incorporated by reference to Exhibit 10.11 to the annual report on Form 10-K for the year ended December 31, 1999). (2) | |
| 10.3 | 1992 Director Stock Option Plan of the Company, as amended February 17, 2000 (incorporated by reference to Exhibit 10.12 to the annual report on Form 10-K for the year ended December 31, 1999). (2) | |
| 10.4 | Amended and Restated 2001 Employee Equity Incentive Plan of the Company (incorporated by reference to Appendix C to the definitive proxy statement on Schedule 14A filed on April 16, 2003 in connection with the 2003 annual meeting of stockholders). (2) | |
| 10.5 | Amended and Restated 2001 Non-Employee Director Equity Incentive Plan of the Company (incorporated by reference to Appendix B to the definitive proxy statement on Schedule 14A filed on April 16, 2003 in connection with the 2003 annual meeting of stockholders). (2) | |
| 10.6 | 2006 Employee Equity Incentive Plan of the Company (incorporated by reference to Appendix C to the definitive proxy statement on Schedule 14A filed on March 10, 2006 in connection with the 2006 annual meeting of stockholders), as amended on April 14, 2006 (incorporated by reference to Exhibit 10.1 to the Current Report on Form 8-K, filed on April 14, 2006). (2) | |
| 10.7 | 2009 Employee Equity Incentive Plan of the Company (incorporated by reference to Appendix A to the definitive proxy statement on Schedule 14A filed on March 25, 2009, as revised on April 7, 2009, in connection with the 2009 annual meeting of stockholders) (2) | |
| 10.8 | 2006 Non-Employee Director Equity Incentive Plan of the Company (incorporated by reference to Appendix B to the definitive proxy statement on Schedule 14A filed on March 10, 2006 in connection with the 2006 annual meeting of stockholders). (2) | |
| 10.9 | 2006 Executive Performance Plan of the Company (incorporated by reference to Appendix D to the definitive proxy statement on Schedule 14A filed on March 10, 2006 in connection with the 2006 annual meeting of stockholders). (2) | |
| 10.10 | Employee Stock Purchase Plan of the Company (incorporated by reference to Appendix A to the definitive proxy statement on Schedule 14A filed on March 15, 2007 in connection with the 2007 annual meeting of stockholders). (2) | |
| 10.11 | Senior Management Voluntary Deferred Compensation Plan of the Company (incorporated by reference to Exhibit 10.13 to the annual report on Form 10-K for the year ended December 31, 2008). (2) | |
| 10.12 | Form of Directors’ Indemnification Agreement (incorporated by reference to Exhibit 10.3 to the quarterly report on Form 10-Q for the quarter ended June 30, 2002). (2) | |
| 10.13 | Management Annual Incentive Plan effective January 1, 2010, filed herewith. (2) | |
| 10.14 | Employment Letter between the Company and J. Joseph Burgess dated April 14, 2008 (incorporated by reference to Exhibit 10.2 to the current report on Form 8-K filed on April 10, 2008). (2) | |
| 10.15 | Executive Separation Agreement and Release between the Company and Thomas E. Vossman dated September 5, 2008 (incorporated by reference to Exhibit 10.1 to the current report on Form 8-K filed September 8, 2008). (2) | |
77
Table of Contents
| 10.16 | Independent Consulting Agreement between the Company and Thomas E. Vossman dated September 5, 2008 (incorporated by reference to Exhibit 10.2 to the current report on Form 8-K filed September 8, 2008). (2) | |
| 10.17 | Asset Purchase Agreement by and between the Company, TBC Acquisition Corp. and The Bayou Companies L.L.C. dated January 31, 2009 (incorporated by reference to Exhibit 10.1 to the current report on Form 8-K filed February 2, 2009). | |
| 10.18 | Agreement and Plan of Merger by and among the Company, First Down Acquisition Corp. and Corrpro Companies, Inc. dated February 1, 2009 (incorporated by reference to Exhibit 10.2 to the current report on Form 8-K filed February 2, 2009). | |
| 10.19 | Credit Agreement among the Company and certain of its domestic subsidiaries and Bank of America, N.A. and certain other lenders party thereto dated March 31, 2009 (incorporated by reference to Exhibit 10.2 to the current report on Form 8-K filed April 3, 2009). | |
| 10.20 | First Amendment to Credit Agreement among the Company and certain of its domestic subsidiaries and Bank of America, N.A. and certain other lenders party thereto dated October 15, 2009 (incorporated by reference to Exhibit 10.1 to the quarterly report on Form 10-Q for the quarter ended September 30, 2009). | |
| 21 | Subsidiaries of the Company, filed herewith. | |
| 23 | Consent of PricewaterhouseCoopers LLP, filed herewith. | |
| 24 | Power of Attorney (set forth on signature page). | |
| 31.1 | Certification of J. Joseph Burgess pursuant to Section 302 of the Sarbanes-Oxley Act of 2002, filed herewith. | |
| 31.2 | Certification of David A. Martin pursuant to Section 302 of the Sarbanes-Oxley Act of 2002, filed herewith. | |
| 32.1 | Certification of J. Joseph Burgess pursuant to 18 U.S.C. Section 1350, as adopted pursuant to Section 906 of the Sarbanes-Oxley Act of 2002, filed herewith. | |
| 32.2 | Certification of David A. Martin pursuant to 18 U.S.C. Section 1350, as adopted pursuant to Section 906 of the Sarbanes-Oxley Act of 2002, filed herewith. | |
| (1) | The Company’s current, quarterly and annual reports are filed with the Securities and Exchange Commission under file no. 0-10786. |
| (2) | Management contract or compensatory plan or arrangement. |
* * *
Documents listed in this Index to Exhibits will be made available upon written request.
78