Attached files
| file | filename |
|---|---|
| 8-K - FORM 8-K - SOUTHWEST BANCORP INC | y92308e8vk.htm |
Exhibit 99.1

| Investor Presentation August 2011 (NASDAQ-OKSB) |
| Forward Looking Statements 1 Forward Looking Statements This presentation includes forward-looking statements such as: statements of Southwest's goals, intentions, and expectations; estimates of risks and of future costs and benefits; expectations regarding future financial performance of Southwest and its operating segments; assessments of loan quality, probable loan losses, collateral values and the amount and timing of loan payoffs; liquidity, contractual obligations, off-balance sheet risk, and market or interest rate risk; estimates of value of acquired assets, deposits, and other liabilities; and statements of Southwest's ability to achieve financial and other goals. We intend that these statements be covered by the safe harbor provision for forward looking statements contained in the Private Securities Litigation Reform Act of 1995. These forward-looking statements are subject to significant uncertainties because they are based upon: the amount and timing of future changes in interest rates, market behavior, and other economic conditions; future laws, regulations, and accounting principles; and a variety of other matters. Because of these uncertainties, the actual future results may be materially different from the results indicated by these forward-looking statements. In addition, Southwest's past growth and performance do not necessarily indicate its future results. For other factors, risks, and uncertainties that could cause actual results to differ materiality from estimates and projections contained in forward-looking statements, please read the "Risk Factors" contained in Southwest's reports to the Securities and Exchange Commission. |

| Corporate Profile 2 A regional community banking company with $2.7 billion in assets, $2.2 billion in total loans, $2.1 billion in deposits, and $309 million in common equity at June 30, 2011 Bank holding company for Stillwater National Bank and Trust Company and Bank of Kansas Established in 1894 IPO in 1993 Healthcare and commercial lending niche provider with proven business models Banking offices: Oklahoma, 11 $834 million in loans $1,474 million in deposits Texas, 6 $911 million in loans $168 million in deposits Kansas, 8 $214 million in loans $273 million in deposits Excludes covered loans |

| 3 Second Quarter 2011 Highlights Dollars in Thousands * Excludes covered loans ** Intangible assets defined as goodwill for purposes of this calculation |

| Commitment to Improve... Capital - We have built and maintained capital. Earnings Base - Our recent loss follows a long record of earnings. Our interest margins and net interest income are solid. We remain one of the most efficient banking organizations in the country. Credit - This year we are intensifying our continuing efforts to improve credit quality: reorganized lending and credit functions to increase their independence and improve oversight new Chief Credit Officer reporting directly to the CEO with authority over the entire credit and work-out functions further staffed up credit and work-out areas with experienced bankers increased emphasis on timely and accurate loan grading and consistency among our third party loan review firm, our internal credit function, and federal regulators' grading guidelines; and special review of larger problem credits - so far 75% of our portfolio reviewed, beginning with larger credits and working down to $3 million in exposure. Excludes covered loans 4 |

| Southwest's Regulatory Capital Total Year-End Risk-Based Capital 5 $266 $285 $405 $413 $478 Dollars in Millions "Well-capitalized" minimum is 10% for all years. $474 Our capital ratios are well above regulatory standards. |

| Stillwater National's Regulatory Capital Total Year-End Risk-Based Capital 6 $257 $352 $393 $232 $357 *The years 2009, 2010, & 2011 reflect a 12.5% agreed upon minimum. All other years reflect 10% general minimum. Dollars in Millions $394 SNB ratios are well above minimums. |

| Pre-Provision/Pre-Tax Income Dollars in Millions 7 We continue to produce solid pre-provision income. |

| Provision for Loan Losses & Net Charge-offs Dollars in Millions Excludes covered loans 8 YTD |

| Net Charge-Offs by Type Dollars in Millions 9 Excludes covered loans |

| Net Charge-Offs by Location Dollars in Millions 10 Excludes covered loans |

| Other State Loans 11 Dollars in Millions Other State loans comprise less than 10% of total loans. State # of Loans Net Balance Nonperforming Loans Potential Problem Loans 6/30/2011 YTD Charge-offs Aggregate Charge-offs Arizona 29 $ 50.0 $ 16.7 $ 14.9 $ 7.2 $ 11.5 Iowa 8 26.7 - - - - Colorado 25 24.2 4.9 13.5 4.0 4.0 New Mexico 12 21.1 5.1 11.6 6.7 6.7 Florida 9 10.6 1.5 - - 0.9 California 9 9.8 - 9.4 - - Ohio 5 9.6 - - - - North Carolina 6 6.9 - - - - Tennessee 3 6.5 - - - - New Jersey 6 6.4 - - - - Other (24 states) 112 24.7 2.9 4.4 0.8 3.4 Totals 224 $ 196.5 $ 31.1 $ 53.8 $ 18.7 $ 26.5 |
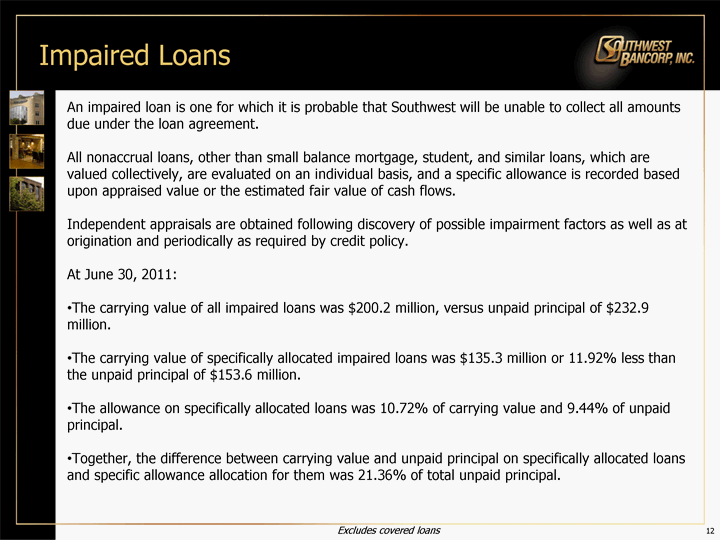
| Impaired Loans 12 An impaired loan is one for which it is probable that Southwest will be unable to collect all amounts due under the loan agreement. All nonaccrual loans, other than small balance mortgage, student, and similar loans, which are valued collectively, are evaluated on an individual basis, and a specific allowance is recorded based upon appraised value or the estimated fair value of cash flows. Independent appraisals are obtained following discovery of possible impairment factors as well as at origination and periodically as required by credit policy. At June 30, 2011: The carrying value of all impaired loans was $200.2 million, versus unpaid principal of $232.9 million. The carrying value of specifically allocated impaired loans was $135.3 million or 11.92% less than the unpaid principal of $153.6 million. The allowance on specifically allocated loans was 10.72% of carrying value and 9.44% of unpaid principal. Together, the difference between carrying value and unpaid principal on specifically allocated loans and specific allowance allocation for them was 21.36% of total unpaid principal. Excludes covered loans |
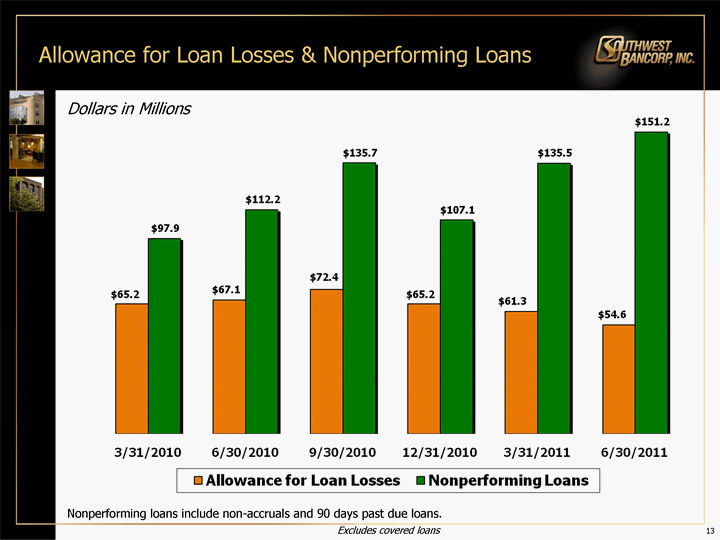
| Allowance for Loan Losses & Nonperforming Loans Dollars in Millions Excludes covered loans Nonperforming loans include non-accruals and 90 days past due loans. 13 |

| Nonperforming Assets and Potential Problem Loans Dollars in Millions Excludes covered loans and properties Nonperforming loans include non-accruals and 90 days past due loans. 14 |
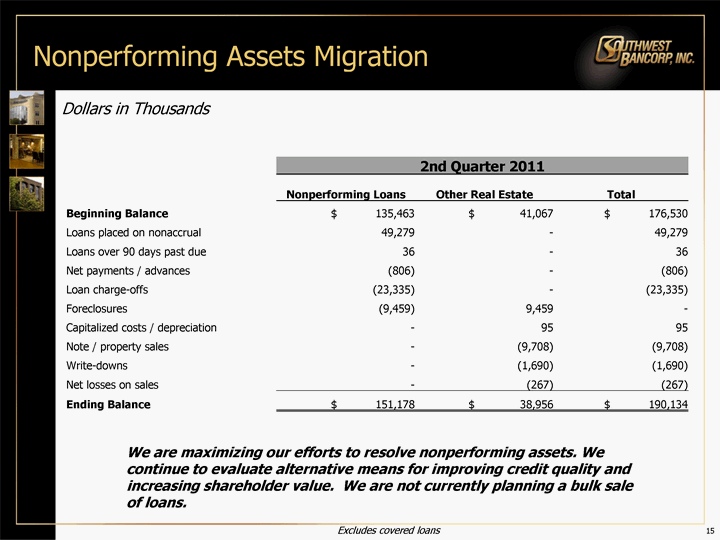
| 15 Nonperforming Assets Migration Dollars in Thousands Excludes covered loans 2nd Quarter 2011 2nd Quarter 2011 2nd Quarter 2011 Nonperforming Loans Other Real Estate Total Beginning Balance $ 135,463 $ 41,067 $ 176,530 Loans placed on nonaccrual 49,279 - 49,279 Loans over 90 days past due 36 - 36 Net payments / advances (806) - (806) Loan charge-offs (23,335) - (23,335) Foreclosures (9,459) 9,459 - Capitalized costs / depreciation - 95 95 Note / property sales - (9,708) (9,708) Write-downs - (1,690) (1,690) Net losses on sales - (267) (267) Ending Balance $ 151,178 $ 38,956 $ 190,134 We are maximizing our efforts to resolve nonperforming assets. We continue to evaluate alternative means for improving credit quality and increasing shareholder value. We are not currently planning a bulk sale of loans. |

| 16 Nonperforming Assets Migration Dollars in Thousands Excludes covered loans 1st Quarter 2011 1st Quarter 2011 1st Quarter 2011 Nonperforming Loans Other Real Estate Total Beginning Balance $ 107,083 $ 37,722 $ 144,805 Loans placed on nonaccrual 55,579 - 55,579 Loans over 90 days past due 12 - 12 Net payments / advances (2,269) - (2,269) Back to accrual / resolutions (8,843) - (8,843) Loan charge-offs (12,182) - (12,182) Foreclosures / repossessed (3,917) 3,867 (50) Capitalized costs / depreciation - 21 21 Note / property sales - (486) (486) Write-downs - (5) (5) Net losses on sales - (52) (52) Ending Balance $ 135,463 $ 41,067 $ 176,530 |

| Total Nonperforming Assets Dollars in Millions Total nonperforming assets include non-accruals, 90 days past due loans, and other real estate. Excludes covered loans and properties 17 |

| Nonperforming Loans NPL by Type NPL by Location $151.2 Million Total Nonperforming Loans (6/30/2011) Dollars in Millions 18 Nonperforming loans include non-accruals and 90 days past due loans. Excludes covered loans |

| Nonperforming Loans by Type Dollars in Millions 19 Nonperforming loans include non-accruals and 90 days past due loans. Excludes covered loans |

| Nonperforming Loans by Location Dollars in Millions 20 Nonperforming loans include non-accruals and 90 days past due loans. Excludes covered loans |

| Other State Loans 21 Dollars in Millions Other State loans comprise less than 10% of total loans. State # of Loans Net Balance Nonperforming Loans Potential Problem Loans 6/30/2011 YTD Charge-offs Aggregate Charge-offs Arizona 29 $ 50.0 $ 16.7 $ 14.9 $ 7.2 $ 11.5 Iowa 8 26.7 - - - - Colorado 25 24.2 4.9 13.5 4.0 4.0 New Mexico 12 21.1 5.1 11.6 6.7 6.7 Florida 9 10.6 1.5 - - 0.9 California 9 9.8 - 9.4 - - Ohio 5 9.6 - - - - North Carolina 6 6.9 - - - - Tennessee 3 6.5 - - - - New Jersey 6 6.4 - - - - Other (24 states) 112 24.7 2.9 4.4 0.8 3.4 Totals 224 $ 196.5 $ 31.1 $ 53.8 $ 18.7 $ 26.5 |

| Other Real Estate ORE by Type ORE by Location $39.0 Million Total Other Real Estate (6/30/2011) Dollars in Millions 22 Excludes covered properties |

| Other Real Estate by Type Dollars in Millions 23 Excludes covered properties $18.8 $27.6 $35.7 $37.7 $41.0 $39.0 |

| Other Real Estate by Location Dollars in Millions 24 Excludes covered properties $18.8 $27.6 $35.7 $37.7 $41.0 $39.0 |
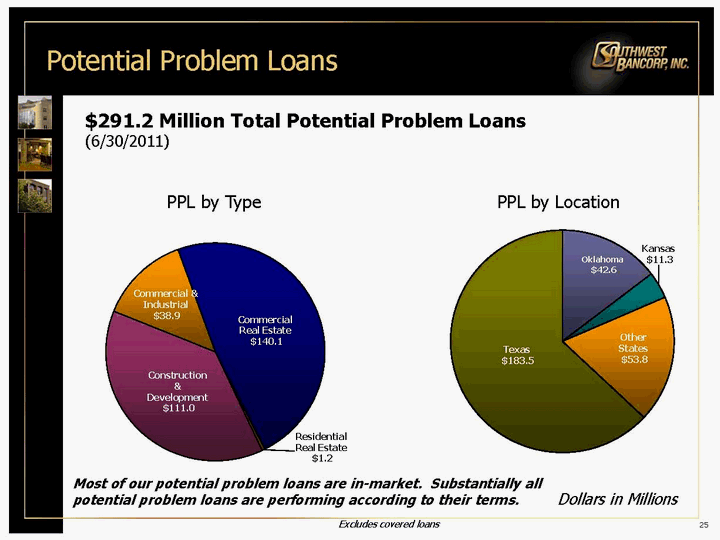
| 25 Potential Problem Loans $291.2 Million Total Potential Problem Loans (6/30/2011) PPL by Type PPL by Location Dollars in Millions Excludes covered loans Most of our potential problem loans are in-market. Substantially all potential problem loans are performing according to their terms. |

| 26 Potential Problem Loans by Type Dollars in Millions Excludes covered loans |

| 27 Potential Problem Loans by Location Dollars in Millions Excludes covered loans |
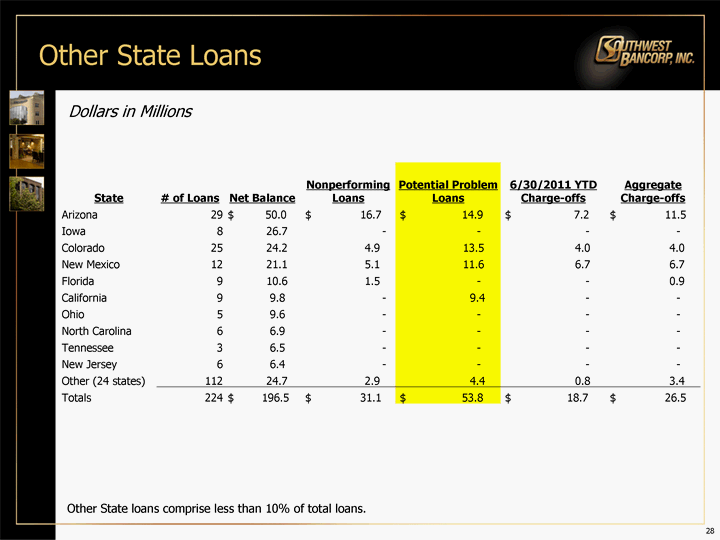
| Other State Loans 28 Dollars in Millions Other State loans comprise less than 10% of total loans. State # of Loans Net Balance Nonperforming Loans Potential Problem Loans 6/30/2011 YTD Charge-offs Aggregate Charge-offs Arizona 29 $ 50.0 $ 16.7 $ 14.9 $ 7.2 $ 11.5 Iowa 8 26.7 - - - - Colorado 25 24.2 4.9 13.5 4.0 4.0 New Mexico 12 21.1 5.1 11.6 6.7 6.7 Florida 9 10.6 1.5 - - 0.9 California 9 9.8 - 9.4 - - Ohio 5 9.6 - - - - North Carolina 6 6.9 - - - - Tennessee 3 6.5 - - - - New Jersey 6 6.4 - - - - Other (24 states) 112 24.7 2.9 4.4 0.8 3.4 Totals 224 $ 196.5 $ 31.1 $ 53.8 $ 18.7 $ 26.5 |

| 29 Total Loans Dollars in Billions Non-scheduled payments began slowing in the first quarter of 2008. The volume of new originations was reduced. Loans originated prior to 2008 continued to advance. Excludes loss share receivable 2nd Qtr. We expect that outstanding loans will continue to decrease during 2011. Our loan growth expectations for future periods depend upon the health of the economy in our markets and nationally among other factors. |
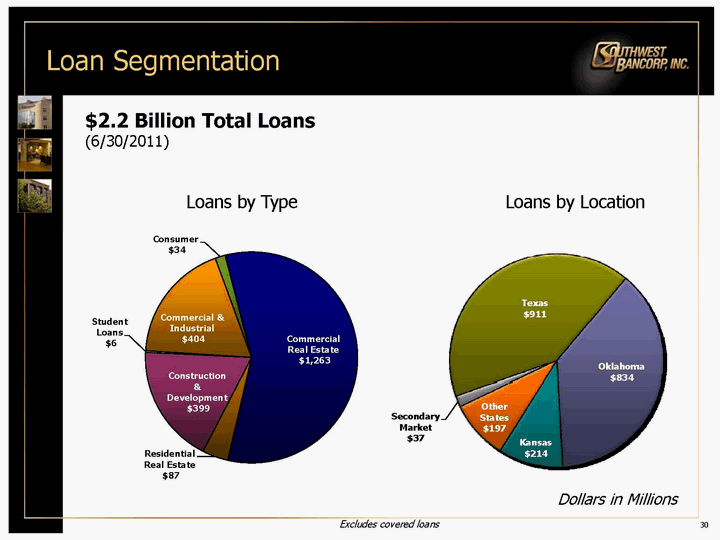
| 30 Loan Segmentation $2.2 Billion Total Loans (6/30/2011) Loans by Type Loans by Location Dollars in Millions Excludes covered loans |

| 31 Commercial Real Estate Loans $1.263 Billion Total Commercial Real Estate Loans (6/30/2011) CRE Loans by Type CRE Loans by Location Dollars in Millions Excludes covered loans |

| 32 Construction Loans $399 Million Total Construction Loans (6/30/2011) Construction Loans by Type Construction Loans by Location Dollars in Millions Excludes covered loans |

| 33 Commercial Loans $404 Million Total Commercial Loans (6/30/2011) Commercial Loans by Type Commercial Loans by Location Dollars in Millions Excludes covered loans |

| 34 Residential Real Estate Loans $87 Million Total Residential Real Estate Loans (6/30/2011) Residential RE Loans by Location Dollars in Millions Residential RE Loans by Type Excludes covered loans |

| 35 Other Loans $40 Million Total Other Loans (6/30/2011) Other Loans by Location Dollars in Millions Other Loans by Type Excludes covered loans |

| Other State Loans 36 Dollars in Millions Other State loans comprise less than 10% of total loans. State Commercial & Industrial Commercial Real Estate Construction & Development Consumer Residential Real Estate Total Arizona $ 4.4 $ 13.6 $ 31.9 $ 0.1 $ - $ 50.0 Iowa - 26.6 0.1 - - 26.7 Colorado 0.5 18.5 2.8 0.2 2.2 24.2 New Mexico 7.4 8.0 5.1 - 0.6 21.1 Florida 1.2 9.4 - - - 10.6 California 0.2 - 9.4 0.1 0.1 9.8 Ohio 1.2 8.4 - - - 9.6 North Carolina 6.7 - - 0.2 - 6.9 Tennessee - 6.4 - 0.1 - 6.5 New Jersey 6.4 - - - - 6.4 Other (24 states) 3.8 16.6 1.6 1.5 1.2 24.7 Totals $ 31.8 $ 107.5 $ 50.9 $ 2.2 $ 4.1 $ 196.5 |
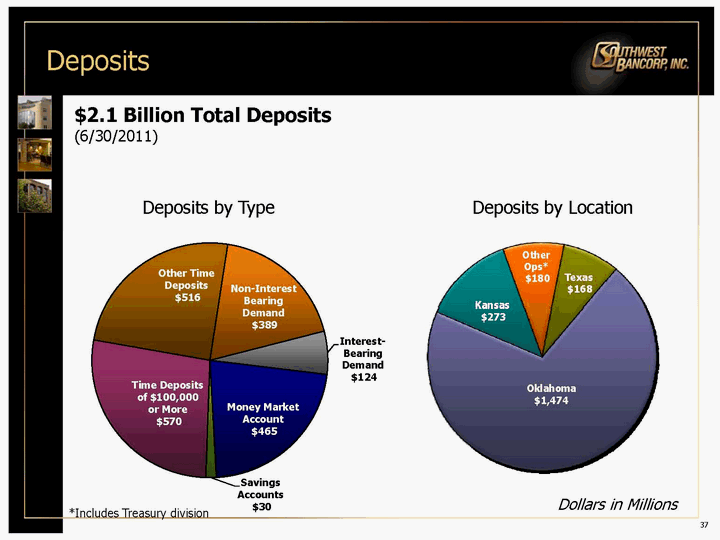
| Deposits 37 $2.1 Billion Total Deposits (6/30/2011) Deposits by Type Deposits by Location *Includes Treasury division Dollars in Millions |
