Attached files
| file | filename |
|---|---|
| EX-32.1 - EXHIBIT 32.1 - AgFeed Industries, Inc. | v229416_ex32-1.htm |
| EX-32.2 - EXHIBIT 32.2 - AgFeed Industries, Inc. | v229416_ex32-2.htm |
| EX-31.2 - EXHIBIT 31.2 - AgFeed Industries, Inc. | v229416_ex31-2.htm |
| EX-31.1 - EXHIBIT 31.1 - AgFeed Industries, Inc. | v229416_ex31-1.htm |
UNITED STATES
SECURITIES AND EXCHANGE COMMISSION
Washington, D.C. 20549
Form 10-Q
|
x
|
Quarterly report pursuant Section 13 or 15(d) of the Securities Exchange Act of 1934
|
For the quarterly period ended June 30, 2011
For the transition period from _______ to _______
001-33674
(Commission file number)
AGFEED INDUSTRIES, INC.
(Exact name of registrant as specified in its charter)
|
Nevada
|
20-2597168
|
|
|
(State or other jurisdiction of incorporation
or organization)
|
(I.R.S. Employer Identification No.)
|
|
|
100 Bluegrass Commons Blvd.
Suite 310
Hendersonville, Tennessee
|
37075
|
|
|
(Address of principal executive offices)
|
(Zip Code)
|
|
(917) 804-3584
|
|
(Registrant’s telephone number, including area code)
|
Indicate by check mark whether the registrant (1) has filed all reports required to be filed by Section 13 or 15(d) of the Securities Exchange Act of 1934 during the preceding 12 months (or for such shorter period that the registrant was required to file such reports), and (2) has been subject to such filing requirements for the past 90 days.
Indicate by check mark whether the registrant has submitted electronically and posted on its corporate Web site, if any, every Interactive Data File required to be submitted and posted pursuant to Rule 405 of Regulation S-T (§ 232.405 of this chapter) during the preceding 12 months (or for such shorter period that the registrant was required to submit and post such files). Yes ¨ No ¨
Indicate by check mark whether the registrant is a large accelerated filer, an accelerated filer, a non-accelerated filer, or a smaller reporting company. See the definitions of “large accelerated filer,” “accelerated filer” and “smaller reporting company” in Rule 12b-2 of the Exchange Act..
|
Large accelerated filer ¨
|
Accelerated filer x
|
|
Non-accelerated filer ¨
|
Smaller reporting company¨
|
(Do not check if a smaller reporting company)
Indicate by check mark whether the registrant is a shell company (as defined in Rule 12b-2 of the Exchange Act).
Yes ¨ No x
On August 9, 2011, 63,941,163 shares of the registrant's common stock were outstanding.
TABLE OF CONTENTS
|
PART I – FINANCIAL INFORMATION
|
3
|
|
|
Item 1.
|
Financial Statements
|
3
|
|
Reclassifications
|
13
|
|
|
Item 2.
|
Management’s Discussion and Analysis of Financial Condition and Results of Operations
|
21
|
|
Item 3.
|
Quantitative and Qualitative Disclosures About Market Risk
|
43
|
|
Item 4.
|
Controls and Procedures
|
44
|
|
Part II.
|
OTHER INFORMATION
|
44
|
|
Item 1.
|
Legal Proceedings
|
44
|
|
Item 1A.
|
Risk Factors
|
44
|
|
Item 2.
|
Unregistered Sales of Equity Securities and Use of Proceeds
|
45
|
|
Item 3.
|
Defaults Upon Senior Securities
|
45
|
|
Item 4.
|
(Removed and Reserved)
|
45
|
|
Item 5.
|
Other Information
|
45
|
|
Item 6.
|
Exhibits
|
45
|
|
SIGNATURES
|
46
|
|
2
PART I – FINANCIAL INFORMATION
|
Item 1.
|
Financial Statements
|
AGFEED INDUSTRIES, INC. AND SUBSIDIARIES
CONSOLIDATED BALANCE SHEETS
AS OF JUNE 30, 2011 AND DECEMBER 31, 2010
|
2011
|
2010
|
|||||||
|
(unaudited)
|
||||||||
|
ASSETS
|
||||||||
|
CURRENT ASSETS:
|
||||||||
|
Cash and cash equivalents
|
$ | 10,758,836 | $ | 12,399,916 | ||||
|
Accounts receivable, net of allowance for doubtful accounts
of $7,044,767 and $707,968
|
13,230,158 | 21,841,442 | ||||||
|
Advances to suppliers
|
37,969 | 1,676,593 | ||||||
|
Inventory
|
87,942,225 | 81,379,649 | ||||||
|
Prepaid expenses and other current assets
|
3,275,227 | 2,242,807 | ||||||
|
Deferred tax asset
|
83,685 | 83,685 | ||||||
|
Assets of discontinued operations
|
- | 6,293,524 | ||||||
|
Total current assets
|
115,328,100 | 125,917,616 | ||||||
|
PROPERTY AND EQUIPMENT, net
|
76,748,174 | 63,631,224 | ||||||
|
INTANGIBLE ASSETS, net
|
5,439,708 | 5,783,102 | ||||||
|
GOODWILL
|
22,801,262 | 22,365,414 | ||||||
|
DEFERRED TAX ASSET
|
2,502,836 | 2,329,548 | ||||||
|
OTHER ASSETS
|
2,114,750 | 3,467,758 | ||||||
|
TOTAL ASSETS
|
$ | 224,934,830 | $ | 223,494,662 | ||||
|
LIABILITIES AND EQUITY
|
||||||||
|
CURRENT LIABILITIES:
|
||||||||
|
Short-term loan
|
$ | - | $ | 4,551,000 | ||||
|
Line of credit
|
48,535,609 | - | ||||||
|
Accounts payable
|
7,429,565 | 8,783,569 | ||||||
|
Other payables
|
3,146,624 | 3,736,931 | ||||||
|
Unearned revenue
|
15,602 | 489,241 | ||||||
|
Accrued expenses
|
11,311,639 | 6,142,747 | ||||||
|
Accrued payroll
|
1,154,654 | 1,163,504 | ||||||
|
Tax and welfare payable
|
1,078,320 | 1,893,727 | ||||||
|
Interest payable
|
18,408 | 121,392 | ||||||
|
Current portion of long-term debt
|
1,718,108 | 1,703,658 | ||||||
|
Convertible notes, net of discount of $10,864
|
- | 989,136 | ||||||
|
Liabilities of discontinued operations
|
97,446 | 1,595,805 | ||||||
|
Total current liabilities
|
74,505,975 | 31,170,710 | ||||||
|
ACQUISITION NOTE PAYABLE
|
9,621,434 | 9,621,434 | ||||||
|
LINE OF CREDIT
|
- | 42,231,176 | ||||||
|
LONG-TERM DEBT
|
13,852,537 | 15,024,666 | ||||||
|
TOTAL LIABILITIES
|
97,979,946 | 98,047,986 | ||||||
|
COMMITMENTS AND CONTINGENCIES (Note 11)
|
- | - | ||||||
|
EQUITY:
|
||||||||
|
AgFeed stockholders' equity:
|
||||||||
|
Common stock, $0.001 per share; 75,000,000 shares authorized;
63,818,757 issued and 63,432,062 outstanding at June 30, 2011
51,756,907 issued and 51,370,212 outstanding at December 31, 2010
|
63,819 | 51,758 | ||||||
|
Additional paid-in capital
|
142,581,263 | 125,788,151 | ||||||
|
Accumulated other comprehensive income
|
10,356,717 | 8,120,628 | ||||||
|
Statutory reserve
|
5,644,967 | 5,621,937 | ||||||
|
Treasury stock (386,695 shares)
|
(1,858,942 | ) | (1,858,942 | ) | ||||
|
Accumulated deficit
|
(29,879,113 | ) | (12,430,229 | ) | ||||
|
Total AgFeed stockholders' equity
|
126,908,711 | 125,293,303 | ||||||
|
Noncontrolling interest
|
46,173 | 153,373 | ||||||
|
Total equity
|
126,954,884 | 125,446,676 | ||||||
|
TOTAL LIABILITIES AND EQUITY
|
$ | 224,934,830 | $ | 223,494,662 | ||||
The accompanying notes are an integral part of these consolidated financial statements.
3
AGFEED INDUSTRIES, INC. AND SUBSIDIARIES
CONSOLIDATED STATEMENTS OF OPERATIONS AND OTHER COMPREHENSIVE INCOME (LOSS)
FOR THE THREE AND SIX MONTHS ENDED JUNE 30, 2011 AND 2010
|
Three Months Ended June 30,
|
Six Months Ended June 30,
|
|||||||||||||||
|
2011
|
2010
|
2011
|
2010
|
|||||||||||||
|
(unaudited)
|
(unaudited)
|
(unaudited)
|
(unaudited)
|
|||||||||||||
|
Revenues
|
$
|
85,397,972
|
$
|
33,760,376
|
$
|
178,385,171
|
$
|
80,250,232
|
||||||||
|
Cost of goods sold
|
77,311,556
|
30,223,994
|
162,418,653
|
70,841,813
|
||||||||||||
|
Gross profit
|
8,086,416
|
3,536,382
|
15,966,518
|
9,408,419
|
||||||||||||
|
Operating expenses
|
||||||||||||||||
|
Selling expenses
|
1,086,305
|
975,823
|
2,072,968
|
1,993,987
|
||||||||||||
|
General and administrative expenses
|
6,187,232
|
3,642,078
|
11,343,437
|
7,085,249
|
||||||||||||
|
Receivable credit and collection losses
|
14,265,222
|
-
|
15,484,448
|
-
|
||||||||||||
|
Total operating expenses
|
21,538,759
|
4,617,901
|
28,900,853
|
9,079,236
|
||||||||||||
|
Income (loss) from operations
|
(13,452,343
|
)
|
(1,081,519
|
)
|
(12,934,335
|
)
|
329,183
|
|||||||||
|
Non-operating income (expense):
|
||||||||||||||||
|
Other income (expense)
|
(38,522
|
)
|
177,453
|
(41,238
|
)
|
252,611
|
||||||||||
|
Interest income
|
7,671
|
36,951
|
22,393
|
84,284
|
||||||||||||
|
Interest and financing costs
|
(995,837
|
)
|
(139,930
|
)
|
(1,910,796
|
)
|
(264,841
|
)
|
||||||||
|
Foreign currency transaction loss
|
(4,467
|
)
|
(34,364
|
)
|
(14,595
|
)
|
(20,561
|
)
|
||||||||
|
Total non-operating income (expense)
|
(1,031,155
|
)
|
40,110
|
(1,944,236
|
)
|
51,493
|
||||||||||
|
Loss from operations before income taxes
|
(14,483,498
|
)
|
(1,041,409
|
)
|
(14,878,571
|
)
|
380,676
|
|||||||||
|
Income tax expense (benefit)
|
(304,244
|
)
|
641,139
|
234,495
|
1,094,719
|
|||||||||||
|
Loss from continuing operations
|
(14,179,254
|
)
|
(1,682,548
|
)
|
(15,113,066
|
)
|
(714,043
|
)
|
||||||||
|
Discontinued operations:
|
||||||||||||||||
|
Income (loss) from discontinued operations (including loss
|
||||||||||||||||
|
on disposal of $830,200 in 2011)
|
(1,744,242
|
)
|
(1,382,165
|
)
|
(2,425,287
|
)
|
(1,339,446
|
)
|
||||||||
|
Net loss
|
(15,923,496
|
)
|
(3,064,713
|
)
|
(17,538,353
|
)
|
(2,053,489
|
)
|
||||||||
|
Less: Net loss attributed to noncontrolling interest
|
(48,466
|
)
|
(109,961
|
)
|
(112,499
|
)
|
(166,155
|
)
|
||||||||
|
Net loss attributed to AgFeed
|
$
|
(15,875,030
|
)
|
$
|
(2,954,752
|
)
|
$
|
(17,425,854
|
)
|
$
|
(1,887,334
|
)
|
||||
|
Comprehensive loss
|
||||||||||||||||
|
Net loss
|
$
|
(15,923,496
|
)
|
$
|
(3,064,713
|
)
|
$
|
(17,538,353
|
)
|
$
|
(2,053,489
|
)
|
||||
|
Foreign currency translation gain
|
1,462,945
|
298,682
|
2,241,388
|
299,446
|
||||||||||||
|
Comprehensive loss
|
$
|
(14,460,551
|
)
|
$
|
(2,766,031
|
)
|
$
|
(15,296,965
|
)
|
$
|
(1,754,043
|
)
|
||||
|
Weighted average shares outstanding :
|
||||||||||||||||
|
Basic
|
60,500,355
|
45,015,351
|
56,964,030
|
44,942,821
|
||||||||||||
|
Diluted
|
60,500,355
|
45,015,351
|
56,964,030
|
44,942,821
|
||||||||||||
|
Basic loss per share attributed to AgFeed common stockholders:
|
||||||||||||||||
|
Continuing operations
|
$
|
(0.23
|
)
|
$
|
(0.03
|
)
|
$
|
(0.27
|
)
|
$
|
(0.01
|
)
|
||||
|
Discontinued operations
|
(0.03
|
)
|
$
|
(0.03
|
)
|
(0.04
|
)
|
$
|
(0.03
|
)
|
||||||
|
$
|
(0.26
|
)
|
$
|
(0.07
|
)
|
$
|
(0.31
|
)
|
$
|
(0.04
|
)
|
|||||
|
Diluted loss per share attributed to AgFeed common stockholders:
|
||||||||||||||||
|
Continuing operations
|
$
|
(0.23
|
)
|
$
|
(0.03
|
)
|
$
|
(0.27
|
)
|
$
|
(0.01
|
)
|
||||
|
Discontinued operations
|
(0.03
|
)
|
$
|
(0.03
|
)
|
(0.04
|
)
|
$
|
(0.03
|
)
|
||||||
|
$
|
(0.26
|
)
|
$
|
(0.07
|
)
|
$
|
(0.31
|
)
|
$
|
(0.04
|
)
|
|||||
The accompanying notes are an integral part of these consolidated financial statements.
4
AGFEED INDUSTRIES, INC. AND SUBSIDIARIES
CONSOLIDATED STATEMENTS OF CASH FLOWS
FOR THE SIX MONTHS ENDED JUNE 30, 2011 AND 2010
|
2011
|
2010
|
|||||||
|
(unaudited)
|
(unaudited)
|
|||||||
|
CASH FLOWS FROM OPERATING ACTIVITIES:
|
||||||||
|
Net loss
|
$
|
(17,538,353
|
)
|
$
|
(2,053,489
|
)
|
||
|
Adjustments to reconcile net loss
|
||||||||
|
to net cash used in operating activities:
|
||||||||
|
Depreciation
|
2,743,997
|
1,575,933
|
||||||
|
Amortization of intangible assets
|
365,906
|
43,410
|
||||||
|
Loss on sale/disposal of assets
|
1,460,937
|
1,321,838
|
||||||
|
Receivable credit and collection losses
|
15,484,448
|
-
|
||||||
|
Stock based compensation
|
14,470
|
150,562
|
||||||
|
Issuance of common stock for services
|
770,986
|
751,440
|
||||||
|
Amortization of debt issuance costs
|
4,617
|
14,921
|
||||||
|
Amortization of discount on convertible debt
|
10,864
|
35,114
|
||||||
|
Change in working capital components
|
||||||||
|
Accounts receivable
|
(5,849,266
|
)
|
(2,945,382
|
)
|
||||
|
Other receivables
|
-
|
618,255
|
||||||
|
Inventory
|
(2,972,764
|
)
|
(3,340,955
|
)
|
||||
|
Advances to suppliers
|
1,713,581
|
885,238
|
||||||
|
Prepaid expenses
|
(246,045
|
)
|
(59,691
|
)
|
||||
|
Deferred taxes
|
(173,288
|
)
|
-
|
|||||
|
Other assets
|
1,821,147
|
-
|
||||||
|
Accounts payable
|
(2,281,079
|
)
|
610,581
|
|||||
|
Other payables
|
(1,318,111
|
)
|
(137,439
|
)
|
||||
|
Unearned revenue
|
(560,326
|
)
|
(254,731
|
)
|
||||
|
Accrued expenses
|
3,997,211
|
58,106
|
||||||
|
Accrued payroll
|
(77,073
|
)
|
(243,862
|
)
|
||||
|
Tax and welfare payable
|
(841,248
|
)
|
74,277
|
|||||
|
Interest payable
|
(103,198
|
)
|
35,195
|
|||||
|
Net cash used in operating activities
|
(3,572,587
|
)
|
(2,860,679
|
)
|
||||
|
CASH FLOWS FROM INVESTING ACTIVITIES:
|
||||||||
|
Purchase of property and equipment
|
(14,729,771
|
)
|
(10,759,297
|
)
|
||||
|
Proceeds from the sale of assets
|
315,114
|
-
|
||||||
|
Net cash used in investing activities
|
(14,414,657
|
)
|
(10,759,297
|
)
|
||||
|
CASH FLOWS FROM FINANCING ACTIVITIES:
|
||||||||
|
Proceeds from the sale of common stock
|
16,592,625
|
-
|
||||||
|
Borrowings under line of credit facility, net
|
6,304,433
|
-
|
||||||
|
Payment on convertible notes
|
(1,000,000
|
)
|
-
|
|||||
|
Payment on note payable
|
(1,157,679
|
)
|
-
|
|||||
|
Payment on short-term loan
|
(4,587,000
|
)
|
-
|
|||||
|
Capital contributed by noncontrolling interest
|
-
|
401,282
|
||||||
|
Purchase of noncontrolling interest in majority owed hog farms
|
-
|
(406,103
|
)
|
|||||
|
Net cash provided by (used in) financing activities
|
16,152,379
|
(4,821
|
)
|
|||||
|
Effect of exchange rate changes on cash and cash equivalents
|
193,785
|
72,133
|
||||||
|
NET DECREASE IN CASH & CASH EQUIVALENTS
|
(1,641,080
|
)
|
(13,552,664
|
)
|
||||
|
CASH & CASH EQUIVALENTS, BEGINNING BALANCE
|
12,399,916
|
37,580,154
|
||||||
|
CASH & CASH EQUIVALENTS, ENDING BALANCE
|
$
|
10,758,836
|
$
|
24,027,490
|
||||
|
SUPPLEMENTAL DISCLOSURE OF CASH FLOW INFORMATION:
|
||||||||
|
Interest paid, net of amounts capitalized
|
$
|
1,998,299 |
$
|
204,969
|
||||
|
Income taxes paid
|
$
|
1,136,283 |
$
|
492,843
|
||||
The accompanying notes are an integral part of these consolidated financial statements.
5
AGFEED INDUSTRIES, INC. AND SUBSIDIARIES
NOTES TO CONSOLIDATED FINANCIAL STATEMENTS
FOR THE SIX MONTHS ENDED JUNE 30, 2011 AND 2010
(unaudited)
Note 1 - Organization and Basis of Presentation
The unaudited consolidated financial statements were prepared by AgFeed Industries, Inc. pursuant to the rules and regulations of the Securities and Exchange Commission (“SEC”). The information furnished herein reflects all adjustments (consisting of normal recurring accruals and adjustments) which are, in the opinion of management, necessary to fairly present the operating results for the respective periods. Certain information and footnote disclosures normally present in annual consolidated financial statements prepared in accordance with accounting principles generally accepted in the United States of America (“US GAAP”) were omitted pursuant to such rules and regulations. These consolidated financial statements should be read in conjunction with the audited consolidated financial statements and footnotes included in the Company’s Annual Report on Form 10-K for the year ended December 31, 2010. The results for the three and six months ended June 30, 2011 are not necessarily indicative of the results to be expected for the full year ending December 31, 2011.
Organization and Lines of Business
AgFeed Industries, Inc. (the “Company” or “AgFeed”) was incorporated in the State of Nevada on March 30, 2005. The Company is engaged in the animal nutrition business and commercial hog production business in the United States and China through its operating subsidiaries.
The Company’s animal nutrition business consists of the manufacture, marketing and sale of premix, concentrate and complete feed for use in the Chinese animal husbandry markets almost exclusively for hog production. Premix is an animal feed additive that is used in commercial animal production worldwide. The Company has been almost exclusively in the premix feed business since 1995 and now operates five premix, concentrate and complete feed manufacturing facilities located in the cities of Nanchang, Shandong, Shanghai, Nanning, and Hainan. The Company is expanding its concentrate and complete feed lines to meet the growing demand of commercial producers as they modernize their production technology and focus on the requirements of the food safety laws.
The Company entered the hog breeding and production business in China in November 2007. In this business, the Company mainly produces hogs for processing and sell breeding stock. The Company currently has two breeder farms and 21 meat hog producing farms in the Jiangxi, Shanghai, Hainan, Guangxi and Fujian provinces. The Company has almost finished construction of its western style hog farm in the Guangxi province and has just begun construction of another western style hog farm in the Jiangxi province.
The Company entered the hog breeding and production business in the United States in September 2010 with the acquisition of M2 P2, LLC (“M2P2”). M2P2 operates hog farms and facilities in Colorado, Oklahoma, North Carolina and Iowa.
Basis of Presentation
The accompanying consolidated financial statements include the accounts of AgFeed Industries, Inc. and its wholly-owned and majority-owned subsidiaries. All significant inter-company accounts and transactions have been eliminated in consolidation.
The accompanying consolidated financial statements have been prepared in conformity with accounting principles generally accepted in the United States (“US GAAP”). The Company’s Chinese subsidiaries’ functional currency is the Chinese Yuan Renminbi (“RMB”) and the Company’s United States subsidiaries’ functional currency is the Unites States Dollar (“USD”). The accompanying consolidated financial statements have been translated and presented in USD.
6
NOTES TO CONSOLIDATED FINANCIAL STATEMENTS
FOR THE SIX MONTHS ENDED JUNE 30, 2011 AND 2010
(unaudited)
Note 2 – Summary of Significant Accounting Policies
Use of Estimates
The preparation of financial statements in conformity with US GAAP requires management to make estimates and assumptions that affect the reported amounts of assets and liabilities and disclosure of contingent assets and liabilities at the date of the financial statements and the reported amounts of revenues and expenses during the reporting period. Actual results could differ from those estimates.
Cash and Cash Equivalents
Cash and cash equivalents include cash on hand and cash in time deposits, certificates of deposit and all highly liquid debt instruments with original maturities of three months or less.
Accounts Receivable
Accounts receivable are carried at original invoice less an estimate for doubtful accounts. Management reviews the composition of accounts receivable and analyzes historical bad debts, customer concentrations, customer credit worthiness, current economic trends and changes in customer payment patterns to evaluate the adequacy of these reserves. Accounts receivable are written off when deemed uncollectible. Recoveries of trade receivables previously written off are recorded when received.
The Company’s accounts receivable and reserves for doubtful accounts are substantially representative of its credit dealings with animal nutrition customers. The Company ages its receivables into traditional 30-day buckets and monitors the customers and balances on a regular basis. Generally the Company uses a formula-based analysis to more broadly assign collection risk to its aging groups primarily over 90 days past due, subject to specific customer review. This formula-based approach applies a declining percentage of collectability to each bucket-aging category at least 90 days past due as the past due days increase. For the current quarter, however, the Company placed greater reliance on individual customer assessment and then applied an overall factor of collection as its believes the Company is experiencing a new set of market dynamics exacerbated by the reorganization of its animal feed nutrition segment, cash constraints of its long-standing customers related to increasing feed raw material costs and herd expansion initiatives. The below table analyzes the change in the Company’s accounts receivable reserve from December 31, 2011 to June 30, 2011:
|
Balance, December 31, 2010
|
$ | 707,968 | ||
|
Additions
|
15,484,448 | |||
|
Write-offs of uncollectible accounts
|
(9,147,649 | ) | ||
| Balance, June 30, 2011 | $ | 7,044,767 |
The increase in the accounts receivable reserve includes approximately of $9.2 million related to the collection of outstanding accounts receivable in the Company's Chinese animal nutrition business and an additional $6.3 million of bad debt allowance. The operating pressures facing the Company's customers has led management increase accounts receivable reserves due to concerns regarding credit quality.
Advances to Suppliers
The Company makes advances to certain vendors for purchases of material. The advances are interest free and unsecured.
7
AGFEED INDUSTRIES, INC. AND SUBSIDIARIES
NOTES TO CONSOLIDATED FINANCIAL STATEMENTS
FOR THE SIX MONTHS ENDED JUNE 30, 2011 AND 2010
(unaudited)
Inventory
Inventory is stated at the lower of cost, as determined primarily by the average cost method, or market. Management compares the cost of inventories with their market value, and an allowance is made for writing down the inventories to their market value, if lower. Costs of raised animals include proportionate costs of breeding, including depreciation of the breeding herd, plus the costs of maintenance through the balance sheet date. Purchased pigs are carried at purchase cost plus costs of maintenance through the balance sheet date.
Inventory consisted of the following at June 30, 2011 and December 31, 2010:
|
June 30,
2011
|
December 31,
2010
|
|||||||
|
Raw material
|
$ | 11,125,948 | $ | 11,691,635 | ||||
|
Work in process
|
149,341 | 160,007 | ||||||
|
Finished goods – feed
|
53,048 | 810,786 | ||||||
|
Hogs
|
76,613,888 | 68,717,221 | ||||||
|
Total
|
$ | 87,942,225 | $ | 81,379,649 | ||||
Property & Equipment
Property and equipment are stated at cost. Expenditures for maintenance and repairs are expensed as incurred; additions, renewals and betterments are capitalized. When property and equipment are retired or otherwise disposed of, the related cost and accumulated depreciation are removed from the respective accounts, and any gain or loss is included in operations. Depreciation of property and equipment is provided using the straight-line method for substantially all assets with estimated lives as follows:
|
Office equipment
|
1 to 5 years
|
|
Operating equipment
|
1 to10 years
|
|
Vehicles
|
5 years
|
|
Swine for reproduction
|
2 to 3.5 years
|
|
Buildings
|
20 to 40 years
|
The following are the details of property and equipment at June 30, 2011 and December 31, 2010:
|
June 30,
|
December 31,
|
|||||||
|
2011
|
2010
|
|||||||
|
Office equipment
|
$ | 1,020,845 | $ | 983,992 | ||||
|
Operating equipment
|
17,300,906 | 13,945,244 | ||||||
|
Vehicles
|
1,279,784 | 994,686 | ||||||
|
Swine for reproduction
|
19,857,311 | 10,830,812 | ||||||
|
Land
|
915,956 | 752,500 | ||||||
|
Buildings
|
40,497,522 | 29,165,246 | ||||||
|
Construction-in-process
|
4,373,390 | 11,888,319 | ||||||
|
Total
|
85,245,714 | 68,560,799 | ||||||
|
Less accumulated depreciation
|
(8,497,540 | ) | (4,929,575 | ) | ||||
| $ | 76,748,174 | $ | 63,631,224 | |||||
Construction-in-process consists of amounts expended for construction. Once construction is completed, the cost accumulated in construction-in-process is transferred to property and equipment.
8
AGFEED INDUSTRIES, INC. AND SUBSIDIARIES
NOTES TO CONSOLIDATED FINANCIAL STATEMENTS
FOR THE SIX MONTHS ENDED JUNE 30, 2011 AND 2010
(unaudited)
Long-Lived Assets
The Company applies the provisions of ASC Topic 360, “Property, Plant, and Equipment,” which addresses financial accounting and reporting for the impairment or disposal of long-lived assets, including intangible assets. ASC Topic 360 requires impairment losses to be recorded on long-lived assets used in operations when indicators of impairment are present and the undiscounted cash flows estimated to be generated by those assets are less than the assets’ carrying amounts. In that event, a loss is recognized based on the amount by which the carrying amount exceeds the fair value of the long-lived assets. Loss on long-lived assets to be disposed of is determined in a similar manner, except that fair values are reduced for the cost of disposal. The Company determined that based on the criteria above, an impairment of certain assets was necessary and accordingly recorded an impairment of approximately $9.0 million for the year ended December 31, 2010 and approximately $0.9 million for the six months ended June 30, 2011.
Intangible Assets
The following are the details of intangible assets at June 30, 2011 and December 31, 2010:
|
June 30,
|
December 31,
|
|||||||
|
2011
|
2010
|
|||||||
|
Right to use land
|
$ | 796,729 | $ | 781,278 | ||||
|
Customer relationships
|
4,679,158 | 4,835,195 | ||||||
|
Computer software
|
509,772 | 478,988 | ||||||
|
Total
|
5,985,659 | 6,095,461 | ||||||
|
Less Accumulated amortization
|
(545,951 | ) | (312,359 | ) | ||||
|
Intangibles, net
|
$ | 5,439,708 | $ | 5,783,102 | ||||
Per the People's Republic of China's (“PRC”) governmental regulations, the PRC Government owns all Chinese land. Generally, the Company leases, through its PRC subsidiaries, land pursuant to land use contracts with the PRC government for periods of 30 to 50 years. Accordingly, the right to use land for these companies is amortized over 50 years or the lease term, if shorter. Customer relationships is amortized over five to twelve years and the computer software is amortized over three to nine years. For hog farms, the Company generally signed land leases with original owners of the farms.
The Company follows ASC Topic 350 in accounting for intangible assets, which requires impairment losses to be recorded when indicators of impairment are present and the undiscounted cash flows estimated to be generated by the assets are less than the assets’ carrying amounts. There were no impairment losses recorded on intangible assets for the six months ended June 30, 2011 and 2010.
Goodwill
Goodwill represents the excess of purchase price over the underlying net assets of businesses acquired. Under accounting requirements, goodwill is not amortized but is subject to annual impairment tests.
The extreme operating conditions that the Company experienced during 2010 lead to a full review of its established Chinese production system (the farms acquired during 2007 and 2008). This review has resulted in a change in the management of this farm system and an assessment that while the system can be operated profitably it cannot sustain a high enough level of profitability to support the original acquisition values and resulting goodwill. In connection with the Company’s annual review for the year ended December 31, 2010, management determined that a write down of goodwill of $21,612,398 was necessary. The impairment was determined based on the fair value of the reporting units, which was estimated based on a discounted cash flow valuation model and the projected future cash flows of the underlying businesses. Management determined that there were no triggering events at June 30, 2011 and deemed no additional impairment was necessary.
9
AGFEED INDUSTRIES, INC. AND SUBSIDIARIES
NOTES TO CONSOLIDATED FINANCIAL STATEMENTS
FOR THE SIX MONTHS ENDED JUNE 30, 2011 AND 2010
(unaudited)
Summary of changes in goodwill by reporting segments is as follows:
|
Animal
|
Hog Production
|
|||||||||||||||
|
Nutrition
|
China
|
U.S. (M2P2)
|
Total
|
|||||||||||||
|
Balance, December 31, 2010
|
$ | 2,437,135 | $ | 19,602,279 | $ | 326,000 | $ | 22,365,414 | ||||||||
|
Foreign currency adjustment
|
48,197 | 387,651 | - | 435,848 | ||||||||||||
|
Balance, June 30, 2011
|
$ | 2,485,332 | $ | 19,989,930 | $ | 326,000 | $ | 22,801,262 | ||||||||
Revenue Recognition
Revenue is recognized when services are rendered to customers when a formal arrangement exists, the price is fixed or determinable, the delivery is completed, no other significant obligations of the Company exist and collectability is reasonably assured. Payments received before all of the relevant criteria for revenue recognition are satisfied are recorded as unearned revenue. The Company is not subject to VAT withholdings. The Company gives volume rebates to certain customers based on volume achieved. The Company accrues sales rebates based on actual sales volume.
Major Customer
The Company has one major customer that during the six months ended June 30, 2011 accounted for approximately $104.7 million in revenues or 57.8% of total Company revenues. This customer also accounted for approximately 32% of the Company’s accounts receivable at June 30, 2011. No one customer accounted for more than 10% of the Company’s revenue for the six months ended June 30, 2010.
Advertising Costs
The Company expenses the cost of advertising as incurred or, as appropriate, the first time the advertising takes place. Advertising costs for the six months ended June 30, 2011 and 2010 were not significant.
Research and Development
The Company expenses its research and development costs as incurred. Research and development costs for the three and six months ended June 30, 2011 and 2010 were not significant.
Derivative Instruments
Under accounting requirements, all derivative instruments are recognized on the balance sheet at fair value. The accounting for changes in the fair value (gains or losses) depends on the nature of the derivative and hedging relationship.
M2P2 periodically utilizes derivative instruments in its risk management and commodity hedging activities. Derivative instruments primarily include futures and forward contracts which may be utilized to hedge price risk related to a portion of the Company’s grain purchases. Although the derivatives are considered an economic hedge, they do not qualify for the defined hedge accounting and, accordingly, changes in fair value of the derivatives are recognized in net income. Gains or losses related to grain derivatives are classified in cost of goods sold on the consolidated statement of operations.
10
NOTES TO CONSOLIDATED FINANCIAL STATEMENTS
FOR THE SIX MONTHS ENDED JUNE 30, 2011 AND 2010
(unaudited)
The Company’s open derivative positions have been recorded at fair value (marked to market), resulting in a derivative asset and liability of approximately $896,000 and $0, and $1,094,000 and $980,000 at June 30, 2011 and December 31, 2010, respectively. Derivative assets are included in other current assets and derivative liabilities are included in accrued expenses on the consolidated balance sheet. Realized and unrealized derivative losses included in net loss during the six months ended June 30, 2011 totaled approximately $1,467,000 and $(195,000), respectively.
Stock-Based Compensation
The Company records stock-based compensation in accordance with ASC Topic 718, “Compensation – Stock Compensation.” ASC Topic 718 requires companies to measure compensation cost for stock-based employee compensation at fair value at the grant date and recognize the expense over the employee’s requisite service period. The Company recognizes in the statement of operations the grant-date fair value of stock options and other equity-based compensation issued to employees and non-employees.
Income Taxes
The Company accounts for income taxes in accordance with ASC Topic 740, “Income Taxes.” ASC Topic 740 requires a company to use the asset and liability method of accounting for income taxes, whereby deferred tax assets are recognized for deductible temporary differences, and deferred tax liabilities are recognized for taxable temporary differences. Temporary differences are the differences between the reported amounts of assets and liabilities and their tax bases. Deferred tax assets are reduced by a valuation allowance when, in the opinion of management, it is more likely than not that some portion, or all of, the deferred tax assets will not be realized. Deferred tax assets and liabilities are adjusted for the effects of changes in tax laws and rates on the date of enactment. As of June 30, 2011 the Company had China deferred tax assets of approximately $2.7 million which were fully offset by a related valuation allowance.
Foreign Currency Translation
The accounts of the Company’s Chinese subsidiaries are maintained in RMB and the accounts of the U.S. parent company and U.S. subsidiaries are maintained in USD. The accounts of the Chinese subsidiaries were translated into USD in accordance with Accounting Standards Codification (“ASC”) Topic 830 “Foreign Currency Matters,” with the RMB as the functional currency for the Chinese subsidiaries. According to ASC Topic 830, all assets and liabilities were translated at the exchange rate on the balance sheet dates, stockholders’ equity is translated at historical rates and statement of income items are translated at the weighted average exchange rate for the period. The resulting translation adjustments are reported under other comprehensive income in accordance with ASC Topic 220, “Comprehensive Income.” Gains and losses resulting from the translations of foreign currency transactions and balances are reflected in the statements of income.
Foreign Currency Transactions and Comprehensive Income
US GAAP requires that recognized revenue, expenses, gains and losses be included in net income. Certain statements, however, require entities to report specific changes in assets and liabilities, such as gain or loss on foreign currency translation, as a separate component of the equity section of the balance sheet. Such items, along with net income, are components of comprehensive income. The functional currency of the Company’s Chinese subsidiaries is the RMB. The unit of Renminbi is in Yuan. Translation gains are classified as an item of accumulated other comprehensive income in the stockholders’ equity section of the consolidated balance sheet.
Basic and Diluted Earnings (Loss) Per Share
Earnings per share is calculated in accordance with the ASC Topic 260, “Earnings Per Share.” Basic earnings per share is based upon the weighted average number of common shares outstanding. Diluted earnings per share is based on the assumption that all dilutive convertible shares and stock warrants were converted or exercised. Dilution is computed by applying the treasury stock method. Under this method, warrants are assumed to be exercised at the beginning of the period (or at the time of issuance, if later), and as if funds obtained thereby were used to purchase common stock at the average market price during the period. At June 30, 2011, the Company had a total of 2,169,435 common stock equivalents outstanding, including options and warrants. All common stock equivalents for the six months ended June 30, 2011 are anti-dilutive due to the net loss incurred.
11
AGFEED INDUSTRIES, INC. AND SUBSIDIARIES
NOTES TO CONSOLIDATED FINANCIAL STATEMENTS
FOR THE SIX MONTHS ENDED JUNE 30, 2011 AND 2010
(unaudited)
The following is a reconciliation of the number of shares (denominator) used in the basic and diluted earnings per share computations for the three and six months ended June 30, 2011 and 2010:
Three months ended June 30:
|
2011
|
2010
|
|||||||||||||||
|
Per Share
|
Per Share
|
|||||||||||||||
|
Shares
|
Amount
|
Shares
|
Amount
|
|||||||||||||
|
Basic earnings per share
|
60,500,355 | $ | (0.26 | ) | 45,015,351 | $ | (0.07 | ) | ||||||||
|
Effect of dilutive stock options and warrants
|
- | - | - | - | ||||||||||||
|
Diluted earnings per share
|
60,500,355 | $ | (0.26 | ) | 45,015,351 | $ | (0.07 | ) | ||||||||
Six months ended June 30:
|
2011
|
2010
|
|||||||||||||||
|
Per Share
|
Per Share
|
|||||||||||||||
|
Shares
|
Amount
|
Shares
|
Amount
|
|||||||||||||
|
Basic earnings per share
|
56,964,030 | $ | (0.31 | ) | 44,942,821 | $ | (0.04 | ) | ||||||||
|
Effect of dilutive stock options and warrants
|
- | - | - | - | ||||||||||||
|
Diluted earnings per share
|
56,964,030 | $ | (0.31 | ) | 44,942,821 | $ | (0.04 | ) | ||||||||
Statement of Cash Flows
In accordance ASC Topic 230, “Statement of Cash Flows,” cash flows from the Company’s operations are calculated based upon the local currencies using the average translation rates. As a result, amounts related to assets and liabilities reported on the consolidated statements of cash flows will not necessarily agree with changes in the corresponding balances on the consolidated balance sheets.
Segment Reporting
ASC Topic 280, “Segment Reporting,” requires use of the “management approach” model for segment reporting. The management approach model is based on the way a company’s management organizes segments within the company for making operating decisions and assessing performance. The Company determined it has four reportable segments (See Note 10).
Fair Value of Financial Instruments
For certain of the Company’s financial instruments, including cash and cash equivalents, accounts receivable, accounts payable, accrued liabilities and short-term debt, the carrying amounts approximate their fair values due to their short maturities. In addition, the Company has long-term debt with financial institutions. The carrying amounts of the line of credit and other long-term liabilities approximate their fair values based on current rates of interest for instruments with similar characteristics. Derivative financial instruments are recorded at fair value based on quoted market prices.
12
NOTES TO CONSOLIDATED FINANCIAL STATEMENTS
FOR THE SIX MONTHS ENDED JUNE 30, 2011 AND 2010
(unaudited)
Fair Value Measurements
ASC Topic 820, “Fair Value Measurements and Disclosures,” requires disclosure of the fair value of financial instruments held by the Company. ASC Topic 825, “Financial Instruments,” defines fair value, and establishes a three-level valuation hierarchy for disclosures of fair value measurement that enhances disclosure requirements for fair value measures. The three levels of valuation hierarchy are defined as follows:
|
|
·
|
Level 1 inputs to the valuation methodology are quoted prices for identical assets or liabilities in active markets.
|
|
|
·
|
Level 2 inputs to the valuation methodology include quoted prices for similar assets and liabilities in active markets, and inputs that are observable for the asset or liability, either directly or indirectly, for substantially the full term of the financial instrument.
|
|
|
·
|
Level 3 inputs to the valuation methodology are unobservable and significant to the fair value measurement.
|
At June 30, 2011 and December 31, 2010, the Company’s derivative instruments were reported at fair value using Level 1 and Level 2 inputs, as follows:
|
|
·
|
derivative liability of $896,000 and $980,000 at June 30, 2011 and December 31, 2010, respectively, consisting of exchange traded commodity futures contracts valued using Level 1 inputs. The fair value measurements are determined by quoted market prices from the Chicago Board of Trade (CBOT).
|
|
|
·
|
derivative asset of $0 and $1,094,000 at June 30, 2011 and December 31, 2010, respectively, consisting of fixed price forward purchase contracts valued using Level 2 inputs. The fair value measurements are based on observable data for similar assets as well as quoted market prices from the CBOT.
|
At December 31, 2010, the Company had approximately $19.6 million of goodwill which was measured at fair value on a non-recurring basis, and was valued using Level 3 inputs.
Reclassifications
Certain amounts in the prior year financial statements have been reclassified to conform to the current year presentation. These reclassifications had no effect on the previously reported net income or stockholders’ equity.
Short term loan at June 30, 2011 and December 31, 2010 is as follows:
|
June 30,
|
December 31,
|
|||||||
|
2011
|
2010
|
|||||||
|
Short-term bank loan payable to Shanghai Pudong Development Bank. The loan accrues interest at 5.84%. The note was renewed in May 2010 and is due May 4, 2011 (The loan was paid off in full in May 2011). The loan is collateralized by buildings and land use rights.
|
$ | - | $ | 4,551,000 | ||||
13
AGFEED INDUSTRIES, INC. AND SUBSIDIARIES
NOTES TO CONSOLIDATED FINANCIAL STATEMENTS
FOR THE SIX MONTHS ENDED JUNE 30, 2011 AND 2010
(unaudited)
Note 4 – Acquisition Note Payable
In connection with the acquisition of M2P2, the Company issued a promissory note payable in the amount of $9,621,434. The note bears interest at a rate of 8.0% per year, with interest payable quarterly in cash on March 31, June 30, September 30 and December 31 of each year, beginning on December 31, 2010. The Company will make interest only payments until June 30, 2012 and thereafter it will make amortizing principal and interest payments with the last payment due on September 30, 2020. The Company granted AF Sellco, LLC a perfected first-priority lien on, and security interest in, all of the outstanding equity interests of M2P2 as collateral security for the Company’s obligations on the promissory notes.
Note 5 – Line of Credit
The Company’s wholly-owned subsidiary, M2P2 has a $65 million senior revolving loan facility that expires on June 1, 2012. The first $25 million borrowed under the facility bears interest at 3.95%; and the remaining amount borrowed under the facility bears interest at the 1-month LIBOR plus 3.00% (3.25% at June 30, 2011). This facility is collateralized by substantially all of the assets of M2P2 and has various restrictive covenants, including, but not limited to, certain restrictions on distributions, maintenance of a minimum net worth and other financial covenant requirements.
Note 6 – Long-Term Debt
Long- term loans at June 30, 2011 and December 31, 2010 are as follows:
|
2011
|
2010
|
|||||||
|
Note payable, bearing interest at the prime rate plus 2% (5.25% at June 30, 2011) and payable on November 25, 2018. The note is secured by the M2P2’s 100% interest in Heritage Farms LLC and is subordinated to certain senior debt.
|
$ | 3,500,000 | $ | 3,500,000 | ||||
|
Senior term loan - $6 million; bears interest at 5.0%; quarterly installments of $250,000 plus interest with remaining balance is due April 1, 2013. (A)
|
5,000,000 | 5,750,000 | ||||||
|
Senior term loan - $7.6 million; $5.8 million of the loan bears interest at 5.0% and the $1.4 million remaining balance bears interest at the 3-month LIBOR plus 1.75% (2.05% at June 30, 2011); payments are due in monthly installments of approximately $85,000. The remaining balance is due March 1, 2020. (A)
|
7,070,645 | 7,478,324 | ||||||
| 15,570,645 | 16,728,324 | |||||||
|
Less current portion
|
(1,718,108 | ) | (1,703,658 | ) | ||||
| $ | 13,852,537 | $ | 15,024,666 | |||||
14
AGFEED INDUSTRIES, INC. AND SUBSIDIARIES
NOTES TO CONSOLIDATED FINANCIAL STATEMENTS
FOR THE SIX MONTHS ENDED JUNE 30, 2011 AND 2010
(unaudited)
|
|
(A)
|
These borrowings are collateralized by substantially all of the assets of M2P2 and have various restrictive covenants, including, but not limited to, certain restrictions on distributions, maintenance of a minimum net worth and other financial covenant requirements.
|
Note 7 – Stockholders’ Equity
Common Stock
The Company has granted a total of 2,025,000 shares of restricted stock to certain officers, directors and key employees. The restricted stock awards have vesting schedules ranging from 1 to 3 years. The value of the awards granted was calculated using the fair market value of the Company’s stock price at the date of grant. This amount is being expensed over the vesting period as the restrictions lapse. The expense recognized during the three and six months ended June 30, 2011 and 2010 was $433,795 and $770,986, and $375,720 and $751,440, respectively. At June 30, 2011 there is $3,575,745 of compensation expense that will be amortized over the remaining vesting periods.
Equity Credit Agreement
On September 9, 2009, the Company entered into an Equity Credit Agreement with Southridge Partners II, LP (“Southridge”), amended and restated as of November 9, 2009, providing for, among other things, the issuance of shares of its common stock at any time and from time to time during the next two years for gross proceeds of up to $50,000,000. In connection with the closing of the transaction, the Company also issued Southridge a warrant to purchase an additional 400,000 shares of its common stock during a five-year period at an exercise price of $5.75 per share. The fair value of the warrant was charged to additional paid in capital as it was issued in connection with an equity instrument. During the year ended December 31, 2010, the Company issued 150,000 shares of its common stock to Southridge for the surrender of the existing warrant to purchase 400,000 shares of the Company’s common stock. The warrant was subsequently canceled by the Company. During the six months ended June 30, 2011, the Company issued 10,846,850 shares of its common stock for $16,592,625 in connection with this Equity Credit Agreement.
As stipulated by the Company Law of the PRC, net income after taxation can only be distributed as dividends after appropriation has been made for the following:
|
|
i.
|
Making up cumulative prior years’ losses, if any;
|
|
|
ii.
|
Allocations to the “Statutory surplus reserve” of at least 10% of income after tax, as determined under PRC accounting rules and regulations, until the fund amounts to 50% of the Company’s registered capital;
|
|
|
iii.
|
Allocations of 5-10% of income after tax, as determined under PRC accounting rules and regulations, to the Company’s “Statutory common welfare fund”, which is established for the purpose of providing employee facilities and other collective benefits to the Company’s employees; and
|
|
|
iv.
|
Allocations to the discretionary surplus reserve, if approved in the stockholders’ general meeting.
|
Pursuant to the new Corporate Law effective on January 1, 2006, there is now only one "Statutory surplus reserve" requirement. The reserve is 10 percent of income after tax, not to exceed 50 percent of registered capital.
The Company appropriated $936,822, $1,449,061 and $2,483,829 as reserve for the statutory surplus reserve and welfare fund for the years ended December 31, 2010, 2009 and 2008, respectively.
15
AGFEED INDUSTRIES, INC. AND SUBSIDIARIES
NOTES TO CONSOLIDATED FINANCIAL STATEMENTS
FOR THE SIX MONTHS ENDED JUNE 30, 2011 AND 2010
(unaudited)
Stock Options
Following is a summary of stock option activity:
|
Options
outstanding
|
Weighted
Average
Exercise
Price
|
Weighted
average
remaining
contractual life
|
Aggregate
Intrinsic Value
|
|||||||||||||
|
Outstanding, December 31, 2010
|
185,000 | $ | 8.96 | 2.71 | $ | - | ||||||||||
|
Granted
|
- | - | ||||||||||||||
|
Forfeited
|
- | - | ||||||||||||||
|
Exercised
|
- | - | ||||||||||||||
|
Outstanding, June 30, 2011
|
185,000 | $ | 8.96 | 2.20 | $ | - | ||||||||||
|
Exercisable, June 30, 2011
|
175,000 | $ | 8.94 | 2.20 | $ | - | ||||||||||
|
Number of
Options
|
Exercise
Price
|
||||
|
10,000
|
$ | 3.30 | |||
|
15,000
|
$ | 8.85 | |||
|
160,000
|
$ | 9.32 | |||
|
185,000
|
|||||
Warrants
Following is a summary of the warrant activity:
|
Warrants
outstanding
|
Weighted
Average
Exercise
Price
|
Weighted
average
remaining
contractual life
|
Aggregate
Intrinsic Value
|
|||||||||||||
|
Outstanding, December 31, 2010
|
2,204,435 | $ | 4.03 | 2.42 | $ | 253,000 | ||||||||||
|
Granted
|
- | - | ||||||||||||||
|
Forfeited/canceled
|
(220,000 | ) | $ | 5.00 | ||||||||||||
|
Exercised
|
- | - | ||||||||||||||
|
Outstanding, June 30, 2011
|
1,984,435 | $ | 3.92 | 2.18 | $ | - | ||||||||||
|
Exercisable, June 30, 2011
|
1,984,435 | $ | 3.92 | 2.18 | $ | - | ||||||||||
16
AGFEED INDUSTRIES, INC. AND SUBSIDIARIES
NOTES TO CONSOLIDATED FINANCIAL STATEMENTS
FOR THE SIX MONTHS ENDED JUNE 30, 2011 AND 2010
(unaudited)
The exercise price for warrants outstanding at June 30, 2011 is as follows:
|
Number of
Warrants
|
Exercise
Price
|
||||
|
575,000
|
$ | 2.50 | |||
|
1,409,435
|
$ | 4.50 | |||
|
1,984,435
|
|||||
Note 10 – Segment Information
The Company’s predominant businesses are the research and development, manufacture, marketing, distribution, and sale of pre-mix, concentrates and complete feeds and feed additives primarily for use in China’s domestic pork husbandry market and the raising, breeding, and selling of pigs. The Company operates in four segments: (1) animal feed nutrition, (2) hog production – United States, (3) hog production – China and (4) western style hog farms in China. Certain of the reportable segments include geographic units which are aggregated due to having substantially similar products, production processes, distribution systems, and economic characteristics. The Company does not allocate the holding company income and expenses to the other four segments, but rather presents them as part of the segment disclosures so that all the captions reconcile to the financial statements. The Company added the US hog production (as a result of the acquisition of M2P2) and western style hog farms segments in 2010.
The following tables summarize segment information (continuing operations) for the three and six months ended June 30, 2011 and 2010:
|
Three Months Ended June 30,
|
Six Months Ended June 30,
|
|||||||||||||||
|
2011
|
2010
|
2011
|
2010
|
|||||||||||||
|
Revenues from unrelated entities
|
||||||||||||||||
|
Animal feed nutrition
|
$ | 16,741,242 | $ | 26,369,201 | $ | 40,949,913 | $ | 50,658,950 | ||||||||
|
Hog production - United States
|
54,842,557 | - | 112,726,981 | - | ||||||||||||
|
Hog production - China
|
13,814,173 | 7,391,175 | 24,708,277 | 29,591,282 | ||||||||||||
|
Western style hog farms
|
- | - | - | - | ||||||||||||
|
Holding Company
|
- | - | - | - | ||||||||||||
| $ | 85,397,972 | $ | 33,760,376 | $ | 178,385,171 | $ | 80,250,232 | |||||||||
|
Intersegment revenues
|
||||||||||||||||
|
Animal feed nutrition
|
$ | 3,527,492 | $ | 1,721,014 | $ | 7,550,791 | $ | 5,490,936 | ||||||||
|
Hog production - United States
|
- | - | - | - | ||||||||||||
|
Hog production - China
|
665,116 | 1,267,008 | 1,222,267 | 1,784,139 | ||||||||||||
|
Western style hog farms
|
- | - | - | - | ||||||||||||
|
Holding Company
|
- | - | - | - | ||||||||||||
| $ | 4,192,608 | $ | 2,988,022 | $ | 8,773,058 | $ | 7,275,075 | |||||||||
17
AGFEED INDUSTRIES, INC. AND SUBSIDIARIES
NOTES TO CONSOLIDATED FINANCIAL STATEMENTS
FOR THE SIX MONTHS ENDED JUNE 30, 2011 AND 2010
(unaudited)
|
Total revenues
|
||||||||||||||||
|
Animal feed nutrition
|
$ | 20,268,734 | $ | 28,090,215 | $ | 48,500,704 | $ | 56,149,886 | ||||||||
|
Hog production - United States
|
54,842,557 | - | 112,726,981 | - | ||||||||||||
|
Hog production - China
|
14,479,289 | 8,658,183 | 25,930,544 | 31,375,421 | ||||||||||||
|
Western style hog farms
|
- | - | - | - | ||||||||||||
|
Holding Company
|
- | - | - | - | ||||||||||||
|
Less Intersegment revenues
|
(4,192,608 | ) | (2,988,022 | ) | (8,773,058 | ) | (7,275,075 | ) | ||||||||
| $ | 85,397,972 | $ | 33,760,376 | $ | 178,385,171 | $ | 80,250,232 | |||||||||
|
Gross profit
|
||||||||||||||||
|
Animal feed nutrition
|
$ | 2,126,593 | $ | 4,768,663 | $ | 4,552,636 | $ | 9,232,737 | ||||||||
|
Hog production - United States
|
3,417,038 | - | 7,801,606 | - | ||||||||||||
|
Hog production - China
|
2,542,785 | (1,232,281 | ) | 3,612,276 | 175,682 | |||||||||||
|
Western style hog farms
|
- | - | - | - | ||||||||||||
|
Holding Company
|
- | - | - | - | ||||||||||||
| $ | 8,086,416 | $ | 3,536,382 | $ | 15,966,518 | $ | 9,408,419 | |||||||||
|
Income (loss) from operations
|
||||||||||||||||
|
Animal feed nutrition
|
$ | (14,227,226 | ) | $ | 2,962,810 | $ | (15,062,722 | ) | $ | 5,630,163 | ||||||
|
Hog production - United States
|
2,530,419 | - | 6,175,862 | - | ||||||||||||
|
Hog production - China
|
1,309,764 | (2,755,218 | ) | 1,170,518 | (2,525,857 | ) | ||||||||||
|
Western style hog farms
|
(770,045 | ) | (314,699 | ) | (1,068,439 | ) | (531,822 | ) | ||||||||
|
Holding Company
|
(2,295,255 | ) | (974,412 | ) | (4,149,554 | ) | (2,243,301 | ) | ||||||||
| $ | (13,452,343 | ) | $ | (1,081,519 | ) | $ | (12,934,335 | ) | $ | 329,183 | ||||||
|
Interest income
|
||||||||||||||||
|
Animal feed nutrition
|
$ | 1,602 | $ | 22,738 | $ | 4,601 | $ | 56,181 | ||||||||
|
Hog production - United States
|
- | - | - | - | ||||||||||||
|
Hog production - China
|
5,439 | 8,187 | 16,442 | 14,099 | ||||||||||||
|
Western style hog farms
|
- | 1,382 | - | 1,382 | ||||||||||||
|
Holding Company
|
630 | 4,644 | 1,350 | 12,622 | ||||||||||||
| $ | 7,671 | $ | 36,951 | $ | 22,393 | $ | 84,284 | |||||||||
|
Interest and financing costs
|
||||||||||||||||
|
Animal feed nutrition
|
$ | 25,536 | $ | 97,079 | $ | 96,240 | $ | 179,611 | ||||||||
|
Hog production - United States
|
760,292 | - | 1,384,970 | - | ||||||||||||
|
Hog production - China
|
17,580 | - | 17,580 | - | ||||||||||||
|
Western style hog farms
|
- | - | - | - | ||||||||||||
|
Holding Company
|
192,429 | 42,851 | 412,006 | 85,230 | ||||||||||||
| $ | 995,837 | $ | 139,930 | $ | 1,910,796 | $ | 264,841 |
18
AGFEED INDUSTRIES, INC. AND SUBSIDIARIES
NOTES TO CONSOLIDATED FINANCIAL STATEMENTS
FOR THE SIX MONTHS ENDED JUNE 30, 2011 AND 2010
(unaudited)
|
Income tax expense (benefit)
|
||||||||||||||||
|
Animal feed nutrition
|
$ | 82,523 | $ | 641,139 | $ | 217,377 | $ | 1,094,719 | ||||||||
|
Hog production - United States
|
- | - | - | - | ||||||||||||
|
Hog production - China
|
- | - | - | - | ||||||||||||
|
Western style hog farms
|
- | - | - | - | ||||||||||||
|
Holding Company
|
(386,767 | ) | - | 17,118 | - | |||||||||||
| $ | (304,244 | ) | $ | 641,139 | $ | 234,495 | $ | 1,094,719 | ||||||||
|
Net income (loss)
|
||||||||||||||||
|
Animal feed nutrition
|
$ | (14,375,746 | ) | $ | 2,264,097 | $ | (15,404,509 | ) | $ | 4,437,740 | ||||||
|
Hog production - United States
|
1,770,127 | - | 4,790,892 | - | ||||||||||||
|
Hog production - China
|
1,350,080 | (2,592,928 | ) | 1,261,605 | (2,275,618 | ) | ||||||||||
|
Western style hog farms
|
(770,045 | ) | (231,137 | ) | (1,061,239 | ) | (394,101 | ) | ||||||||
|
Holding Company
|
(2,105,204 | ) | (1,012,619 | ) | (4,587,316 | ) | (2,315,909 | ) | ||||||||
|
Discontinued operations
|
(1,744,242 | ) | (1,382,165 | ) | (2,425,287 | ) | (1,339,446 | ) | ||||||||
| $ | (15,875,030 | ) | $ | (2,954,752 | ) | $ | (17,425,854 | ) | $ | (1,887,334 | ) | |||||
|
Provision for depreciation
|
||||||||||||||||
|
Animal feed nutrition
|
$ | 215,394 | $ | 112,394 | $ | 457,125 | $ | 219,436 | ||||||||
|
Hog production - United States
|
435,968 | - | 927,317 | - | ||||||||||||
|
Hog production - China
|
594,073 | 651,640 | 1,359,555 | 1,356,497 | ||||||||||||
| $ | 1,245,435 | $ | 764,034 | $ | 2,743,997 | $ | 1,575,933 | |||||||||
|
As of
|
As of
|
|||||||||||||||
|
June 30,
|
December 31,
|
|||||||||||||||
| 2011 | 2010 | |||||||||||||||
|
Total assets
|
||||||||||||||||
|
Animal feed nutrition
|
$ | 26,315,368 | $ | 42,783,939 | ||||||||||||
|
Hog production - United States
|
108,565,414 | 94,369,142 | ||||||||||||||
|
Hog production - China
|
63,295,409 | 58,918,591 | ||||||||||||||
|
Western style hog farms
|
22,676,520 | 15,162,473 | ||||||||||||||
|
Holding Company
|
4,082,119 | 5,966,993 | ||||||||||||||
|
Discontinued operations
|
- | 6,293,524 | ||||||||||||||
| $ | 224,934,830 | $ | 223,494,662 | |||||||||||||
|
Goodwill
|
||||||||||||||||
|
Animal feed nutrition
|
$ | 2,485,332 | $ | 2,437,135 | ||||||||||||
|
Hog production - United States
|
326,000 | 326,000 | ||||||||||||||
|
Hog production - China
|
19,989,930 | 19,602,279 | ||||||||||||||
|
Western style hog farms
|
- | - | ||||||||||||||
|
Holding Company
|
- | - | ||||||||||||||
| $ | 22,801,262 | $ | 22,365,414 | |||||||||||||
|
Long-term asset by geographic region
|
||||||||||||||||
|
United States
|
$ | 33,163,638 | $ | 29,581,577 | ||||||||||||
|
China
|
76,443,092 | 67,995,469 | ||||||||||||||
| $ | 109,606,730 | $ | 97,577,046 | |||||||||||||
Note 11 – Commitments
At June 30, 2011, the Company had commitments to expend approximately $2,129,000 for construction in process and growing breeder hogs.
19
AGFEED INDUSTRIES, INC. AND SUBSIDIARIES
NOTES TO CONSOLIDATED FINANCIAL STATEMENTS
FOR THE SIX MONTHS ENDED JUNE 30, 2011 AND 2010
(unaudited)
Note 12 – Discontinued Operations
During the six months ended June 30, 2011, the Company made the decision to dispose of all eight of our commercial hog farms in Jiangxi Province. All eight farms were included in our hog production – China segment. The closure of these farms is being accounted for as a discontinued operation. Operating results for hog farms in the Jiangxi Province have been presented in the accompanying consolidated statements of operations as discontinued operations for the six months ended June 30, 2011 and 2010. In addition, the assets and liabilities related to hog farms have been presented in the accompanying consolidated balance sheets as “Assets of discontinued operations” and “Liabilities of discontinued operations” at June 30, 2011 and December 31, 2010. Currently, the Company has executed settlement agreements for seven of the eight hog farms.
The operating results for the eight hog farms have been presented in the accompanying consolidated statement of operations for the three and six months ended June 30, 2011 and 2010 as discontinued operations and are summarized below:
|
Three Months Ended June 30,
|
Six Months Ended June 30,
|
|||||||||||||||
|
2011
|
2010
|
2011
|
2010
|
|||||||||||||
|
Revenues
|
$ | 660,619 | $ | 3,901,579 | $ | 2,791,028 | $ | 10,270,790 | ||||||||
|
Cost of goods sold
|
2,621,784 | 4,878,683 | 4,576,498 | 10,800,649 | ||||||||||||
|
Gross profit
|
(1,961,165 | ) | (977,104 | ) | (1,785,470 | ) | (529,859 | ) | ||||||||
|
Operating expenses
|
257,884 | 307,966 | 887,003 | 640,756 | ||||||||||||
|
Loss from operations
|
(2,219,049 | ) | (1,285,070 | ) | (2,672,473 | ) | (1,170,615 | ) | ||||||||
|
Non-operating income (expense)
|
474,807 | (97,095 | ) | 247,186 | (168,831 | ) | ||||||||||
|
Loss before taxes
|
(1,744,242 | ) | (1,382,165 | ) | (2,425,287 | ) | (1,339,446 | ) | ||||||||
|
Income tax expense
|
- | - | - | - | ||||||||||||
|
Net loss
|
$ | (1,744,242 | ) | $ | (1,382,165 | ) | $ | (2,425,287 | ) | $ | (1,339,446 | ) | ||||
The assets and liabilities of the discontinued operations at June 30, 2011 and December 31, 2010 are summarized below:
|
June 30,
|
December 31,
|
|||||||
|
2011
|
2010
|
|||||||
|
Current assets
|
$ | - | $ | 3,271,226 | ||||
|
Long-term assets
|
- | 3,022,298 | ||||||
| $ | - | $ | 6,293,524 | |||||
|
Current liabilities
|
$ | 97,446 | $ | 1,595,805 | ||||
In July 2011, the Company entered into separate non-binding letters of intent to acquire Pine Ridge Farms, LLC and Kansas City Sausage Company, LLC.
On July 29, 2011, the Company entered into an Exchange Agreement with certain warrants holders whereby the Company issued an aggregate of 429,101 shares of its common stock in exchange for the warrant holders surrendering an aggregate of 776,548 warrant that were currently outstanding.
20
CAUTIONARY STATEMENT FOR FORWARD-LOOKING STATEMENTS
This Quarterly Report on Form 10-Q includes forward-looking statements within the meaning of Section 27A of the Securities Act of 1933, as amended (the “Securities Act”), and Section 21E of the Securities Exchange Act of 1934, as amended (the “Exchange Act”). We have based these forward-looking statements on our current expectations and projections about future events, and they are applicable on as of the dates of such statement. These forward-looking statements are subject to known and unknown risks, uncertainties and assumptions about us that may cause our actual results, levels of activity, performance or achievements to be materially different from any future results, levels of activity, performance or achievements expressed or implied by such forward-looking statements. In some cases, you can identify forward-looking statements by terminology such as “may,” “will,” “should,” “could,” “would,” “expect,” “plan,” anticipate,” believe,” estimate,” continue,” or the negative of such terms or other similar expressions. Factors that might cause or contribute to such a discrepancy include, but are not limited to, those listed under the heading “Risk Factors” and those listed in our other SEC filings. You should not put undue reliance on any forward-looking statements. These statements speak only as of the date of this Quarterly Report on Form 10-Q, even if subsequently made available on our website or otherwise, and we undertake no obligation to update or revise these statements to reflect events or circumstances occurring after the date of this Quarterly Report on Form 10-Q. The following discussion should be read in conjunction with our Financial Statements and related Notes thereto included elsewhere in this report. Throughout this Quarterly Report on Form 10-Q we will refer to AgFeed Industries, Inc., together with its subsidiaries, as “AgFeed,” the “Company,” “we,” “us,” and “our.”
|
Item 2.
|
Management’s Discussion and Analysis of Financial Condition and Results of Operations
|
Overview:
Please note we have included our discussion of Critical Accounting Policies at the end of this Item 2 section.
We are engaged in the animal nutrition premix, concentrate and complete feeds business and commercial hog production business in the United States and China through our operating subsidiaries. You should read the below information in conjunction with the consolidated financial statements and related notes contained elsewhere in this filing.
Executive Overview of our Current and Discontinued Operations
Animal Feed Nutrition:
Our animal nutrition business (animal feed nutrition operating segment) consists of the manufacture, marketing and sale of premix, concentrate and complete feed for use in the Chinese animal husbandry markets, almost exclusively for hog production. Premix is an animal feed additive that is used in commercial animal production worldwide. We have been in the premix feed business since 1995 and now operate five premix, concentrate and complete feed manufacturing facilities located in the provinces of Jiangxi, Shandong, Guangxi, and Hainan and the municipality of Shanghai. Additionally, we have a network of exclusive and non-exclusive distributors of our animal nutrition products throughout the regions that we serve.
|
|
·
|
We believe there is a growing demand by commercial hog producers for concentrates and complete feeds as they modernize their production technology, react to increasing commodity cost and focus on the requirements of the food safety laws.
|
|
|
·
|
The primary ingredient in concentrates is soybean meal. By adding corn to a concentrate mix, we produce complete feeds. For the most part, soybean meal is an imported product in China, while corn is primarily domestically produced in China but with increasing reliance on external sources to meet increasing demands. Accordingly, our operations are impacted by market-driven events such as costs for soybean meal and corn as well as our ability to pass along increased costs to our customers.
|
21
|
|
·
|
The feed market in China is competitive, and product pricing is a principal determining factor in the purchase of feed by hog producers.
|
|
|
·
|
Continued operating pressures, such as contending with high ingredient and increasing labor costs, has placed significant financial pressure on hog producers leading to deteriorating credit quality. As a result, we incurred a non-cash charge of $14.3 million to our earnings in the quarter ended June 30, 2011. This non-cash charge equates to a $9.2 million expense related to the collection of outstanding accounts receivable and an increase of $5.1 million to our bad debt provision. These charges correspondingly reduced our accounts receivable balance $14.3 million. Our accounts receivable is $13.2 million at June 30, 2011. This balance is $15.4 million less than the balance at March 31, 2011 and $8.6 million less than the balance at December 31, 2010.
|
|
|
·
|
Further, with these actions and the general market conditions, our customer base has declined 12% in 2011 in response to our collection actions, exited hog production operations or sought out lower priced feed from other sources. In response:
|
|
|
o
|
In July 2011, management approved the creation of a feed ingredient-trading department in Nanning, Guangxi Province within the China-Asian Trade Area offering us tariff exemption. The initial investment will be approximately $300,000, and allow this new department to secure an initial line of credit of $150,000 to purchase feed ingredients, expand AgFeed’s purchasing channels and purchase volume to lower raw material costs for our manufacturing operations in Guangxi and Hainan provinces.
|
|
|
o
|
Develop and introduce formulations using alternative ingredients such as dried distillers grains.
|
|
|
o
|
Enhance technical service support to our customers.
|
|
|
·
|
Presently, approximately 15% - 20% of our feed production is dedicated to our affiliated hog production-operating segment and the Western style farms, designed to support our Western style farms. we are operating and constructing in China. We believe that we can more efficiently serve these facilities through a dedicated operation. As a result, and in conjunction with present market conditions, we have withdrawn our Registration Statement on Form F-1 filed with the SEC related to the carve-out of this business unit as a separate public entity. Finally, we no longer consider our animal feed nutrition operating segment a core asset: and we will consider a range of strategic alternatives.
|
Hog Production—China:
We entered the hog breeding and production business in China (Hog production—China operating segment, which we refer to as our Legacy farms) in November 2007. In this business, we mainly produce hogs for processing and sale as breeding stock to third parties. With the closure of our commercial hog producing operations in Jiangxi Province (discontinued operations discussed separately), we now only have a multiplier farm in Jiangxi. We continue to operate the farms in the provinces of Hainan, Guangxi and Fujian and the municipality of Shanghai.
|
|
·
|
We are subject to market related risks of supply and demand events that impact both our revenues and our costs of production. Presently, market prices for hogs are at historical highs, while the cost of feed is similarly at historically high levels. Given each are generally moving in concert, we focus on our margins from period to period as compared to focusing on either revenues or costs.
|
|
|
·
|
With closure of the poorest performing farms and our focus on the remaining farms, we are progressing in our efforts to transition our operations to becoming a low-cost producer with consistent production flows of market hogs. Our operations are now receiving direct benefit from U.S. management oversight and implementation of processes and metrics under which our US hog production has operated.
|
|
|
·
|
Primarily benefitting from strong hog prices, which have expanded our gross margin, our current quarter operating income exceeded $1.3 million compared to an operating loss of $139,000 in the quarter ended March 31, 2011.
|
|
|
·
|
With respect to the farms designated for closure within our remaining operating segments, reaching settlements regarding our remaining lease obligations have concluded, except for one farm, which is at a point of impasse as both parties review their respective position with respect to the outstanding lease obligations.
|
22
|
|
·
|
Due to unsuccessful lease renewal negotiations at a farm in Guangxi Province, we took a charge to earnings of $793,000 during the quarter to write-off long-term assets at that facility. We moved our breeding herd to one of the Guangxi farms we previously impaired and designated for closure, which resulted in a charge to earnings of $757,000 in 2010. In making this "swap," we re-established use of comparable assets previously written off and secured more favorable lease terms. However, since U.S. GAAP does not allow reinstatement of previously impaired assets, we are not able to offset the current charge to earnings by reversing the prior charge.
|
|
|
·
|
Longer-term, our focus on production costs will not eliminate fluctuations in operating income or loss from quarter to quarter but are intended to reduce some of the risks and volatility associated with commodity-based inputs and outputs.
|
|
|
·
|
Pork is a key component of China’s Consumer Price Index (“CPI”) causing the Central Government to focus directly on pork prices. To this end, certain actions are taken periodically including the release of frozen pork from their reserves (though immaterial from a consumption point of view) and various incentives and programs from time-to-time to influence the size of the sow-breeding base in China.
|
Discontinued Operations—Hog Production—China:
Our discontinued operations reflect the results related to the closure process being undertaken at our commercial hog farms operating in Jiangxi Province. This process includes the depopulation of our breeding herds and negotiating settlements with our lessors for orderly departure and conclusion of any obligations. Accordingly,
|
|
·
|
The results of operations reflect costs of closing down these operations.
|
|
|
·
|
To date, for the farms identified for closure, we have either depopulated the farms or transferred operations through negotiated settlements. Of the depopulated farms, we have one remaining where final closure negotiations have reached an impasse. At this time, we are assessing the merits of claims and counterclaims that have been asserted in the course of our negotiations.
|
Western Style Hog Farms:
We entered into agreements for the construction of Western style hog farms in Dahua, Guangxi Province in China in the fall of 2009. We are now completing the construction and stocking of this farm with 5,000 female hogs (gilts) that will become our breeding herd and begin producing offspring in the third quarter. We expect the offspring to reach market weights in the first quarter of 2012. Until the market hogs are brought to market, we do not anticipate that this operating segment have any revenues, only operating expenses. We will continue to capitalize costs related to the remaining construction as well as establishing our gilts as breeding sows. Along with construction of the sow farm, we have also constructed separate-site and internally dedicated housing for our breeding boars, which is also stocked with boars and operating, and nursery/finisher barns to receive the transfer of animals from our sow farm for further growth.
The flow of market hogs are initially anticipated to be sold into the open market until such time that we achieve production scale to direct this flow into an owned harvest/processing facility.
Our expansion and growth plans include developing a multi-site property in Xinyu, Jiangxi Province in China where construction has begun on a sow farm, boar housing and multiplier farm. Completion of the first site is anticipated in the spring of 2012, with market hog production coming online approximately one year later.
With the acquisition of M2P2 LLC (“M2P2”), the original joint venture company, Agfeed International Protein Technology Corp., is now slated for dissolution.
23
Hog Production—United States:
We entered the hog breeding and production business in the United States (Hog production—United States operating segment) in September 2010 with the acquisition of M2P2. The purchase of M2P2 allowed the Company to establish hog farm operations in the United States and obtain a breadth and depth of human capital that we expect to be instrumental in the development of our Western style hog farms in China as well as our future harvest strategy. Furthermore, we believe that M2P2 provides the Company with a platform from which growth opportunities in the U.S. can be pursued. M2P2 operates hog farms and facilities in Colorado, Oklahoma, North Carolina and Iowa. Given the acquisition date, we do not have quarterly comparative information reflected in our results. As you review results of this segment, please consider:
|
|
·
|
One major customer accounts for substantially all of the revenues.
|
|
|
·
|
Our operations are conducted under what can be generally characterized as a cost plus agreement, which allows us to focus on what we do best—manage production risk with the customer assuming what we term market risk (fluctuations in the price for a market hog). By removing the market risk, this agreement substantially removes the market-price risks and rewards from our earnings. For us, this means maximizing production output and managing costs are the primary drivers of our profitability, which additionally has a leveling effect during the course of a calendar year causing us generally to experience higher earnings in the first half of a calendar period than the latter.
|
|
|
·
|
M2P2 is a recognized U.S. leader in hog production metrics. Not only do we benefit from these disciplines in our U.S. production, but also their personnel have managed and overseen the development of our Western style farms in China. Additionally, from the first quarter of 2011, we have initiated a process to leverage their management and production skills in our Hog Production—China operations.
|
|
|
·
|
Debt financing is a key component in conducting operations. Working capital is funded by a line of credit, which fluctuates based on operational needs and is subject to loan covenants. As a result, interest expense from period-to-period will also fluctuate.
|
As previously stated and as we discuss our strategic direction in the next section, our acquisition of M2P2 provides us the platform from which to execute this strategy.
Strategic Direction:
Initially established as a Chinese operating company in the mid-1990s, today AgFeed is at the point of completing its transition from a company whose sole focus was China to one which has the majority of its operations in the United States and views its business operations and opportunities on a global basis.
Our strategic direction reflects the vision that we began to pursue during the spring of 2010 and was signaled by our announcing the intent to establish a harvest strategy in April 2010 and by our acquisition of M2P2 in September of 2010. That vision is to align global production resources to provide a reliable supply of safe pork and pork products. In July 2011 we entered into separate non-binding letters of intent to acquire two U.S.-based slaughter and processing facilities, Pine Ridge Farms, LLC (“PRF”) and Kansas City Sausage Company, LLC (“KCS”), representing a significant step to anchoring our harvest strategy and becoming the precursor to executing a global markets initiative.
Our Western style hog farms will produce domestically available live hogs for the China market. As production flows of these live hogs builds to necessary scale to support an owned harvest/processing facility in China, we may consider a decision on at that time. Until such time, it is anticipated that our animal production flows will continue to be sold to third-party processors or into the open market.
24
As we execute on our vision, we will seek to maximize profitability and cash flow through operating excellence and maximizing efficiencies by applying our proven skills throughout the pork supply/value chain. We define this chain as commencing with the breeding and growing of animals (Hog Production link) leading to their slaughter and processing (Harvest/Processing link) culminating in the distribution and marketing (Distribution/Marketing link) to our customers (End User link). Should we be successful in the acquisition of PRF and KCS, we will add Harvest/Processing to our existing Hog Production operations and pursue establishing a Distribution/Marketing link to the chain, while simultaneously seeking to expand our domestic customer base and establish export customers for our reliable supply of processed safe pork and pork products.
Our success in achieving our vision will be dependent on our ability to:
|
|
·
|
Secure financing necessary to complete the acquisitions of PRF and KCS and to continue to fund the construction and working capital needs of our Western style hog farms in China.
|
|
|
·
|
Attract, develop and maintain customers seeking comparatively large and steady flows of processed pork and pork products for export or sale into the China and Southeast Asian markets.
|
|
|
·
|
Transfer our proven operating skills as a U.S.-based low cost hog producer to our Western style hog production operations in China with responsible environmental sensitivities.
|
|
|
·
|
The acquisition and retention of talented management teams to integrate processes, procedures and systems as we acquire or establish new operations.
|
Proposed GIPSA Rule:
In June 2010, the United States Department of Agriculture, Grain Inspection, Packers and Stockyards Administration (GIPSA) published a proposed rule adding new regulations under the Packers and Stockyards Act regarding livestock purchasing practices, unfair, deceptive, unjustly discriminatory and deceptive practices or device, undue or unreasonable preferences or advantages; undue or unreasonable prejudice or disadvantages, among other changes and requested comments. The public comment period has closed and GIPSA is considering changes to the proposed rule, if any, based on the comments received. With our non-binding letter of intent to acquire PRF, the rules changes could materially impact our existing relationships with other packers and our related marketing agreements. With the uncertainty regarding changes that may be adopted based on the comments, we cannot presently assess the full economic impact of the proposed regulations on the meat processing industry or on our current operations or strategic direction.
Quarter ended June 30, 2011 Summary:
We incurred a net loss of $15.9 million, or negative $0.26 per diluted share, during the quarter ended June 30, 2011 compared to a loss of $3.1 million, or negative $0.07 per diluted share, for the quarter ended June 30, 2010. The results for each of our reportable segments
|
|
·
|
Animal feed nutrition segment experienced an operating loss of $14.2 million versus a profit of $3.0 million in the comparative period of 2010. The primary drivers were credit and collection losses, reduced sales due to lower sow and hog inventories held by our customers and higher costs of raw materials.
|
|
|
·
|
Hog Production—China segment showed an operating profit of $1.3 million versus a loss of $2.8 million in the quarter ended June 30, 2010 due to substantially higher live hog prices, which offset higher raw material costs and the write-off of the long-term assets at an abandoned farm. The 2010 results also reflected unusual costs due to severe flooding.
|
25
|
|
·
|
Hog Production—United States segment showed an operating profit of $2.5 million. These results are $1.1 million lower than the first quarter of 2011 due to slower growth rates, as a result of warm weather, reducing the number of our marketed hogs as well as leveling measures in our marketing agreement, which favored our first quarter of the calendar year.
|
|
|
·
|
Western style hog farms (China) segment incurred an operating loss of $770,000 primarily reflecting administrative costs associated with our Nanning office and non-capitalizable costs of bringing our Dahua farm online and overseeing construction activities at Xinyu.
|
Outlook:
The commodity markets affecting our business are sometimes volatile and fluctuate on a daily basis. Moreover, our businesses in the U.S. and China compete within an evolving operating environment with regard to regulatory mandates and economic conditions. Considering this environment, it is difficult to make meaningful long-term forecasts of industry trends and conditions. The outlook statements that follow must be viewed in this context.
|
|
·
|
Animal Feed Nutrition—We anticipate rising feed prices going forward primarily in light of China’s ongoing challenges in grain production. Limited arable land, antiquated agricultural infrastructure and recent drought all place significant upward pressure on the price of corn. As a result, corn imports will likely increase significantly over 2010 volume in light of the steady growth of pork consumption by Chinese rural consumers as a result of rising incomes. Due to pork’s status as a staple protein source in urban areas, the urban demand for pork is relatively inelastic. Corn will likely become more important to animal feed as more large hog farms enter the industry. We expect that these farms will be less likely to rely upon non-conventional rice and wheat byproducts as carbohydrate substitutes when compared to smaller farmers.
|
Similarly, the consumption of soy—the protein component of the animal feed ration—will likely rise along with the demand of corn. Currently, China’s consumption of soy, which mostly is utilized for feed meal, is satisfied by imports. We anticipate that future increases will be modest and will continue to be satisfied by imports. The following are trending charts of corn and soybean meal prices internally compiled from the local markets in which we operate.
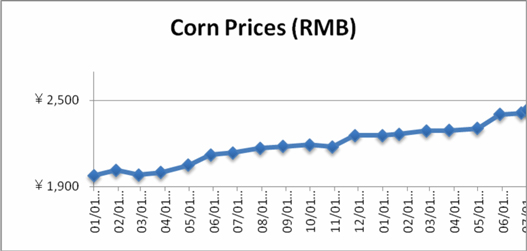
Corn has been steadily rising over the last 18 months increasing approximately 22% over that timeframe.
26
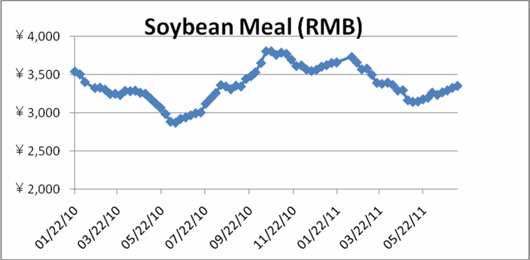
Soybean meal prices are more volatile in relation to corn and influenced more directly by global supply and demand, given China is an importer of this feedstock.
|
|
·
|
Hog Production—China—Despite a record high in pork prices represented by a 57% year-on-year increase in June 2011, we anticipate a market correction following these rising prices. Recent increases in pork prices are primarily attributable to a domestic shortage of hogs and rising feed costs. Price declines will likely be driven by overproduction to service the current strong demand for pork, primarily from small Chinese hog farms (50 hogs or less)—which comprise approximately 60% of Chinese pork production. With pork prices exceeding the prior record set in 2008, rising profits will likely attract additional supply, curbing prices.
|
With regard to the cost of production, feed costs—the single largest cost of hog production—are currently rising. While the price of corn (see chart above), which represents approximately 60% of the animal ration, showed short-term weakness during the second quarter, corn prices have increased approximately 15% since the beginning of the year. This temporary leveling in price is likely attributable to the increasing use of wheat in feed formulation as well as rising U.S. corn shipments. A similar rise and leveling is also being witnessed in the price of soybean meal. Government sales of soy at below-market prices, in order to quell rising food costs, are likely to introduce additional stability in the soy market.
Given the longer-term trends, the Chinese government has urged the expansion of pork production as a measure to control rising inflation, due in significant part to rising food costs. As China’s staple meat, the rising price of pork is expected to attribute 1.6 percentage points to a projected 6.3% CPI inflation in June 2011. Given continued rising food costs despite five prior interest rate increases by the People’s Bank of China, we anticipate government-supported, higher production going forward in lieu of other macroeconomic measures to attempt to control inflation, which would likely abate further price rises.
We believe that differentiating production on the basis of food safety is an immediate and long-term opportunity in the Chinese hog market. Following the enactment of food safety laws, we anticipate that the Chinese government will further implement supervisory and investigatory measures to ensure the reliability of China’s food supply. Accordingly, we expect demand will increase for reliable and safe pork products from verifiable sources. Given the fractured nature of current Chinese production, we believe processors cannot rely upon quality production and governmental enforcement will be on the rise, as indicated by recent intentional food safety violations involving pork tainted with clenbuterol and melamine. As a result of these considerations, enhanced regulation and enforcement of food safety is likely, which should encourage the long-term consolidation of production within the industry.
27
Below is a line graph illustrating the trend of China’s hog prices as a composite amount in the markets we operate.
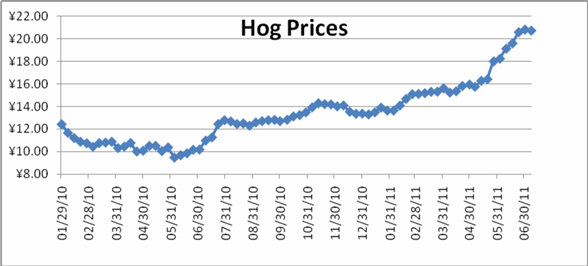
Hog Production—United States—Coupled with domestic food price inflation, we expect hog prices to remain high as a smaller U.S. sow herd was maintained following a historic low during the first quarter of 2010 due primarily to rising feed costs.
Despite supply concerns centering on plantings, drought and flooding, the price of corn—the central component to the complete animal feed ration—experienced an unexpected price decline during July 2011 following government data indicating that farmers planted the second-highest number of acres since 1944. Though a corn bumper harvest is anticipated, we expect producers to remain cautious in expanding herds, doing so in earnest only following assurance that input costs will decline and remain low. Such expansion will likely occur only after confirmation that the government did not underestimate the impact of climate on the 2011 harvest. Additionally, producers are also considering whether Congress will continue to support ethanol subsidies, which place upward demand pressure on the price of corn. Therefore, with regard to a long-term outlook, we believe our operating environment moving into 2012 will be characterized by slightly higher pork supplies compared to high demand.
Consolidated Results of Operations
The tables below compare our results of operations for the three and six months ended June 30, 2011 and June 30, 2010.
In September 2010, AgFeed acquired M2P2 (“Hog Production—United States segment”). As a result there are no comparative results to report for the periods presented for this segment. For presentation purposes the tables provide a separate column for the M2P2 acquisition to readily assist you in understanding the material changes between periods related to this acquisition.
Sales and cost of goods sold:
|
Three Months Ended June 30,
|
Six Months Ended June 30,
|
|||||||||||||||||||||||||||||||
|
2011
|
2010
|
Increase (Decrease) Due To
|
2011
|
2010
|
Increase (Decrease) Due To
|
|||||||||||||||||||||||||||
|
(unaudited)
|
(unaudited)
|
M2P2
Acquisition
|
Year over
Year
|
(unaudited)
|
(unaudited)
|
M2P2
Acquisition
|
Year over
Year
|
|||||||||||||||||||||||||
|
(in thousands)
|
(in thousands)
|
|||||||||||||||||||||||||||||||
|
Revenues
|
$ | 85,398 | $ | 33,760 | $ | 54,843 | $ | (3,205 | ) | $ | 178,385 | $ | 80,250 | $ | 112,727 | $ | (14,592 | ) | ||||||||||||||
|
Cost of goods sold
|
77,312 | 30,224 | 51,426 | (4,338 | ) | 162,419 | 70,842 | 104,925 | (13,349 | ) | ||||||||||||||||||||||
|
Gross profit
|
8,086 | 3,536 | 3,417 | 1,133 | 15,967 | 9,408 | 7,802 | (1,244 | ) | |||||||||||||||||||||||
Three months:
|
|
·
|
Revenue declined $3.2 million reflecting a decline in animal feed volumes due to reduced customer sow breeding herds and hog inventories impacted by continuing health issues offset by an increase in our Legacy hog revenues due to higher market prices for live hogs in combination with the prior year impacts that flooding had on our operations during the 2010 period.
|
28
|
|
·
|
Cost of sales reflects lower total costs due to reduced volumes of feed sold offset by higher raw material costs in our animal nutrition segment, while our Legacy hog operations incurred higher costs of raw materials on a comparative basis offset by our prior period results including unusual costs related to market hogs lost as a result of the 2010 flooding.
|
|
|
·
|
Gross profit for the current period benefited from higher live hog prices, volume induced cost savings related to lower feed shipments and the prior period’s inclusion of unusual costs related to the loss of market pigs due to flooding.
|
|
|
·
|
Gross profit by our operating segments follows:
|
|
Three Months Ended June 30,
|
Six Months Ended June 30,
|
|||||||||||||||||||||||
|
2011
|
2010
|
2011
|
2010
|
|||||||||||||||||||||
|
(unaudited)
|
(unaudited)
|
Increase
(Decrease)
|
(unaudited)
|
(unaudited)
|
Increase
(Decrease)
|
|||||||||||||||||||
|
(in thousands)
|
(in thousands)
|
|||||||||||||||||||||||
|
Animal feed nutrition
|
$ | 2,126 | $ | 4,768 | (2,642 | ) | $ | 4,553 | $ | 9,233 | (4,680 | ) | ||||||||||||
|
Hog production - United States
|
3,417 | - | 3,417 | 7,802 | - | 7,802 | ||||||||||||||||||
|
Hog production - China
|
2,543 | (1,232 | ) | 3,775 | 3,612 | 175 | 3,437 | |||||||||||||||||
|
Total
|
8,086 | 3,536 | 4,550 | 15,967 | 9,408 | 6,559 | ||||||||||||||||||
Six months:
|
|
·
|
Revenues are $14.6 million less than the comparable 2010 period reflecting declines in animal feed volumes due to reduced customer sow breeding herds and hog inventories as well as our prior year results reflecting benefit of a prior year program of purchasing hogs outside of our internal production for growing to market weights. The decline was lessened by higher market hog prices in 2011 compared to 2010.
|
|
|
·
|
Cost of goods sold reflects overall lower costs of $13.3 million resulting from reduced volumes of animal feed sold, lesser costs in our Legacy Farm system related to ceasing our program of purchasing pigs outside our internal production for finishing to market weights, and higher costs in 2010 related to the flooding impacts to our Legacy farms offset by higher raw material costs.
|
|
|
·
|
Gross profit declined $1.2 million primarily due to our animal nutrition segment decline in gross profit of $4.7 million reflecting reduced sales of feed offset by an increase in gross profit in our Hog Production—China segment of $3.5 million primarily reflecting overall higher market prices for live hogs.
|
|
|
·
|
For Hog Production—United States (“M2P2 Acquisition”), our three-month gross profit declined from the first quarter of 2011 due to reduced marketing of hogs as a result of slower growth rates, because of warm weather, and leveling provisions in our marketing agreement, which favored our first quarter of 2011.
|
Selling, general and administrative expense (SG&A):
|
Three Months Ended June 30,
|
Six Months Ended June 30,
|
|||||||||||||||||||||||||||||||
|
2011
|
2010
|
Increase (Decrease) Due To
|
2011
|
2010
|
Increase (Decrease) Due To
|
|||||||||||||||||||||||||||
|
(unaudited)
|
(unaudited)
|
M2P2
Acquisition
|
Year over
Year
|
(unaudited)
|
(unaudited)
|
M2P2
Acquisition
|
Year over
Year
|
|||||||||||||||||||||||||
|
(in thousands)
|
(in thousands)
|
|||||||||||||||||||||||||||||||
|
Selling, general and administrative expense
|
$ | 21,539 | $ | 4,618 | $ | 887 | $ | 16,034 | $ | 28,901 | $ | 9,079 | $ | 1,626 | $ | 18,196 | ||||||||||||||||
29
Three months:
|
|
·
|
SG&A costs are higher than 2010 primarily due to credit and collection losses associated with our animal feed nutrition segment in the amount of $14.3 million, with the remaining increase attributable to corporate staffing and amortization charges related to incentive shares awarded to executive management, directors and advisors, expensing of current and capitalized registration costs related to the Registration Statement on Form F-1 due to withdrawal of this filing, and increased accounting, audit, legal and professional fees related to various compliance matters and filings.
|
Six months:
|
|
·
|
The higher costs in 2011 compared to 2010 are primarily due to credit and collection losses associated with our animal feed nutrition segment in the amount of $15.5 million, with the remaining increases attributable to corporate staffing and amortization of newly awarded incentive shares to executive management, directors and advisors, expensing of current and capitalized registration costs relating to the Registration Statement on Form F-1 due to withdrawal of this filing, and increased accounting, legal and professional fees related to various compliance matters and filings.
|
Interest and financing costs:
|
Three Months Ended June 30,
|
Six Months Ended June 30,
|
|||||||||||||||||||||||||||||||
|
2011
|
2010
|
Increase (Decrease) Due To
|
2011
|
2010
|
Increase (Decrease) Due To
|
|||||||||||||||||||||||||||
|
(unaudited)
|
(unaudited)
|
M2P2
Acquisition
|
Year over
Year
|
(unaudited)
|
(unaudited)
|
M2P2
Acquisition
|
Year over
Year
|
|||||||||||||||||||||||||
|
(in thousands)
|
(in thousands)
|
|||||||||||||||||||||||||||||||
|
Interest and financing costs
|
$ | 996 | $ | 140 | $ | 760 | $ | 96 | $ | 1,911 | $ | 265 | $ | 1,385 | $ | 261 | ||||||||||||||||
Three months:
|
|
·
|
The increase of $96,000 is due to the incurrence of interest related to the acquisition (M2P2) note payable offset by the interest savings related to repayment of our China operating short-term loan and repayment of a convertible note.
|
Six months:
|
|
·
|
The increase of $261,000 is due to the incurrence of interest related to the acquisition (M2P2) note payable offset by the interest savings related to repayment of our China operating short-term loan and repayment of a convertible note.
|
30
|
|
·
|
The line of credit we utilize for working capital to fund our Hog Production—United States segment grew from $44.8 million at March 31, 2011 to $48.5 million at June 30, 2011 giving rise to the increase in quarterly interest and financing costs for the quarter ended June 30, 2011 ($760,000) compared to the quarter ended March 31, 2011 ($625,000), which for the six months equates to $1.4 million.
|
Income tax expense (benefit):
|
Three Months Ended June 30,
|
Six Months Ended June 30,
|
|||||||||||||||||||||||||||||||
|
2011
|
2010
|
Increase (Decrease) Due To
|
2011
|
2010
|
Increase (Decrease) Due To
|
|||||||||||||||||||||||||||
|
(unaudited)
|
(unaudited)
|
M2P2
Acquisition
|
Year over
Year
|
(unaudited)
|
(unaudited)
|
M2P2
Acquisition
|
Year over
Year
|
|||||||||||||||||||||||||
|
(in thousands)
|
(in thousands)
|
|||||||||||||||||||||||||||||||
|
Income tax expense (benefit)
|
$ | (304 | ) | $ | 641 | $ | - | $ | (945 | ) | $ | 234 | $ | 1,095 | $ | - | $ | (861 | ) | |||||||||||||
Three months:
|
|
·
|
The tax benefit is derived primarily through the increase of our deferred tax asset given our ability to offset corporate (Holding Company) losses with the earnings of our Hog Production—United States segment. The prior year amount relates to taxable earnings of our animal feed nutrition segment. For the current period our animal feed nutrition segment experienced a significant net loss, which has no associated tax benefit but may provide benefit in the future subject to a range of strategic alternatives we may consider regarding this non-core asset.
|
Six months:
|
|
·
|
Tax expense declined primarily due to an increase in our U.S. deferred tax benefit, while the prior year tax expense relates solely to the operating income of our animal nutrition segment.
|
Commitments:
The Company has commitments to expend approximately $2.1 million for construction in process and growing breeder hogs. We expect to expend these funds over the balance of 2011.
31
Segment Results
Animal Feed Nutrition:
Gross Profit/Volume Table: Animal feed nutrition
|
(Dollars in thousands except per metric ton data)
|
Three Months ended June 30,
|
Six Months ended June 30,
|
||||||||||||||||||||||
|
2011
|
2010
|
% Inc (Dec)
|
2011
|
2010
|
% Inc (Dec)
|
|||||||||||||||||||
|
Volume—Metric Tons (MT)
|
25,760 | 33,708 | (24 | )% | 63,853 | 69,848 | (9 | )% | ||||||||||||||||
|
Revenue
|
$ | 16,741 | 26,369 | (37 | )% | $ | 40,950 | 50,659 | (19 | )% | ||||||||||||||
|
Cost of Sales
|
$ | 14,615 | 21,601 | (32 | )% | $ | 36,397 | 41,426 | (12 | )% | ||||||||||||||
|
Gross Profit
|
$ | 2,126 | 4,768 | (55 | )% | $ | 4,553 | 9,233 | (51 | )% | ||||||||||||||
|
Change in gross profit from 2010 period
|
||||||||||||||||||||||||
|
Due to Price
|
$ | (1,518 | ) | $ | (3,887 | ) | ||||||||||||||||||
|
Due to Volume
|
$ | (1,124 | ) | $ | (793 | ) | ||||||||||||||||||
| $ | (2,642 | ) | $ | (4,680 | ) | |||||||||||||||||||
|
Changes from 2010 period
|
||||||||||||||||||||||||
|
Revenue per MT increase (decrease)
|
$ | (132 | ) | $ | (84 | ) | ||||||||||||||||||
|
Cost per MT increase (decrease)
|
$ | (73 | ) | $ | (23 | ) | ||||||||||||||||||
|
Gross Profit per MT increase (decrease)
|
$ | (59 | ) | $ | (61 | ) | ||||||||||||||||||
Three months:
|
|
·
|
Revenues declined 37% driven by reduced levels of customer sows and hogs reflecting the impact of disease as well as delays to expand or replace production stock due to the high cost of feed raw materials and replacement animals.
|
|
|
·
|
In aggregate, revenues per metric ton declined $132 in the 2011 period compared to 2010.
|
|
|
·
|
Cost of sales declined 32% reflecting reduced sales volumes and a product-mix shift toward emphasizing pre-mix and concentrates while corn is at high prices. Our cost per metric ton decreased $73.
|
|
|
·
|
Gross profit declined $2.6 million. Of this, $1.5 million primarily relates to price and cost drivers reflecting the competitive market challenges we experienced to pass along increasing raw material and transport costs in our product pricing in order to retain market share. The remaining $1.1 million is due to overall reduced volume sales.
|
|
|
·
|
During the quarter we began shifting our product mix to emphasize concentrates and pre-mix products, while we develop less cost alternative complete feeds and expand our purchasing channels given the high price of corn.
|
Six months:
|
|
·
|
Revenues declined 19% reflecting a progression of adverse market conditions, which commenced in the second quarter of 2010 and continue to perpetuate causing our customers to carry reduced levels of sows and market hogs on feed as the result of disease-driven impacts to production and delays in recovery through breeding hog and market hog expansion and replacement due to the high cost of replacement animals and the high costs of raising hogs to market weights.
|
|
|
·
|
In aggregate, revenues per metric ton declined $84 in the 2011 period compared to 2010.
|
32
|
|
·
|
Cost of sales declined 12% reflecting reduced sales volumes and an overall re-emphasis on pre-mix and concentrates products, while corn is at high prices.
|
|
|
·
|
Gross profit declined $4.7 million of which $3.9 million is attributable to price and cost drivers reflecting the market challenges we experienced to pass along increasing raw material and transport costs in our product pricing to remain competitive and retain market share, while $0.8 million is attributable to volume drivers.
|
Selling, general & administrative expense (SG&A):
|
Three Months Ended June 30,
|
Six Months Ended June 30,
|
|||||||||||||||||||||||
|
2011
|
2010
|
2011
|
2010
|
|||||||||||||||||||||
|
(unaudited)
|
(unaudited)
|
Increase
(Decrease)
|
(unaudited)
|
(unaudited)
|
Increase
(Decrease)
|
|||||||||||||||||||
|
(in thousands)
|
(in thousands)
|
|||||||||||||||||||||||
|
Selling, general & administrative expense
|
$ | 16,354 | $ | 1,806 | $ | 14,548 | $ | 19,615 | $ | 3,603 | $ | 16,012 | ||||||||||||
Three months:
|
|
·
|
In response to the deteriorating quality of credit issued to customers as a result of continuing operating pressures brought about by consistently rising costs of feed raw materials (corn and soybean meal), farm labor, disease recovery and high market prices for piglets needed to maintain and expand herds, we have incurred a non-cash charge of $14.3 million to our earnings in the quarter ended June 30, 2011. This non-cash charges equates to a $9.2 million expense related to collection of accounts receivable and an increase of $5.1 million to our bad debt provision. Our provision for bad debts now stands at $7.0 million.
|
Six months:
|
|
·
|
Of the increase of $16.0 million, $15.5 million relates to charges we have taken against our receivables due to deteriorating credit quality brought about by the cumulative market and operating challenges encountered by our customers. These challenges include recovery from disease outbreaks, persistent increasing costs of feed raw materials (corn and soybean meal), higher farm labor costs and high market prices for piglets needed to maintain and expand herds.
|
Operating profit:
|
Three Months Ended June 30,
|
Six Months Ended June 30,
|
|||||||||||||||||||||||
|
2011
|
2010
|
2011
|
2010
|
|||||||||||||||||||||
|
(unaudited)
|
(unaudited)
|
Increase
(Decrease)
|
(unaudited)
|
(unaudited)
|
Increase
(Decrease)
|
|||||||||||||||||||
|
(in thousands)
|
(in thousands)
|
|||||||||||||||||||||||
|
Operating profit
|
$ | (14,227 | ) | $ | 2,963 | $ | (17,190 | ) | $ | (15,063 | ) | $ | 5,630 | $ | (20,693 | ) | ||||||||
Three Months:
|
·
|
Operating profit declined $17.2 million compared to the prior year period due to the aggressive position we have taken regarding collectability of our accounts receivable resulting in a charge to earnings of $14.3 million.
|
33
|
|
·
|
Without impact of the charge related to our credit and collection losses, the current quarter would have reflected a slight operating profit.
|
Six Months:
|
|
·
|
Operating profit declined $20.7 million compared to the prior year period due to cumulative charges of $15.5 million for credit and collection losses, reduced volume sales of our feed due to lower herd and hog inventories of our customers, competitive market forces preventing us from passing along increased costs of our raw materials and a shift in our product mix in response to the market challenges we are facing.
|
|
|
·
|
Removing the cumulative charges for our credit and collection losses, our 2011 year-to-date operating profit would be approximately $500,000.
|
Income tax expense:
|
Three Months Ended June 30,
|
Six Months Ended June 30,
|
|||||||||||||||||||||||
|
2011
|
2010
|
2011
|
2010
|
|||||||||||||||||||||
|
(unaudited)
|
(unaudited)
|
Increase
(Decrease)
|
(unaudited)
|
(unaudited)
|
Increase
(Decrease)
|
|||||||||||||||||||
|
(in thousands)
|
(in thousands)
|
|||||||||||||||||||||||
|
Income tax expense
|
$ | 82 | $ | 641 | $ | (559 | ) | $ | 217 | $ | 1,095 | $ | (878 | ) | ||||||||||
Three and six months:
|
|
·
|
Tax expense declined due to prior year profitability versus the current period.
|
Hog production – China:
Gross Profit/Volume Table: Hog Production—China
|
(Dollars in thousands,
except per hog data)
|
Three Months ended June 30,
|
Six Months ended June 30,
|
||||||||||||||||||||||
|
2011
|
2010
|
Inc (Dec)
|
2011
|
2010
|
Inc (Dec)
|
|||||||||||||||||||
|
Volume—Hogs
|
68,054 | 72,883 | (4,829 | ) | 137,097 | 219,630 | (82,533 | ) | ||||||||||||||||
|
Revenue
|
$ | 13,814 | 7,391 | 6,423 | $ | 24,708 | 29,591 | (4,883 | ) | |||||||||||||||
|
Cost of Sales
|
$ | 11,271 | 8,623 | 2,648 | $ | 21,096 | 29,416 | (8,320 | ) | |||||||||||||||
|
Gross Profit
|
$ | 2,543 | (1,232 | ) | 3,775 | $ | 3,612 | 175 | 3,437 | |||||||||||||||
|
Change in gross profit from 2010 period
|
||||||||||||||||||||||||
|
Due to Price
|
$ | 3,693 | $ | 3,503 | ||||||||||||||||||||
|
Due to Volume
|
$ | 82 | $ | (66 | ) | |||||||||||||||||||
| $ | 3,775 | $ | 3,437 | |||||||||||||||||||||
|
Revenue per hog
|
$ | 203 | 101 | 102 | $ | 180 | 135 | 45 | ||||||||||||||||
|
Cost per hog
|
$ | 166 | 118 | 48 | $ | 154 | 134 | 20 | ||||||||||||||||
|
Gross profit per hog
|
$ | 37 | (17 | ) | 54 | $ | 26 | 1 | 25 | |||||||||||||||
34
Three Months:
|
|
·
|
Revenues for the period ended June 30, 2011 of $13.8 million exceeded prior year revenues by $6.4 million representing an 86.5% increase. Historically high live hog prices compared to prior year prices, which were at historical lows, brought about a doubling of our revenue per hog offset by a decline in marketed hogs of 4,829 head.
|
|
|
·
|
Cost of sales increased $2.6 million in the current period versus the prior year period. On a per hog basis, our cost increased $47 per hog or 40% primarily driven by higher feed costs, but offset by marketing pigs at lighter weights to re-establish market hog flows while live hog market prices are high.
|
|
|
·
|
Gross profit improved $3.8 million reflecting a $54 margin per pig improvement compared to the prior year.
|
Six months:
|
|
·
|
Revenues for the 2011 period are $4.9 million less than 2010. This is primarily due to the decline in market hogs sold of 82,533 and offset by an increase of $45 per marketed pig. In the 2010 period, we were active in the purchase of hogs from outside our system for the purpose of finishing these hogs to market weights at a profit. We discontinued this program at the end of the first quarter of 2010.
|
|
|
·
|
Cost of sales declined $8.3 million due to discontinuance of our hog finishing program in the first quarter of 2010 offset by increased costs of raising an hog primarily attributable to higher feed costs. Per hog costs increased $20 per hog from $134 in 2010 to $154 in 2011.
|
|
|
·
|
Gross profit improved $3.4 million primarily driven by increases in market prices for live hogs.
|
Operating Profit:
|
Three Months Ended June 30,
|
Six Months Ended June 30,
|
|||||||||||||||||||||||
|
2011
|
2010
|
2011
|
2010
|
|||||||||||||||||||||
|
(unaudited)
|
(unaudited)
|
Increase
(Decrease)
|
(unaudited)
|
(unaudited)
|
Increase
(Decrease)
|
|||||||||||||||||||
|
(in thousands)
|
(in thousands)
|
|||||||||||||||||||||||
|
Operating profit
|
$ | 1,310 | $ | (2,755 | ) | $ | 4,065 | $ | 1,171 | $ | (2,526 | ) | $ | 3,697 | ||||||||||
Three Months:
|
|
·
|
During the current quarter our Legacy farms, excluding discontinued operations reflected an operating profit of $1.3 million versus a prior period loss of $2.8 million. The profit is after taking a charge of $793,000 for closing a farm in Guangxi Province and relocating the herd to another farm.
|
35
|
|
·
|
The operating profit is primarily due to a net improvement of $54 received per marketed hog, reflecting the doubling of live hog prices between the periods.
|
Six months:
|
|
·
|
Our $3.7 million increase in operating profit is attributable to a $25 per marketed hog margin increase supported by our abilities to respond and recover from health and bio-security issues toward re-establishing consistent market flows of hogs from our farms.
|
Hog Production—United States:
Gross Profit/Volume Table: Hog Production—United States
|
(Dollars per thousand,
except per hog data)
|
Three Months ended
|
Six Months
ended |
||||||||||||||
|
30-Jun-11
|
31-Mar-11
|
Inc (Dec)
|
30-Jun-11
|
|||||||||||||
|
Volume—Hogs
|
301,369 | 333,792 | (32,423 | ) | 635,161 | |||||||||||
|
Revenue
|
$ | 54,843 | 57,884 | (3,041 | ) | $ | 112,727 | |||||||||
|
Cost of Sales
|
$ | 51,426 | 53,499 | (2,073 | ) | $ | 104,925 | |||||||||
|
Gross Profit
|
$ | 3,417 | 4,385 | (968 | ) | $ | 7,802 | |||||||||
|
Revenue per hog
|
$ | 182 | 173 | 9 | $ |
177
|
||||||||||
|
Cost per hog
|
$ | 171 | 160 | 10 | $ |
165
|
||||||||||
|
Gross profit per hog
|
$ | 11 | 13 | (2 | ) | $ |
12
|
|||||||||
Cost of goods sold is down $2.1 million compared to the quarter ended March 31, 2011 reflecting the lower number of hogs marketed and retaining the hogs in production longer due to the slower growth rate. Given we do not have prior year data to compare, the above table presents a sequential quarter comparison. Revenue generated for the three months ending June 2011 of $54.8 million reflects a $3.0 million decline from the quarter ended March 31, 2011. We attribute this to slower growth rates of our market hogs due to warmer temperatures, which have the effect of delaying the marketing of these hogs until they reach targeted weights.
Interest and financing costs:
|
Three Months Ended
|
Six Months
Ended
|
|||||||||||||||
|
30-Jun-11
|
31-Mar-11
|
30-Jun-11
|
||||||||||||||
|
(unaudited)
|
(unaudited)
|
Increase
(Decrease)
|
(unaudited)
|
|||||||||||||
|
(in thousands)
|
||||||||||||||||
|
Interest and financing costs
|
$ | 760 | $ | 625 | $ | 135 | $ | 1,385 | ||||||||
The line of credit we utilize for working capital to fund our Hog Production—United States segment grew from $44.8 million at March 31, 2011 to $48.5 million at June 30, 2011 giving rise to the increase in quarterly interest.
36
Western Style Hog Farms:
|
Three Months Ended June 30,
|
Six Months Ended June 30,
|
|||||||||||||||||||||||
|
2011
|
2010
|
2011
|
2010
|
|||||||||||||||||||||
|
(unaudited)
|
(unaudited)
|
Increase
(Decrease)
|
(unaudited)
|
(unaudited)
|
Increase
(Decrease)
|
|||||||||||||||||||
|
(in thousands)
|
(in thousands)
|
|||||||||||||||||||||||
|
Selling, general & administrative expense
|
$ | 770 | $ | 315 | $ | 455 | $ | 1,068 | $ | 532 | $ | 536 | ||||||||||||
We entered into agreements for the construction of farms in Dahua, Guangxi Province in China in the fall of 2009. We are in the final stages of completing the construction and stocking of this farm with 5,000 female hogs (gilts) that will become our breeding herd and begin producing offspring in the third quarter and reach market weights in the first quarter of 2012. We have also begun construction activities at our Xinyu, Jiangxi Province site. Until we commence bringing hogs to market, this operating segment will primarily incur operating expenses. It will continue to capitalize costs related to construction as well as establishing our gilts as breeding sows.
Holding Company:
Under this category, we capture the costs of United States based executive management and operating expenses including corporate staff, director fees and expenses, amortization charges related to incentive shares awarded to executive management, directors and advisors, insurance and expenses related to corporate governance and compliance, such as accounting, auditing, legal, SOX compliance and professional fees.
Selling, general and administrative expenses (SG&A):
|
Three Months Ended June 30,
|
Six Months Ended June 30,
|
|||||||||||||||||||||||
|
2011
|
2010
|
2011
|
2010
|
|||||||||||||||||||||
|
(unaudited)
|
(unaudited)
|
Increase
(Decrease)
|
(unaudited)
|
(unaudited)
|
Increase
(Decrease)
|
|||||||||||||||||||
|
(in thousands)
|
(in thousands)
|
|||||||||||||||||||||||
|
Selling, general & administrative expense
|
$ | 2,295 | $ | 974 | $ | 1,321 | $ | 4,150 | $ | 2,243 | $ | 1,907 | ||||||||||||
The increase is described in the line items below:
|
Three
|
Six
|
|||||||||
|
Months
|
Months
|
|||||||||
| o |
China legal and consulting
|
$ | 0.1 | $ | 0.1 | |||||
| o |
US legal and consulting
|
0.3 | 0.4 | |||||||
| o |
Expense capitalized F-1 charges
|
0.3 | 0.3 | |||||||
| o |
Accounting, audit, tax, compliance
|
0.4 | 0.6 | |||||||
| o |
Stock-based compensation
|
(0.1 | ) | 0.1 | ||||||
| o |
Other
|
0.3 | 0.4 | |||||||
|
Total
|
$ | 1.3 | $ | 1.9 | ||||||
37
Interest and financing costs:
|
Three Months Ended June 30,
|
Six Months Ended June 30,
|
|||||||||||||||||||||||
|
2011
|
2010
|
2011
|
2010
|
|||||||||||||||||||||
|
(unaudited)
|
(unaudited)
|
Increase
(Decrease)
|
(unaudited)
|
(unaudited)
|
Increase
(Decrease)
|
|||||||||||||||||||
|
(in thousands)
|
(in thousands)
|
|||||||||||||||||||||||
|
Interest and financing costs
|
$ | 192 | $ | 43 | $ | 150 | $ | 412 | $ | 85 | $ | 327 | ||||||||||||
Three months:
|
|
·
|
In the current period, we are only incurring interest charges related to the acquisition (of M2P2) note, which is paid quarterly.
|
Six months:
|
|
·
|
We have incurred two quarters of interest charges related to the acquisition note in addition to interest related to a convertible note, which was settled in the first quarter of 2011.
|
Discontinued operations:
During the first quarter of 2011, we made the decision to dispose of all commercial farms in our Jiangxi operating segment. At the conclusion of the disposal activities, the operations and cash flows of this component will be eliminated from our ongoing operations. Additionally, we will no longer have any significant continuing involvement in the operations of this component. Accordingly, we have classified operating results for the Jiangxi operating segment as discontinued operations.
For the three months ended June 30, 2011, the Jiangxi operating segment generated an operating loss of $1.7 million and a year-to-date loss of $2.4 million. The loss was generated as follows:
|
Three Months Ended June 30,
|
Six Months Ended June 30,
|
|||||||||||||||
|
2011
|
2010
|
2011
|
2010
|
|||||||||||||
|
Revenues
|
$ | 660,619 | $ | 3,901,579 | $ | 2,791,028 | $ | 10,270,790 | ||||||||
|
Cost of goods sold
|
2,621,784 | 4,878,683 | 4,576,498 | 10,800,649 | ||||||||||||
|
Gross profit
|
(1,961,165 | ) | (977,104 | ) | (1,785,470 | ) | (529,859 | ) | ||||||||
|
Operating expenses
|
257,884 | 307,966 | 887,003 | 640,756 | ||||||||||||
|
Loss from operations
|
(2,219,049 | ) | (1,285,070 | ) | (2,672,473 | ) | (1,170,615 | ) | ||||||||
|
Non-operating income (expense)
|
474,807 | (97,095 | ) | 247,186 | (168,831 | ) | ||||||||||
|
Loss before taxes
|
(1,744,242 | ) | (1,382,165 | ) | (2,425,287 | ) | (1,339,446 | ) | ||||||||
|
Income tax expense
|
- | - | - | - | ||||||||||||
|
Net loss
|
$ | (1,744,242 | ) | $ | (1,382,165 | ) | $ | (2,425,287 | ) | $ | (1,339,446 | ) | ||||
To date, all farms in the Jiangxi operating segment have been depopulated of breeding sows and market hogs or we have transferred operations through negotiated settlements. Of the depopulated farms, we have one remaining where final closure negotiations have reached an impasse. At this time, we are assessing the merits of claims and counterclaims that have been asserted in the course of our negotiations. Our previously reported results recorded a full write-down of our long-term assets related to this property and would provide a position of leverage as negotiations resume.
38
Liquidity and Capital Resources
At June 30, 2011, we had $10.8 million in cash and cash equivalents on hand.
During the year ended December 31, 2010, we issued 5,029,762 shares of our common stock in connection with the Equity Credit Agreement for gross proceeds of $13.0 million to finance the cash component of the consideration paid in connection with the acquisition of M2P2.
During the six months ended June 30, 2011, we issued 10,846,850 shares of our common stock in connection with the Equity Credit Agreement for gross proceeds of $16.6 million used to finance the Western style hog farms and pay our U.S. holding company expenses.
In May 2011, we repaid short-term loans of $4.6 million that were collateralized by building and equipment. These loans were not renewed for new short-term loans as was done in the prior year. As a result or our acquisition of M2P2, we assumed a line of credit and long-term notes with outstanding balances at June 30, 2011 of $48.5 million and $15.6 million, respectively. The line of credit is a $65 million senior revolving loan facility that expires on June 1, 2012. The first $25 million borrowed under the facility bears interest at 3.95%; and the remaining amount borrowed under the facility bears interest at the 1-month LIBOR plus 3.00% (3.25% at June 30, 2011). This facility is collateralized by substantially all of the assets of our M2P2 subsidiary and has various restrictive covenants, including, but not limited to, certain restrictions on distributions, maintenance of a minimum net worth and other financial covenant requirements. The long-term debt assumed with our acquisition of M2P2 bears interest ranging from 5.00% to 5.25%. These long-term debt borrowings are collateralized by substantially all of the assets of M2P2 and have various restrictive covenants, including, but not limited to, certain restrictions on distributions, maintenance of a minimum net worth and other financial covenant requirements. In connection with our acquisition of M2P2, we issued a promissory note payable to the sellers in the amount of $9.6 million. The note bears interest at a rate of 8.0% per year, with interest payable quarterly in cash on March 31, June 30, September 30 and December 31 of each year, beginning on December 31, 2010. We are required to make interest only payments until June 30, 2012 and thereafter we will make amortizing principal and interest payments with the last payment due on September 30, 2020. We granted the seller a perfected first-priority lien on, and security interest in, all of the outstanding equity interests of M2P2 as collateral security for our obligations on the promissory notes.
During the six months ended June 30, 2011, we used $3.6 million of cash from our operating activities. The cash used was primarily a result of the net loss, net of non-cash expenses including depreciation, amortization and stock issuances, an increase in accounts receivable and inventory, offset by decrease in accrued expenses.
We used $14.4 million in investing activities during the six months ended June 30, 2011 for the acquisition of property and equipment primarily in connection with the development of our western-style farms in both Dahua and Xinyu.
We generated $16.2 million in cash from financing activities as a result of issuing stock providing gross proceeds of $16.6 million through the Equity Credit Agreement and borrowing $6.3 million from our line of credit, offset by the repayment of our convertible debenture, notes payable and short-term loans in the amounts of $1.0 million, $1.1 million and $4.6 million, respectively.
39
At June 30, 2011, our accounts receivable balance was $13.2 million, a decrease of $8.6 million from December 31, 2010. Our accounts receivable and reserves for doubtful accounts are substantially representative of our credit dealings with animal nutrition customers. We age our receivables into traditional 30-day buckets and monitor the customers and balances on a regular basis. Generally we use a formula-based analysis to more broadly assign collection risk to our aging groups primarily over 90 days past due, subject to specific customer review. This formula-based approach applies a declining percentage of collectability to each bucket-aging category at least 90 days past due as the past due days increase. In the current year, however, we placed greater reliance on individual customer assessment and then applied an overall factor of collection as we believe we are experiencing a new set of market dynamics exacerbated by the reorganization of our Animal feed nutrition segment, cash constraints of our long-standing customers related to increasing feed raw material costs and herd expansion initiatives. In the current year, the increase in the accounts receivable reserve includes approximately of $9.2 million related to the collection of outstanding accounts receivable in our animal nutrition business and an additional $6.3 million of bad debt allowance. The operating pressures facing our customers has led management to increase accounts receivable reserves due to concerns regarding credit quality. The below table analyzes the change in our accounts receivable reserve from December 31, 2010 to June 30, 2011:
|
Balance, December 31, 2010
|
$ | 707,968 | ||
|
Additions
|
15,484,448 | |||
|
Write-offs of uncollectible accounts
|
(9,147,649 | ) | ||
|
Balance, June 30, 2011
|
$ | 7,044,767 |
Our liquidity requirements
Present operating segments;
To conduct our operations related to Animal feed nutrition, Hog Production—China and Hog Production-United States, we intend to meet our liquidity requirements, including capital expenditures related to the purchase of equipment, purchase of raw materials, and the expansion of our business, through cash flow provided by these operations. You should note that our Hog Production—United States utilizes a line of credit for its working capital needs. This line of credit is due to expire June 1, 2012 with a lender that we have a long history with and understands our business model.
United States holding company, Western style hog farms and proposed Harvesting/Processing acquisitions:
Our liquidity requirements related to our U.S. holding company and development of our Western style hog farms have historically been funded through the capital markets and our Equity Purchase Agreement. Our holding company expenditures have been running at a cash rate approximating $600,000 per month, which we are reviewing for strategic necessity in accordance with our current operations and strategic direction.
Funding our Western style hog farms through China bank debt are challenging, given the credit tightening actions of the Chinese Central Government and lack of credit history and cash flows from the project. As these farms produce cash flows, we expect they will also give us access to local debt markets in China as an alternative financing channel.
We have current commitments to expend approximately $2.1 million for construction in process and growing breeder hogs related to our Western style hog farms, which we expect to expend over the remainder of 2011. Our Dahua project is in the final stage of completing construction of non-farm buildings, while we have simultaneously completed the stocking of 5,000 breeding females and supporting boar stud. We expect this farm to begin generating cash flows in the spring 2012, with its current funding requirements related to completing construction and providing the working cash needed for feed and labor to establish breeding sows and market hog inventory. Our Xinyu project, however, is in the first phase of its construction plans, which call for completion of one sow farm (5,000 breeding sows) and supporting facilities in the spring 2012. It will be approximately one year later (spring 2013) that this farm will begin selling market hogs and generating its own cash flows. For construction efficiency and cost savings, subject to funding, our plans call for overlapping construction of a second sow farm in Xinyu, which will then begin generating cash flows approximately one year after that.
40
For the short-term, we anticipate using our Equity Purchase Agreement to fund our needs, while we pursue long-term financing of our proposed acquisitions of PRF and KCS. Completing the acquisitions of PRF and KCS will provide a base of US domiciled cash flow, which will further provide opportunities to balance our capital structure through greater use of debt and secure funding of our capital requirements into 2012.
Approximately 37% our revenues for the six months ended June 30, 2011 were denominated in RMB. There is no assurance that exchange rates between the RMB and the USD will remain stable. The PRC has recently commenced a program of controlling appreciation of the RMB.
Inflation and Seasonality
Demand for our products remains fairly consistent throughout the year. However, pork demand leading up to the Chinese Spring Festival tends to increase China hog prices, and depending on consumption of pork during the Festival, may or may not have a counter and temporary effect on China hog prices after the Festival.
Critical Accounting Policies
In presenting our financial statements in conformity with accounting principles generally accepted in the United States, we are required to make certain estimates and assumptions that affect the amounts reported therein. Several of the estimates and assumptions we are required to make relate to matters that are inherently uncertain as they pertain to future events. However, events that are outside of our control cannot be predicted and, as such, they cannot be contemplated in evaluating such estimates and assumptions. If there is a significant unfavorable change to current conditions, it will likely result in a material adverse impact to our consolidated results of operations, financial position and liquidity. We believe that the estimates and assumptions we used when preparing our financial statements were the most appropriate at that time. Presented below are those accounting policies that we believe require subjective and complex judgments that could potentially affect reported results.
Use of Estimates. Our discussion and analysis of our financial condition and results of operations are based upon our consolidated financial statements, which were prepared in accordance with accounting principles generally accepted in the United States of America. The preparation of these consolidated financial statements requires us to make estimates and judgments that affect the reported amounts of assets, liabilities, revenues and expenses, and related disclosures of contingent assets and liabilities. On an ongoing basis, we evaluate our estimates, including those related to impairment of long-lived assets and allowance for doubtful accounts. We base our estimates on historical experience and on various other assumptions that we believe to be reasonable under the circumstances, the results of which form the basis for making judgments about the carrying value of assets and liabilities that are not readily apparent from other sources. Actual results may differ from these estimates under different assumptions or conditions; however, we believe that our estimates, including those for the above-described items, are reasonable.
Areas that require estimates and assumptions include valuation of accounts receivable and inventory, determination of useful lives of property and equipment, estimation of certain liabilities and sales returns.
Allowance For Doubtful Accounts. We continually monitor customer payments and maintain a reserve for estimated losses resulting from our customers’ inability to make required payments. In determining the reserve, we evaluate the collectability of our accounts receivable based upon a variety of factors. In cases where we become aware of circumstances that may impair a specific customer’s ability to meet its financial obligations, we record a specific allowance against amounts due. For all other customers, we recognize allowances for doubtful accounts based on our historical write-off experience in conjunction with the length of time the receivables are past due, customer credit worthiness, geographic risk and the current business environment. Actual future losses from uncollectible accounts may differ from our estimates.
41
Inventories. Inventories are stated at the lower of cost or market. Cost is determined using the average cost method. We evaluate our ending inventories for estimated excess quantities and obsolescence. Our evaluation includes the analysis of future sales demand by product, within specific time horizons. Inventories in excess of projected future demand are written down to net realizable value. In addition, we assess the impact of changing technology on inventory balances and writes-down inventories that are considered obsolete. Inventory obsolescence and excess quantities have historically been minimal.
Long-Lived Assets. We periodically assess potential impairments to our long-lived assets in accordance with the provisions of SFAS No. 144, “Accounting for the Impairment or Disposal of Long-Lived Assets.” SFAS No. 144 requires, among other things, that an entity perform an impairment review whenever events or changes in circumstances indicate that the carrying value may not be fully recoverable. Factors we considered include, but are not limited to: significant underperformance relative to expected historical or projected future operating results; significant changes in the manner of use of the acquired assets or the strategy for our overall business; and significant negative industry or economic trends. When we determine that the carrying value of a long-lived asset may not be recoverable based upon the existence of one or more of the above indicators of impairment, we estimate the future undiscounted cash flows expected to result from the use of the asset and its eventual disposition. If the sum of the expected future undiscounted cash flows and eventual disposition is less than the carrying amount of the asset, we recognize an impairment loss. An impairment loss is reflected as the amount by which the carrying amount of the asset exceeds the fair market value of the asset, based on the fair market value if available, or discounted cash flows.
Property and Equipment. Useful lives of property and equipment are based on historical experience and industry norms. Changes in useful lives due to changes in technology or other factors can affect future depreciation estimates.
Goodwill. Goodwill represents the excess of purchase price over the underlying net assets of businesses acquired. Goodwill is tested annually for impairment or more frequently if indicators of impairment are present. Goodwill is tested at the reporting unit level, which is the same as, or one level below, the operating segment level. Accounting standards require a two step process for evaluating goodwill for impairment. The first step compares the reporting unit to its fair value. The second step is required if the fair value is less than the carrying value of the reporting unit. The second step allocates fair value to assets (including any unrecognized intangible assets) and liabilities under a hypothetical purchase price allocation. Any remaining unallocated fair value represents the implied fair value of goodwill for the reporting unit.
In 2010, we recognized goodwill impairment charges of $21 million. Significant assumptions are used in determining the fair value of reporting units and goodwill, including discount rates and future projected cash flows. Management believes the assumptions used are reasonable, however, changes in these assumptions could materially modify the reported amounts of goodwill and any related impairment charges.
Revenue Recognition. Our revenue recognition policies are in compliance with SEC Staff Accounting Bulletin (SAB) 104. Revenue is recognized when services are rendered to customers when a formal arrangement exists, the price is fixed or determinable, the delivery is completed, no other significant obligations of AgFeed exist and collectability is reasonably assured. Payments received before all of the relevant criteria for revenue recognition are satisfied are recorded as unearned revenue. We are not subject to VAT withholdings. We give volume rebates to certain customers based on volume achieved.
We make estimates and judgments when determining whether the collectability of revenue from customers is reasonably assured. Management estimates regarding collectability impact the actual revenues recognized each period and the timing of the recognition of revenues. Our assumptions and judgments regarding future collectability could differ from actual events, thus materially impacting our financial position and results of operations.
42
Sales returns and allowances have historically been insignificant. Accordingly, estimating returns is not critical. However, if circumstances change, returns and allowance may impact the company’s earnings. There are no differences in our arrangements with our different types of customers. Accordingly, we do not have different revenue recognition policies for different types of customers. We offer credit terms ranging from 30 to 90 days for most customers. From some large customers, we may extend these terms beyond 90 days.
Derivative Instruments. Under accounting requirements, all derivative instruments are recognized on the balance sheet at fair value. The accounting for changes in the fair value (gains or losses) depends on the nature of the derivative and hedging relationship. Our subsidiary, M2P2 periodically utilizes derivative instruments in its risk management and commodity hedging activities. Derivative instruments primarily include futures and forward contracts which may be utilized to hedge price risk related to a portion of our grain purchases. Although the derivatives are considered an economic hedge, they do not qualify for the defined hedge accounting and, accordingly, changes in fair value of the derivatives are recognized in net income. Gains or losses related to grain derivatives are classified in cost of goods sold on the consolidated statement of operations.
Disclosures About Market Risk
We may be exposed to changes in financial market conditions in the normal course of business. Market risk generally represents the risk that losses may occur as a result of movements in interest rates and equity prices. We currently do not use financial instruments in the normal course of business that are subject to changes in financial market conditions.
Currency Fluctuations and Foreign Currency Risk
A large portion of our operations outside the United States are conducted in the PRC. Our sales and purchases conducted within the PRC are in RMB, which is the official currency of the PRC. The effect of the fluctuations of exchange rates is considered minimal to our business operations.
All of our revenues and expenses from our PRC subsidiaries are denominated in RMB. However, we use U.S. dollars for financial reporting purposes. Conversion of RMB into foreign currencies is regulated by the People’s Bank of China through a unified floating exchange rate system. Exchange rate fluctuations may adversely affect the value, in U.S. dollar terms, of our net assets and income derived from its operations in the PRC.
Interest Rate Risk
We have interest rate risk related to the short-term notes entered; however, we do not believe this interest rate risk is significant.
43
We have experienced significant credit risk in the current year. Our receivables are monitored regularly by our credit managers.
Our management, under the supervision and with the participation of our chief executive officer and chief financial officer, has performed an evaluation of the effectiveness of the design and operation of our disclosure controls and procedures (as defined in Rules 13a-15(e) and 15d-15(e) under the Securities Exchange Act of 1934, as amended (the "Exchange Act")) as of the end of the period covered by this report, as required by Rule 13a-15(b) under the Exchange Act. Disclosure controls and procedures are those controls and procedures designed to provide reasonable assurance that the information required to be disclosed in our Exchange Act filings is (1) recorded, processed, summarized and reported within the time periods specified in the SEC’s rules and forms, and (2) accumulated and communicated to management, including our chief executive officer and chief financial officer, as appropriate, to allow timely decisions regarding required disclosure. Based on that evaluation, our chief executive officer and chief financial officer concluded, as a result of the material weakness described in the following paragraph, that the Company’s disclosure controls and procedures were not effective at June 30, 2011.
As described in Item 9A in our annual report on Form 10-K for the year-ended December 31, 2010, management had identified material weaknesses associated with internal controls related to (i) the review of US GAAP financial statements and (ii) the monitoring of the adequacy of accruals over certain payroll-related expenses at the hog companies. To remediate these weaknesses, management has hired additional personnel skilled in consolidation of international and domestic subsidiaries, is currently implementing a consolidation software program at its U.S. headquarters to accept direct financial data from its subsidiary’s computer systems, and is planning additional training sessions covering PRC and US GAAP differences to be presented in the fourth quarter timeframe by a recognized accounting firm to financial and accounting personnel down to the regional finance manager level. Management has engaged Chinese legal counsel to assist us in determining appropriate accruals based on provincial and local requirements, which are both complex and varied. We are in receipt of counsel’s recommendations and are reviewing them for implementation.
Other than as described above, there have been no changes in the Company’s internal control over financial reporting during the second quarter of 2011 that have materially affected, or are reasonably likely to materially affect, the Company’s internal control over financial reporting.
There are inherent limitations to the effectiveness of any controls system. A controls system, no matter how well designed and operated, can provide only reasonable, not absolute, assurance that its objectives are met. Further, the design of a control system must reflect the fact that there are limits on resources, and the benefits of controls must be considered relative to their costs and their impact on the business model. We intend to continue to improve and refine our internal control over financial reporting.
|
Item 1.
|
Legal Proceedings
|
We know of no pending legal proceedings to which we are a party which are material or potentially material, either individually or in the aggregate. We are from time to time, during the normal course of our business operations, subject to various litigation claims and legal disputes. We do not believe that the ultimate disposition of any of these matters will have a material adverse effect on our consolidated financial position, results of operations or liquidity.
|
Item 1A.
|
Risk Factors
|
During the three months ended June 30, 2011, there were no material changes to the risk factors previously disclosed in our Annual Report on Form 10-K for the year ended December 31, 2010.
44
None
|
Item 3.
|
Defaults Upon Senior Securities
|
None.
|
Item 4.
|
(Removed and Reserved)
|
|
Item 5.
|
Other Information
|
None.
|
Item 6.
|
Exhibits
|
|
(a)
|
Exhibits
|
|
Exhibit Number
|
Description of Exhibit
|
|
|
31.1
|
Certification of Principal Executive Officer pursuant to Rule 13a-14 and Rule 15d-14(a), promulgated under the Securities and Exchange Act of 1934, as amended.
|
|
|
31.2
|
Certification of Principal Financial Officer pursuant to Rule 13a-14 and Rule 15d 14(a), promulgated under the Securities and Exchange Act of 1934, as amended.
|
|
|
32.1
|
Certification pursuant to 18 U.S.C. Section 1350, as adopted pursuant to Section 906 of the Sarbanes-Oxley Act of 2002 (Chief Executive Officer).
|
|
|
32.2
|
Certification pursuant to 18 U.S.C. Section 1350, as adopted pursuant to Section 906 of the Sarbanes-Oxley Act of 2002 (Chief Financial Officer).
|
45
SIGNATURES
In accordance with the requirements of the Exchange Act, the registrant caused this report to be signed on its behalf by the undersigned, thereunto duly authorized.
|
AgFeed Industries, Inc.
|
||
|
August 9, 2011
|
By:
|
/s/ John A. Stadler
|
|
John A. Stadler
Interim Chief Executive Officer
(Principal Executive Officer)
|
||
|
August 9, 2011
|
By:
|
/s/ Clayton T. Marshall
|
|
Clayton T. Marshall
Chief Financial Officer
(Principal Financial and Accounting
Officer)
|
||
46