Attached files
| file | filename |
|---|---|
| 8-K - SHENANDOAH TELECOMMUNICATIONS 8-K 8-8-2011 - SHENANDOAH TELECOMMUNICATIONS CO/VA/ | form8-k.htm |

2Q 2011 Earnings Conference Call
August 8, 2011
Exhibit 99.1

2
Safe Harbor Statement
This presentation includes “forward-looking statements” within the meaning of Section
27A of the Securities Act and Section 21E of the Securities Exchange Act of 1934, as
amended, regarding, among other things, our business strategy, our prospects and our
financial position. These statements can be identified by the use of forward-looking
terminology such as “believes,” “estimates,” “expects,” “intends,” “may,” “will,”
“should,” “could,” or “anticipates” or the negative or other variation of these similar
words, or by discussions of strategy or risks and uncertainties. These statements are
based on current expectations of future events. If underlying assumptions prove
inaccurate or unknown risks or uncertainties materialize, actual results could vary
materially from the Company’s expectations and projections. Important factors that
could cause actual results to differ materially from such forward-looking statements
include, without limitation, risks related to the following:
qIncreasing competition in the communications industry; and
qA complex and uncertain regulatory environment.
A further list and description of these risks, uncertainties and other factors can be found
in the Company’s SEC filings which are available online at www.sec.gov,
www.shentel.com or on request from the Company. The Company does not undertake
to update any forward-looking statements as a result of new information or future
events or developments.
in the Company’s SEC filings which are available online at www.sec.gov,
www.shentel.com or on request from the Company. The Company does not undertake
to update any forward-looking statements as a result of new information or future
events or developments.

3
Use of Non-GAAP Financial Measures
Included in this presentation are certain non-GAAP financial measures that are not
determined in accordance with US generally accepted accounting principles. These
financial performance measures are not indicative of cash provided or used by operating
activities and exclude the effects of certain operating, capital and financing costs and
may differ from comparable information provided by other companies, and they should
not be considered in isolation, as an alternative to, or more meaningful than measures
of financial performance determined in accordance with US generally accepted
accounting principles. These financial performance measures are commonly used in the
industry and are presented because Shentel believes they provide relevant and useful
information to investors. Shentel utilizes these financial performance measures to
assess its ability to meet future capital expenditure and working capital requirements, to
incur indebtedness if necessary, return investment to shareholders and to fund
continued growth. Shentel also uses these financial performance measures to evaluate
the performance of its businesses and for budget planning purposes.

4
Chris French
CEO and President
5
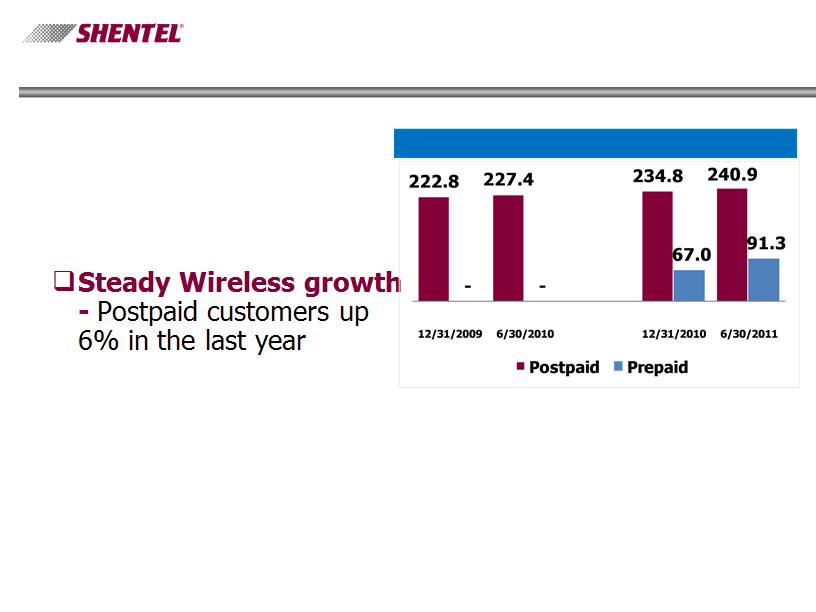
Wireless Highlights
PCS Customers (000s)
q Prepaid - Q2’11 net
additions of 11,089 and
91,332 prepaid subs at
6/30
additions of 11,089 and
91,332 prepaid subs at
6/30
q Postpaid Churn
improves - Q2’11 churn
of 1.6% compared to
1.7% for Q2’10 and 1.8%
for Q1’11
improves - Q2’11 churn
of 1.6% compared to
1.7% for Q2’10 and 1.8%
for Q1’11

6
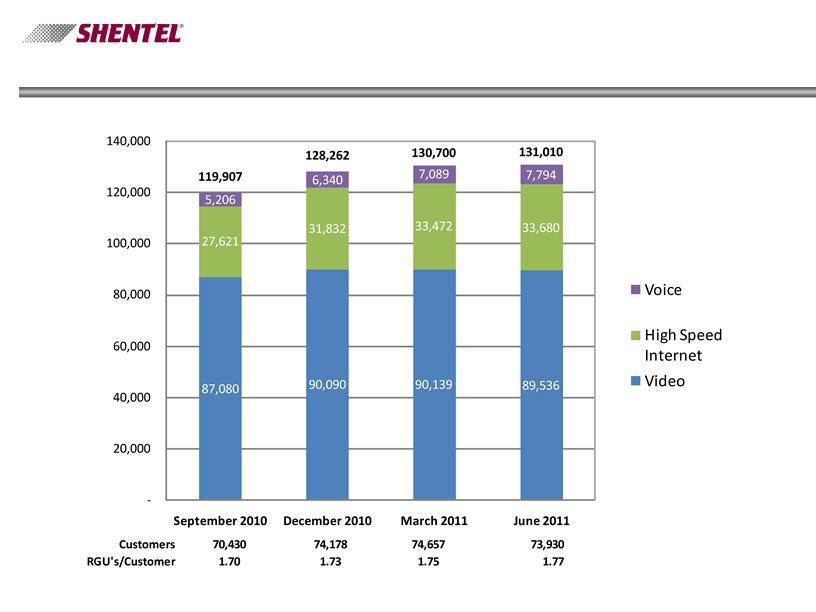
Cable Highlights
q Growth
u Total Cable RGUs 131 thousand at end of Q2 2011
q Triple Play
u Gains in digital video, high-speed Internet, and voice
services
services
q Cable Upgrades
u Former JetBroadband markets are approximately 10%
complete
complete
q Sales Momentum
u 2Q 2011 net RGU additions of 310, net of temporary
losses due to college students leaving for the summer
losses due to college students leaving for the summer
7
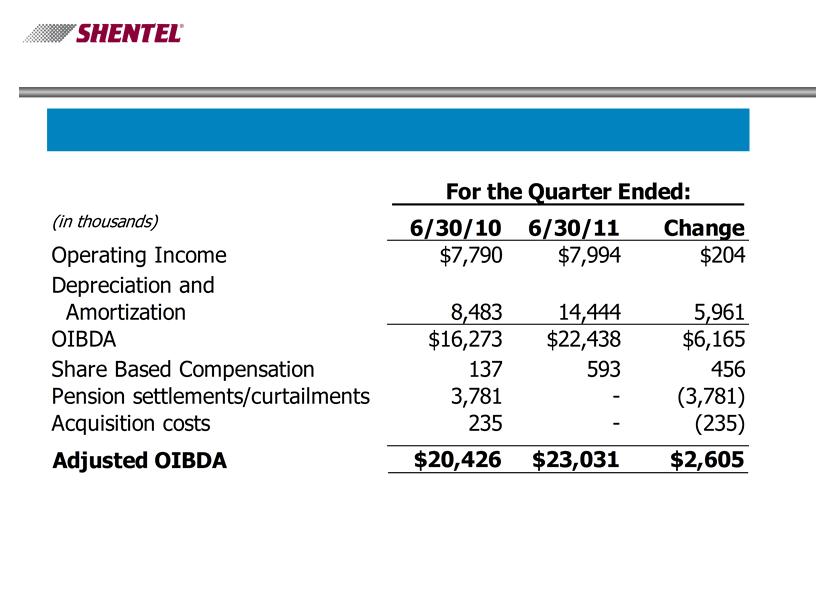
2011 Financial Highlights
q 2010 Pension Expense
- 2Q’10 is net of $2.1 million of
after-tax pension settlement
after-tax pension settlement
q Depreciation and
Amortization Expense
Amortization Expense
- Increased $3.4 million, after tax,
due to cable and prepaid sub
acquisitions
due to cable and prepaid sub
acquisitions
q Interest Expense
- Increased $1.6 million, after tax,
related to new debt required to
fund cable acquisition
related to new debt required to
fund cable acquisition
q Cable Growth
- Generated OIBDA of $1.4 million
Net Income
(in millions)
Net Income from Continuing Operations
(in millions)
(in millions)

8
Adele Skolits
CFO and VP of Finance
9
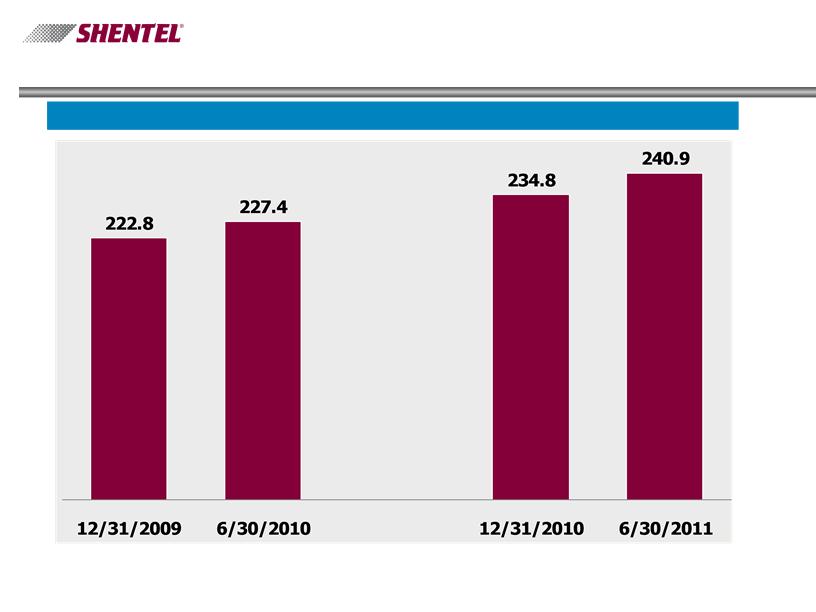
Profitability
Adjusted OIBDA ($ millions)
10
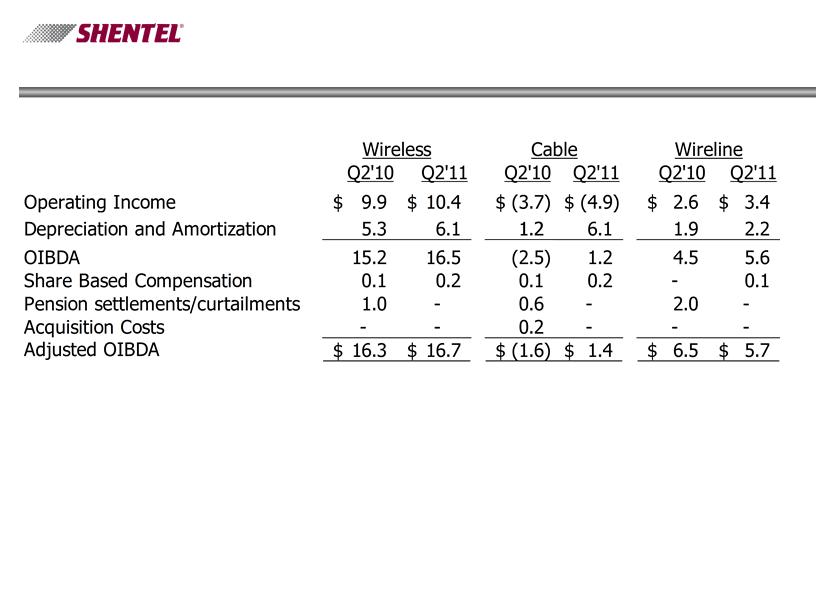
Adjusted OIBDA by Segment
11
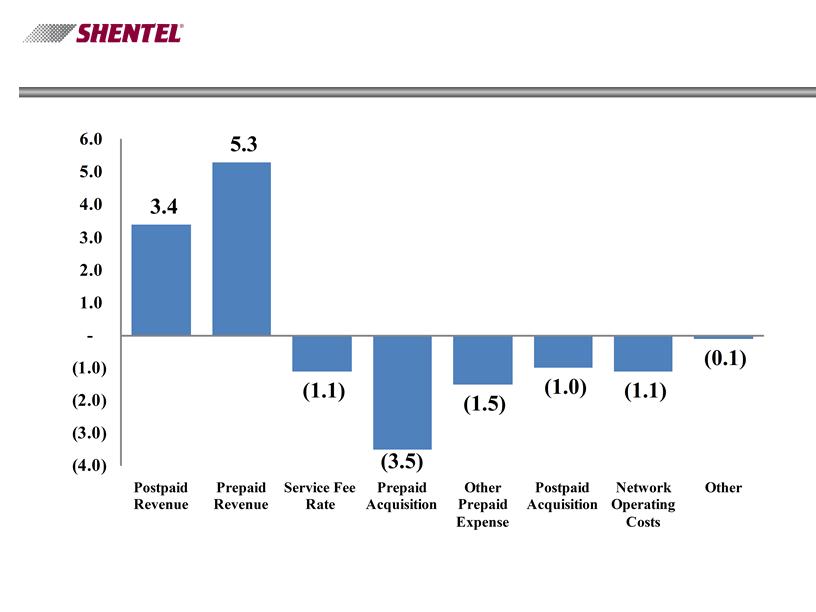
Wireless Segment - Change in Adjusted
OIBDA Q2’10 vs. Q2’11
OIBDA Q2’10 vs. Q2’11
12
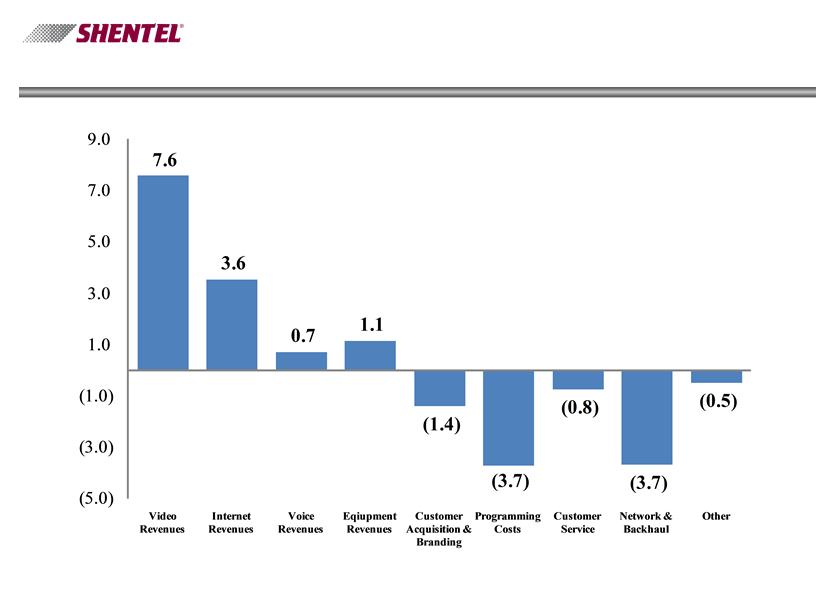
Cable Segment - Change in Adjusted
OIBDA Q2’10 vs. Q2’11
OIBDA Q2’10 vs. Q2’11
13
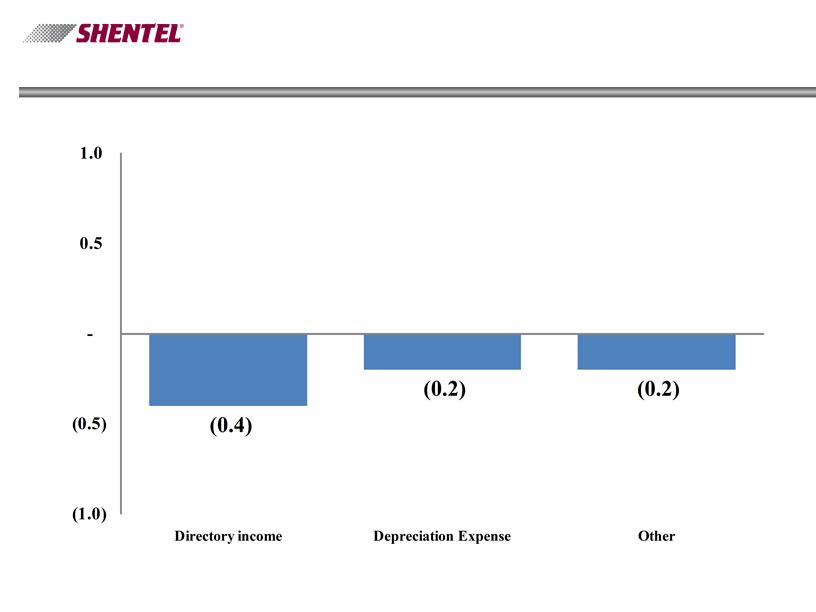
Wireline Segment - Change in Adjusted
OIBDA Q2’10 vs. Q2’11
OIBDA Q2’10 vs. Q2’11

14
Earle MacKenzie
EVP and COO
15
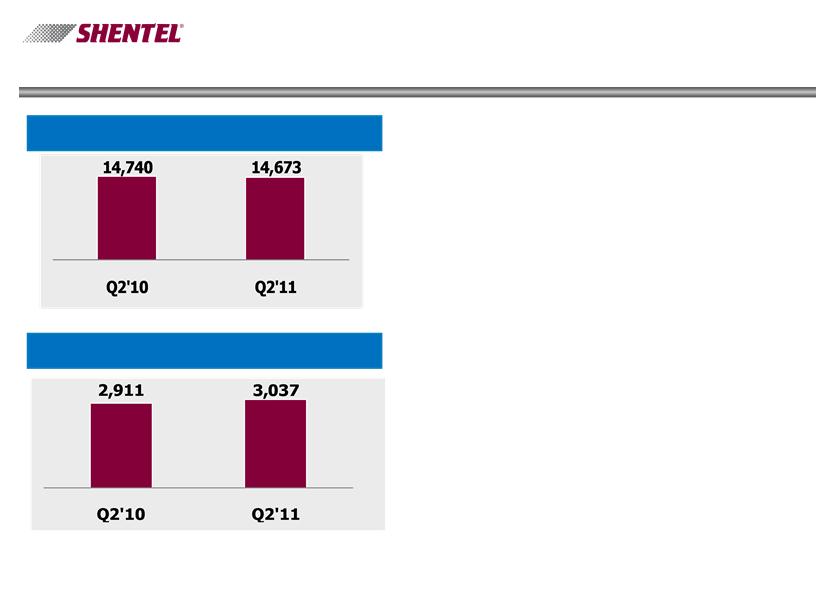
Key Operational Results - Wireless
PCS Postpaid Customers (000s)
16
Key Operational Results - Wireless
Gross Additions - Postpaid
Net Additions - Postpaid
n Q2 2011 net adds of
3,037, a 4% increase over
Q2 2010
3,037, a 4% increase over
Q2 2010
n Q2 2011 churn of 1.6%
improved from 1.7% in Q2
2010
improved from 1.7% in Q2
2010
17
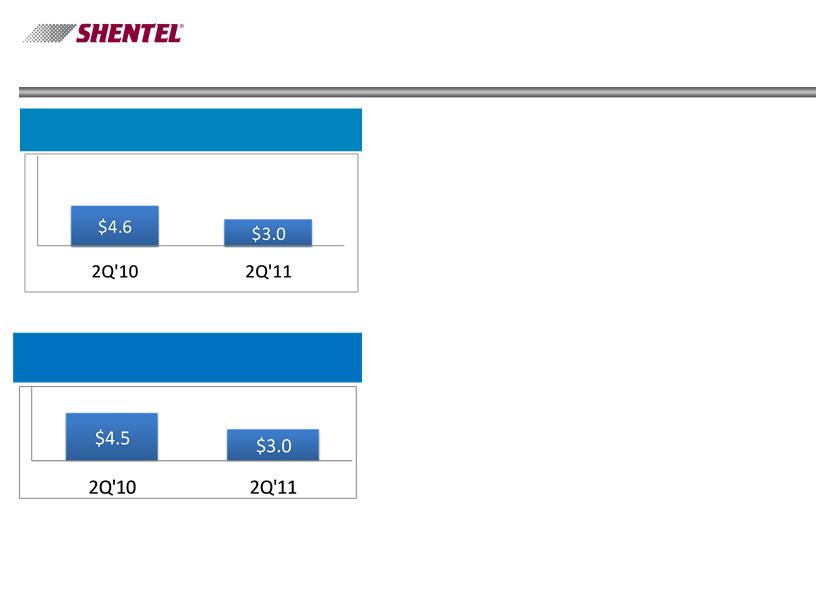
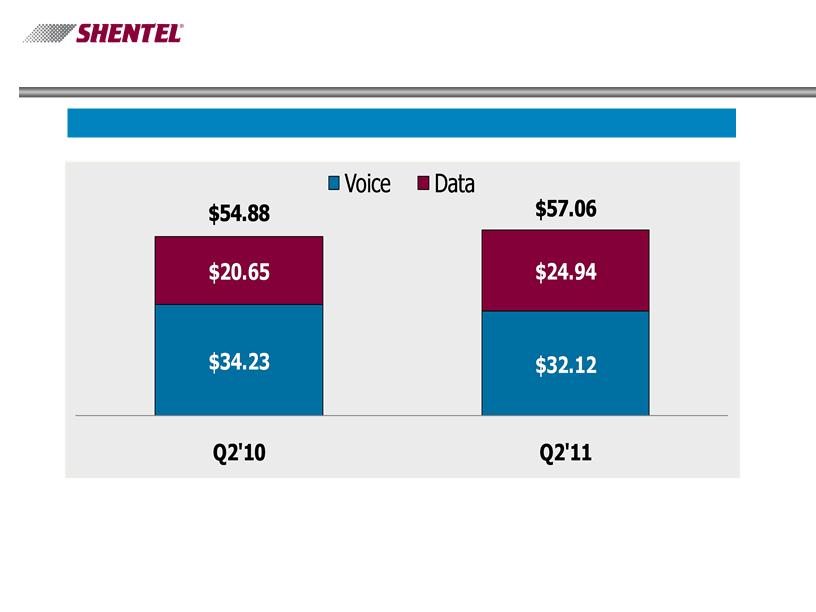
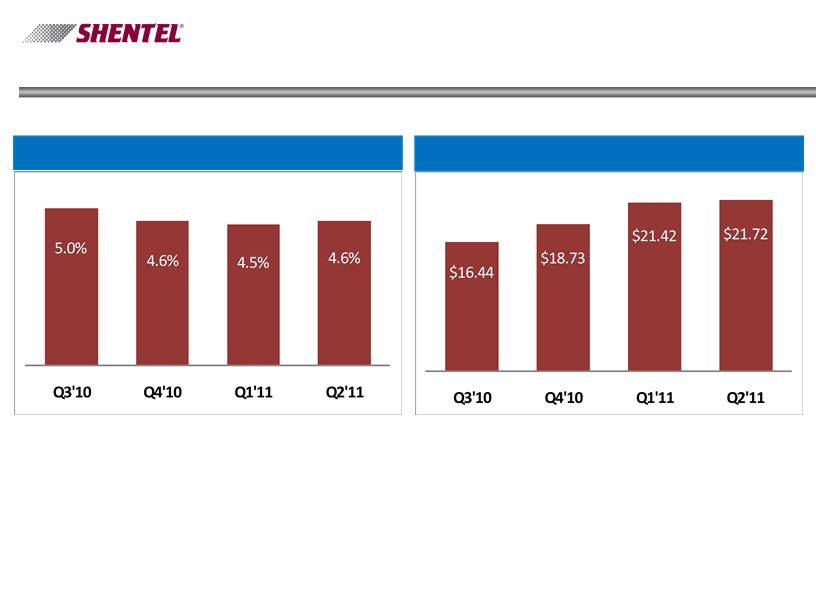
Key Operational Results - PCS
Gross Billed Revenue per Postpaid User - Data & Voice 1
1 - Before Service credits, bad debt, Sprint Nextel fees.
18
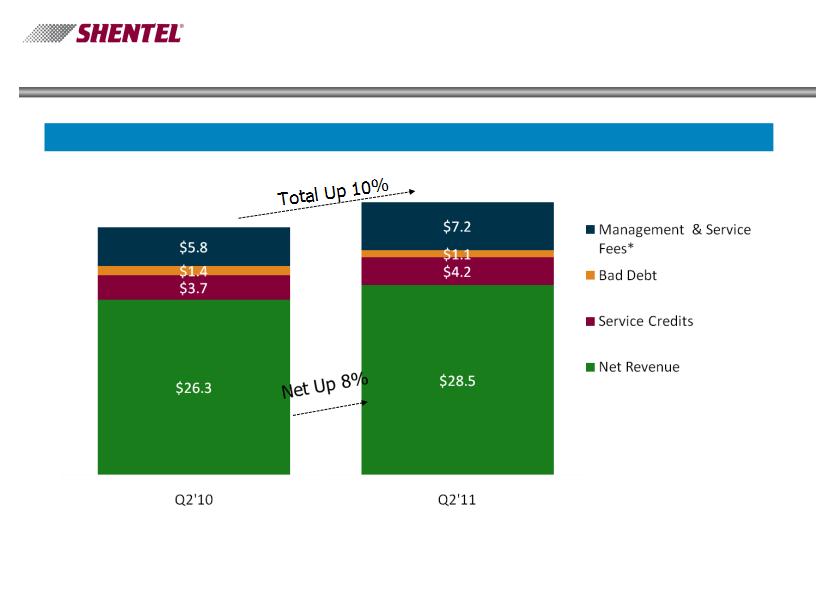
PCS Revenues
Gross Billed Revenues - Postpaid ($ millions)
$37.2
$41.0
*-The Net Service Fee percentage increased from 8.8% to 12% effective 6/1/10

19
Postpaid PCS Customers Top Picks Q2 2011
n Top Service Plans - 75% of
Gross Adds
Gross Adds
u Everything Data Family
1500 - 52%
1500 - 52%
u Everything 450 - 17%
u Everything Messaging
Family 1500 - 6%
Family 1500 - 6%
n Top Devices - New Activations
- All Channels
- All Channels
u LG Optimus 22%
u HTC EVO 4G 15%
u LG Rumor Touch 9%
u Sanyo Vero 7%
u Samsung Epic 4G 5%
u Mobile Data Cards 5%
u Mobile Computing 2%
20
PCS Prepaid Statistics
Gross Additions (000s)
Cumulative Customers
6/30/11 91,332
3/31/11 80,243
12/31/10 66,956
9/30/10 56,181
7/1/10 49,885
21
PCS Prepaid Statistics
Churn %
Average Gross Billed Revenue
22
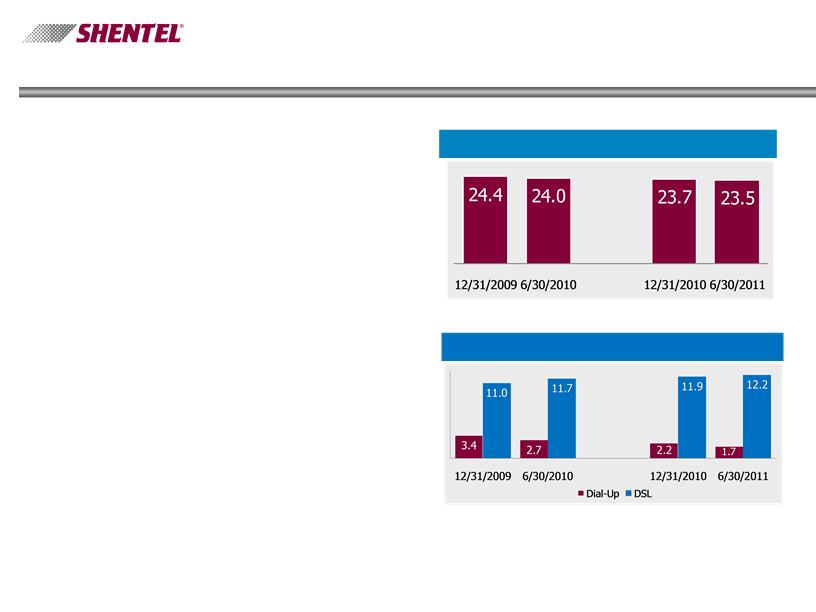
Key Operational Results - Wireline
n Modest access line loss
of 2% in past 12 months
of 2% in past 12 months
n Continued broadband
penetration in LEC area
to 52%
penetration in LEC area
to 52%
n 5% growth in DSL
customers since 6/30/10,
offsetting access line
losses to keep total
connections at 35.7
thousand
customers since 6/30/10,
offsetting access line
losses to keep total
connections at 35.7
thousand
Access lines (000s)
Internet Customers (000s)
23
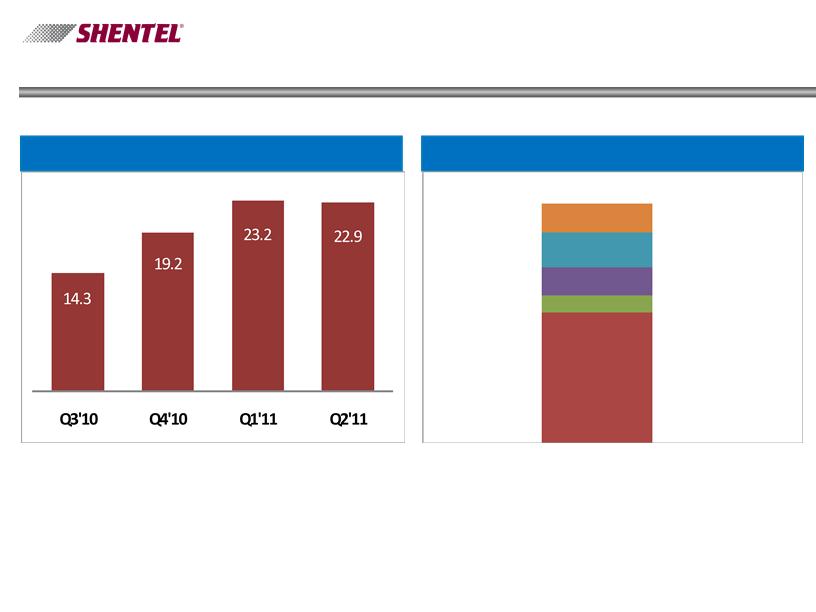
RGU Growth by Quarter - Cable
24
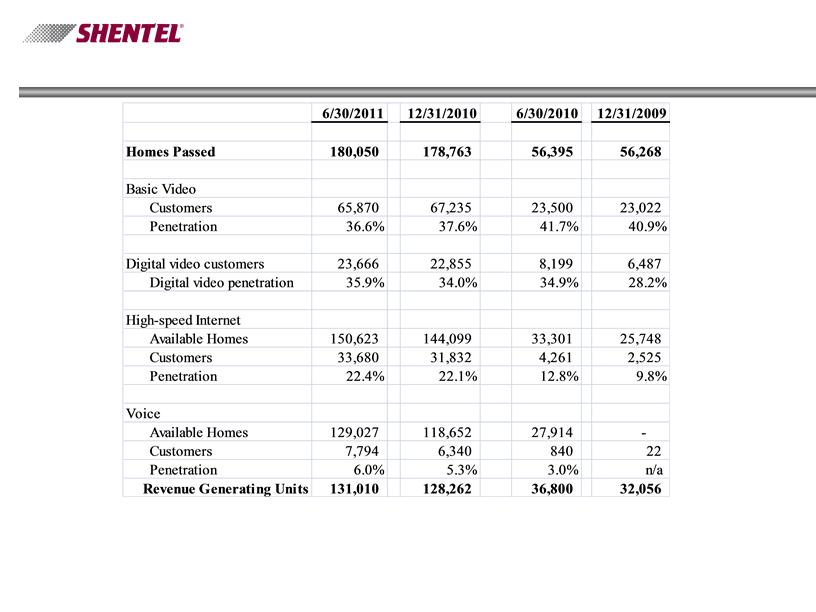
Key Operational Results - Cable
Note: Video homes passed includes 16K homes located in Shenandoah County, VA, where internet and
voice services are not available from the cable company.
voice services are not available from the cable company.
25
Investing in the Future
n Increased planned Wireless
spending for 2011 EVDO
growth
spending for 2011 EVDO
growth
n Upgrade of Jet Network is
approximately 10% complete
approximately 10% complete
n All Virginia systems upgrades
projected to be completed in
2011
projected to be completed in
2011
n West Virginia and Maryland
systems upgrades to be
completed in 2012
systems upgrades to be
completed in 2012
Capex Spending
$13.5

26
Q&A

27
Appendix

28
Non-GAAP Financial Measure - Billed Revenue per Postpaid Subscriber
|
Dollars in thousands (except subscribers and revenue per subscriber)
|
|
||
|
|
2Q 2010
|
|
2Q 2011
|
|
Gross billed revenue
|
|
|
|
|
|
|
|
|
|
Wireless segment total operating revenues
|
$ 30,031
|
|
$ 37,534
|
|
Equipment revenue
|
(1,287)
|
|
(1,059)
|
|
Tower Lease Revenue
|
(2,006)
|
|
(2,198)
|
|
Prepaid Net Service Revenues
|
|
|
(5,304)
|
|
Other revenue
|
(474)
|
|
(470)
|
|
Wireless service revenue - postpaid
|
26,264
|
|
28,503
|
|
Service credits
|
3,714
|
|
4,178
|
|
Write-offs
|
1,381
|
|
1,067
|
|
Management fee
|
2,606
|
|
2,887
|
|
Service fee
|
3,213
|
|
4,328
|
|
Gross billed revenue - postpaid
|
$ 37,178
|
|
$ 40,963
|
|
|
|
|
|
|
Average postpaid subscribers
|
225,824
|
|
239,308
|
|
|
|
|
|
|
Billed revenue per postpaid subscriber
|
54.88
|
|
57.06
|