Attached files
| file | filename |
|---|---|
| 8-K - FORM 8-K - S1 CORP /DE/ | c20760e8vk.htm |
Exhibit 99.1

| S1 Corporation Q2 2011 Earnings Call Presentation August 2, 2011 Copyright (c) 2011. S1 Corporation. All rights reserved. 1 |
| This presentation contains forward-looking statements. These forward-looking statements are not guarantees of future performance and are subject to risks and uncertainties that could cause actual results to differ materially from those contemplated by the forward-looking statements. These statements, including without limitation statements and projections regarding our revenue, expenses, Adjusted EBITDA, revenue backlog, capital expenditures, earnings per share, product development projects, future economic performance, management objectives or any transaction with Fundtech Ltd., are based on our beliefs as well as assumptions made using information currently available to us. Because these statements reflect our current views concerning future events, they involve risks, uncertainties and assumptions. Therefore, actual results may differ materially from those contemplated by the forward-looking statements. The forward-looking statements are made pursuant to the safe harbor provisions of the Private Securities Litigation Reform Act of 1995. All of the forward-looking statements are expressly qualified by the risk factors discussed in the Company's filings with the Securities and Exchange Commission ("SEC"). For a detailed discussion of these risk factors, please review the Company's filings with the SEC, including our Annual Report on Form 10-K for the fiscal year ended December 31, 2010, our Quarterly Report on Form 10-Q for the quarter ended March 30, 2011, and subsequent filings.Except as required by law, the Company will not update forward-looking statements over the course of future periods.For questions related to this information, please contact Paul Parrish, Chief Financial Officer, at 404- 923-3500 or paul.parrish@S1.com. Forward Looking Statements Copyright (c) 2011. S1 Corporation. All rights reserved. 2 |
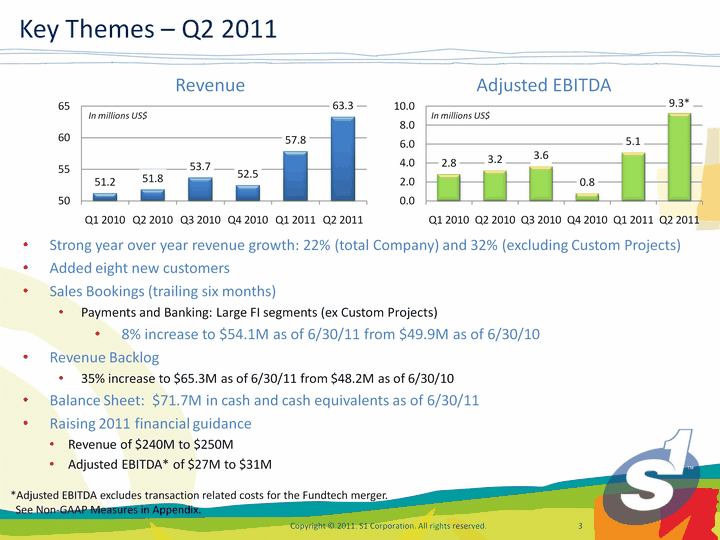
| Key Themes - Q2 2011 Strong year over year revenue growth: 22% (total Company) and 32% (excluding Custom Projects)Added eight new customersSales Bookings (trailing six months)Payments and Banking: Large FI segments (ex Custom Projects)8% increase to $54.1M as of 6/30/11 from $49.9M as of 6/30/10Revenue Backlog35% increase to $65.3M as of 6/30/11 from $48.2M as of 6/30/10Balance Sheet: $71.7M in cash and cash equivalents as of 6/30/11Raising 2011 financial guidanceRevenue of $240M to $250MAdjusted EBITDA* of $27M to $31M Copyright (c) 2011. S1 Corporation. All rights reserved. 3 Revenue (CHART) In millions US$ (CHART) In millions US$ Adjusted EBITDA *Adjusted EBITDA excludes transaction related costs for the Fundtech merger. See Non-GAAP Measures in Appendix. |

| State of the Business - Payments Segment Copyright (c) 2011. S1 Corporation. All rights reserved. 4 Revenue Sales Bookings (trailing six months)Increased to $22.7M as of 6/30/11 from $22.5M as of 6/30/10Revenue Backlog62% increase to $21.1M as of 6/30/11 from $13.0M as of 6/30/10Added three new customers includingA top 20 (by membership) credit union in the USAOne of the largest companies in India for their ATM processing operationA specialty retailer in the UK with more than 700 stores(CHART) In millions US$ (CHART) In millions US$ Adjusted EBITDA *Adjusted EBITDA excludes transaction related costs for the Fundtech merger. See Non-GAAP Measures in Appendix. |
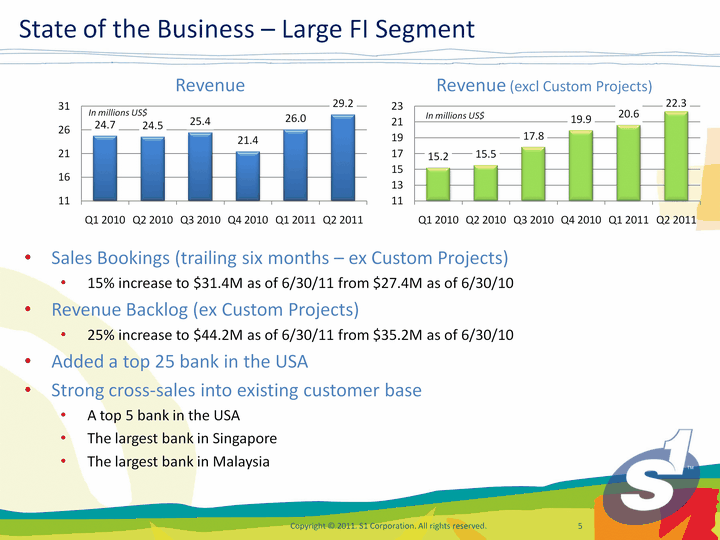
| State of the Business - Large FI Segment Copyright (c) 2011. S1 Corporation. All rights reserved. 5 Sales Bookings (trailing six months - ex Custom Projects)15% increase to $31.4M as of 6/30/11 from $27.4M as of 6/30/10Revenue Backlog (ex Custom Projects)25% increase to $44.2M as of 6/30/11 from $35.2M as of 6/30/10Added a top 25 bank in the USAStrong cross-sales into existing customer baseA top 5 bank in the USAThe largest bank in SingaporeThe largest bank in Malaysia Revenue (CHART) Revenue (excl Custom Projects)(CHART) In millions US$ |
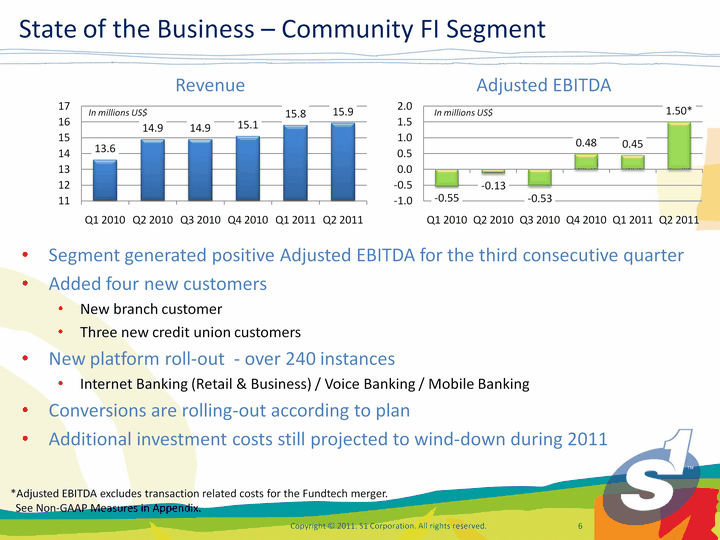
| State of the Business - Community FI Segment Copyright (c) 2011. S1 Corporation. All rights reserved. 6 Segment generated positive Adjusted EBITDA for the third consecutive quarterAdded four new customersNew branch customerThree new credit union customersNew platform roll-out - over 240 instancesInternet Banking (Retail & Business) / Voice Banking / Mobile BankingConversions are rolling-out according to planAdditional investment costs still projected to wind-down during 2011 Revenue (CHART) (CHART) Adjusted EBITDA *Adjusted EBITDA excludes transaction related costs for the Fundtech merger. See Non-GAAP Measures in Appendix. |
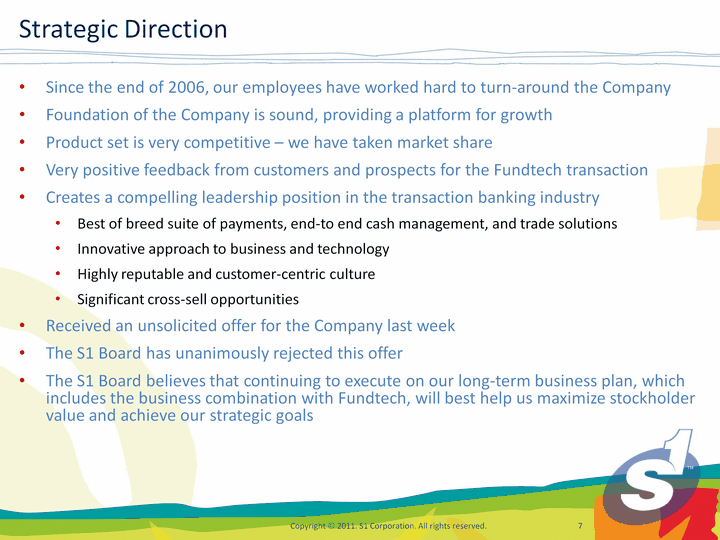
| Since the end of 2006, our employees have worked hard to turn-around the CompanyFoundation of the Company is sound, providing a platform for growthProduct set is very competitive - we have taken market shareVery positive feedback from customers and prospects for the Fundtech transactionCreates a compelling leadership position in the transaction banking industryBest of breed suite of payments, end-to end cash management, and trade solutions Innovative approach to business and technologyHighly reputable and customer-centric cultureSignificant cross-sell opportunitiesReceived an unsolicited offer for the Company last weekThe S1 Board has unanimously rejected this offerThe S1 Board believes that continuing to execute on our long-term business plan, which includes the business combination with Fundtech, will best help us maximize stockholder value and achieve our strategic goals Strategic Direction Copyright (c) 2011. S1 Corporation. All rights reserved. 7 |

| Financials Copyright (c) 2011. S1 Corporation. All rights reserved. 8 |
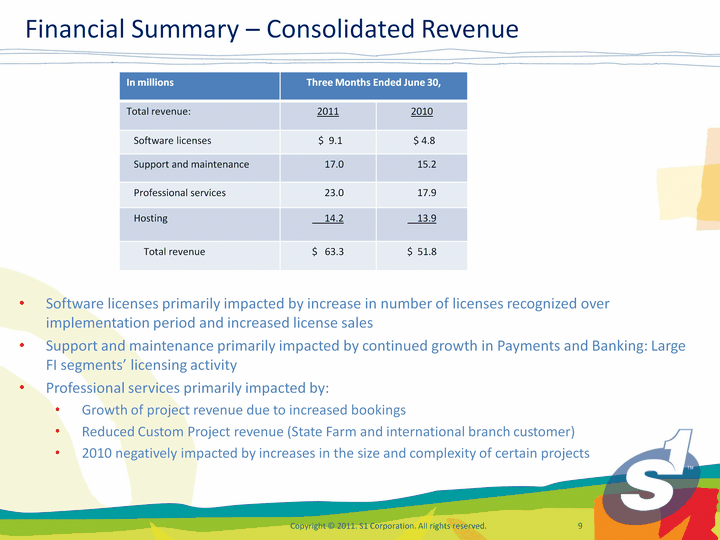
| Financial Summary - Consolidated Revenue Copyright (c) 2011. S1 Corporation. All rights reserved. 9 Software licenses primarily impacted by increase in number of licenses recognized over implementation period and increased license salesSupport and maintenance primarily impacted by continued growth in Payments and Banking: Large FI segments' licensing activityProfessional services primarily impacted by:Growth of project revenue due to increased bookingsReduced Custom Project revenue (State Farm and international branch customer) 2010 negatively impacted by increases in the size and complexity of certain projects In millions Three Months Ended June 30, Three Months Ended June 30, Total revenue: 2011 2010 Software licenses $ 9.1 $ 4.8 Support and maintenance 17.0 15.2 Professional services 23.0 17.9 Hosting 14.2 13.9 Total revenue $ 63.3 $ 51.8 |
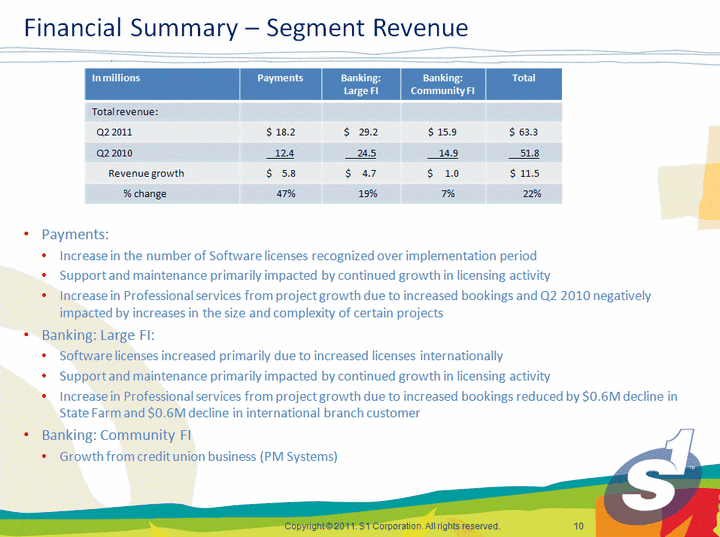
| Financial Summary - Segment Revenue Copyright (c) 2011. S1 Corporation. All rights reserved. 10 Payments:Increase in the number of Software licenses recognized over implementation periodSupport and maintenance primarily impacted by continued growth in licensing activityIncrease in Professional services from project growth due to increased bookings and Q2 2010 negatively impacted by increases in the size and complexity of certain projectsBanking: Large FI:Software licenses increased primarily due to increased licenses internationallySupport and maintenance primarily impacted by continued growth in licensing activityIncrease in Professional services from project growth due to increased bookings reduced by $0.6M decline in State Farm and $0.6M decline in international branch customerBanking: Community FIGrowth from credit union banking business (PM Systems) In millions Payments Banking: Large FI Banking: Community FI Total Total revenue: Q2 2011 $ 18.2 $ 29.2 $ 15.9 $ 63.3 Q2 2010 12.4 24.5 14.9 51.8 Revenue growth $ 5.8 $ 4.7 $ 1.0 $ 11.5 % change 47% 19% 7% 22% |
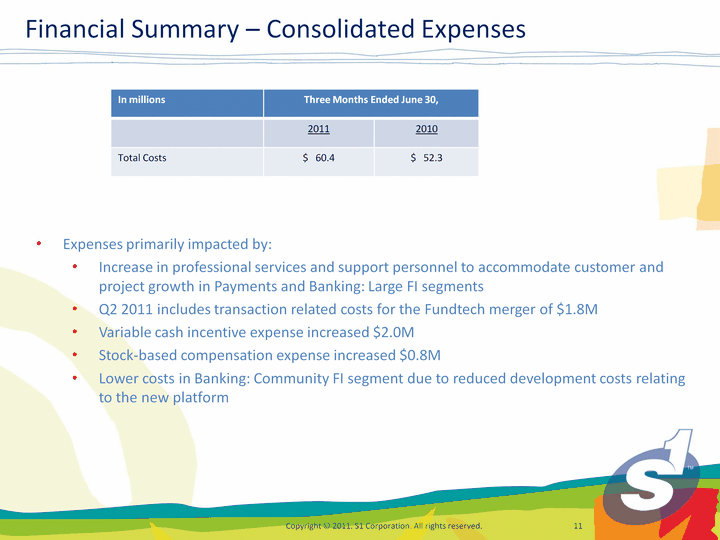
| Financial Summary - Consolidated Expenses Copyright (c) 2011. S1 Corporation. All rights reserved. 11 Expenses primarily impacted by:Increase in professional services and support personnel to accommodate customer and project growth in Payments and Banking: Large FI segmentsQ2 2011 includes transaction related costs for the Fundtech merger of $1.8MVariable cash incentive expense increased $2.0MStock-based compensation expense increased $0.8M Lower costs in Banking: Community FI segment due to reduced development costs relating to the new platform In millions Three Months Ended June 30, Three Months Ended June 30, 2011 2010 Total Costs $ 60.4 $ 52.3 |
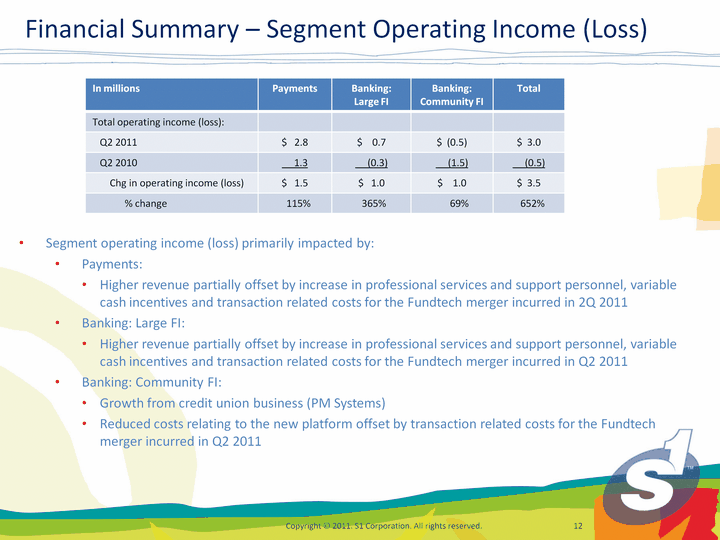
| Financial Summary - Segment Operating Income (Loss) Copyright (c) 2011. S1 Corporation. All rights reserved. 12 Segment operating income (loss) primarily impacted by:Payments:Higher revenue partially offset by increase in professional services and support personnel, variable cash incentives and transaction related costs for the Fundtech merger incurred in 2Q 2011Banking: Large FI:Higher revenue partially offset by increase in professional services and support personnel, variable cash incentives and transaction related costs for the Fundtech merger incurred in Q2 2011Banking: Community FI:Growth from credit union business (PM Systems)Reduced costs relating to the new platform offset by transaction related costs for the Fundtech merger incurred in Q2 2011 In millions Payments Banking: Large FI Banking: Community FI Total Total operating income (loss): Q2 2011 $ 2.8 $ 0.7 $ (0.5) $ 3.0 Q2 2010 1.3 (0.3) (1.5) (0.5) Chg in operating income (loss) $ 1.5 $ 1.0 $ 1.0 $ 3.5 % change 115% 365% 69% 652% |

| Financial Summary - Diluted Income (Loss) Per Share Copyright (c) 2011. S1 Corporation. All rights reserved. 13 Interest and other expense, net impacted primarily by increase in foreign exchange lossesU.S. NOLs total approximately $227M as of 6/30/11 In millions, except per share data Three Months Ended June 30, Three Months Ended June 30, 2011 2010 Operating income (loss) $ 3.0 $ (0.5) Interest and other expense, net (0.8) (0.4) Income tax expense (0.7) (0.9) Net income (loss) $ 1.5 $ (1.8) Diluted income (loss) per share $ 0.03 $ (0.03) Weighted average common shares outstanding - diluted 54.4 51.8 Adjusted EBITDA $ 9.3 $ 3.2 |
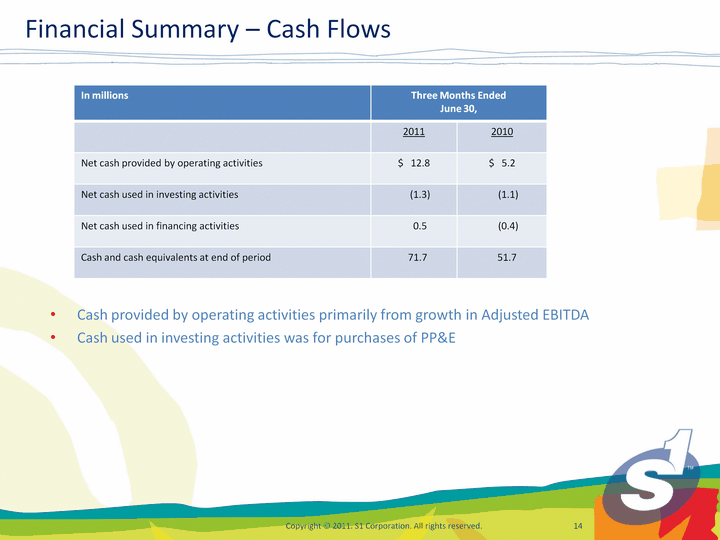
| Financial Summary - Cash Flows Copyright (c) 2011. S1 Corporation. All rights reserved. 14 Cash provided by operating activities primarily from growth in Adjusted EBITDACash used in investing activities was for purchases of PP&E In millions Three Months Ended June 30, Three Months Ended June 30, 2011 2010 Net cash provided by operating activities $ 12.8 $ 5.2 Net cash used in investing activities (1.3) (1.1) Net cash used in financing activities 0.5 (0.4) Cash and cash equivalents at end of period 71.7 51.7 |

| Closing Remarks Copyright (c) 2011. S1 Corporation. All rights reserved. 15 |
| Closing Remarks Copyright (c) 2011. S1 Corporation. All rights reserved. 16 Very pleased with the progress we made in the quarterShift in business model behind usContinue to see very good sales opportunities in the marketplaceFoundation of the Company is sound, providing a platform for growthProduct set is very competitive - we have taken market shareIncreased guidanceRevenue: $240M to $250MAdjusted EBITDA*: $27M to $31M *Adjusted EBITDA excludes transaction related costs for the Fundtech merger. See Non-GAAP Measures in Appendix. |

| Thank You Copyright (c) 2011. S1 Corporation. All rights reserved. 17 |

| Appendix Copyright (c) 2011. S1 Corporation. All rights reserved. 18 |

| This presentation includes references to Adjusted EBITDA, a non-GAAP financial measure, the most directly comparable U.S. GAAP equivalent of which is Net income for our consolidated results and Operating income for our segment results. We define Adjusted EBITDA as, in the case of our consolidated results, Net income plus interest and other expense (income), plus income taxes or, in the case of our segment results, Operating income, in each case adjusted for depreciation, amortization of intangibles, stock-based compensation expense and transaction related costs for the Fundtech merger. Although we believe our presentation of non-GAAP financial measures provide useful supplemental information to investors regarding our results of operations, our non- GAAP financial measures should only be considered in addition to, and not as a substitute for or superior to, our financial measures prepared in accordance with U.S. GAAP. The use of non-GAAP financial measures is subject to inherent limitations because they do not include all the expenses that must be included under U.S. GAAP and because they involve the exercise of management's judgment of which charges should properly be excluded from the non-GAAP financial measure. Management accounts for these limitations by not relying exclusively on non-GAAP financial measures, but only using such information to supplement U.S. GAAP financial results. Our non- GAAP financial measures may be different from such measures used by other companies. We believe that the presentation of this non-GAAP financial measure provides useful information to investors regarding our results of operations.A reconciliation of our non-GAAP financial measure to the most directly comparable financial measure calculated and presented in accordance with U.S. GAAP is detailed in the Appendix to this presentation. Non-GAAP Measures Copyright (c) 2011. S1 Corporation. All rights reserved. 19 |
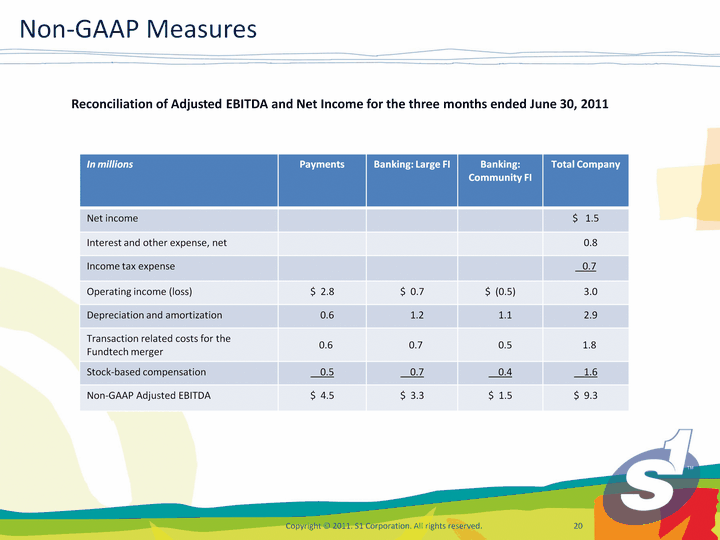
| Non-GAAP Measures Copyright (c) 2011. S1 Corporation. All rights reserved. 20 In millions Payments Banking: Large FI Banking: Community FI Total Company Net income $ 1.5 Interest and other expense, net 0.8 Income tax expense 0.7 Operating income (loss) $ 2.8 $ 0.7 $ (0.5) 3.0 Depreciation and amortization 0.6 1.2 1.1 2.9 Transaction related costs for the Fundtech merger 0.6 0.7 0.5 1.8 Stock-based compensation 0.5 0.7 0.4 1.6 Non-GAAP Adjusted EBITDA $ 4.5 $ 3.3 $ 1.5 $ 9.3 Reconciliation of Adjusted EBITDA and Net Income for the three months ended June 30, 2011 |
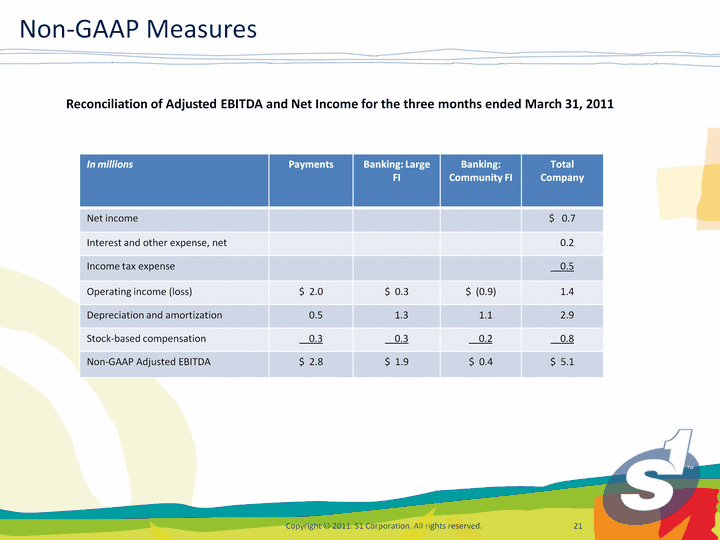
| Non-GAAP Measures Copyright (c) 2011. S1 Corporation. All rights reserved. 21 In millions Payments Banking: Large FI Banking: Community FI Total Company Net income $ 0.7 Interest and other expense, net 0.2 Income tax expense 0.5 Operating income (loss) $ 2.0 $ 0.3 $ (0.9) 1.4 Depreciation and amortization 0.5 1.3 1.1 2.9 Stock-based compensation 0.3 0.3 0.2 0.8 Non-GAAP Adjusted EBITDA $ 2.8 $ 1.9 $ 0.4 $ 5.1 Reconciliation of Adjusted EBITDA and Net Income for the three months ended March 31, 2011 |
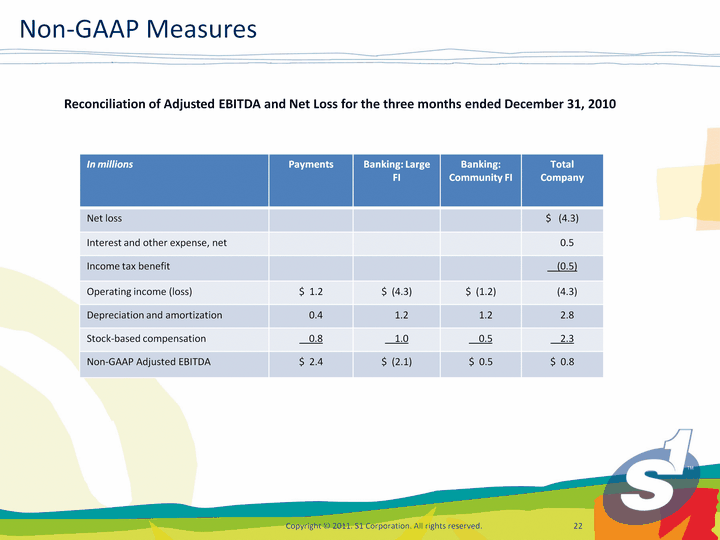
| Non-GAAP Measures Copyright (c) 2011. S1 Corporation. All rights reserved. 22 In millions Payments Banking: Large FI Banking: Community FI Total Company Net loss $ (4.3) Interest and other expense, net 0.5 Income tax benefit (0.5) Operating income (loss) $ 1.2 $ (4.3) $ (1.2) (4.3) Depreciation and amortization 0.4 1.2 1.2 2.8 Stock-based compensation 0.8 1.0 0.5 2.3 Non-GAAP Adjusted EBITDA $ 2.4 $ (2.1) $ 0.5 $ 0.8 Reconciliation of Adjusted EBITDA and Net Loss for the three months ended December 31, 2010 |
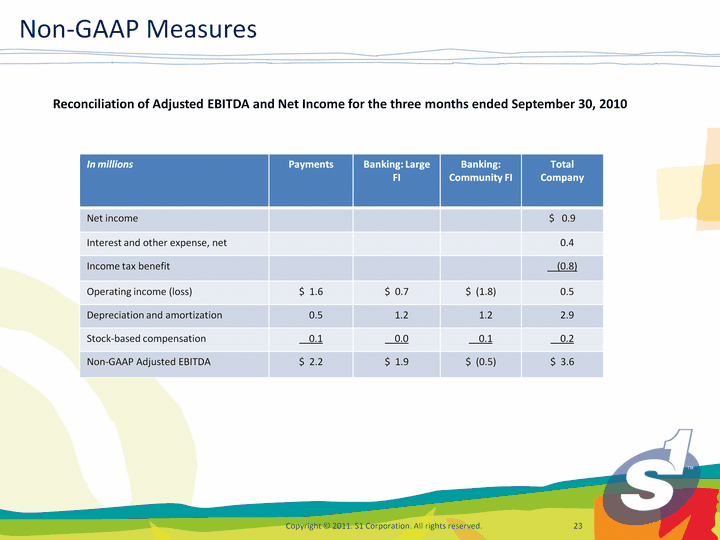
| Non-GAAP Measures Copyright (c) 2011. S1 Corporation. All rights reserved. 23 In millions Payments Banking: Large FI Banking: Community FI Total Company Net income $ 0.9 Interest and other expense, net 0.4 Income tax benefit (0.8) Operating income (loss) $ 1.6 $ 0.7 $ (1.8) 0.5 Depreciation and amortization 0.5 1.2 1.2 2.9 Stock-based compensation 0.1 0.0 0.1 0.2 Non-GAAP Adjusted EBITDA $ 2.2 $ 1.9 $ (0.5) $ 3.6 Reconciliation of Adjusted EBITDA and Net Income for the three months ended September 30, 2010 |

| Non-GAAP Measures Copyright (c) 2011. S1 Corporation. All rights reserved. 24 In millions Payments Banking: Large FI Banking: Community FI Total Company Net loss $ (1.8) Interest and other expense, net 0.4 Income tax expense 0.9 Operating income (loss) $ 1.3 $ (0.3) $ (1.5) (0.5) Depreciation and amortization 0.5 1.2 1.2 2.9 Stock-based compensation 0.3 0.3 0.2 0.8 Non-GAAP Adjusted EBITDA $ 2.1 $ 1.2 $ (0.1) $ 3.2 Reconciliation of Adjusted EBITDA and Net Loss for the three months ended June 30, 2010 |

| Non-GAAP Measures Copyright (c) 2011. S1 Corporation. All rights reserved. 25 In millions Payments Banking: Large FI Banking: Community FI Total Company Net loss $ (1.1) Interest and other expense, net 0.3 Income tax expense 0.7 Operating income (loss) $ 1.2 $ 0.2 $ (1.5) (0.1) Depreciation and amortization 0.5 1.1 0.9 2.5 Stock-based compensation 0.2 0.1 0.1 0.4 Non-GAAP Adjusted EBITDA $ 1.8 $ 1.5 $ (0.5) $ 2.8 Reconciliation of Adjusted EBITDA and Net Loss for the three months ended March 31, 2010 |
| This presentation contains an estimate of revenue backlog for our Payments and Banking: Large Financial Institution segments which is defined as an estimate of revenue for software licenses, including term licenses, professional services, and hosting services, in each case as specified in executed contracts that we believe will be recognized in revenue over the next 12 months. The portion of the estimate from our Banking: Large Financial Institution segment does not include revenue associated with the State Farm business or the custom development for an international branch customer ("Custom Projects").Our estimate of revenue backlog requires substantial judgment of our management, is based on a number of assumptions, which may turn out to be inaccurate or wrong, and is subject to a number of factors and uncertainties, many of which are outside of our control. Such assumptions, factors and uncertainties include, but are not limited to, the following:Revenue for term licenses and hosting services are the annualized amount expected over the next 12 months as of the date presented; Foreign currency exchange rates are assumed to remain constant over the 12 month period for contracts stated in currencies other than the U.S. Dollar; Perpetual licenses and professional services are based on current estimates of project completion over the next 12 months;Our customers may attempt to renegotiate or terminate their contracts for a number of reasons, including mergers, changes in their financial condition or general changes in economic conditions within their industries or geographic locations;We may experience delays in the development or delivery of products or services specified in customer contracts; andOur estimate is based on constant hosting transaction volumes, and changes in hosting transaction volumes may impact the amount of revenue actually recognized in future periods. Non-GAAP Measures Copyright (c) 2011. S1 Corporation. All rights reserved. 26 |
| Estimates of future financial results are inherently unreliable. Accordingly, there can be no assurance that the amounts included in our estimate of revenue backlog will be recognized over the next 12 months, or at all. Additionally, because our estimate of revenue backlog is an operating metric, it is not subject to the same level of internal review or control as a U.S. GAAP financial measure. We believe that presenting this estimate provides supplemental information and an alternative presentation useful to investors understanding trends in our business including the shift we have experienced towards recognizing more software license revenue using the percentage of completion method.The revenue backlog and sales bookings measures are considered non-GAAP financial measures as defined by SEC Regulation G. Although we believe our presentation of non-GAAP financial measures provides useful supplemental information to investors regarding our results of operations, our non-GAAP financial measures should only be considered in addition to, and not as a substitute for or superior to, our financial measures prepared in accordance with U.S. GAAP. The use of non-GAAP financial measures is subject to inherent limitations because they involve the exercise of management's judgment. Management accounts for these limitations by not relying exclusively on non-GAAP financial measures, but only using such information to supplement U.S. GAAP financial results. Our non-GAAP financial measures may be different from such measures used by other companies. We believe that the presentation of these non-GAAP financial measure provides useful information to investors regarding our results of operations. Non-GAAP Measures Copyright (c) 2011. S1 Corporation. All rights reserved. 27 |
| Additional Information and Where to Find It Additional Information and Where to Find ItIn connection with the proposed transaction with Fundtech, S1 and Fundtech intend to file relevant materials with the SEC and other governmental or regulatory authorities, including a proxy statement and information statement, respectively. INVESTORS ARE URGED TO READ THESE MATERIALS WHEN THEY BECOME AVAILABLE BECAUSE THEY WILL CONTAIN IMPORTANT INFORMATION ABOUT S1, FUNDTECH AND THE TRANSACTION. The proxy statement, information statement and certain other relevant materials (when they become available) and any other documents filed by S1 or Fundtech with the SEC may be obtained free of charge at the SEC's website at http://www.sec.gov. In addition, investors may obtain free copies of the documents filed with the SEC (i) by contacting S1's Investor Relations at (404) 923-3500 or by accessing S1's investor relations website at www.s1.com; or (ii) by contacting Fundtech's Investor Relations at (201) 946-1100 or by accessing Fundtech's investor relations website at www.fundtech.com. Investors are urged to read the proxy statement and information statement and the other relevant materials when they become available before making any voting or investment decision with respect to the transaction. 28 Copyright (c) 2011. S1 Corporation. All rights reserved. 28 |
| Additional Information and Where to Find It Participants in the Solicitation S1, Fundtech and their respective executive officers and directors may be deemed to be participating in the solicitation of proxies in connection with the transaction between the companies. Information about the executive officers and directors of S1 and the number of shares of S1's common stock beneficially owned by such persons is set forth in the proxy statement for S1's 2011 Annual Meeting of Stockholders which was filed with the SEC on April 8, 2011. Information about the executive officers and directors of Fundtech and the number of Fundtech's ordinary shares beneficially owned by such persons is set forth in the annual report on Form 20-F which was filed with the SEC on May 31, 2011. Investors may obtain additional information regarding the direct and indirect interests of S1, Fundtech and their respective executive officers and directors in the transaction by reading the proxy statement and information statement regarding the transaction with Fundtech when they become available.This communication shall not constitute an offer to sell or the solicitation of an offer to sell or the solicitation of an offer to buy any securities, nor shall there be any sale of securities in any jurisdiction in which such offer, solicitation or sale would be unlawful prior to registration or qualification under the securities laws of any such jurisdiction. 29 Copyright (c) 2011. S1 Corporation. All rights reserved. 29 |