Attached files
| file | filename |
|---|---|
| 8-K - OVERSEAS SHIPHOLDING GROUP INC | earn2q2011.htm |
| EX-99 - OVERSEAS SHIPHOLDING GROUP INC | earn2q2011ex99.htm |
Exhibit 99.2
Second Quarter Fiscal 2011 Earnings
Conference Call
Conference Call
August 2, 2011

page 2
This presentation contains forward-looking statements regarding the Company's prospects, including the outlook
for tanker and articulated tug barge markets, changing oil trading patterns, anticipated levels and timing of
newbuilding and scrapping, prospects for certain strategic alliances and investments, the prospects for, and
amounts of, future dividends, estimated TCE rates achieved for the third quarter of 2011, projected scheduled
drydock and off hire days for the two remaining fiscal quarters of 2011, projected locked-in charter revenue and
locked-in time charter days for the remaining six months of 2011 and 2012 through 2015 and thereafter,
forecasted 2011 vessel expenses, charter hire expenses, depreciation and amortization, general and
administrative expenses, interest expense, and levels of equity income and capital expenditures, the profitability
in 2011 of certain business units, ability to access capital markets, including Title XI financing, prospects of
OSG’s strategy of being a market leader in the segments in which it competes and the forecast of world
economic activity and oil demand. These statements are based on certain assumptions made by OSG
management based on its experience and perception of historical trends, current conditions, expected future
developments and other factors it believes are appropriate in the circumstances. Forward-looking statements
are subject to a number of risks, uncertainties and assumptions, many of which are beyond the control of OSG,
which may cause actual results to differ materially from those implied or expressed by the forward-looking
statements. Factors, risks and uncertainties that could cause actual results to differ from the expectations
reflected in these forward-looking statements are described in the Company’s Annual Report for 2010 on Form
10-K and those risks discussed in the other reports OSG files with the Securities and Exchange Commission.
Forward-Looking Statements

page 3
1 Based on Singapore 380 cst high sulfur fuel oil price
Financial Highlights
< Second quarter fiscal 2011 results reflected, in particular, continued weakness in
our International Crude markets
our International Crude markets
• TCE revenues were $207M, down 11% from $232M in 2Q2010 and flat with 1Q2011
• Reported net loss of $37.3M or $1.24 per diluted share
• Adjusted net loss of $36.1M or $1.20 per diluted share
< International Crude spot rates remained under pressure in Q2
• 2Q2011 Crude TCE revenues down 39% vs. 2Q2010 on 2% fewer revenue days
• 2Q2011 realized spot TCEs 28 - 62% lower vs. 2Q2010 for all Crude classes except
Lightering (+16%)
Lightering (+16%)
- VLCC 2Q2011 TCE: $20,400/day, - 54% vs. $44,399/day in 2Q2010
• Average Q2 fuel oil price 1: $660/mt, + 43% vs. 2Q2010 - has eaten more deeply into
TCEs
TCEs
< MRs: Q2 spot TCE of $15,153/day was up 30% on 2Q2010 and 18% sequentially
< U.S. Flag - continued improvement in revenue and operating income performance
< Continued containment of vessel expenses and G&A

page 4
Market Backdrop
< Downturn in Crude markets continues
• Supply absorption has slowed as demand surprises have all been negative in 2011
• Japanese earthquake in early March closed refineries and reduced crude imports in Q2
into Q3
into Q3
• Shut-in of Libyan crude exports hit Aframax market immediately
- Expected benefit to VLCCs and Suez on increased longer haul movements into Europe has not
materialized due to refinery maintenance and reduced crack spreads / refinery runs
materialized due to refinery maintenance and reduced crack spreads / refinery runs
• SPR release to reduce Q3 seaborne crude and products movements to OECD
• U.S. long-haul crude imports remain low - a linchpin to any recovery
• Increased Asian imports of cheaper Mideast sour crudes at expense of West African
crudes - negative tonne-mile impact
crudes - negative tonne-mile impact
< International Products markets remain volatile - Transatlantic trade impacted by:
- Mississippi River flooding in April/May
- Refinery maintenance in Atlantic basin
- European SPR release of products reduced local crack spreads and refinery runs
hindering U.S. diesel exports to Europe, European gasoline exports to U.S.
< Q3 spot TCEs booked to date are mostly below Q2 rates
• VLCC: Q3 booked to date is $16,500/day, vs. $20,400/day in 2Q2011 (down 19%)
• Aframax: Q3 booked to date is $9,000/day, vs. $10,390/day in 2Q2011 (down 13%)
• MR: Q3 booked to date is $12,000/day, vs. $15,153/day in 2Q2011 (down 21%)
page 5
Dividend Reduction Effective With 4th Quarter
Payment
Payment
< The Board has taken the following actions on the dividend:
• Reduced the annual dividend rate to $0.875 per share from $1.75
• Declared a quarterly dividend of $0.21875 per share payable on November 22, 2011 to
shareholders of record on November 7, 2011
shareholders of record on November 7, 2011
< The quarterly dividend of $0.4375 per share declared on June 7, 2011 is payable
on August 25, 2011 to shareholders of record on August 11, 2011
on August 25, 2011 to shareholders of record on August 11, 2011
< Revised dividend rate strikes the right balance among our goals of preserving
balance sheet strength, investing for long-term growth and returning cash to
shareholders
balance sheet strength, investing for long-term growth and returning cash to
shareholders
< OSG dividend remains competitive and reflects what we believe is an appropriate
level in today’s market
level in today’s market
< Dividend reduction is NOT lender-driven - we have comfortable liquidity and
covenant headroom
covenant headroom
< Economic and political uncertainty has grown throughout the year, increasing the
importance of prudent action-taking
importance of prudent action-taking

page 6
1 Includes all expenses, including allocated G&A.
What has NOT changed?
< We remain committed to reducing shoreside G&A and controlling cost at sea
• We expect to exceed the stretch G&A reductions we set for ourselves at the beginning of the year
• We continue to improve the economics of our chartered-in vessel portfolio by returning ships to their owners
and reducing rates on others
and reducing rates on others
• The fleet renewal program is virtually completed this year
• Vessel OPEX are well contained and we continue to improve operational metrics
< The Company remains committed to paying a dividend that is competitive and appropriate for the
markets we are in
markets we are in
• OSG has paid a dividend for 150 consecutive quarters
< Our view that the International Products market is in a cyclical upswing, with favorable supply and
demand economics, has not changed
demand economics, has not changed
• We expect rates to trend upward but with considerable volatility
• We expect a better contribution from this unit this year than last, with even better results over the next
several years
several years
< We continue to believe that our U.S. Flag business has turned the corner and is on course for a
steady improvement led by secular growth in coastwise demand and restrained supply of new
tonnage
steady improvement led by secular growth in coastwise demand and restrained supply of new
tonnage
• Positive contribution expected in 2011 compared with a $35M 1 operating loss in 2010
< We will continue to be patient on the acquisition front and not chase assets or swing for the fences
• Patience has served us well over the last 4 years - the market should present us with opportunities that stem
from other owners’ distress
from other owners’ distress
< Everyone in the Company remains focused on executing all those things within their control and
their efforts are paying off
their efforts are paying off
page 7
2010 Health, Safety and Environmental Report
is now posted on our website (on the SQ&E page)
is now posted on our website (on the SQ&E page)

page *
Financial Review
Myles Itkin, CFO
page 9
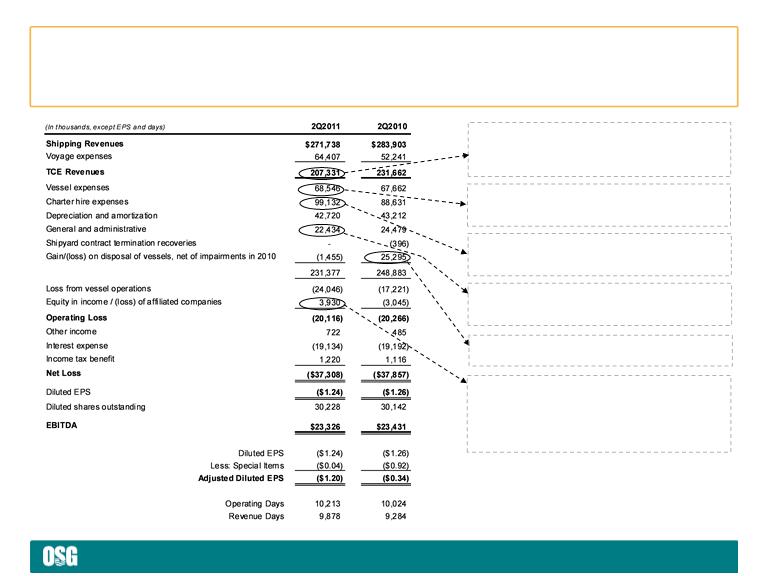
Reflects impact of lower spot rates and increase in spot
market exposure (from 74% of revenue days in 2Q2010
to 81% in 2Q2011) and higher bunker costs ($11.6M
higher quarter-over-quarter)
market exposure (from 74% of revenue days in 2Q2010
to 81% in 2Q2011) and higher bunker costs ($11.6M
higher quarter-over-quarter)
Both FSOs fully employed for quarter and continued to
earn service level bonuses. OSG’s share of FSO JV
income was $1.5M compared with a loss of $5.4M in
earn service level bonuses. OSG’s share of FSO JV
income was $1.5M compared with a loss of $5.4M in
2010 and reflects a $1.7M reduction in the
mark-to-market loss associated with the FSO Africa
interest rate swaps. (2011: LNG - $1.9M; ATC - $0.6M)
Reflects 284 more charter-in days during 2Q2011,
primarily in U.S. Flag Product Carriers, MRs and
Suezmax Tankers.
primarily in U.S. Flag Product Carriers, MRs and
Suezmax Tankers.
Reflects reductions of $0.7M in compensation costs
and $1.8M in legal and consulting fees; offset by
unfavorable F/X rates
Reflects costs associated with growth in U.S. Flag
operating fleet and return to service of OSG 209 from
layup. Average daily vessel expenses remain flat to
operating fleet and return to service of OSG 209 from
layup. Average daily vessel expenses remain flat to
down
Impairment charges on non-double hull vessels
($12.5M in U.S. Flag and $12.7M in Crude Lightering)
Financial Review - Income Statement

page 10
Reflects $117M drawn under revolving credit facility
and CEXIM facility, offset by $109M in expenditures
and CEXIM facility, offset by $109M in expenditures
for vessels and $27M in dividends paid to
shareholders
Overseas New Orleans delivered to buyers during
1Q2011
1Q2011
Decrease reflects $41M tax refund received in
January 2011
1 Short term investments consists of time deposits with maturities greater than 3 months
Includes CIP of $452M for 7 vessels and one tug
Includes deferred costs associated with forward start
facility (and other investments designed to offset the
mark-to-market movement in unfunded pension
obligations)
facility (and other investments designed to offset the
mark-to-market movement in unfunded pension
obligations)
Financial Review - Balance Sheet
page 11
|
Covenants on $1.8B facility 4
|
||
|
Covenant 2Q2011 Capacity
|
||
|
Maximum Leverage 5
< 60% |
45%
|
$1.7B add’l debt
|
|
Minimum Tangible Net Worth
³ $1.2B
|
$2.4B
|
$1.2B in losses
|
|
Minimum
Unencumbered Assets 6
³ 150%
|
224%
|
$0.7B new secured
debt on $1.0B of vessels |
1 Liquidity consists of Cash & Cash Equivalents, Short Term Investments and undrawn commitment under revolving credit facility (commitment reduced to $1.65B in February 2011).
2 Long-term debt reduced by Cash and Equivalents, Short Term Investments and Capital Construction Fund. 3 Reflects July amendments to certain construction contracts.
2 Long-term debt reduced by Cash and Equivalents, Short Term Investments and Capital Construction Fund. 3 Reflects July amendments to certain construction contracts.
4Prminary figures. 5 Funded indebtedness to total capitalization. 6 Unencumbered tangible assets to unsecured debt; capacity assumes 70% advance ratio.
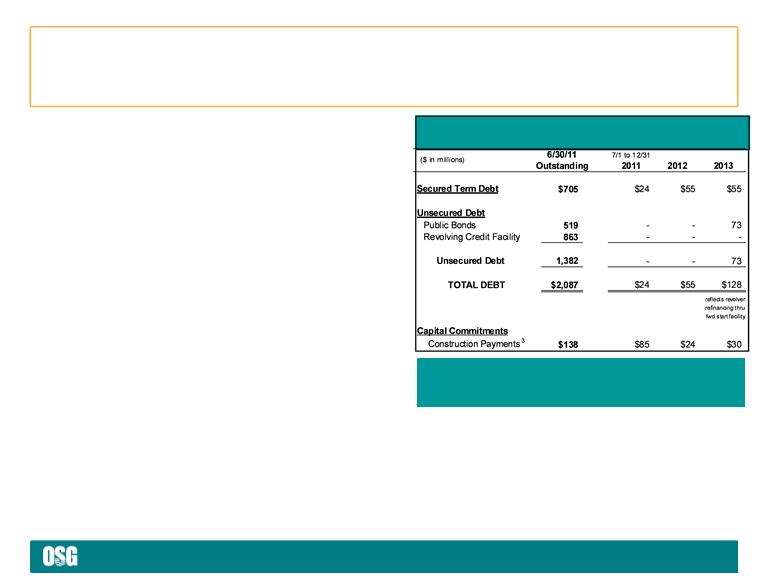
Debt Repayment and Capital Commitments
Enduring financial flexibility
< Strong liquidity and balance sheet
profile
profile
• $1.0B in liquidity 1
• Liquidity-adjusted debt 2 to capital =
51.4%
51.4%
• Manageable debt and refinancing
obligations over next two years
obligations over next two years
• Future construction commitments of
$138M 3 are fully funded
$138M 3 are fully funded
• Ample room within covenants
< Large unsecured asset base
• 70% of Vessel NBV is unsecured
< Superior access to capital markets
• $900M forward start facility in place
• First Title XI application ($211M)
approved
approved
• Second Title XI application
(~$215M) in approval process
(~$215M) in approval process

page 12
1 Reflects July amendments to certain construction contracts.
2011 Guidance
§ Estimated vessel expenses $290M to $305M
updated from $295M to $310M due to
delays in shipyard deliveries
< Time and bareboat charter hire expenses $380M to $395M
< Depreciation and amortization $180M to $190M
updated from $185M to $195M due to delays in
updated from $185M to $195M due to delays in
shipyard deliveries and timing of planned drydockings
< G&A $95M to $100M
< Equity income of affiliated companies $20M to $25M
< Interest expense $80M to $90M
updated from $90M to $100M due to
delay in Title XI, now expected late Q4
< Capital expenditures
– Drydock costs $46M for full year
(Q3 $24M and Q4 $11M on 22 vessels)
– Newbuild progress payments, vessel $197M for full year
improvements and capitalized interest 1 (Q3 $45M and Q4 $43M)

page *
Appendix

page 14
Special Items Affecting Net Loss
Set forth below are significant items of income and expense that affected the Company’s results for the three and six months ended June 30,
2011 and 2010, all of which are typically excluded by securities analysts in their published estimates of the Company’s financial results.
2011 and 2010, all of which are typically excluded by securities analysts in their published estimates of the Company’s financial results.
1 The U.S. Flag asset impairment charges have been tax effected from the pre-tax charge of $25.2 million.
Reconciling Items
page 15
EBITDA
EBITDA represents operating earnings before interest expense and income taxes, plus other income/(expense) and depreciation and
amortization expense. EBITDA is presented to provide investors with meaningful additional information that management uses to monitor ongoing
operating results and evaluate trends over comparative periods. EBITDA should not be considered a substitute for net income / (loss) or cash
flow from operating activities prepared in accordance with accounting principles generally accepted in the United States or as a measure of
profitability or liquidity. While EBITDA is frequently used as a measure of operating results and performance, it is not necessarily comparable to
other similarly titled captions of other companies due to differences in methods of calculation.
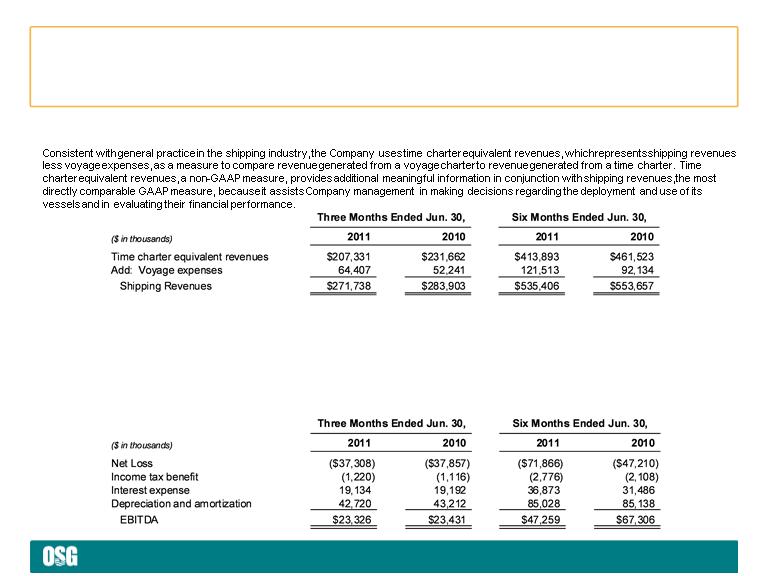
TCE Revenues
Reconciling Items (cont’d)
page 16
|
|
Owned
|
Chartered-in
|
Total
|
Newbuild
|
Total
|
|
VLCC
|
10
|
5
|
15
|
1
|
16
|
|
FSO
|
2
|
-
|
2
|
-
|
2
|
|
Suezmax
|
-
|
2
|
2
|
-
|
2
|
|
Aframax
|
6
|
3
|
9
|
2
|
11
|
|
Panamax
|
9
|
-
|
9
|
-
|
9
|
|
Lightering
|
2
|
4
|
6
|
-
|
6
|
|
Total Crude
|
29
|
14
|
43
|
3
|
46
|
|
LR1
|
4
|
2
|
6
|
1
|
7
|
|
MR *
|
15
|
20
|
35
|
3
|
38
|
|
Total Products
|
19
|
22
|
41
|
4
|
45
|
|
Product Carrier
|
2
|
10
|
12
|
-
|
12
|
|
Clean ATB
|
7
|
-
|
7
|
-
|
7
|
|
Lightering ATB
|
4
|
-
|
4
|
-
|
4
|
|
Total U.S. Flag
|
13
|
10
|
23
|
-
|
23
|
|
Total Gas
|
4
|
-
|
4
|
-
|
4
|
|
TOTAL
|
65
|
46
|
111
|
7
|
118
|
* Products MR operating fleet Includes 2 owned U.S. Flag MRs that trade internationally and a car carrier; Products MR newbuild fleet includes a
chemical tanker.
chemical tanker.
Fleet Composition - As of July 28, 2011

page 17
Off Hire and Scheduled Drydock
In addition to regular inspections by OSG personnel, all vessels are subject to periodic drydock, special survey and other scheduled or known
maintenance and repairs. The table below sets forth actual days off hire for the first and second quarters of 2011 and anticipated days off hire
for the above-mentioned events by vessel class for the third and fourth quarters of 2011.
maintenance and repairs. The table below sets forth actual days off hire for the first and second quarters of 2011 and anticipated days off hire
for the above-mentioned events by vessel class for the third and fourth quarters of 2011.
1 Includes one time chartered-in vessel that was off-hire for purposes of TCE revenue and charter hire expense until April termination of
charter-in commitment. 2 Includes conversion of Overseas Chinook to shuttle tanker. 3 Includes layup days on vessels sold in 1Q2011.
Off Hire Schedule
page 18
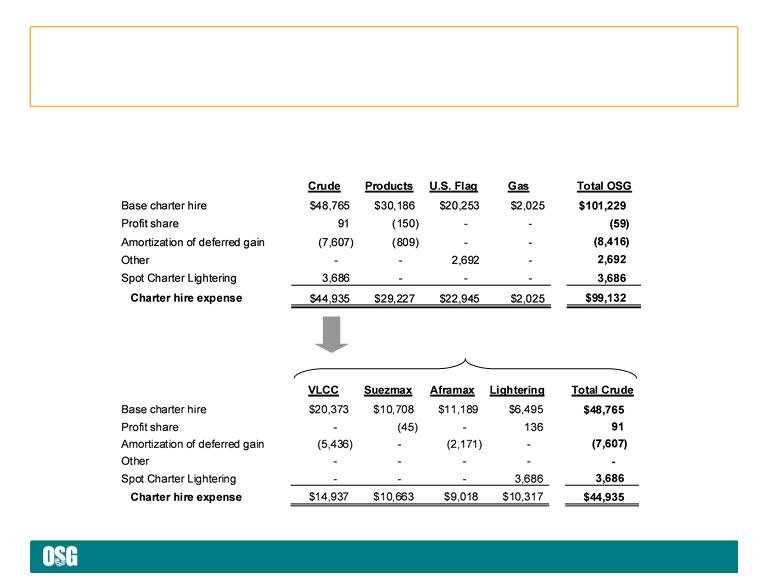
For the Quarter Ended June 30, 2011
($ in thousands)
Note: Vessels chartered-in for less than one year are not on the Company’s fleet list.
Charter Hire Expense by Segment

page 19
Locked-in Time Charter
Days by Segment
Days by Segment
Locked-in Time Charter
Revenue by Segment
Revenue by Segment
($ in 000)
Locked-in
Charter Revenue
Charter Revenue
($ in 000)
Note: Locked-in time charter days for 2011 are as of 6/30/11 and will differ from a more current date used in Appendices 3 and 4 in
the quarterly earnings press release.
Future Revenue $/Days by Segment - As of 6/30/11

page *
www.osg.com