Attached files
| file | filename |
|---|---|
| 8-K - FORM 8-K - GLU MOBILE INC | f59707e8vk.htm |
| EX-2.02 - EX-2.02 - GLU MOBILE INC | f59707exv2w02.htm |
| EX-2.01 - EX-2.01 - GLU MOBILE INC | f59707exv2w01.htm |
| EX-99.01 - EX-99.01 - GLU MOBILE INC | f59707exv99w01.htm |
| EX-99.02 - EX-99.02 - GLU MOBILE INC | f59707exv99w02.htm |
Exhibit 99.03
| Glu Mobile: Q2 Earnings Call Supplemental Handout August 2, 2011 |
| Page 2 Safe-Harbor Statement This presentation contains "forward-looking" statements including those regarding the expected benefits of our acquisitions of Blammo and Griptonite, our expectation that these acquisitions will double our studio capacity, our expectation that our smartphone revenues will increase by approximately 90% in the second half of 2012 compared with the second half of 2011, our expectation that we will be able to repurpose the Griptonite teams and begin generating freemium revenues from them by the second quarter of 2012, our guidance for the third quarter of 2011 and our target operating model. These forward-looking statements are subject to material risks and uncertainties that could cause actual results to differ materially from those in the forward-looking statements. Investors should consider important risk factors, which include: the risk that Glu will be unable to successfully integrate both acquired companies and its employees and achieve expected synergies, the risk that Glu will have difficulty retaining key employees of the acquired companies; the risk that growth of smartphones and advanced networks does not grow as significantly as we anticipate or that we will be unable to capitalize on any such growth; the risk that we do not realize a sufficient return on our investment with respect to our efforts to develop social, freemium games for smartphones and advanced platforms, the risk that our development expenses for games for smartphones are greater than we anticipate; the risk that our recently and newly launched games are less popular than anticipated; the risk that our newly released games will be of a quality less than desired by reviewers and consumers; the risk that the mobile games market, particularly with respect to social, freemium gaming, is smaller than anticipated; and other risks detailed under the caption "Risk Factors" in our Form 10-Q filed with the Securities and Exchange Commission on May 5, 2011 and our other SEC filings. You can locate these reports through our website at http://www.glu.com/investors. These "forward-looking" statements are based on estimates and information available to us on August 2, 2011 and we are under no obligation, and expressly disclaim any obligation, to update or alter our forward-looking statements whether as a result of new information, future events or otherwise. (c) Glu Mobile Inc. - Proprietary |
| Use of Non-GAAP Financial Measures Glu uses in this presentation certain non-GAAP measures of financial performance. The presentation of these non- GAAP financial measures is not intended to be considered in isolation from, as a substitute for, or superior to, the financial information prepared and presented in accordance with GAAP, and may be different from non-GAAP financial measures used by other companies. In addition, these non-GAAP measures have limitations in that they do not reflect all of the amounts associated with Glu's results of operations as determined in accordance with GAAP. The non-GAAP financial measures used by Glu include non-GAAP revenues, non-GAAP smartphone revenues, non-GAAP freemium revenues, non-GAAP gross margins and non-GAAP operating profit. These non-GAAP financial measures exclude the following items from Glu's unaudited consolidated statements of operations: Change in deferred revenues and costs of revenues; Amortization of intangible assets; Stock-based compensation expense; Restructuring charges; MIG earnout expenses; and Foreign currency exchange gains and losses primarily related to the revaluation of assets and liabilities. Glu believes that these non-GAAP financial measures, when taken together with the corresponding GAAP financial measures, provide meaningful supplemental information regarding Glu's performance by excluding certain items that may not be indicative of Glu's core business, operating results or future outlook. Glu's management uses, and believes that investors benefit from referring to, these non-GAAP financial measures in assessing Glu's operating results, as well as when planning, forecasting and analyzing future periods. These non-GAAP financial measures also facilitate comparisons of Glu's performance to prior periods. For a reconciliation of these non-GAAP financial measures to their most directly comparable GAAP financial measures, please refer to the tables attached to Glu's earnings press release for the quarter ended June 30, 2011, which is available on our website at http://www.glu.com/investors. |
| Q211 Financial Update |
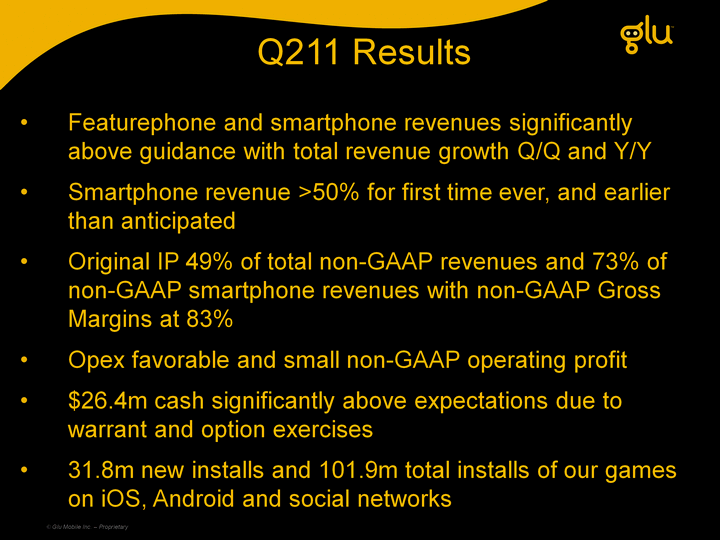
| Q211 Results (c) Glu Mobile Inc. - Proprietary Featurephone and smartphone revenues significantly above guidance with total revenue growth Q/Q and Y/Y Smartphone revenue >50% for first time ever, and earlier than anticipated Original IP 49% of total non-GAAP revenues and 73% of non-GAAP smartphone revenues with non-GAAP Gross Margins at 83% Opex favorable and small non-GAAP operating profit $26.4m cash significantly above expectations due to warrant and option exercises 31.8m new installs and 101.9m total installs of our games on iOS, Android and social networks |
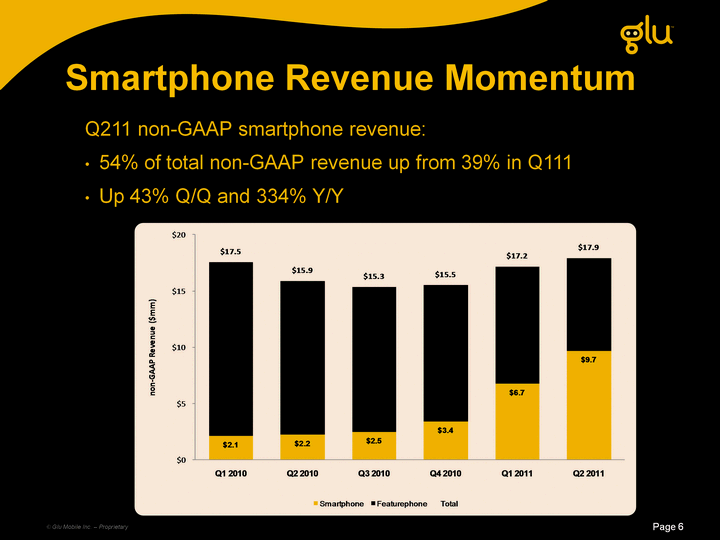
| Q211 non-GAAP smartphone revenue: 54% of total non-GAAP revenue up from 39% in Q111 Up 43% Q/Q and 334% Y/Y Page 6 Smartphone Revenue Momentum (c) Glu Mobile Inc. - Proprietary (in millions of dollars) |
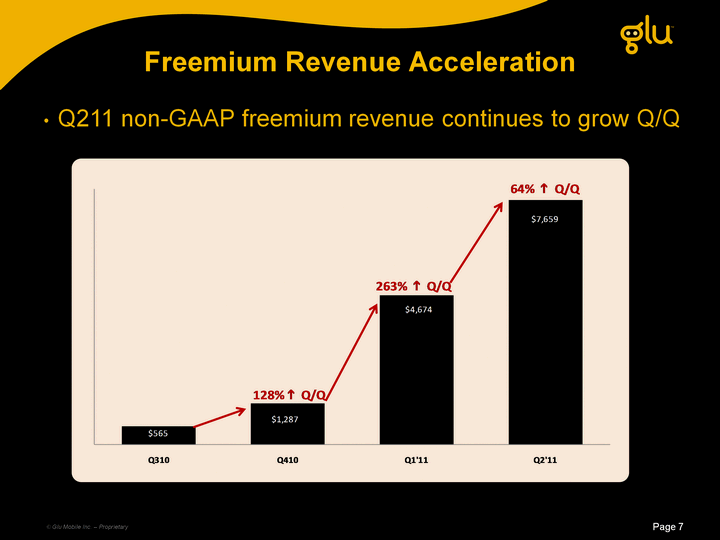
| Q211 non-GAAP freemium revenue continues to grow Q/Q Page 7 Freemium Revenue Acceleration (in thousands of dollars) (c) Glu Mobile Inc. - Proprietary |
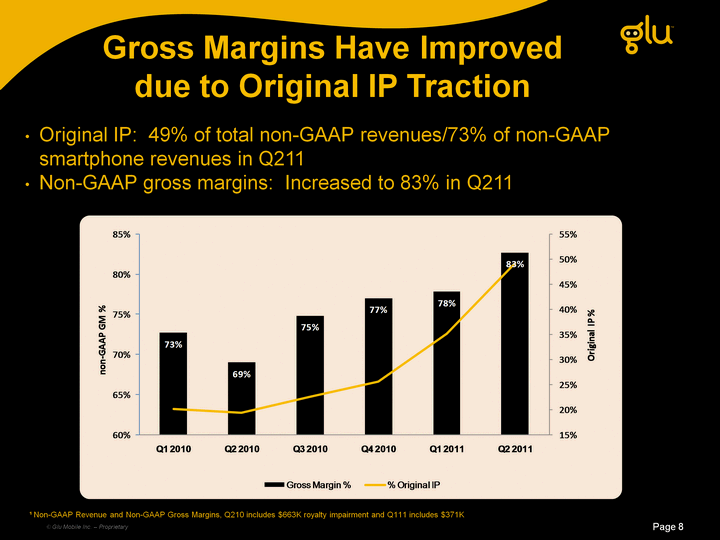
| Gross Margins Have Improved due to Original IP Traction Original IP: 49% of total non-GAAP revenues/73% of non-GAAP smartphone revenues in Q211 Non-GAAP gross margins: Increased to 83% in Q211 Page 8 1 Non-GAAP Revenue and Non-GAAP Gross Margins, Q210 includes $663K royalty impairment and Q111 includes $371K (c) Glu Mobile Inc. - Proprietary |
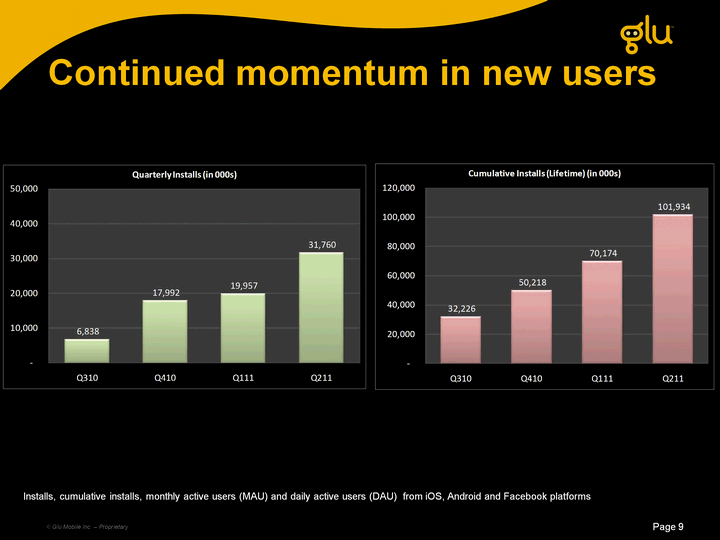
| Page 9 Continued momentum in new users (c) Glu Mobile Inc. - Proprietary Installs, cumulative installs, monthly active users (MAU) and daily active users (DAU) from iOS, Android and Facebook platforms |
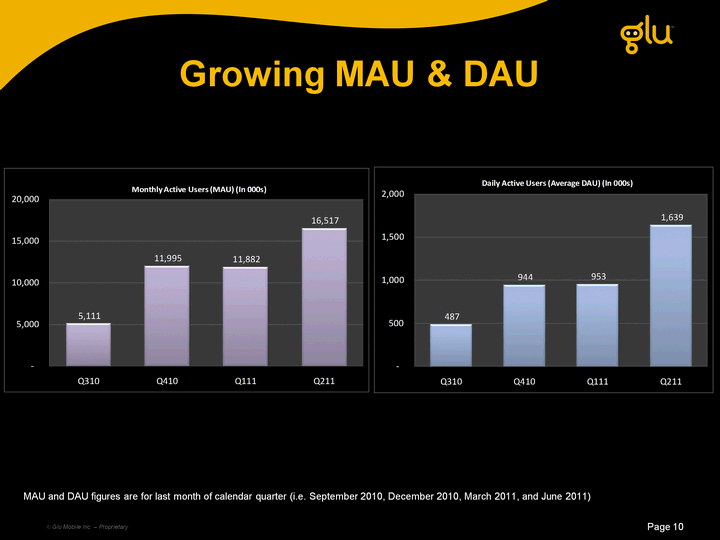
| Page 10 Growing MAU & DAU (c) Glu Mobile Inc. - Proprietary MAU and DAU figures for Q410 are averages for December 2010 and for Q111 are averages for January 2011. MAU and DAU figures are for last month of calendar quarter (i.e. September 2010, December 2010, March 2011, and June 2011) |
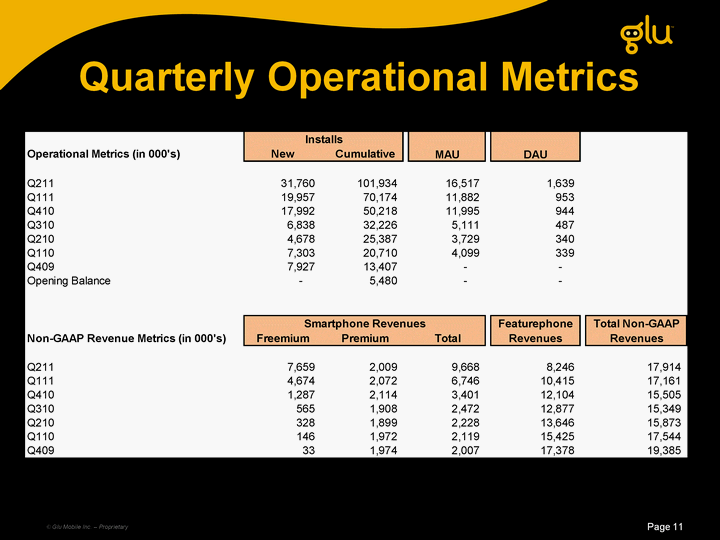
| Page 11 Quarterly Operational Metrics (c) Glu Mobile Inc. - Proprietary |

| Product |

| Android Strength (c) Glu Mobile Inc. - Proprietary Page 13 New Android storefront positive for Glu titles |

| Android Strength (c) Glu Mobile Inc. - Proprietary Page 14 Recent Updates to Contract Killer & Gun Bros projected both titles into the Top 20 Grossing |

| Apple App Store (c) Glu Mobile Inc. - Proprietary Page 15 Eternity Warriors peaked at #8 in Free Apps on the App Store and achieved over 170K downloads per day |

| Apple App Store (c) Glu Mobile Inc. - Proprietary Page 16 Gun Bros Multiplayer Featuring at launch |

| iOS CPX Advertising Update |
| CPI Page 18 Eliminated by Apple in Q211 All other advertising not impacted Reduces monetization rates of Glu advertizing real estate CPI alive and well on Android (c) Glu Mobile Inc. - Proprietary |
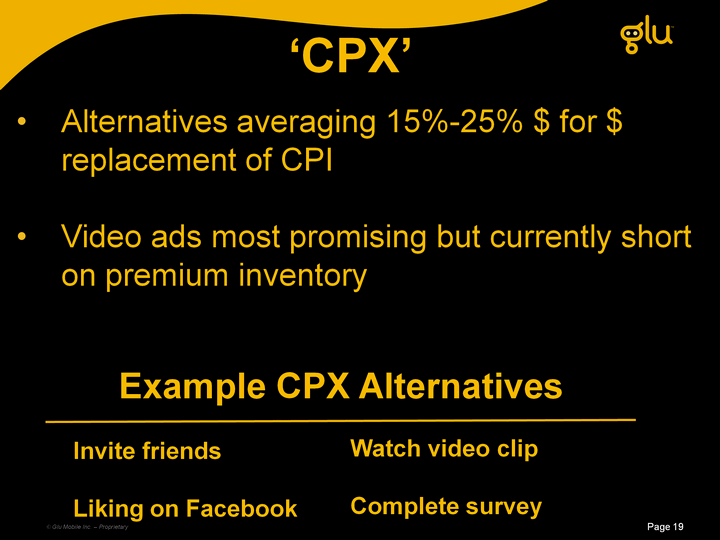
| 'CPX' Page 19 Alternatives averaging 15%-25% $ for $ replacement of CPI Video ads most promising but currently short on premium inventory Example CPX Alternatives Invite friends Liking on Facebook Watch video clip Complete survey (c) Glu Mobile Inc. - Proprietary |
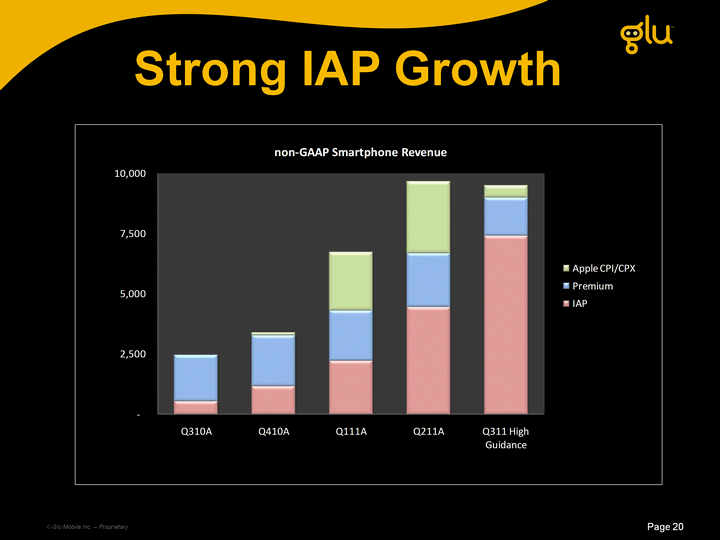
| Strong IAP Growth Page 20 (c) Glu Mobile Inc. - Proprietary |

| Acquisitions |
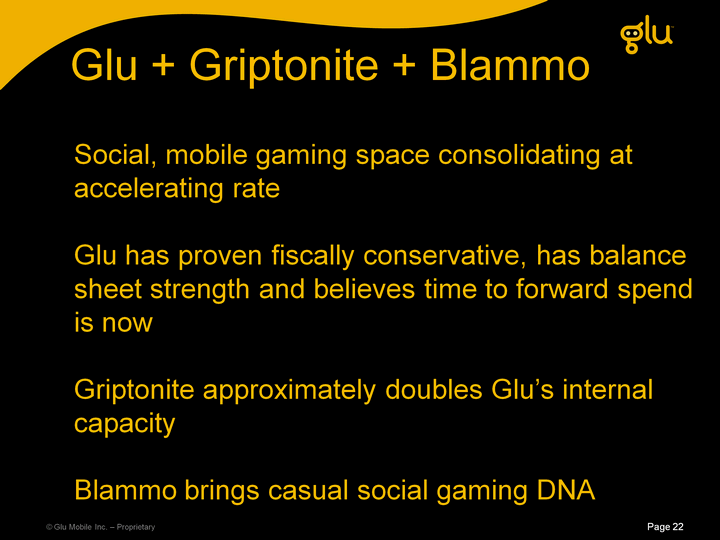
| Social, mobile gaming space consolidating at accelerating rate Glu has proven fiscally conservative, has balance sheet strength and believes time to forward spend is now Griptonite approximately doubles Glu's internal capacity Blammo brings casual social gaming DNA (c) Glu Mobile Inc. - Proprietary Page 22 Glu + Griptonite + Blammo |

| (c) Glu Mobile Inc. - Proprietary Page 23 |
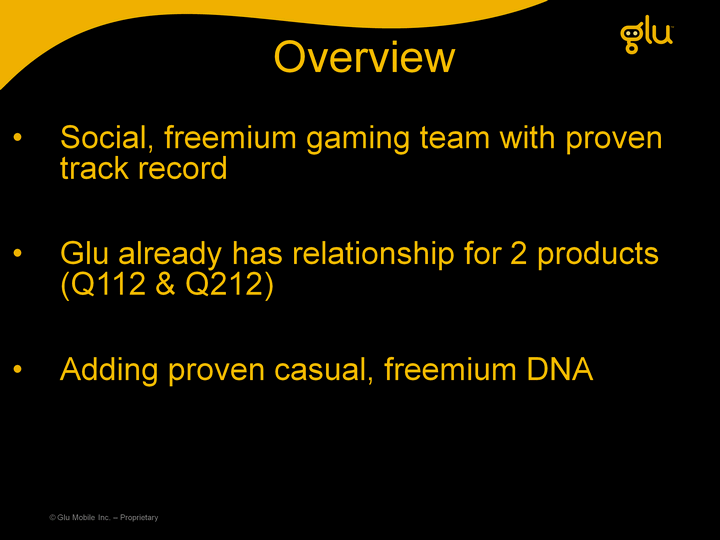
| Overview Social, freemium gaming team with proven track record Glu already has relationship for 2 products (Q112 & Q212) Adding proven casual, freemium DNA (c) Glu Mobile Inc. - Proprietary |
| Blammo Games (c) Glu Mobile Inc. - Proprietary Page 25 1m shares now plus earnout for maximum of 3,312,937 more over 3.5 years Creating 'Glu Toronto' with 'Top Ten Grossing' casual DNA : Smurfs' Village Zombie Cafe Lil' Pirates |
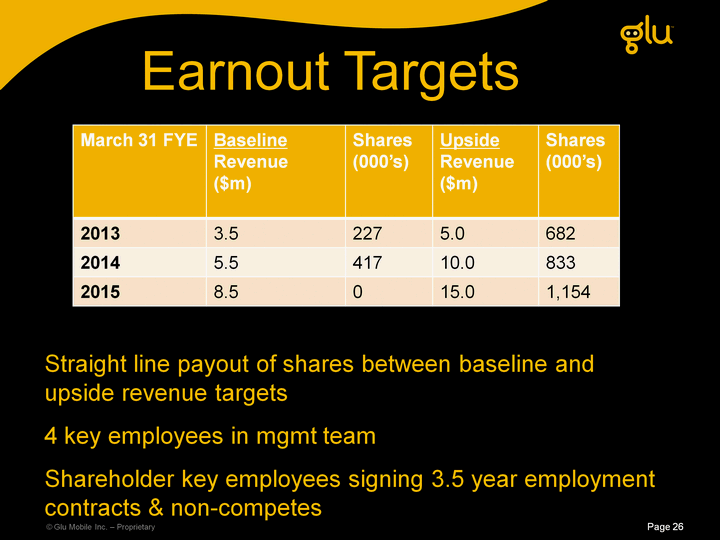
| Earnout Targets (c) Glu Mobile Inc. - Proprietary Page 26 March 31 FYE BaselineRevenue($m) Shares(000's) UpsideRevenue($m) Shares(000's) 2013 3.5 227 5.0 682 2014 5.5 417 10.0 833 2015 8.5 0 15.0 1,154 Straight line payout of shares between baseline and upside revenue targets 4 key employees in mgmt team Shareholder key employees signing 3.5 year employment contracts & non-competes |
| (c) Glu Mobile Inc. - Proprietary Page 27 |
| Overview Handheld work for hire studio in Kirkland Washington Acquired balance sheet supports repurposing to freemium/social Acquiring 10+ teams with first freemium products expected to launch Q212 Strong and stable mgmt team (c) Glu Mobile Inc. - Proprietary |
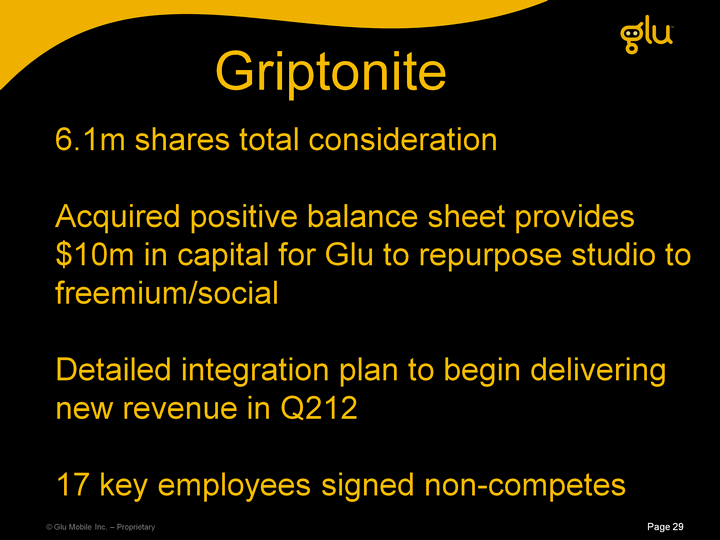
| 6.1m shares total consideration Acquired positive balance sheet provides $10m in capital for Glu to repurpose studio to freemium/social Detailed integration plan to begin delivering new revenue in Q212 17 key employees signed non-competes (c) Glu Mobile Inc. - Proprietary Page 29 Griptonite |
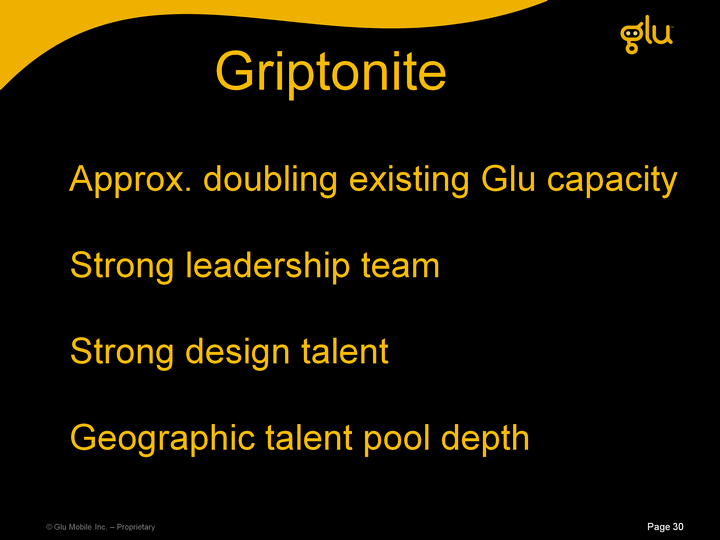
| Approx. doubling existing Glu capacity Strong leadership team Strong design talent Geographic talent pool depth (c) Glu Mobile Inc. - Proprietary Page 30 Griptonite |

| Q311 Guidance and Long Term Model |
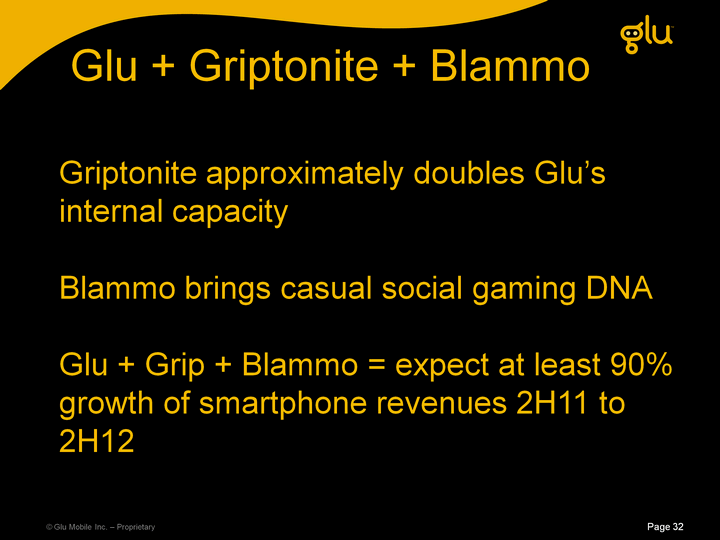
| Griptonite approximately doubles Glu's internal capacity Blammo brings casual social gaming DNA Glu + Grip + Blammo = expect at least 90% growth of smartphone revenues 2H11 to 2H12 (c) Glu Mobile Inc. - Proprietary Page 32 Glu + Griptonite + Blammo |
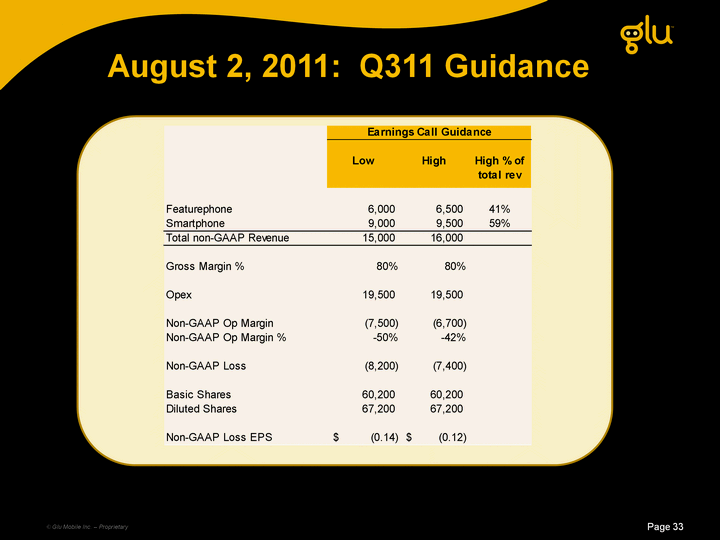
| Page 33 August 2, 2011: Q311 Guidance (c) Glu Mobile Inc. - Proprietary |
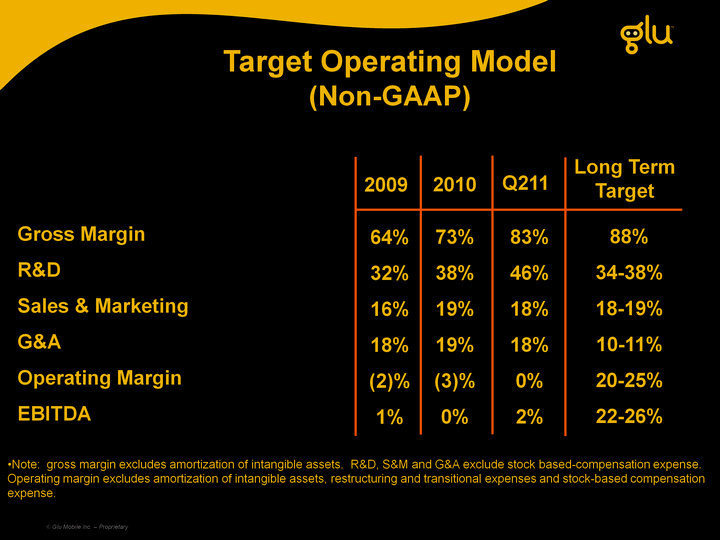
| Target Operating Model (Non-GAAP) Gross Margin R&D Sales & Marketing G&A Operating Margin EBITDA 88% 34-38% 18-19% 10-11% 20-25% 22-26% Long Term Target Note: gross margin excludes amortization of intangible assets. R&D, S&M and G&A exclude stock based-compensation expense. Operating margin excludes amortization of intangible assets, restructuring and transitional expenses and stock-based compensation expense. 73% 38% 19% 19% (3)% 0% 2010 83% 46% 18% 18% 0% 2% Q211 64% 32% 16% 18% (2)% 1% 2009 (c) Glu Mobile Inc. - Proprietary |