Attached files
| file | filename |
|---|---|
| 8-K - 8-K - ALLIANCE FINANCIAL CORP /NY/ | d8k.htm |
 Keefe, Bruyette & Woods
12
th
Annual Community Bank Investor Conference
August 2011
NASDAQ Global Market: ALNC
www.alliancefinancialcorporation.com
Exhibit 99.1 |
 2
Forward Looking Statements
This
presentation
contains
certain
“forward-looking
statements”
(within
the
meaning
of
the
Private
Securities
Litigation
Reform
Act
of
1995)
with
respect
to
the
financial
conditions,
results
of
operations
and
business
of
Alliance.
The
words
“may,”
“could,”
“should,”
“would,”
“believe,”
“anticipate,”
“estimate,”
“expect,”
“intend,”
“plan”
and similar expressions are intended to identify forward-looking
statements. These forward-looking statements involve certain risks
and uncertainties. Factors that may cause actual results to differ materially from those contemplated by such forward-looking statements include,
among others, the following:
changes in the interest rate environment that reduce margins;
changes in the regulatory environment;
the highly competitive industry and market area in which we operate;
general economic conditions, either nationally or regionally, resulting in, among
other things, a deterioration in credit quality; changes in business
conditions and inflation; changes in credit market conditions;
changes in the securities markets which affect investment management revenues;
increases in FDIC deposit insurance premiums and assessments could adversely
affect our financial condition; changes in technology used in the banking
business; the
soundness
of
other
financial
services
institutions
which
may
adversely
affect
our
credit
risk;
certain of our intangible assets may become impaired in the future;
our controls and procedures may fail or be circumvented;
new line of business or new products and services which may subject us to
additional risks; changes in key management personnel which may adversely
impact our operations; the effect on our operations of recent legislative and
regulatory initiatives that were or may be enacted in response to the ongoing financial
crisis;
severe weather, natural disasters, acts of war or terrorism and other external
events which could significantly impact our business; and other factors
detailed from time to time in our Securities and Exchange Commission filings
Additional factors that could cause actual results to differ materially from those
expressed in the forward-looking statements are discussed under the
caption
“Risk
Factors”
in
Alliance’s
Annual
Report
on
Form
10-K
for
the
fiscal
year
ended
December
31,
2010
and
in
subsequent
filings
with
the
Securities and Exchange Commission and available at the SEC’s Internet site (www.sec.gov). Although we believe that the
expectations reflected in such forward-looking statements are reasonable, actual results may differ materially from the
results discussed in these forward-looking statements. You are cautioned
not to place undue reliance on these forward-looking statements, which speak
only as of the date hereof. We do not undertake any obligation to republish
revised forward-looking statements to reflect events or circumstances after
the date hereof or to reflect the occurrence of unanticipated events.
Source Information
Information
throughout
this
presentation
whose
description
includes
reference
to
“SNL”
was
derived
from
SNL
Financial.
Final
peer
information
as
of
and
for the period ended June 30, 2011 is based on filings through July 28, 2011.
|
 3
Snapshot of Alliance Financial
Capital
Asset Quality
Earnings
Shareholder Value
* As
measured
by
return
on
equity
vs.
SNL
banks
with
assets
between
$1B
-
$5B
•
Consistent internal capital generation through earnings
retention
•
Regulatory capital ratios comfortably exceed well- capitalized
thresholds
•
Tangible common equity ratio 7.0% at 6/30/11 •
Fourth consecutive year of record net income in 2010
•
2011 YTD significantly better than peer averages*
•
Diverse revenue stream – 30% from non-interest sources
•
Conservative lending and investing philosophy
•
Asset quality metrics superior to peer averages
•
Average net charge-offs 2008 – 2010 = 0.49%
•
Average net charge-offs first half 2011 = 0.08%
•
Nonperforming assets 0.63% of total assets at 6/30/11 •
Share price outperformed SNL index of $1B - $5B banks over 1, 3 and 5
year periods
•
Three year total return of 46%
•
Six consecutive years of dividend
increases |
| 4
Summary Statistics –
June 30, 2011
Assets:
$1.5 Billion
Loans:
$883.2 Million
Deposits:
$1.1 Billion
Tangible Common Equity:
$101.1 Million
Tangible Common Book Value per Share:
$21.31
Shares Outstanding:
4,745,291
Banking Offices:
29
Market Capitalization (at July 28, 2011):
$152.9 Million |
 5
Alliance Bank, N.A.
Experienced and Seasoned Senior Management Team
Title
Age
Years in
Banking
Years with
Alliance
Jack H. Webb
President & CEO
59
37
12
John H. Watt, Jr.
Executive Vice
President
52
27
8
J. Daniel Mohr
Executive Vice
President & CFO
46
15
5
James W. Getman
Executive Vice
President & Senior
Loan Officer
63
41
12
Steven G. Cacchio
Senior Vice President
47
20
13 |
 6
Alliance Growth History: Seamless Integrations
Alliance has been successful in complementing organic growth with
acquisitions and de-novo expansion.
Acquisitions
•
Q4 2006 –
Bridge Street Financial Corporation
$252 million fair value of assets acquired
$173 million fair value of deposits assumed
7 Branches
Contiguous to existing footprint
Bridge Street cost reductions exceeded 40%
•
Q1 2005 –
HSBC Trust Portfolio
$560MM
Portfolio
of
managed
assets
–
Buffalo,
NY
Office
Non-interest sensitive revenue from HSBC acquisition key to
diversification De-novo expansion
•
Onondaga County, NY
2000
to
2006
–
Opened
8
branches
in
the
greater
Syracuse
area |
| 7
Alliance Investment Management
•
Alliance
Investment
Management,
a
division
of
Alliance
Bank
with
trust
powers,
had
$852.8 million of assets under management at 6/30/11.
•
21 investment and trust professionals managing more than 2,000 client
accounts. •
Year to date investment management revenue is $3.9 million. Total 2010 revenue
was $7.3 million.
•
Non-interest income = 30% of total revenue in 2010.
|
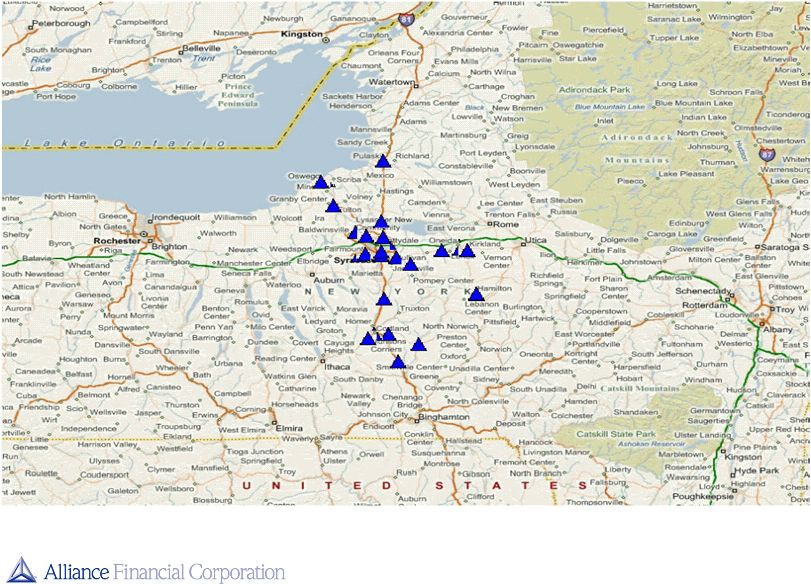 8
Alliance Bank N.A. Branch Franchise |
 9
Deposit Market Share
Syracuse MSA
Rank
Bank
Total Deposits
(000’s)
Market Share
1
Key
$ 2,384,656
21.8%
2
M&T
2,167,251
19.8%
3
HSBC
1,209,694
11.1%
4
Alliance
844,622
7.7%
5
JP Morgan Chase
648,021
5.9%
6
Bank of America
588,197
5.4%
Cortland MSA
Rank
Bank
Total Deposits
(000’s)
Market Share
1
Alliance
$ 243,027
41.3%
2
First Niagara
146,554
24.9%
3
Key
57,447
9.8%
4
HSBC
47,071
8.0%
5
Tompkins Trust
26,617
4.5%
6
M&T
22,737
3.9%
Leading Community Bank in Central New York
Source: SNL Financial |
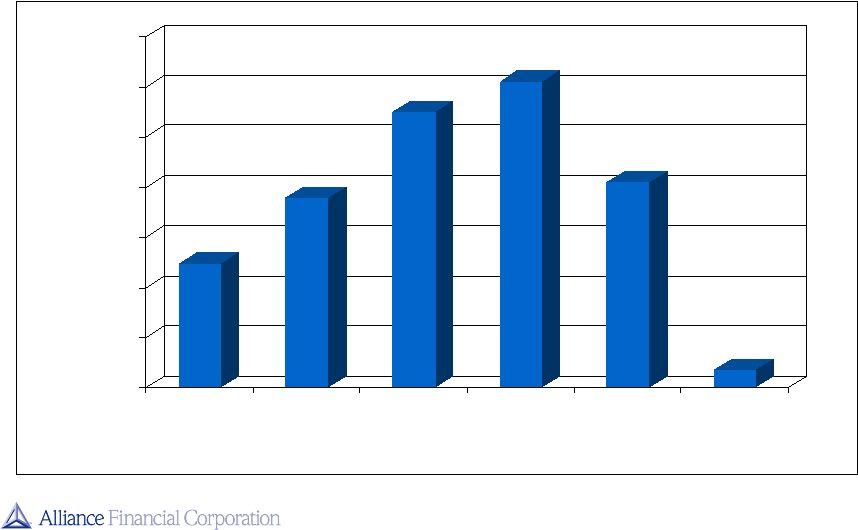
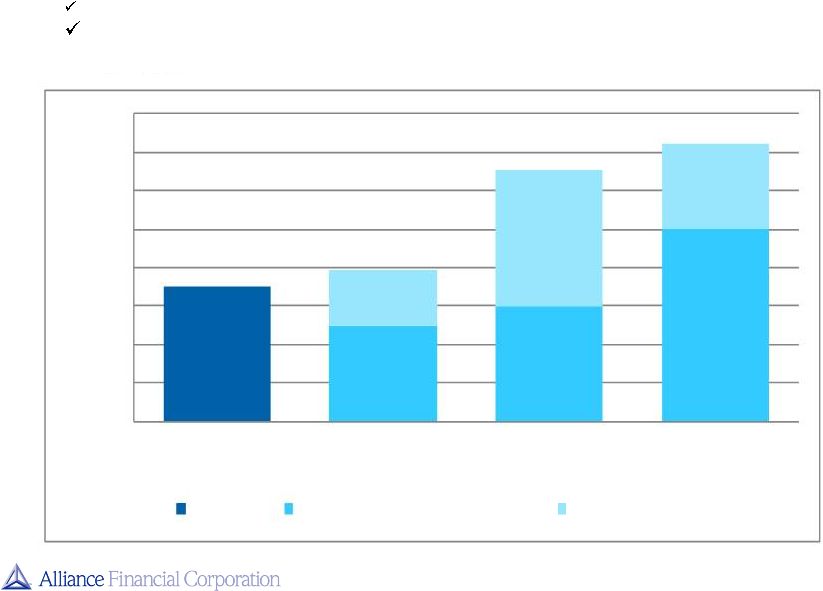
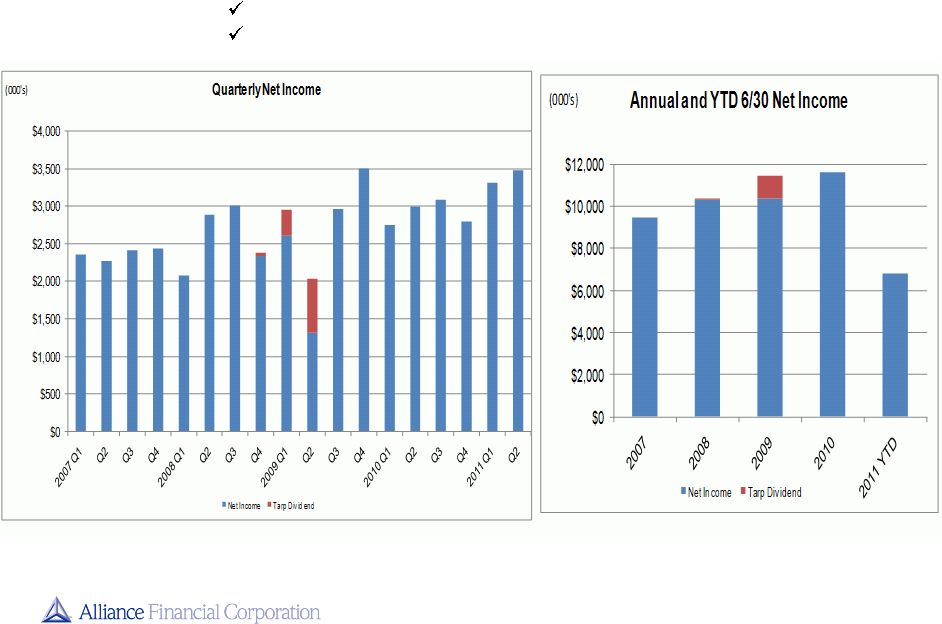 10
Net Income
Four consecutive years of record net income
First half 2011 net income 18% higher than first half 2010
|
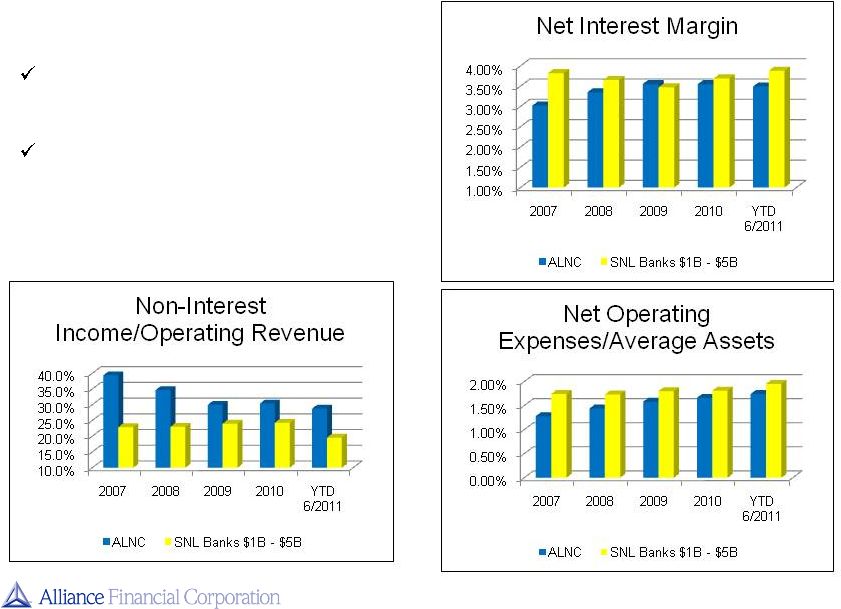 11
Key Operating Ratios
Diverse revenue stream helps to
reduce volatility of earnings in different
economic cycles
Net operating expenses favorable to
peers
Source: SNL Financial
Peer 2011 YTD information based on filings as of July 28, 2011
|
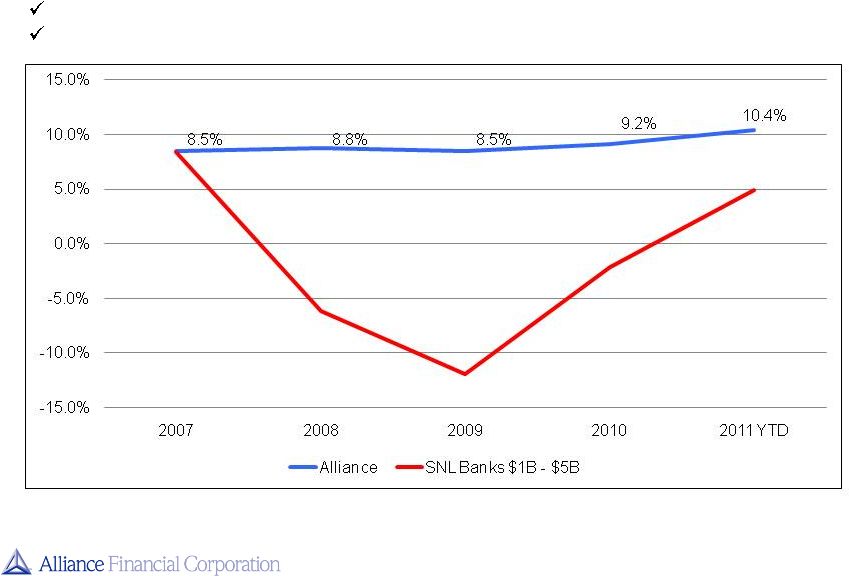 12
Disciplined community banking philosophy delivers relatively stable return on
equity Performance superior to peers
Return on Average Equity
Source: SNL Financial
Peer 2011 YTD information based on filings as of July 28, 2011
|
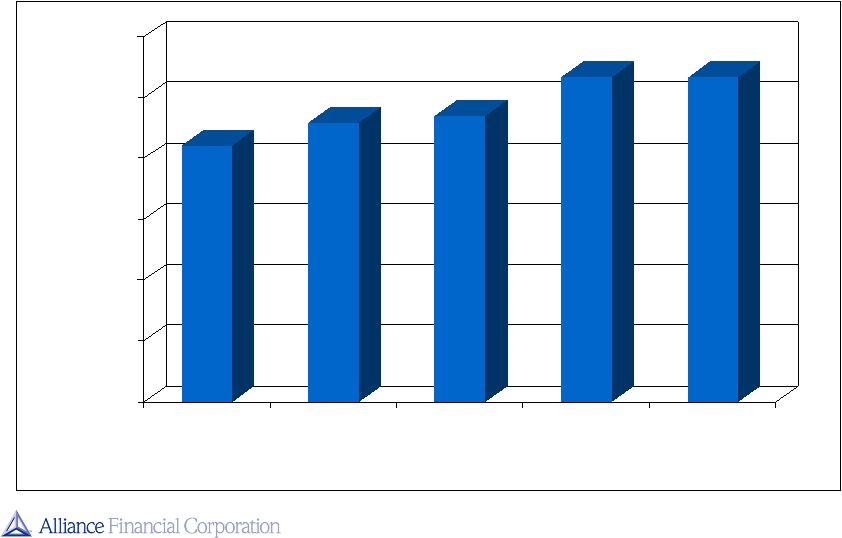
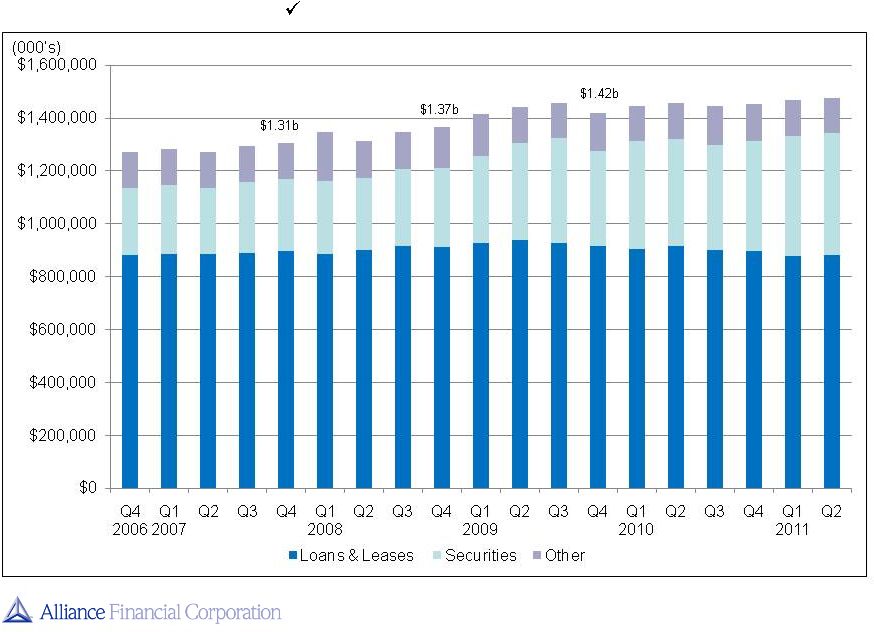 13
Total Assets
Prudently managed asset growth
$1.45b $1.48b
$1.27b |
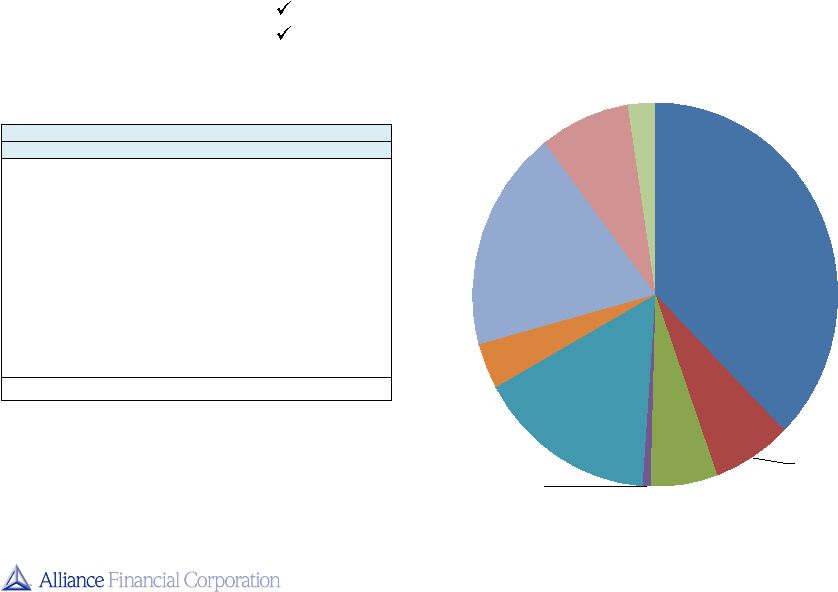 14
(Dollars in Thousands)
June 30, 2011
Deposit Type
Amount
% of Total
Residential Mortgage
330,059
$
37.5%
Owner Occupied CRE
61,583
7.0%
Non-Owner Occupied CRE
51,508
5.9%
Commercial Construction
6,537
0.7%
Commercial and Industrial
140,264
15.9%
Leases, Net
33,591
3.8%
Indirect Auto
165,440
18.8%
Home equity LOC
70,086
8.0%
Consumer
20,835
2.4%
Total
879,903
$
100.0%
Residential
Mortgage
37.5%
Owner
Occupied
CRE
7.0
Non-Owner
Occupied
CRE
5.9%
Commercial
Construction
0.7%
Commercial
and
Industrial
15.9%
Leases, Net
3.8%
Indirect Auto
18.8%
Home equity
LOC
8.0%
Consumer
2.4%
Diverse loan portfolio
Emphasis on quality
Loan Portfolio by Type |
 15
Asset quality consistently better than peer averages
Reflects disciplined underwriting, relatively stable regional economy and real
estate market Asset Quality
2008
2009
2010
June 30, 2011
30 Days past due
11,124
$
7,883
$
6,711
$
5,893
$
60 days past due
4,736
$
2,271
$
1,083
$
1,788
$
90 days past due and still accruing
126
$
-
$
19
$
78
$
Non-accrual
4,352
$
8,582
$
8,474
$
8,262
$
Total non-performing loans and leases
4,478
$
8,582
$
8,493
$
8,340
$
ORE and repossessed assets
657
$
445
$
652
$
945
$
Total non-performing assets
5,135
$
9,027
$
9,145
$
9,285
$
Non-performing loans/total loans
0.49%
0.94%
0.95%
0.95%
Non-performing assets/total assets
0.38%
0.64%
0.63%
0.63%
SNL Banks $1B - $5B
2.72%
4.31%
4.05%
3.33%
Allowance for credit losses
9,161
$
9,414
$
10,683
$
10,683
$
Allowance/total loans
1.01%
1.03%
1.19%
1.21%
Allowance/NPL's
205%
110%
126%
128%
SNL Banks $1B - $5B (Allow./NPA's)
47%
39%
41%
49%
Net charge-offs
4,767
$
5,847
$
2,816
$
360
$
Net charge-offs/average loans
0.53%
0.63%
0.31%
0.08%
SNL Banks $1B - $5B
0.95%
2.04%
1.81%
1.31%
Provision/net charge-offs
115%
104%
145%
100%
SNL Banks $1B - $5B
158%
130%
107%
78%
Source: SNL Financial
Peer June 30, 2011 information based on filings as of July 28, 2011
|
 16
Provision for Credit Losses
0
1,000
2,000
3,000
4,000
5,000
6,000
7,000
2006
2007
2008
2009
2010
2011
YTD
$ in Thousands |
 17
Allowance for Credit Losses
Allowance Coverage/Total Loans & Leases
0
2,000
4,000
6,000
8,000
10,000
12,000
2007
2008
2009
2010
Q2 2011
YTD
$ in Thousands
0.94%
1.01%
1.03%
1.19%
1.21% |
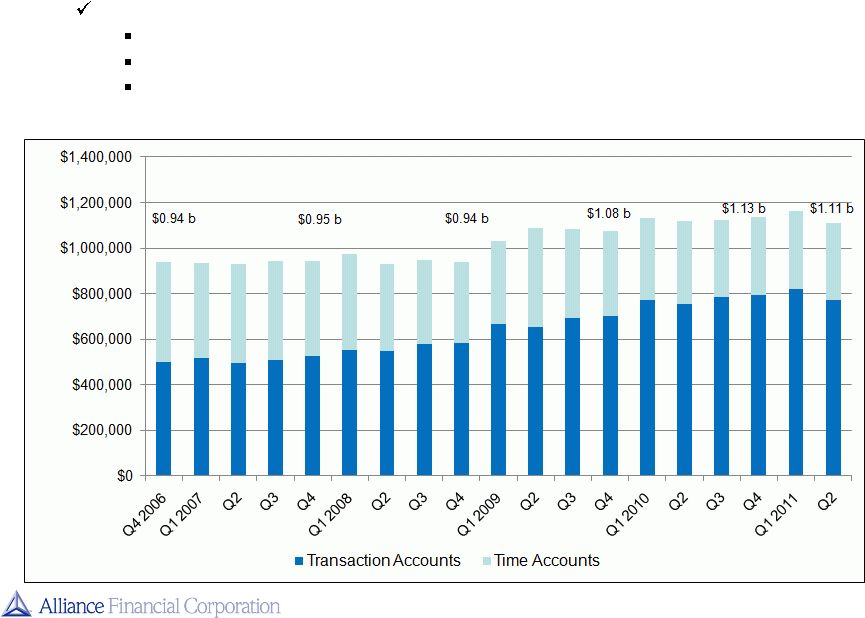 18
Deposits
Record high transaction account balances:
Strong balance sheet and earnings performance
High awareness of Alliance brand
Upgraded treasury management and internet banking platform
(000’s) |
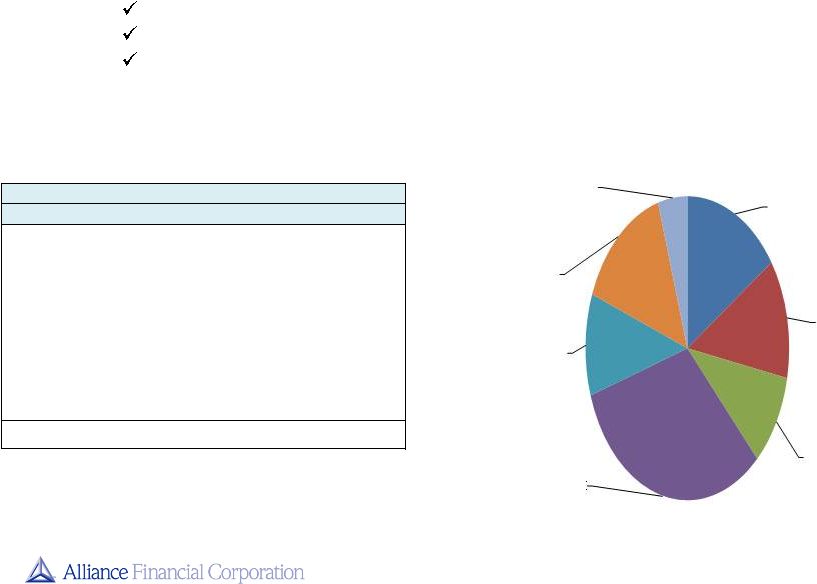 19
(Dollars in Thousands)
June 30, 2011
Deposit Type
Amount
% of Total
Noninterest Bearing Demand
173,325
$
15.6%
Interest Bearing Demand
143,716
12.9%
Savings
109,739
9.9%
Money Market
347,184
31.3%
CD's, $100,000 or more
139,059
12.5%
CD's, Less than $100,000
154,700
13.9%
Brokered CD's
42,842
3.9%
Total
1,110,565
$
100.0%
Diversified deposit base
Branch incentive programs focused on demand account growth
Commercial lending strategy includes selling cash management services
and obtaining deposit relationship
Deposit Composition
Noninterest
Bearing Demand
15.6%
Interest Bearing
Demand
12.9%
Savings
9.9%
Money Market
31.3%
CD's >=
$100,000
12.5%
CD's < $100,000
13.9%
Brokered CD's
3.9% |
 20
Strong Capital Ratios
Strong balance sheet supported by ample tangible common equity
Regulatory capital ratios at June 30, 2011 comfortably above
well-capitalized thresholds
14.4%
13.1%
7.9%
7.0%
0.0%
2.0%
4.0%
6.0%
8.0%
10.0%
12.0%
14.0%
16.0%
TCE/TA
Tier 1 Leverage
Tier 1 RB Capital
Total RB Capital
TCE/TA
Well Capitalized Minimum
Excess Over WC |
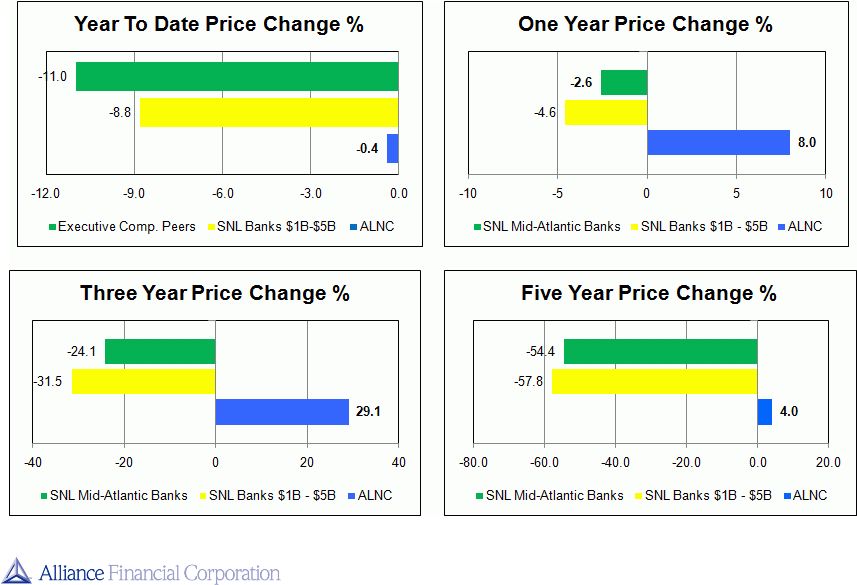 21
Stock Performance*
* As of July 28, 2011 Source: SNL Financial
|
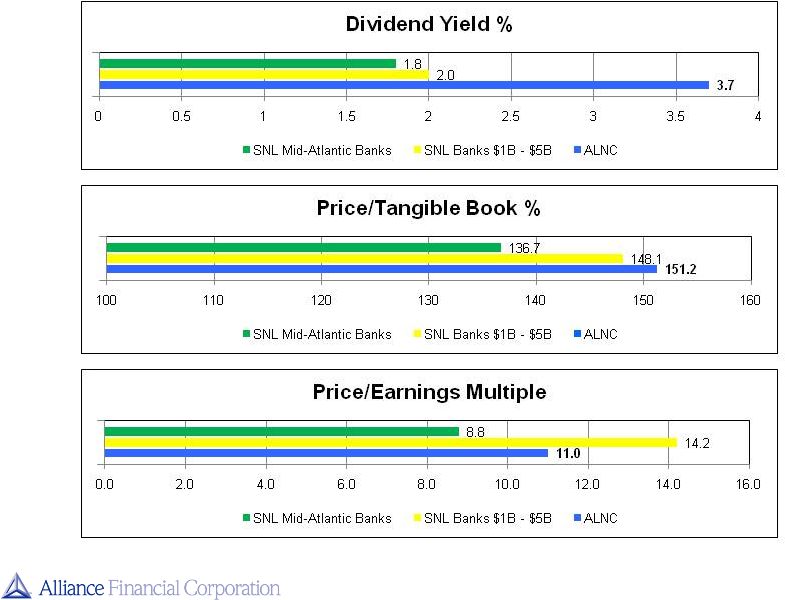 22
Stock Price Metrics*
* As of July 28, 2011 Source: SNL Financial |
 23
Challenges and Opportunities
Low interest rate environment, difficult credit cycle and costs of increased
regulation will weigh on industry earnings generally
Our opportunities for continued success:
Capitalize on dislocation of competitive market, particularly in commercial
lending Continued adherence to our long-standing and disciplined credit
underwriting Leverage strength of Alliance brand
Build on existing customer relationships
Competitive electronic banking platform
Strong balance sheet, infrastructure and human capital to support growth
organically and via acquisition |
| 24
•
Experienced Management Team
•
Disciplined Credit Culture
•
Strong Asset Quality, Capital Ratios, and Liquidity
•
Strong Earnings Performance; Diversified Revenue Stream
•
Emphasis on Core Deposits and Relationship Banking
•
Controlled Organic Growth With Continued Opportunity to Exploit Competitive
Market Dislocation
•
Leading Community Bank in our Footprint, with Strong Brand Recognition
•
Insider
Commitment:
Substantially
all
Directors’
Fees
Deferred
to
Purchase
Alliance
Common Stock
•
Proven Ability to Execute Acquisitions
Why Invest in Alliance Financial Corporation |
 Keefe, Bruyette & Woods
12
th
Annual Community Bank Investor Conference
August 2011
NASDAQ Global Market: ALNC
www.alliancefinancialcorporation.com |