Attached files
| file | filename |
|---|---|
| 8-K - FORM 8K - WAYNE SAVINGS BANCSHARES INC /DE/ | form8k-117456_wayne.htm |
| EX-99.2 - EXHIBIT 99.2 - WAYNE SAVINGS BANCSHARES INC /DE/ | ex99-2.htm |

Business
Overview
Overview
1
Rod Steiger, President & CEO

MISSION & VISION
2
• To Excel in Customer Service,
Operate Profitably, and be
Community Minded
Operate Profitably, and be
Community Minded
• To Be the Best Financial
Institution Possible
Institution Possible

STRATEGIC GOAL
• To Position Wayne Savings
As the Area’s Premier
Community-Minded Bank
As the Area’s Premier
Community-Minded Bank
3
• Focus: Loan Growth,
Risk Management,
Shareholder Value

4
• Strong Name Brand Recognition
• Excellent Reputation
• Safety & Soundness
• Local Decision Making
• Personal Attention to Customers

Investor Joseph Stilwell, et.al.
5
Recently acquired an additional 96,920 shares and
went from 6.49% ownership to 9.70%
went from 6.49% ownership to 9.70%
Quote from SNL Financial article (June 2011):
“Any bank that sticks to… its local community
and really works at it hard does OK, or better.
The people who are doing it right focus on
banking, and they make decisions irrespective, so
to speak, of their own personal well-being.”
“Any bank that sticks to… its local community
and really works at it hard does OK, or better.
The people who are doing it right focus on
banking, and they make decisions irrespective, so
to speak, of their own personal well-being.”
We live here, work hard, and agree with him.

6
WSCB Web Video

An Eventful Year
7
• Phil Becker Retired; New CEO
• New Director: Debra Marthey
• New Dodd-Frank Reform Bill
- Durbin Amendment - July 21st
2000 pages & 300 new regulations
- New Consumer Financial Protection Bureau
(CFPB) and Financial Stability Oversight
Council (FSOC)
• New CFPB will have wide-sweeping authority

• State-Chartered Thrift - Not a commercial
bank, but in many ways we act and look like
one
bank, but in many ways we act and look like
one
8
• Office of Thrift Supervision (OTS) was
replaced by the Federal Deposit Insurance
Corporation (FDIC) and will regulate Wayne
Savings Community Bank along with the
Ohio Department of Financial Institutions
(ODFI).
replaced by the Federal Deposit Insurance
Corporation (FDIC) and will regulate Wayne
Savings Community Bank along with the
Ohio Department of Financial Institutions
(ODFI).

9
• Federal Reserve Bank (FRB) will now
regulate Wayne Savings Bancshares Inc.
(WSBI), Holding Company
regulate Wayne Savings Bancshares Inc.
(WSBI), Holding Company
• OTS - ODFI - SEC
• FDIC - ODFI - FRB
CFPB - SEC

FDIC, ODFI, FRB,
CFPB, FSOC, SEC
EPS, ROE,
ROA, NIM,
Stock Value
Independence,
Take-overs,
Mergers
Future of
Community
Banking
Technology
Customer
Satisfaction
Satisfaction
Government
Regulations
& Mandates
Regulations
& Mandates
Loans -
Delinquencies,
C/O
Delinquencies,
C/O
CEO Concerns or….
What Keeps Me Up at Night
What Keeps Me Up at Night

My Vision
11
• A Place Customers Want to Come
• A Place People Want to Work
• A Place Investors Want to Invest
• Corporate Community Citizen
• Profitable
• Independent


1


LENDING
1
Joel Beckler, SVP, Senior Lender

2007 - $ 249,056
2008 - $ 247,038
2009 - $ 259,716
2010 - $ 252,760
2011 - $ 244,029
* Dollars in Thousands/all data as of March 31.
Total Loans
2

1-to-4 Family Residential Loans
2007 - $155,002
2008 - $155,363
2009 - $159,257
2010 - $159,140
2011 - $162,435
* Dollars in Thousands/all data as of March 31
3

Non-Residential Real Estate
Land Loans
2007 - $ 66,304
2008 - $ 65,789
2009 - $ 75,521
2010 - $ 70,167
2011 - $ 62,508
•Dollars in Thousands/all data as of March 31
4

Non-Performing Assets
As of March 31
2010 2011
(dollars in thousands)
Total Non-Performing Loans 4,319 5,157
Loans Deemed Impaired 2,185 5,827
Total Non-Performing and 6,504 10,984
Impaired Loans
Total Real Estate Owned 2,888 2,214
Total Non-Performing and 9,932 13,198
Impaired Assets
5

Non-Performing & Impaired Assets
to Total Assets at March 31
2007 - 0.23%
2008 - 0.49%
2009 - 1.43%
2010 - 2.31%
2011 - 3.24%
6

Allowance for Loan Losses
to Total Loans at March 31
2007 - 0.63%
2008 - 0.73%
2009 - 0.97%
2010 - 1.13%
2011 - 1.32%
7

Commercial Lending
Sector Exposures (data as of March 31, 2011)
SECTOR
1) Investment Rental $22.9 million
Properties
2) Manufacturing & Warehousing
Facilities $10.9 million
3) Commercial Office & Retail $12.3 million
4) Automotive Related Real Estate $ 6.6 million
BALANCE
OUTSTANDING
OUTSTANDING
8

TRUST
SERVICES
SERVICES
9
Wendy Blosser, SVP, Senior Trust Officer

Trust Department
Trusts offer an excellent means of
increasing a bank’s fee income.
increasing a bank’s fee income.
10

Financial Benefits
• Source of off-balance sheet
income to boost profitability
• Revenue stream that is not affected
by Net Interest Margin
- Average account life = 20 years
- Can continue for generations
11

Non-Financial Considerations
Customer needs
Retirement/Estate planning
Investment management
Trust services
Expanded customer relationships
Allows loan and deposit customers to also utilize
investment management and trust services
investment management and trust services
Customer retention
By offering all the services from one provider
Competition from banks and other providers
Market perception - full service provider
12

Target Market
Baby Boomers and their parents
-Elderly segment of population rapidly
expanding
-As longevity increases, many people depend
on fiduciaries to manage their wealth
-Massive shift of wealth from one generation to
the next
13

Year Six Results (as of March 31, 2011)
82 Accounts
Aggregate Market Value of
$41.5 Million
$41.5 Million
14

Account Details (data as of March 31, 2011)
|
41 Personal
Trusts/Estates |
$18 million
market value
|
|
14 IMAs
|
$4 million
market value
|
|
15 Rollover IRAs
|
$3.5 million
market value
|
|
12 Custody Accounts
|
$16 million
market value
|
15

Annual Fees
3/31/2006 3/31/2007 3/31/2008 3/31/2009 3/31/2010 3/31/2011
$187,520
$179,646
$197,799
16
$220,800

Looking Ahead
Total Potential Additional Market
Value approximately $30 million
Value approximately $30 million
Many unfunded accounts
Many successor accounts
Attorney referrals
17

RETAIL
BANKING &
OPERATIONS
OPERATIONS
1
Steve Dimos, EVP, Retail
Banking / Operations
Banking / Operations

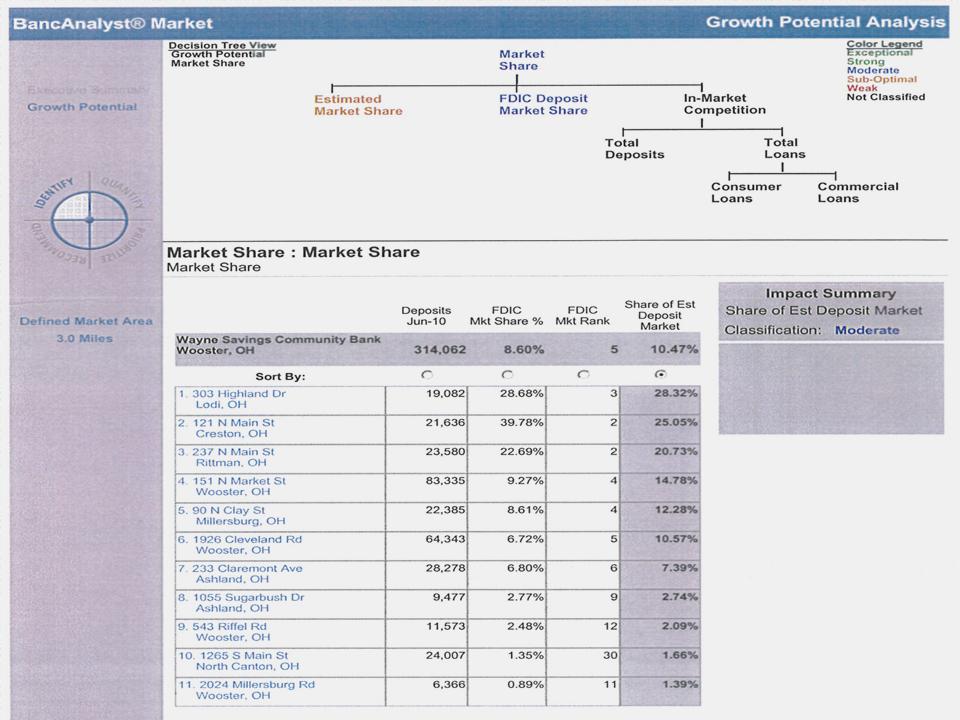
Branch Operations
This resource will help evaluate
our branch system.
our branch system.
Bank Intelligence Solutions:
2


FINANCIAL
HIGHLIGHTS
HIGHLIGHTS
1
Myron Swartzentruber, SVP, CFO

Wayne Savings Bancshares, Inc.
Annual Net Income
($ in millions)
Annual Net Income
($ in millions)
2

Wayne Savings Bancshares, Inc.
Net Interest Income
($ in millions)
Net Interest Income
($ in millions)
3

Wayne Savings Bancshares, Inc.
Return on Equity (%)
Return on Equity (%)
4

Wayne Savings Bancshares, Inc.
Shareholders Equity as a
Shareholders Equity as a
Percent of Total Assets / Capital
5

Wayne Savings Bancshares, Inc.
Dividend Payout Ratio
Dividend Payout Ratio
6

Wayne Savings Bancshares, Inc.
Total Assets
($ in millions)
Total Assets
($ in millions)
7

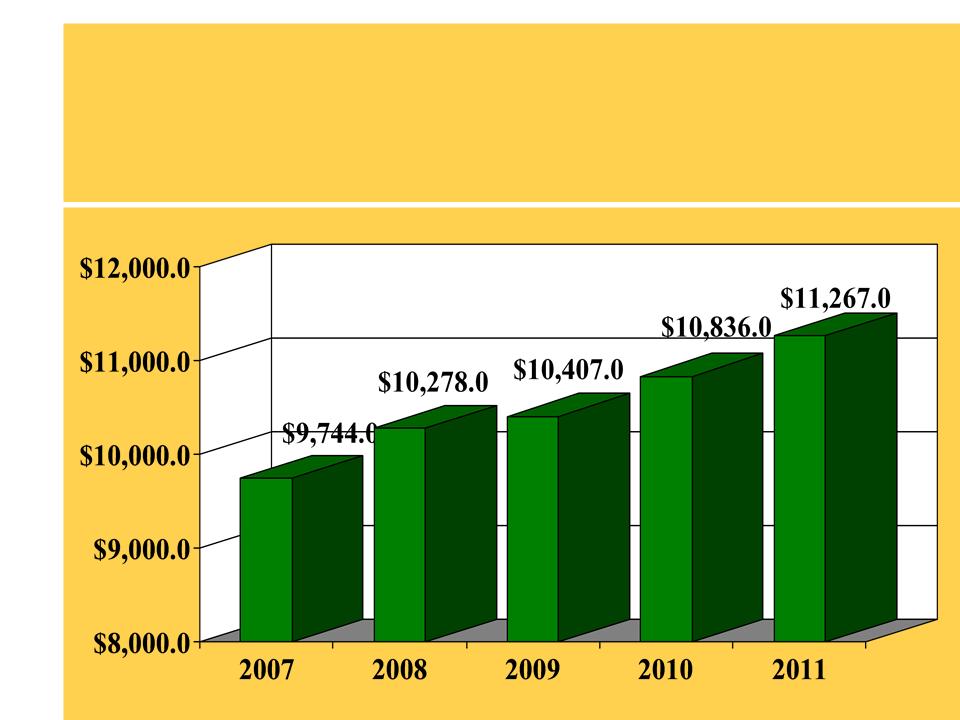
Wayne Savings Bancshares, Inc.
Total Deposits
($ in millions)
Total Deposits
($ in millions)
8
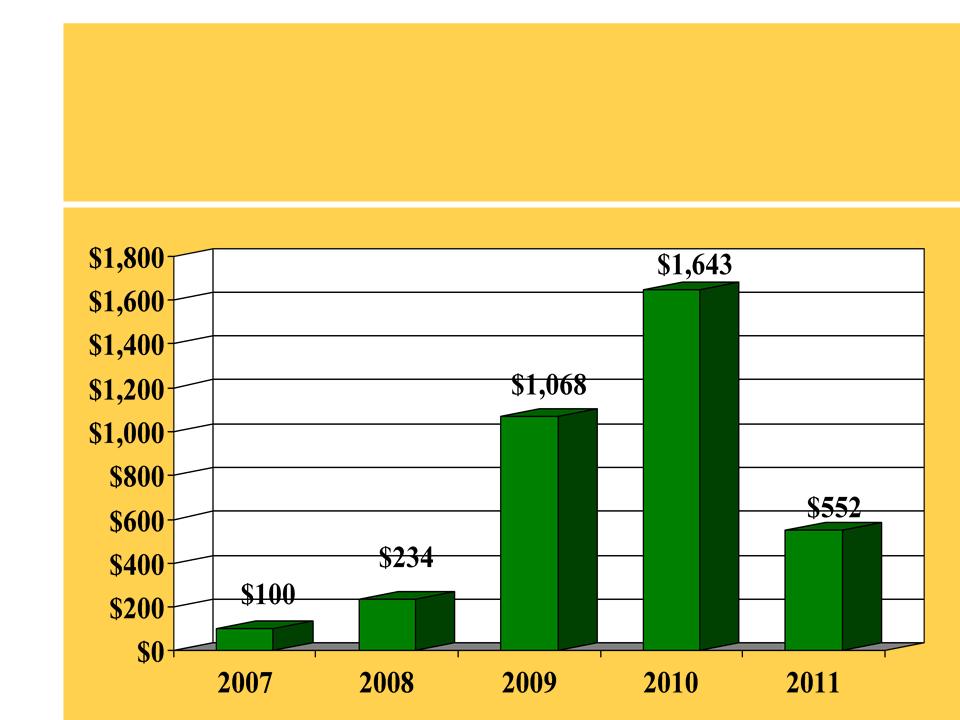
Provisions For Loan Losses
($ in thousands)
($ in thousands)
9

Non-Interest Income
($ in thousands)
($ in thousands)
10
Non-Interest Expense
($ in thousands)
($ in thousands)
11

RISK
MANAGEMENT
MANAGEMENT
12
H. Stewart Fitz Gibbon III,
EVP, COO, CRO

Risk Management
13
Major Strategic Initiative:
•development of an enterprise risk
management program
management program

Risk Management Framework
14
CAMELS:
C - Capital
A - Asset Quality
M - Management
E - Earnings
L - Liquidity
S - Sensitivity

(C) - Capital
15
• Increased by earnings
• Decreased by dividends and stock
buyback programs
buyback programs
• Decreased by losses

(A) - Asset Quality
• Delinquencies
• Non-performing
• Real estate owned

(M) - Management
17
• Everything not included in another category
• Compliance
• Community Reinvestment Act
• Trust
• Information Technology
• Legal
• Insurance
• Operations
• Accounting/Financial Reporting
• Reputation

18
(E) - Earnings
• Net Interest Margin
• Fee Income
• Non-interest Expense

(L) - Liquidity
19
ØOn balance sheet
• Securities
• Loans
• Cash
ØOff balance sheet
• Borrowing capacity

(S) - Sensitivity
20
• Interest Rate Risk
The company’s principal exposure
to market risk is through changes
in interest rates.

Enterprise Risk Management (ERM)
• www.sec.gov
• 8-K Filing
21

Change of Fiscal Year
• Currently March 31
• Will be December 31, starting at
the end of this year - 2011
the end of this year - 2011
• Annual meeting will be in April or
May instead of July
May instead of July
• Purpose is to provide better
comparisons with other institutions
and to facilitate call reporting.
comparisons with other institutions
and to facilitate call reporting.
22

QUESTIONS
23

Your investment and
continuing support are
greatly appreciated.
continuing support are
greatly appreciated.
THANK YOU
24