Attached files
| file | filename |
|---|---|
| 8-K - FORM 8-K - GAIN Capital Holdings, Inc. | d8k.htm |
| EX-99.1 - PRESS RELEASE OF GAIN CAPITAL HOLDINGS, INC. - GAIN Capital Holdings, Inc. | dex991.htm |
 2
nd
Quarter 2011
Financial and Operating Results
July 28, 2011
Exhibit 99.2 |
 Special
Note Regarding Forward-Looking Information
In addition to historical information, this presentation contains
"forward-looking" statements that reflect management's
expectations for the future. A variety of important factors could cause
results to differ materially from such statements. These factors are noted
throughout GAIN Capital’s annual report on Form 10-K, as
filed
with
the
Securities
and
Exchange
Commission
on
March
30,
2011,
and
include,
but
are
not
limited
to,
the
actions
of
both
current
and
potential
new
competitors, fluctuations in market trading volumes, financial market volatility,
evolving industry regulations, errors or malfunctions in our systems or
technology, rapid changes in technology, effects of inflation, customer
trading patterns,
the
success
of
our
products
and
service
offerings,
our
ability
to
continue to innovate and meet the demands of our customers for new or
enhanced products, our ability to successfully integrate assets and companies
we have acquired, changes in tax policy or accounting rules, fluctuations in
foreign exchange rates, adverse changes or volatility in interest rates, as
well as general economic, business, credit and financial market conditions,
internationally or nationally. The forward-looking statements included
herein represent GAIN Capital’s views as of the date of this release.
GAIN Capital undertakes no obligation to revise or update publicly any
forward-looking statement for any reason unless required by law.
2 |
 Overview
Glenn Stevens, CEO |
 2
nd
Quarter 2011 Results Overview
4
•
Significant sequential recovery
•
Net Revenue up 38% over Q1 2011
•
Profitability up substantially
•
Adjusted
EBITDA
(1)
of
$19.0
million
vs.
$5.0
million
•
Adjusted
Net
Income
(2)
of
$11.2
million
vs.
$2.5
million
•
GAAP Net Income of $10.0 million vs. $1.4 million
•
Stable year-over-year revenue performance a positive dynamic
•
One week of TradeStation volume and revenues
•
6 weeks of dbFX volume and revenues
•
More restrictive regulatory requirements
•
Solid profitability achieved after ongoing investment, expansion
and mix shift
•
Adjusted
EBITDA
margin:
34%
(1)
•
Adjusted
Net
Income
margin:
20%
(2)
(1)
Adjusted
EBITDA
is
a
non-GAAP
financial
measure
that
prior
to
the
closing
of
our
initial
public
offering
in
December
2010
represented
our
earnings
before
interest,
taxes,
depreciation
and amortization and excluded the change in fair value of the embedded derivative in
our preferred stock. With the consummation of our IPO, all outstanding shares of our preferred
stock converted into common stock. A reconciliation of net income to adjusted EBITDA
and adjusted EBITDA margin is available in the appendix to this presentation.
(2)
Adjusted net income is a non-GAAP financial measure that that prior to the
closing of our initial public offering in December 2010 represented our net income/(loss) excluding the change
in fair value of the embedded derivative in our preferred stock and purchase
intangible amortization. With the consummation of our IPO, all outstanding shares of our preferred stock
converted into common stock and in 2011 and future periods adjusted net income will
no longer reflect an adjustment related to the embedded derivative. A reconciliation of net income
to adjusted net income and adjusted net income margin is available in the appendix
to this presentation. |
 2
nd
Quarter 2011 Summary
5
•
2Q 2011 Financial Summary
•
Net Revenue: $55.6 million
•
Adjusted EBITDA
(1)
: $19.0 million
•
Adjusted
Net
Income
(2)
:
$11.2
million
•
Adjusted
EPS
(Diluted)
(3)
:
$0.29
•
GAAP EPS (Diluted): $0.26
•
Operating Metrics
(4)
•
Total trading volume: $454.6 billion
•
Retail: $357.2 billion
•
Institutional: $97.4 billion
•
Client assets: $293.1 million
•
Funded retail accounts: 78,395
•
Retail trading revenue per million: $151.4
(1)
Reconciliation of EBITDA to adjusted EBITDA available in appendix.
(2)
Reconciliation
of
net
income
to
adjusted
net
income
available
in
appendix.
(3)
Reconciliation of EPS to adjusted EPS available in appendix.
(4)
Definitions for all our operating metrics are available in the appendix to this
presentation. |
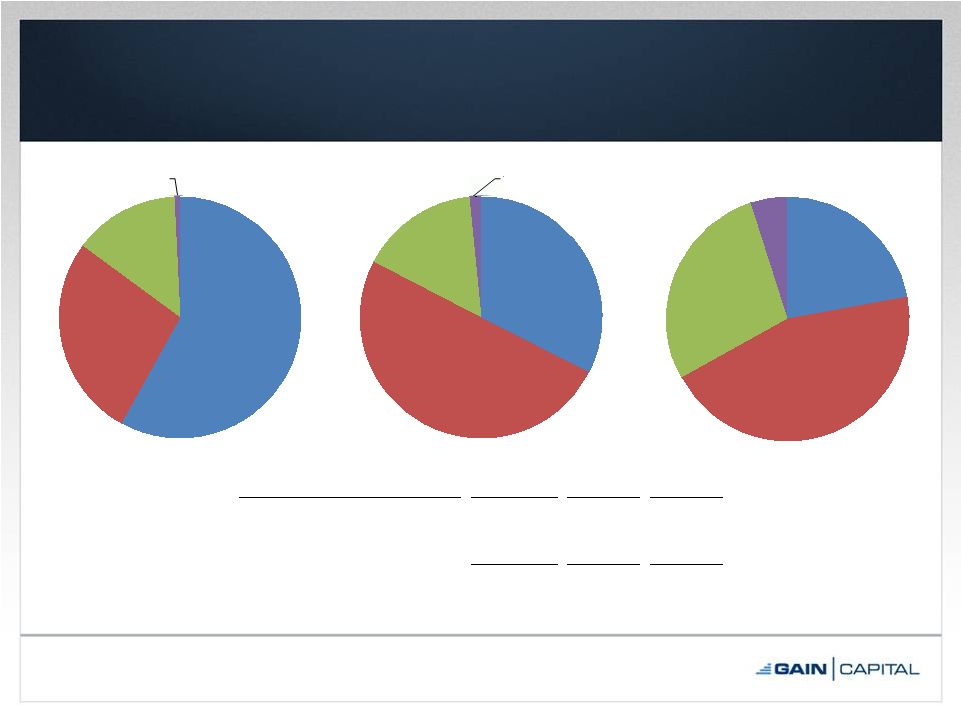 Retail
Trading
Volume
by
Geography
(1)(2)
6
1H ‘10
1H ‘11
Note: Dollars in billions.
(1)
Definitions for all our operating metrics are available in the appendix to this
presentation. (2)
For periods ended June 30.
(3)
Source: Aite Group.
Americas
22%
Asia-Pacific
45%
Europe
28%
Rest of World
5%
Global Retail FX Market (FY 2008)
(3)
Americas
58%
Asia-Pacific
27%
Europe
14%
Rest of World
1%
Americas
32%
Asia-Pacific
50%
Europe
16%
Rest of World
2%
Country/Region
1H 2010
1H 2011
% Growth
Americas
$375.4
$246.6
(34%)
Asia-Pacific
174.8
381.6
118%
Europe
91.6
120.1
31%
Rest of World
5.1
11.4
122%
Total Retail Trading Volume
$646.9
$759.7
17% |
 Business
Development Highlights •
dbFX Acquisition
–
Acquired ~1,650 accounts with total asset value of ~$50mm = 5X avg. size of legacy
accounts –
Performing in line with expectations
–
Ongoing relationship in place with dbFX
•
Product Expansion
–
GAIN GTX
•
New products & features: precious metals, FX forwards, basket trading
•
Strong pipeline for new GTX Direct offering
•
Launching 24-hour agency desk to leverage extensive PB credit network
–
Retail Trading Tools
•
New release of FOREXTrader PRO platform with automated trading capabilities
•
Autochartist: 3rd party tool generates real-time trading ideas
•
New Android mobile app, iPhone app upgrades; iPad app scheduled for
Q3’11 •
Geographic Expansion
–
Enhanced Arabic language offering in response to growth in Mid-East
region –
Hong Kong office expansion to better support Asia time zone clients
–
Indirect sales team expansion to provide more coverage of EMEA, Asian
markets 7 |
 New
Version of FOREXTrader PRO Upgraded active
trader platform
delivers:
•
Enhanced user interface
and customization
features
•
Integrated third-party
research & trading ideas
•
Enhanced charting
capabilities
•
Automated trading
capabilities
8 |
 Regulatory Update
•
US regulatory clarity post Dodd-Frank rules
implementation
–
Leveraged OTC metals no longer available to US residents
–
FDIC’s retail FX rules for financial institutions in line with
CFTC’s
–
SEC rules for registered broker/dealers offering OTC forex –
status quo
•
Final Japan leverage change (25:1) effective August
15, 2011
9 |
 Retail
Forex Market Growth (1)
Estimated Average Daily Trading Volume
(1)
Source: Aite Group, Bank for International Settlements
0
50
100
150
200
250
300
350
0
500
1,000
1,500
2,000
2,500
3,000
3,500
4,000
2001
2004
2007
2010
Total Volume
Retail Volume
Total
Volume ($Bn)
Retail
Volume ($Bn)
•
According to Aite Group, there
are >100 million online retail
investors globally
•
8.3 million who trade forex
•
Half of retail FX market located
in Asia
•
Continued growth expected from
China, India and Middle East
•
615k retail FX traders in U.S
.
•
Expected to reach 4.8 million by
2020 in US alone
10
Retail FX represented ~8% of the overall $4
trillion forex market in 2010 |
 Customer
Profitability: A Closer Look •
Overall, approximately 30% of our global retail accounts are profitable
in any given quarter
•
Approximately 50% of customers
in Q2 2011
were either profitable or
lost $200
or
less
(~$2.20
per
day)
•
Clients with beginning margin balances >$2,000 have higher than
average profitability
•
Importantly, 62% of all trades are profitable
11
More education about financial risk management would be beneficial
|
 Trader
Education – IntheMoney.com
12
•
A new website
focused exclusively
on trader education
–
Video tutorials &
articles
–
Trading guides
–
Webinars
–
Blogs
–
Tools
•
News
•
Economic calendar
•
Basic charts
–
Market commentary
–
Community features
•
Expected to launch
mid-Q3 |
 Financial and Operating Metric Review
Henry Lyons, CFO |
 Financial Results
14
Note: Dollars in millions.
(1)
Reconciliation
of
net
income
to
adjusted
net
income
and
adjusted
net
income
margin
available
in
appendix.
(2)
Reconciliation of net income to adjusted EBTIDA and adjusted EBITDA margin
available in appendix. Q2
1
st
Half
Q2
1
st
Half
Q2
1
st
Half
Q2
1
st
Half
Q2
Q2
Q1
Q2
$54.7
$55.6
Q2
Q2
$96.7
$96.0
$0.0
$20.0
$40.0
$60.0
$80.0
$100.0
$120.0
2010
2011
2010
2011
Revenue
$13.0
$11.2
$19.5
$13.7
$13.8
$10.0
$79.8
$11.4
24%
20%
20%
14%
0%
5%
10%
15%
20%
25%
-
10.0
20.0
30.0
40.0
50.0
60.0
70.0
80.0
90.0
2010
2011
2010
2011
GAAP
&
Adjusted
Net
Income
&
Margin
%
Adjusted Net Income
GAAP Net Income
Adjusted Net Income Margin %
Q1
Q1
$21.6
$19.0
$32.9
$24.1
39%
34%
34%
25%
0%
5%
10%
15%
20%
25%
30%
35%
40%
45%
$0.0
$5.0
$10.0
$15.0
$20.0
$25.0
$30.0
$35.0
2010
2011
2010
2011
Adjusted
EBITDA
&
Margin
%
Adjusted EBITDA
Adjusted EBITDA Margin %
$11.4
$12.2
$22.6
$23.3
$8.8
$9.0
$18.5
$19.2
$7.1
$8.4
$12.3
$15.6
$1.9
$3.6
($0.8)
($60.3)
$7.0
$8.1
$12.8
$16.1
$33.5
$39.6
$5.8
$77.7
($80.0)
($60.0)
($40.0)
($20.0)
$0.0
$20.0
$40.0
$60.0
$80.0
$100.0
2010
2011
2010
2011
Total Expenses
Comp & Benefits
Marketing
Trading
Purchase Intangible Amort.
Embedded Derivative
All Other
(1)
(2)
|
 Operating Metrics
(1)
15
Note: Trading volume in billions. Client assets in millions.
(1)
Definitions for all our operating metrics are available in the appendix to this
presentation. (2)
For periods ending June 30.
(3)
As of June 30.
Q2
1
st
Half
Q2
1
st
Half
$222.2
$293.1
$0.0
$50.0
$100.0
$150.0
$200.0
$250.0
$300.0
$350.0
2010
2011
Client Assets
$355.6
$357.2
$646.9
$759.7
$97.4
$92.1
$207.4
$423.5
$454.6
$739.0
$967.1
$0.0
$200.0
$400.0
$600.0
$800.0
$1,000.0
$1,200.0
$0.0
$200.0
$400.0
$600.0
$800.0
$1,000.0
$1,200.0
2010
2011
2010
2011
Total Trading Volume
Retail
Institutional
34,174
36,868
42,992
47,395
-
5,000
10,000
15,000
20,000
25,000
30,000
35,000
40,000
45,000
50,000
2010
2011
2010
2011
Traded Retail Accounts (Period)
65,294
78,395
0
10,000
20,000
30,000
40,000
50,000
60,000
70,000
80,000
90,000
2010
2011
Funded Retail Accounts
(2)
(2)
(3)
(3)
$67.9 |
 Operating
Metrics
(cont.)
(1)
16
Q2
1
st
Half
Q2
1
st
Half
Q2
1
st
Half
10,116
8,004
20,620
16,914
-
5,000
10,000
15,000
20,000
25,000
2010
2011
2010
2011
New Retail Accounts
$75.6
$64.3
$137.7
$125.1
$0.0
$20.0
$40.0
$60.0
$80.0
$100.0
$120.0
$140.0
$160.0
2010
2011
2010
2011
Net Deposits from Retail Customers
9.0
9.4
16.1
18.4
-
2.0
4.0
6.0
8.0
10.0
12.0
14.0
16.0
18.0
20.0
2010
2011
2010
2011
Trades
$141.5
$153.2
$151.4
$123.8
$135.9
$128.5
$0.0
$20.0
$40.0
$60.0
$80.0
$100.0
$120.0
$140.0
$160.0
$180.0
Q2 09
Q3 09
Q4 09
Q1 10
Q2 10
Q3 10
Q4 10
Q1 11
Q2 11
Retail Trading Revenue per Million
Retail Trading Revenue per Million (Quarterly)
Retail Trading Revenue per Million (Last Twelve Months)
(2)
(2)
(2)
(2)(3)
Note: Net deposits and trades in millions.
(1)
Definitions for all our operating metrics are available in the appendix to this
presentation.
(2)
For periods ending June 30.
(3)
2008 data excludes our China trading operations. |
 Closing Remarks
Glenn
Stevens,
CEO |
 Closing
Remarks •
Industry fundamentals remain strong
•
Solid Q2 performance
•
Remain confident in our plan for the remainder of 2011
•
Continuing to invest in geographic and product
expansion
•
Pipeline of acquisitions and strategic partnerships
remains strong
18 |
 Appendix |
 Consolidated Statements of Operations
20
2011
2010
2011
2010
Revenue
Trading revenue
54.1
$
54.5
$
93.9
$
96.5
$
Other revenue
1.6
0.7
2.6
1.2
Total non-interest revenue
55.7
55.2
96.5
97.7
Interest revenue
0.2
0.1
0.3
0.2
Interest expense
(0.3)
(0.6)
(0.8)
(1.2)
Total net interest expense
(0.1)
(0.5)
(0.5)
(1.0)
Net Revenue
55.6
54.7
96.0
96.7
Expenses
Compensation and benefits
12.2
11.4
23.3
22.6
Selling and marketing
9.0
8.8
19.2
18.5
Trading expenses and commissions
8.4
7.1
15.6
12.3
Bank fees
1.1
1.1
2.1
2.2
Depreciation and amortization
1.0
0.9
1.9
1.6
Purchase intangible amortization
1.9
-
3.6
-
Communication and data processing
0.8
0.7
1.4
1.5
Occupancy and equipment
1.1
1.0
2.3
1.9
Bad debt provision/(recovery)
0.1
0.1
0.6
0.4
Professional fees
1.1
0.2
2.2
1.0
Change in fair value of convertible,
redeemable preferred stock embedded
derivative
(1)
-
(0.8)
-
(60.3)
Other
1.8
2.1
3.5
2.9
Total
39.6
33.5
77.7
5.8
Income before income tax expense
and equity in earnings of equity method
investment
16.0
21.2
18.3
90.9
Income tax expense
6.0
7.4
6.9
11.5
Net income
10.0
13.8
11.4
79.4
Net loss applicable to
non-controlling interest
-
-
-
(0.4)
Net income applicable to GAIN
Capital Holdings,Inc.
10.0
$
13.8
$
11.4
$
79.8
$
Earnings per share
(2)
:
Basic
0.29
$
4.62
$
0.33
$
26.79
$
Diluted
0.26
$
0.37
$
0.29
$
2.17
$
Weighted averages shares outanding
(2)
:
Basic
34,544,643
2,985,136
34,156,494
2,977,209
Diluted
39,086,435
36,945,784
38,978,908
36,704,088
Three Months Ended June 30,
Six Months Ended June 30,
Product development, software and maintenance
1.1
0.9
2.0
1.2
Note:
Dollars in millions, except per share data.
(1)
For the periods prior to the closing of our initial public offering in December 2010, in accordance
with Financial Accounting Standards Board Accounting Standards Codification 815, Derivatives and Hedging, we
accounted for an embedded derivative liability attributable to the redemption feature of our previously
outstanding preferred stock and amortization of purchase intangibles. This redemption feature and the
associated embedded derivative liability was no longer required to be recognized following the
conversion of all of our preferred stock to common stock in connection with our IPO. (2)
In connection with the completion of our initial public offering in December 2010 (the
“IPO”), our board of directors approved a 2.29-for-1 stock split of our common stock to be effective immediately prior to the
completion of the IPO. The 2.29-for-1 stock split, after giving effect to the receipt by
us of 407,692 shares of common stock from all of our pre-IPO common stockholders (on a pro-rata basis) in satisfaction of
previously outstanding obligations owed by such stockholders to us, resulted in an effective stock
split of 2.26-for-1. Accordingly, all references to share and per share data have been retroactively restated for the
three months and six months ended June 30, 2010 to reflect the effective 2.26-for-1 stock
split. |
 Balance
Sheet 21
Note: Dollars in millions.
June 30,
December 31,
2011
2010
Assets
Cash
and
cash
equivalents
346.1
$
284.2
$
Short term investments
0.1
0.1
Trading securities
20.1
Receivables from brokers
100.5
98.1
Property and
equipment, net
7.3
7.3
Prepaid assets
10.5
9.9
Goodwill
3.1
3.1
Intangible
assets,
net
15.2
9.1
Other
assets
8.2
11.2
Total
assets
491.0
$
443.1
$
Liabilities
and
shareholders'
equity
Payables to brokers, dealers, FCM'S and other regulated entities
10.7
$
6.1
$
Payable to customers
282.5
250.6
Accrued compensation & benefits payable
2.4
5.1
Accrued expenses and other liabilities
15.7
10.5
Income tax payable
0.5
2.5
Notes payable
13.1
18.4
Total
liabilities
324.9
$
293.2
$
Shareholders' equity
166.1
149.9
Total
liabilities
and
shareholders' equity
491.0
$
443.1
$
- |
 Adjusted
Net Income / Margin Reconciliation 22
Note: Dollars in millions, except per share data.
(1)
Three Months Ended June 30,
Six Months Ended June 30,
2011
2010
2011
2010
Revenue
55.6
$
54.7
$
96.0
$
96.7
$
Net income/(loss) applicable to GAIN
Capital Holdings, Inc.
10.0
13.8
11.4
79.8
Change in fair value of convertible,
redeemable preferred stock embedded
derivative
-
(0.8)
-
(60.3)
Plus: Purchase intangible amortization (net of tax)
1.2
-
2.3
-
Adjusted Net Income
11.2
$
13.0
$
13.7
$
19.5
$
Adjusted Earnings per Share
(1)
Basic
0.33
$
4.35
$
0.40
$
6.54
$
Diluted
0.29
$
0.35
$
0.35
$
0.53
$
Net Income Margin %
18%
25%
12%
82%
Adjusted Net Income Margin %
20%
24%
14%
20%
In connection with the completion of our initial public offering in December 2010 (the
“IPO”), our board of directors approved a 2.29-for-1 stock split of our common
stock to be effective immediately prior to the completion of the IPO. The 2.29-for-1 stock split, after giving effect to the receipt by us
of 407,692 shares of common stock from all of our pre-IPO common stockholders (on a pro-rata
basis) in satisfaction of previously outstanding obligations owed by such stockholders to us,
resulted in an effective stock split of 2.26-for-1. Accordingly, all references to share and per share
data have been retroactively restated for the three months and six months ended June 30, 2010 to
reflect the effective 2.26-for-1 stock split. |
 Adjusted EBITDA / Margin
Reconciliation 23
Note: Dollars in millions.
Three Months Ended June 30,
Six Months Ended June 30,
2011
2010
2011
2010
Revenue
55.6
$
54.7
$
96.0
$
96.7
$
Interest on Note Payable
0.1
0.3
0.3
0.7
Revenue (ex. Interest on Note)
55.7
$
55.0
$
96.3
$
97.3
$
Net income/(loss) applicable to GAIN
Capital Holdings, Inc.
10.0
$
13.8
$
11.4
$
79.8
$
Change in fair value of convertible,
redeemable preferred stock embedded
derivative
-
(0.8)
-
(60.3)
Plus: Depreciation & amortization
1.0
0.9
1.9
1.6
Plus: Purchase intangible amortization
1.9
-
3.6
-
Plus: Interest expense of note payable
0.1
0.3
0.3
0.7
Plus: Income tax expense
6.0
7.4
6.9
11.5
Less: Net loss applicable to
non-controlling interest
-
-
-
(0.4)
Adjusted EBITDA
19.0
$
21.6
$
24.1
$
32.9
$
Adjusted EBITDA Margin %
34%
39%
25%
34% |
 Adjusted
EPS (Diluted) Reconciliation 24
(1)
Net of tax.
Three Months Ended June 30,
Six Months Ended June 30,
2011
2010
2011
2010
GAAP Earnings per Share (Diluted)
0.26
$
0.37
$
0.29
$
2.17
$
Change in fair value of convertible,
redeemable preferred stock embedded
derivative
-
(0.02)
-
(1.64)
Plus: Purchase intangible amortization
(1)
0.03
-
0.06
-
Adjusted Earnings per Share (Diluted)
(2)
0.29
$
0.35
$
0.35
$
0.53
$
In connection with the completion of our initial public offering in December 2010 (the
“IPO”), our board of directors approved a 2.29-for-1 stock split of our common
stock to be effective immediately prior to the completion of the IPO. The 2.29-for-1 stock split, after giving effect to the receipt by us of 407,692
shares of common stock from all of our pre-IPO common stockholders (on a pro-rata basis) in
satisfaction of previously outstanding obligations owed by such stockholders to us, resulted in
an effective stock split of 2.26-for-1. Accordingly, all references to share and per share data have been retroactively restated
for the three months and six months ended June 30, 2010 to reflect the effective 2.26-for-1
stock split. (2) |
 Q2 2011
Financial Summary 25
Note: Dollars in millions, except per share data.
(1)
See page 23 for a reconciliation of GAAP net income to adjusted EBITDA.
(2)
See page 22 for a reconciliation of GAAP net income to adjusted net income.
(3)
See page 24 for a reconciliation of GAAP EPS to adjusted EPS.
3 Mos. Ended June 30,
6 Mos. Ended June 30,
'11 v '10 % Change
2011
2010
2011
2010
Q2
YTD
Revenue
$55.6
$54.7
$96.0
$96.7
2%
(1%)
Interest Expense on Note Payable
0.1
0.3
0.3
0.7
(55%)
(52%)
Revenue (ex. Interest on Note)
$55.7
$55.0
$96.3
$97.4
1%
(1%)
Operating Expenses
36.7
33.4
72.2
64.5
9%
12%
Adjusted EBITDA
(1)
$19.0
$21.6
$24.1
$32.9
(12%)
(27%)
GAAP Net Income
$10.0
$13.8
$11.4
$79.8
(27%)
(86%)
Adjusted
Net
Income
(2)
11.2
13.0
13.7
19.5
(13%)
(30%)
GAAP EPS (Diluted)
$0.26
$0.37
$0.29
$2.17
(30%)
(86%)
Adjusted
EPS
(Diluted)
(3)
0.29
0.35
0.35
0.53
(17%)
(34%)
Adjusted
EBITDA
Margin
%
(1)
34%
39%
25%
34%
(5 pts)
(9 pts)
Net Income Margin %
18%
25%
12%
82%
(7 pts)
(70 pts)
Adjusted
Net
Income
Margin
%
(2)
20%
24%
14%
20%
(4 pts)
(6 pts) |
 Q2 2011
Operating Metrics 26
Note: Dollars in millions, except retail trading revenue per million.
(1)
Average calculated using excess net capital balance at month-end.
2nd Quarter
1st Half
'11 v '10 % Change
2011
2010
2011
2010
Q2
YTD
For Period Ending June 30,
Total Trading Volume (billions)
$454.6
$423.5
$967.1
$739.0
7%
31%
Retail
357.2
355.6
759.7
646.9
0%
17%
Institutional
97.4
67.9
207.4
92.1
43%
125%
Traded Retail Accounts (Period)
36,868
34,174
47,395
42,992
8%
10%
Traded Retail Accounts (Last 12 Months)
65,463
58,648
65,463
58,648
12%
12%
New Retail Accounts
8,004
10,116
16,914
20,620
(21%)
(18%)
Net Deposits from Retail Customers
$64.3
$75.6
$125.1
$137.7
(15%)
(9%)
Trades
9,363,640
8,954,401
18,389,468
16,050,100
5%
15%
Retail Trading Revenue per Million
$151.4
$153.2
$123.6
$149.2
(1%)
(17%)
As of June 30,
Funded Retail Accounts
78,395
65,294
78,395
65,294
20%
20%
Client Assets
$293.1
$222.2
$293.1
$222.2
32%
32%
Average Excess Net Capital
(1)
$60.5
$70.8
$52.8
$59.9
(15%)
(12%) |
 Monthly
Operating
Metrics
(1)
27
(1)
Definitions for all our operating metrics are available in the appendix to this
presentation. (2)
As of period ended. Dollars in millions.
(3)
For period ended.
(4)
Excludes 3,632 accounts from GAIN Capital’s acquisition of MG Financial.
(5)
Excludes 13,091 accounts from GAIN Capital’s acquisition of CMS Forex.
(6)
Excludes 1,650 accounts from GAIN Capital’s acquisition of dbFX.
Funded
New Retail
Client
Month
Retail Accts.
(2)
Accounts
(3)
Assets
(2)
Jul 2010
65,948
2,824
$220.4
Aug 2010
66,525
2,999
229.6
Sep 2010
70,858
3,056
(4)
222.4
Oct 2010
81,793
3,345
(5)
241.6
Nov 2010
84,985
3,054
263.2
Dec 2010
85,562
2,525
256.7
Jan 2011
86,236
2,904
277.0
Feb 2011
87,049
2,874
286.3
Mar 2011
85,698
3,132
283.0
Apr 2011
80,918
2,801
239.2
May 2011
79,626
2,775
(6)
290.8
Jun 2011
78,395
2,428
293.1
|
 Quarterly
Operating
Metrics
(1)
28
Note: For period ended. Volume in billions. Net deposits in
millions. (1)
Definitions for all our operating metrics are available in the appendix to this
presentation. Net Deposits
Volume
Traded Retail
From Retail
Quarter
Retail
Institutional
Accts. (Period)
Customers
Trades
Q3 10
$311.6
$43.3
32,976
$68.7
7,535,907
Q4 10
366.3
103.9
36,241
61.4
8,161,012
Q1 11
402.5
110.1
36,570
60.7
9,025,828
Q2 11
357.2
97.4
36,868
64.3
9,363,640
|
 Definition of Metrics
29
•
Total Trading Volume
–
Represents the U.S. dollar equivalent of notional amounts traded
•
Traded Retail Accounts
–
Retail accounts who executed a transaction during a given period
•
Funded Retail Accounts
–
Retail accounts who maintain a cash balance
•
Client Assets
–
Represents amounts due to clients, including customer deposits and unrealized
gains or losses arising from open positions
•
New Retail Accounts
–
The number of customer accounts that have initially opened and funded their
accounts •
Net Deposits from Retail Customers
–
Represents customers’
deposits less withdrawals for a given period
•
Trades
–
The
number
of
transactions
retail
customers
have
completed
for
a
given
period
•
Retail Trading Revenue per Million
–
The revenue we realize from our forex, CFDs and metals trading activities per one
million of U.S. dollar-equivalent trading volume
•
Excess Net Capital
–
Represents the excess funds held over the regulatory minimum capital requirements,
as defined by the regulatory bodies that regulate our operating
subsidiaries |
 2
nd
Quarter 2011
Financial and Operating Results
July 28, 2011 |