Attached files
| file | filename |
|---|---|
| 8-K - FORM 8-K - C. H. ROBINSON WORLDWIDE, INC. | d8k.htm |
| EX-99.1 - PRESS RELEASE - C. H. ROBINSON WORLDWIDE, INC. | dex991.htm |
Exhibit 99.2
C.H. ROBINSON
WORLDWIDE, INC.
Earnings Conference Call – Second Quarter 2011
July 26, 2011
John Wiehoff, Chairman & CEO
Chad Lindbloom, CFO
Angie Freeman, VP Investor Relations
©2011 C.H. ROBINSON WORLDWIDE, INC. ALL RIGHTS RESERVED

Safe Harbor Statement
Except for the historical information contained herein, the matters set forth in this presentation and the accompanying earnings release are forward-looking statements that represent our expectations, beliefs, intentions or strategies concerning future events. These forward-looking statements are subject to certain risks and uncertainties that could cause actual results to differ materially from our historical experience or our present expectations, including, but not limited to such factors as changes in economic conditions, including uncertain consumer demand; changes in market demand and pressures on the pricing for our services; competition and growth rates within the third party logistics industry; freight levels and increasing costs and availability of truck capacity or alternative means of transporting freight, and changes in relationships with existing truck, rail, ocean and air carriers; changes in our customer base due to possible consolidation among our customers; our ability to integrate the operations of acquired companies with our historic operations successfully; risks associated with litigation and insurance coverage; risks associated with operations outside of the U.S.; risks associated with the potential impacts of changes in government regulations; risks associated with the produce industry, including food safety and contamination issues; fuel prices and availability; and the impact of war on the economy; and other risks and uncertainties detailed in our Annual and Quarterly Reports.
2 ©2011 C.H. ROBINSON WORLDWIDE, INC. ALL RIGHTS RESERVED
C.H. ROBINSON WORLDWIDE, INC.
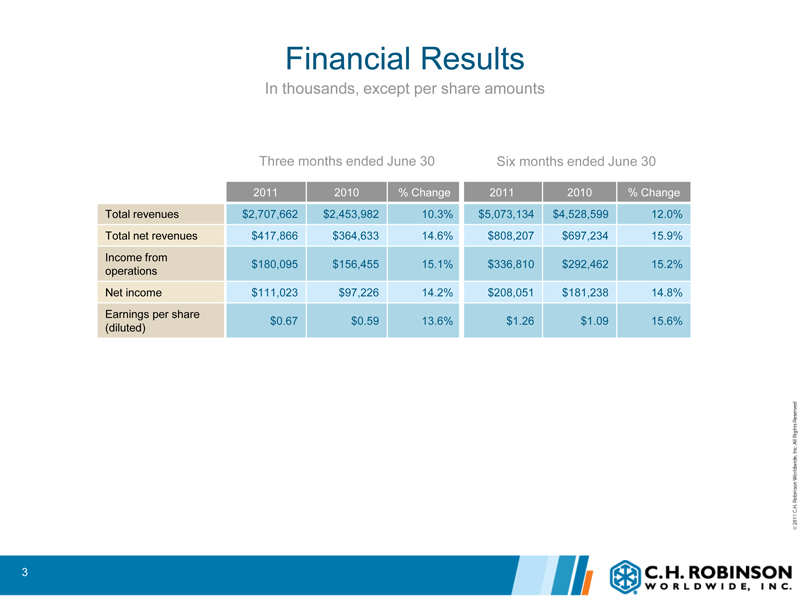
Financial Results
In thousands, except per share amounts
Three months ended June 30 Six months ended June 30
2011 2010% Change 2011 2010% Change
Total revenues $2,707,662 $2,453,982 10.3% $5,073,134 $4,528,599 12.0%
Total net revenues $417,866 $364,633 14.6% $808,207 $697,234 15.9%
Income from $180,095 $156,455 15.1% $336,810 $292,462 15.2%
operations
Net income $111,023 $97,226 14.2% $208,051 $181,238 14.8%
Earnings per share
(diluted) $0.67 $0.59 13.6% $1.26 $1.09 15.6%
3 ©2011 C.H. ROBINSON WORLDWIDE, INC. ALL RIGHTS RESERVED
C.H. ROBINSON WORLDWIDE, INC.
Transportation Results Q2 2011
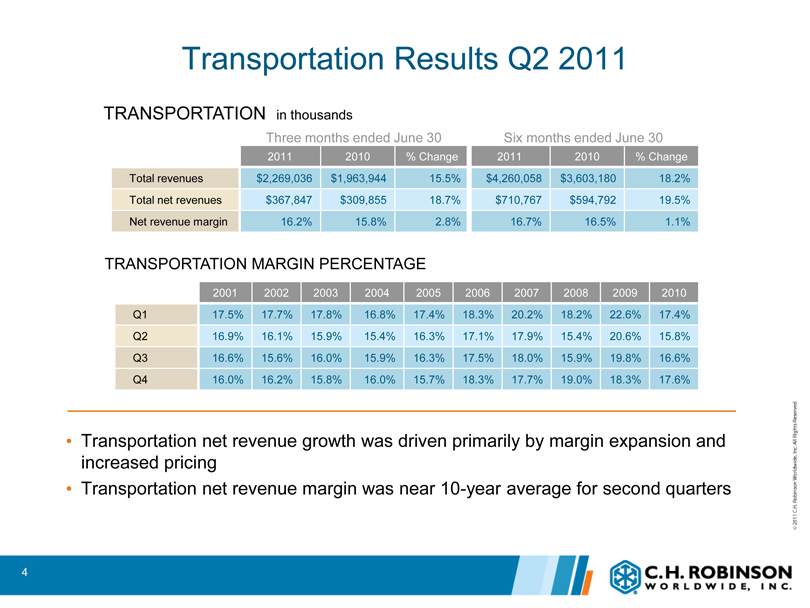
TRANSPORTATION in thousands
Three months ended June 30 Six months ended June 30
2011 2010% Change 2011 2010% Change
Total revenues $2,269,036 $1,963,944 15.5% $4,260,058 $3,603,180 18.2%
Total net revenues $367,847 $309,855 18.7% $710,767 $594,792 19.5%
Net revenue margin 16.2% 15.8% 2.8% 16.7% 16.5% 1.1%
TRANSPORTATION MARGIN PERCENTAGE
2001 2002 2003 2004 2005 2006 2007 2008 2009 2010
Q1 17.5% 17.7% 17.8% 16.8% 17.4% 18.3% 20.2% 18.2% 22.6% 17.4%
Q2 16.9% 16.1% 15.9% 15.4% 16.3% 17.1% 17.9% 15.4% 20.6% 15.8%
Q3 16.6% 15.6% 16.0% 15.9% 16.3% 17.5% 18.0% 15.9% 19.8% 16.6%
Q4 16.0% 16.2% 15.8% 16.0% 15.7% 18.3% 17.7% 19.0% 18.3% 17.6%
•Transportation net revenue growth was driven primarily by margin expansion and increased pricing
•Transportation net revenue margin was near 10-year average for second quarters
4 ©2011 C.H. ROBINSON WORLDWIDE, INC. ALL RIGHTS RESERVED
C.H. ROBINSON WORLDWIDE, INC.
Truck Results Q2 2011
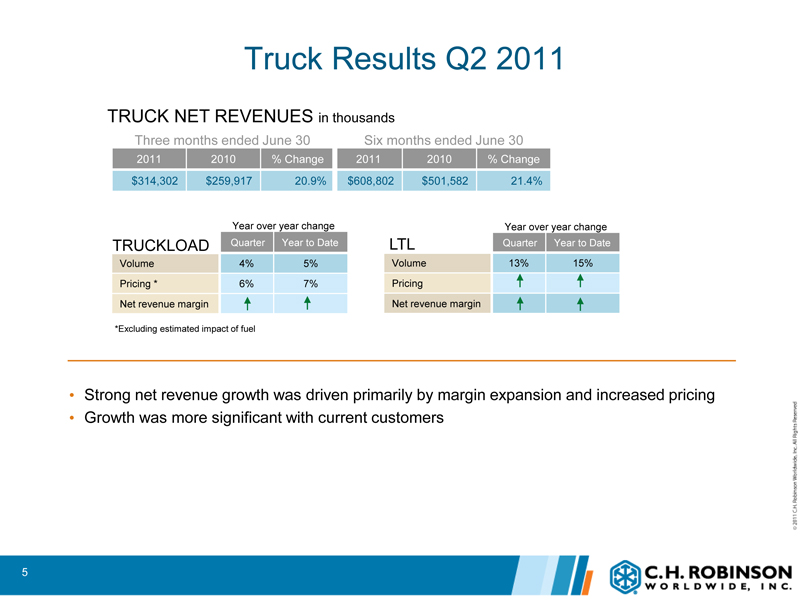
TRUCK NET REVENUES in thousands
Three months ended June 30 Six months ended June 30
2011 2010% Change 2011 2010% Change
$314,302 $259,917 20.9% $608,802 $501,582 21.4%
Year over year change
TRUCKLOAD Quarter Year to Date
Volume 4% 5%
Pricing * 6% 7%
Net revenue margin
*Excluding estimated impact of fuel
Year over year change
LTL Quarter Year to Date
Volume 13% 15%
Pricing
Net revenue margin
•Strong net revenue growth was driven primarily by margin expansion and increased pricing •Growth was more significant with current customers
5 ©2011 C.H. ROBINSON WORLDWIDE, INC. ALL RIGHTS RESERVED
|
|
C.H. ROBINSON WORLDWIDE, INC.
Intermodal Results Q2 2011
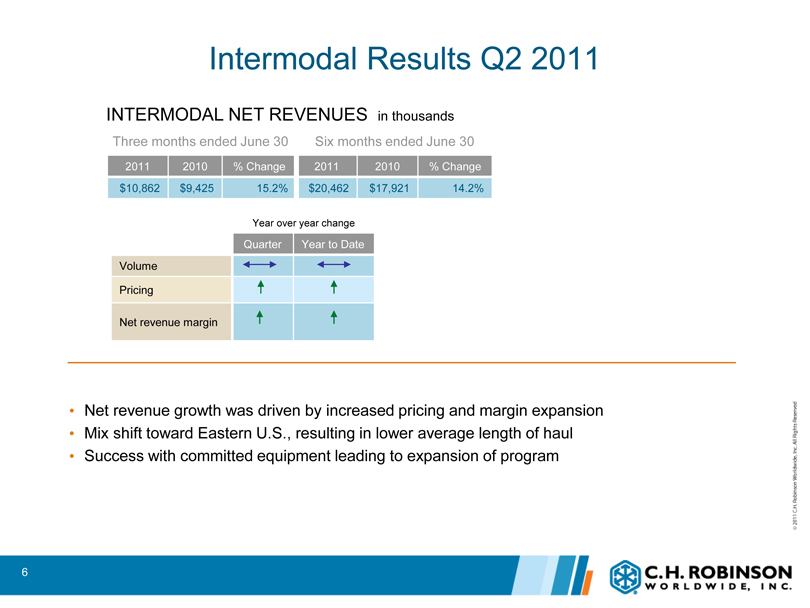
INTERMODAL NET REVENUES in thousands
Three months ended June 30 Six months ended June 30
2011 2010% Change 2011 2010% Change
$10,862 $9,425 15.2% $20,462 $17,921 14.2%
Year over year change
Quarter Year to Date
Volume
Pricing
Net revenue margin
•Net revenue growth was driven by increased pricing and margin expansion •Mix shift toward Eastern U.S., resulting in lower average length of haul •Success with committed equipment leading to expansion of program
6 ©2011 C.H. ROBINSON WORLDWIDE, INC. ALL RIGHTS RESERVED
|
|
C.H. ROBINSON WORLDWIDE, INC.
Ocean & Air Results Q2 2011
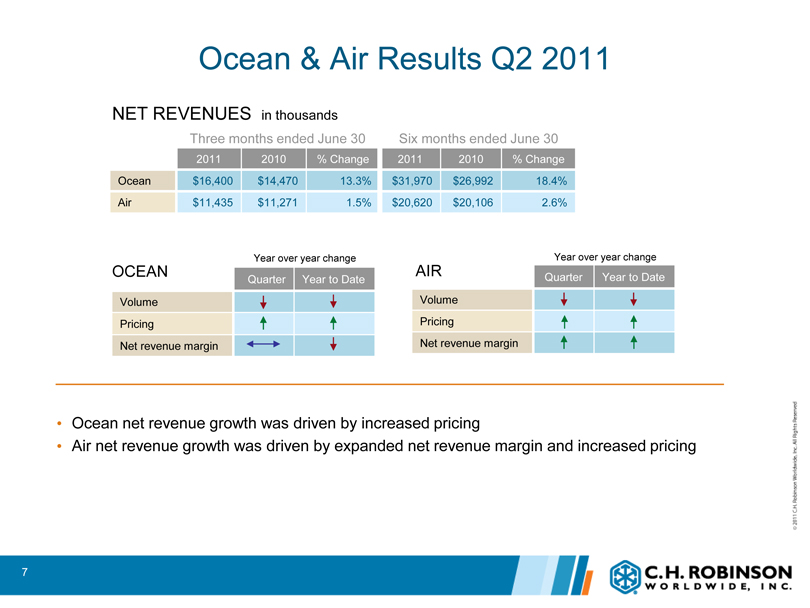
NET REVENUES in thousands
Three months ended June 30 Six months ended June 30
2011 2010% Change 2011 2010% Change
Ocean $16,400 $14,470 13.3% $31,970 $26,992 18.4%
Air $11,435 $11,271 1.5% $20,620 $20,106 2.6%
Year over year change Year over year change
OCEAN AIR
Quarter Year to Date Quarter Year to Date
Volume Volume
Pricing Pricing
Net revenue margin Net revenue margin
•Ocean net revenue growth was driven by increased pricing
•Air net revenue growth was driven by expanded net revenue margin and increased pricing
7 ©2011 C.H. ROBINSON WORLDWIDE, INC. ALL RIGHTS RESERVED
|
|
C.H. ROBINSON WORLDWIDE, INC.
Other Logistics Services Results Q2 2011
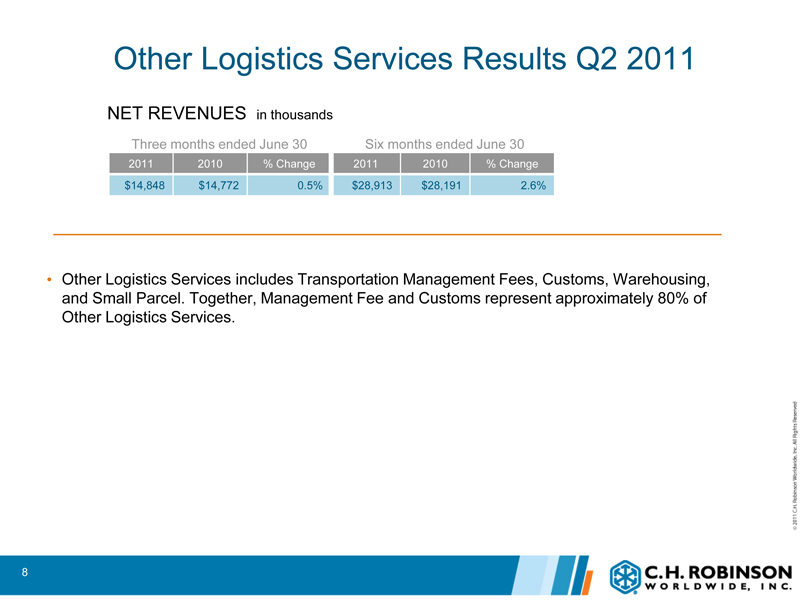
NET REVENUES in thousands
Three months ended June 30 Six months ended June 30
2011 2010% Change 2011 2010% Change
$14,848 $14,772 0.5% $28,913 $28,191 2.6%
•Other Logistics Services includes Transportation Management Fees, Customs, Warehousing, and Small Parcel. Together, Management Fee and Customs represent approximately 80% of Other Logistics Services.
8 ©2011 C.H. ROBINSON WORLDWIDE, INC. ALL RIGHTS RESERVED
|
|
C.H. ROBINSON WORLDWIDE, INC.
Sourcing Results Q2 2011
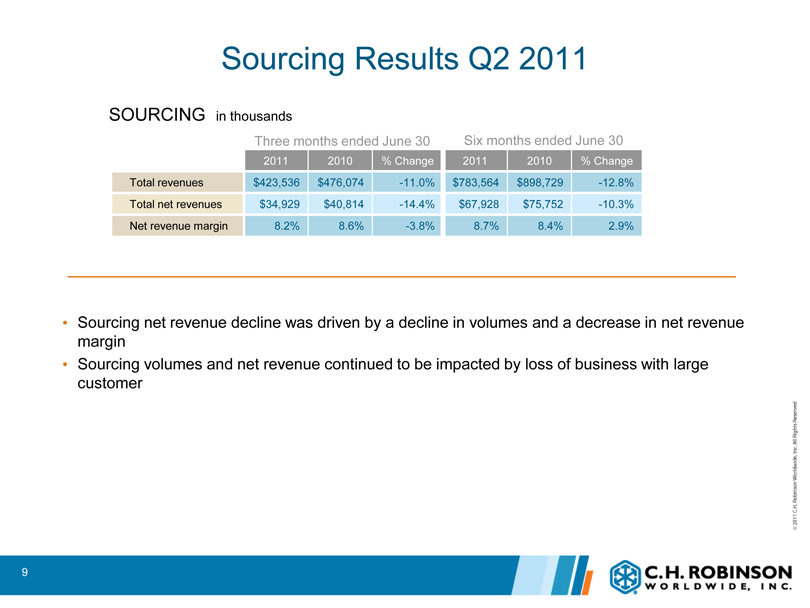
SOURCING in thousands
Three months ended June 30 Six months ended June 30
2011 2010% Change 2011 2010% Change
Total revenues $423,536 $476,074 -11.0% $783,564 $898,729 -12.8%
Total net revenues $34,929 $40,814 -14.4% $67,928 $75,752 -10.3%
Net revenue margin 8.2% 8.6% -3.8% 8.7% 8.4% 2.9%
•Sourcing net revenue decline was driven by a decline in volumes and a decrease in net revenue margin •Sourcing volumes and net revenue continued to be impacted by loss of business with large customer
9 ©2011 C.H. ROBINSON WORLDWIDE, INC. ALL RIGHTS RESERVED
|
|
C.H. ROBINSON WORLDWIDE, INC.
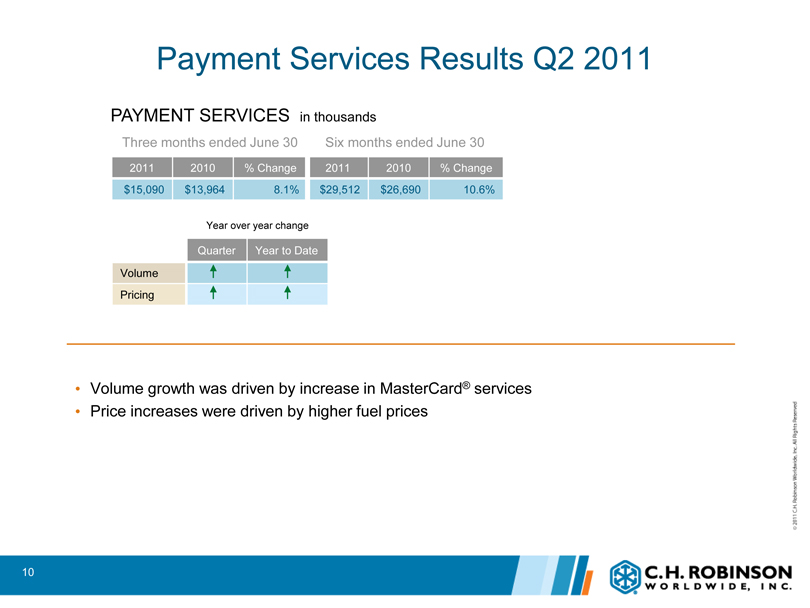
Payment Services Results Q2 2011
PAYMENT SERVICES in thousands
Three months ended June 30 Six months ended June 30
2011 2010% Change 2011 2010% Change
$15,090 $13,964 8.1% $29,512 $26,690 10.6%
Year over year change
Quarter Year to Date
Volume Pricing
•Volume growth was driven by increase in MasterCard® services •Price increases were driven by higher fuel prices
10 ©2011 C.H. ROBINSON WORLDWIDE, INC. ALL RIGHTS RESERVED
|
|
C.H. ROBINSON WORLDWIDE, INC.
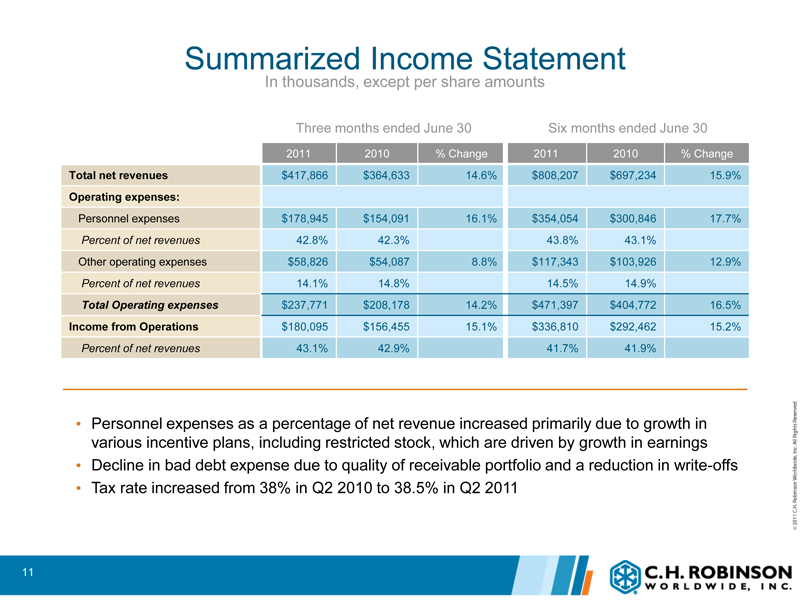
Summarized Income Statement
In thousands, except per share amounts
Three months ended June 30 Six months ended June 30
2011 2010% Change 2011 2010% Change
Total net revenues $417,866 $364,633 14.6% $808,207 $697,234 15.9%
Operating expenses:
Personnel expenses $178,945 $154,091 16.1% $354,054 $300,846 17.7%
Percent of net revenues 42.8% 42.3% 43.8% 43.1%
Other operating expenses $58,826 $54,087 8.8% $117,343 $103,926 12.9%
Percent of net revenues 14.1% 14.8% 14.5% 14.9%
Total Operating expenses $237,771 $208,178 14.2% $471,397 $404,772 16.5%
Income from Operations $180,095 $156,455 15.1% $336,810 $292,462 15.2%
Percent of net revenues 43.1% 42.9% 41.7% 41.9%
•Personnel expenses as a percentage of net revenue increased primarily due to growth in various incentive plans, including restricted stock, which are driven by growth in earnings •Decline in bad debt expense due to quality of receivable portfolio and a reduction in write-offs •Tax rate increased from 38% in Q2 2010 to 38.5% in Q2 2011
11 ©2011 C.H. ROBINSON WORLDWIDE, INC. ALL RIGHTS RESERVED
|
|
C.H. ROBINSON WORLDWIDE, INC.
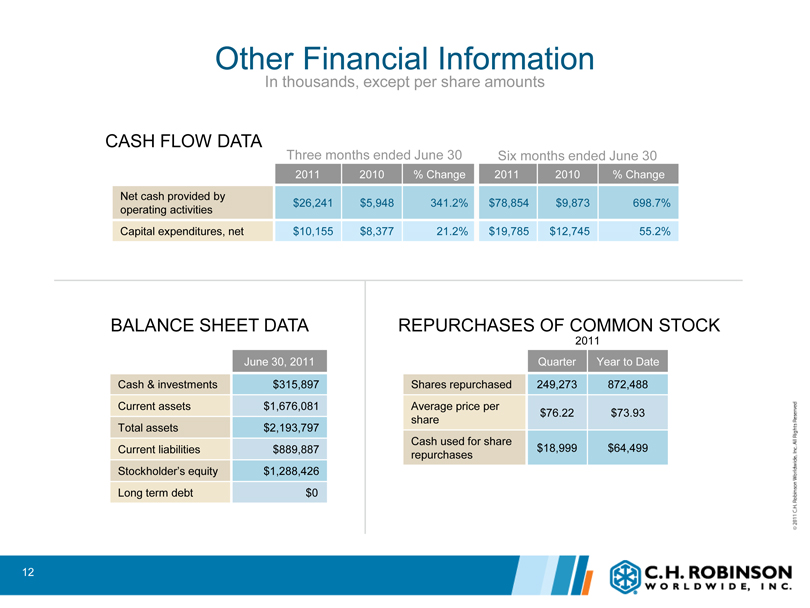
Other Financial Information
In thousands, except per share amounts
CASH FLOW DATA
Three months ended June 30 Six months ended June 30
2011 2010% Change 2011 2010% Change
Net cash provided by $26,241 $5,948 341.2% $78,854 $9,873 698.7%
operating activities
Capital expenditures, net $10,155 $8,377 21.2% $19,785 $12,745 55.2%
BALANCE SHEET DATA
June 30, 2011
Cash & investments $315,897
Current assets $1,676,081
Total assets $2,193,797
Current liabilities $889,887
Stockholder’s $1,288,42 6 equity
Long term debt $0
REPURCHASES OF COMMON STOCK
2011
Quarter Year to Date
Shares repurchased 249,273 872,488
Average price per $76.22 $73.93
share
Cash used for share $18,999 $64,499
repurchases
12 ©2011 C.H. ROBINSON WORLDWIDE, INC. ALL RIGHTS RESERVED
C.H. ROBINSON WORLDWIDE, INC.
Summary Q2 2011
•Transportation net revenue growth was driven primarily by margin expansion and increased pricing •Sourcing net revenue was impacted by continued loss of business with large customer •Operating expense growth was in line with growth of business •Continued uncertainty and volatility in marketplace
13 ©2011 C.H. ROBINSON WORLDWIDE, INC. ALL RIGHTS RESERVED
C.H. ROBINSON WORLDWIDE, INC.

C.H. ROBINSON WORLDWIDE, INC.