Attached files
| file | filename |
|---|---|
| EX-32.2 - MAGMA DESIGN AUTOMATION INC | lavaexhibit322.htm |
| EX-21.1 - MAGMA DESIGN AUTOMATION INC | lavaexhibit211.htm |
| EX-31.1 - MAGMA DESIGN AUTOMATION INC | lavaexhibit311.htm |
| EX-31.2 - MAGMA DESIGN AUTOMATION INC | lavaexhibit312.htm |
| EX-32.1 - MAGMA DESIGN AUTOMATION INC | lavaexhibit321.htm |
| EX-23.1 - AUDITOR'S CONSENT - MAGMA DESIGN AUTOMATION INC | lavaexhibit231.htm |
UNITED STATES
SECURITIES AND EXCHANGE COMMISSION
Washington, D.C. 20549
FORM 10-K
(Mark One)
S ANNUAL REPORT PURSUANT TO SECTION 13 OR 15(d) OF THE SECURITIES EXCHANGE ACT OF 1934
For the fiscal year ended May1, 2011
or
£ TRANSITION REPORT PURSUANT TO SECTION 13 OR 15(d) OF THE SECURITIES EXCHANGE ACT OF 1934
For the transition period from to
COMMISSION FILE NO.: 0-33213
MAGMA DESIGN AUTOMATION, INC.
(Exact name of Registrant as specified in its charter)
DELAWARE | 77-0454924 |
(State or other jurisdiction of incorporation or organization) | (I.R.S. Employer Identification No.) |
1650 Technology Drive
San Jose, California 95110
(408) 565-7500
(Address, including zip code, and telephone number, including area code, of the registrant's principal executive offices)
SECURITIES REGISTERED PURSUANT TO SECTION 12(b) OF THE ACT:
Title of Each Class: | Name of Each Exchange on Which Registered: |
COMMON STOCK, par value $0.0001 per share | The Nasdaq Stock Market LLC (Nasdaq Global Market) |
SECURITIES REGISTERED PURSUANT TO SECTION 12(g) OF THE ACT:
None
Indicate by check mark if the registrant is a well-known seasoned issuer, as defined in Rule 405 of the Securities Act. Yes £ No S
Indicate by check mark if the registrant is not required to file reports pursuant to Section 13 or Section 15(d) of the Act. Yes £ No S
Indicate by check mark whether the registrant: (1) has filed all reports required to be filed by Section 13 or 15(d) of the Securities Exchange Act of 1934 during the preceding 12 months (or for such shorter period that the registrant was required to file such reports), and (2) has been subject to such filing requirements for the past 90 days. Yes S No £
Indicate by check mark whether the registrant has submitted electronically and posted on its corporate Web site, if any, every Interactive Data File required to be submitted and posted pursuant to Rule 405 of Regulation S-T during the preceding 12 months (or for such shorter period that the registrant was required to submit and post such files). Yes £ No £
Indicate by check mark if disclosure of delinquent filers pursuant to Item 405 of Regulation S-K is not contained herein, and will not be contained, to the best of the registrant's knowledge, in definitive proxy or information statements incorporated by reference in Part III of this Form 10-K or any amendment to this Form 10-K. S
Indicate by check mark whether the registrant is a large accelerated filer, an accelerated filer, a non-accelerated filer, or a smaller reporting company. See the definitions of “large accelerated filer,” “accelerated filer” and “smaller reporting company” in Rule 12b-2 of the Exchange Act. (Check one):
Large accelerated filer £ | Accelerated filer S |
Non-accelerated filer £ (Do not check if a smaller reporting company) | Smaller reporting company £ |
Indicate by check mark whether the registrant is a shell company (as defined in Rule 12b-2 of the Act). Yes £ No S
The aggregate market value of the registrant's common stock held by non-affiliates of the registrant, based upon the closing sale price of the registrant's common stock on October 29, 2010, the last business day of the registrant's most recently completed second fiscal quarter, as reported on the Nasdaq Global Market, was $279,920,702. This calculation does not reflect a determination that certain persons are affiliates of the registrant for any other purpose.
As of July 12 2011, the registrant had outstanding 68,153,433 shares of Common Stock, $0.0001 par value.
DOCUMENTS INCORPORATED BY REFERENCE:
Part III incorporates by reference certain information from the registrant's definitive proxy statement (the “Proxy Statement”) for the 2011 Annual Meeting of Stockholders, which will be filed with the Securities and Exchange Commission within 120 days of the end of the 2011 fiscal year. Except with respect to information specifically incorporated by reference in this Form 10-K, the Proxy Statement is not deemed to be filed as part hereof.
MAGMA DESIGN AUTOMATION, INC.
ANNUAL REPORT ON FORM 10-K
Year ended May 1, 2011
TABLE OF CONTENTS
Page | ||
PART I | ||
Item 1. | ||
Item 1A. | ||
Item 1B. | ||
Item 2. | ||
Item 3. | ||
Item 4. | ||
PART II | ||
Item 5. | ||
Item 6. | ||
Item 7. | ||
Item 7A. | ||
Item 8. | ||
Item 9. | ||
Item 9A. | ||
Item 9B. | ||
PART III | ||
Item 10. | ||
Item 11. | ||
Item 12. | ||
Item 13. | ||
Item 14. | ||
PART IV | ||
Item 15. | ||
Magma, Blast Fusion, Blast Noise, QuickCap, SiliconSmart, Talus and YieldManager are registered trademarks, and ArchEvaluator, Blast Power, Blast Plan, Blast Rail, Blast Create, Quartz, Blast Yield, Camelot, “The Fastest Path from RTL to Silicon,” Distributed Smart Sync, Excalibur, Excalibur Litho, FineSim, Native Parallel Technology, QCP, “Sign-off in the Loop”, Tekton and Titan are trademarks of Magma Design Automation, Inc. All other product and company names are trademarks and registered trademarks of their respective companies.
1
PART I
ITEM 1. | BUSINESS |
Overview
Magma Design Automation, Inc., also referred to as “we,” “us” or “Magma” in this Form 10-K, provides electronic design automation (“EDA”) software products and related services. Our software enables chip designers to reduce the time it takes to design and produce complex integrated circuits used in the wireless, communications, computing, consumer electronics, networking and semiconductor industries. Our flagship products comprise an integrated solution for both digital and analog circuitry, from initial planning and design through physical implementation and a linear multi-computing scalable analog simulation.
Our software products allow chip designers to meet critical time-to-market objectives, improve chip performance and handle chip designs involving millions of components. For digital design and sign-off, our flagship Talus family of implementation products combined with our Tekton family of sign-off and verification products deliver an integrated chip design and verification flow combining logic design, physical design, and analysis and sign-off processes. This integrated flow significantly reduces design iterations, allowing our customers to accelerate the time it takes to design and produce deep submicron integrated circuits. For analog and mixed-signal designs, our Titan platform for custom integrated chip design and our FineSim platform for analog verification provides a complete flow for characterizing, designing, and implementing analog designs as well as providing a chip-finishing solution for mixed-signal designs.
We also offer software solutions to semiconductor manufacturers for managing and improving semiconductor yields. Our Excalibur family of products helps manufacturers identify and correct design defects and also perform failure analysis.
We provide consulting, training, and services to help our customers more rapidly adopt our technology. We also provide post-contract support or maintenance, for our products.
Evolution of the Electronic Design Automation Market
The trend toward deep submicron and system-on-chip designs has driven demand for improved electronic design automation software that enables the efficient design and implementation of these complex chips. Limitations in traditional electronic design automation technology could slow the adoption of deep submicron processes due to the difficulty in implementing designs at these small feature sizes. Historically, electronic design automation companies developed software for use by separate engineering groups to address either the front-end chip design or back-end chip implementation including chip signoff processes.
In the front-end design process, the chip design is conceptualized and written as a register transfer level computer program, or RTL file, that describes the required functionality of the chip. For large chips, the design is often divided into a number of individual blocks, each with its own associated RTL file. This is often done because of capacity limitations in existing electronic design automation tools. The designer also develops constraints for the design that are used to describe the desired timing performance of the chip. Finally, a target library is specified that contains detailed information about the basic functional building blocks, or logic gates, which will be used in the design. This library is typically provided by the semiconductor vendor or a third-party library vendor. The next step is to run the RTL files through synthesis software that generates a netlist. The netlist describes the circuit in terms of logic gates selected from the target library and connected such that the functionality specified in the RTL files is realized. The synthesis software also performs optimizations to attempt to meet the timing constraints specified by the designer.
A critical objective of chip design is to minimize total circuit delay, which is comprised of gate delay and wire delay. Front-end software was initially developed when the gate delay, or the time it takes for an electrical signal to travel through a logic gate, was the most significant component of total circuit delay. Wire delay, or the time it takes for a signal to travel through a wire connecting two or more gates, was negligible and designers could use simple estimates and still meet targeted circuit speeds. In recent times, minimization of power consumption has become a key objective of our chip design and is considered during the front-end process of the design flow.
In the back-end implementation process, physical design software is used to transform the netlist generated by the front-end process into a physical layout of the chip. The resulting physical layout is usually output in the binary file format Graphics Data System II, commonly referred to as GDSII, that is used to generate the photomasks used to manufacture the integrated circuit. The primary functions provided by traditional physical design software are placement, routing, and layout sign-off analysis or verification. Placement determines the optimal physical location for the logic gates on the integrated circuit. After placement is completed, routing connects the logic gates with wires to achieve the desired circuit functionality. After the layout is completed, timing analysis and physical verification are run to verify that the chip will run at the desired circuit speed and physically correct for the manufacturing. If circuit speeds are slower than the speeds reported by the synthesis software, the design must often be iterated back through the synthesis step in an attempt to improve the timing. Since each timing closure iteration cycle can take one or more weeks, successive iterations of the design process can significantly lengthen the time it takes to design and produce
2
new chips.
Integrated circuit (“IC”) designs, which are both large and highly integrated, require advanced technology to create and maintain chip floor plans. Creating hierarchical chip floor plans traditionally has been a manual error-prone task with less optimal quality of results in terms of chip die area and performance. Alternative flat chip design methodologies simplify floor plan creation but can suffer from long turnaround times making them unacceptable.
Deep Submicron Challenges
The trend toward deep submicron technology has rendered traditionally separate front-end and back-end electronic design automation processes less effective for rapid, cost-effective and reliable chip designs. As integrated circuits have increased in complexity and feature sizes have dropped, the problems faced by chip designers have changed. Wire delay now accounts for the majority of total circuit delay and has become the most significant factor in circuit performance for deep submicron technologies. Front-end estimates of wire delay may vary considerably from actual wire delays measured in the final layout. As a result, the front-end timing might meet the design requirements, but the final layout timing at the completion of the back-end or analysis signoff process may be unacceptable, requiring time-consuming iterations back through the front-end process.
Deep submicron process technologies bring additional complexities to the design and implementation process that can cause chip failures. These complexities include, among others, signal integrity problems such as electrical interference from wires in close proximity, commonly referred to as crosstalk or noise that can affect both circuit performance and functionality. Using existing design flows and software, designers must contend with analyzing and fixing these problems manually after the layout is completed. These adjustments often change the chip timing and further contribute to the timing closure problem.
These deep submicron challenges make it difficult to efficiently design chips using separate front-end and back-end processes. Semiconductor manufacturers and electronic products companies are currently seeking alternatives to older generation electronic design automation software to shorten design time, improve circuit speed, handle larger chip designs and improve analysis accuracy. As a result, we believe that a significant opportunity exists for newer electronic design automation approaches to chip design that can enable the design of more complex deep submicron integrated circuits, improve performance, reduce power consumption and significantly reduce the time it takes to design and produce next-generation electronic products.
Our Solution
The important technical foundations for our software products are found within our unified data model architecture, platform logic synthesis, interconnect synthesis, physical implementation, physical verification, analog verification, IP characterization, design-for-manufacturability (“DFM”), silicon sign-off and our mixed-signal design platform, which allow our customers to reduce the number of iterations that are often required in conventional integrated circuit design processes.
Logic Design
Our fast, high-capacity logic synthesis provides a common front-end to standard cell application-specific integrated circuit (“ASIC”) platforms. A single RTL representation of the design is synthesized to a technology-independent netlist and taken through architecture-specific mapping and physical synthesis to predict the area, performance, power, testability and routability during physical implementation.
Design Implementation
Unified Data Model Architecture
Conventional electronic design automation flows are typically based on a collection of software programs that have their own associated data models, often resulting in cumbersome design flows. We believe that we are the only electronic design automation vendor that offers a complete integrated circuit design implementation flow based on a unified data model. Our unified data model architecture is a key enabler for our ability to deliver automated signal integrity detection and correction, and integrated power optimization and analysis. The unified data model contains all the logical and physical information about the design and is resident in core memory during execution. The various functional elements of our software, such as the implementation engines for synthesis, placement and routing, and our analysis software for timing, RC and delay extraction, power, and signal integrity, all operate directly on this data model. Because the data model is concurrently available to all the engines and analysis software, it is possible to analyze the design and make rapid trade-off decisions during the physical design process, thereby reducing design iterations.
Interconnect Synthesis
Interconnect Synthesis is a relatively recent addition to our integrated circuit implementation design flow. With Interconnect Synthesis, optimization for timing, crosstalk, on-chip variation (“OCV”), power and yield are performed in the routing phase, rather than relying on logic optimization during logic synthesis as has historically been done. Optimization in logic synthesis alone was insufficient as wireload models started failing at 130 nanometers and below. At 65 nanometers and below, wire delay and the effect of their neighbors contribute to almost all deep-submicron effects. Accordingly, optimization has to be done as wires are assigned to tracks and are being routed. This move to combine optimization and routing requires a flow with a relatively new
3
approach that is Interconnect Synthesis.
Physical Verification and Design for Manufacturability
Every completed physical layout must be analyzed and manipulated before final manufacturing. This process, commonly called physical verification, has increased in complexity and importance as manufacturing technology has moved from 130 nanometers to 90 nanometers, and now to 65 nanometers and below. Moreover, new physical phenomena at these manufacturing nodes, including optical proximity correction (“OPC”) and chemical-mechanical-polishing (“CMP”) effects, have introduced the need for new design-for-manufacturing technologies.
Our physical verification products, including Quartz DRC™ and Quartz LVS™, were designed specifically to address the challenges at 65 nanometers and below. Quartz DRC™ and Quartz LVS™ have been designed to be highly scalable. By using techniques that enable fine-grain parallelism, Quartz DRC™ and Quartz LVS™ are able to use a large number (up to 100) of separate Linux machines on a standard computer network. This ability to do distributed processing on a standard Linux machine provides the ability to linearly increase the speed of processing (doubling the number of processors doubles the speed) for design rule checking. This scalability is essential to achieving a fast turnaround time.
We have a strong position in design for manufacturability as we now offer both a leading physical design system and a physical verification system.
Silicon Sign-off
Design teams have traditionally relied upon one set of tools for implementation and another set of tools for sign-off analysis. While this separation enables an advantageous trade-off with respect to accuracy versus runtime, it also requires corrective iteration loops when discrepancies are found during sign-off analysis. With the increased analysis challenges that 65-nanometer and smaller processes present, such as combining noise analysis with OCV, across ever-increasing process corners and operating modes, the use of separate point sign-off tools becomes a primary bottleneck in the drive to improve design cycle time. Our integrated sign-off flow breaks the sign-off iteration bottleneck by making sign-off-level analysis directly available during the implementation flow. Sign-off solution consists of both extraction and timing analysis. The capabilities of extraction are augmented by the integration of QuickCap technology. QuickCap is an industry standard for reference parasitic extraction. The inclusion of this technology into a full-chip extractor enables users to attain the highest possible accuracy for the most timing-critical nets on a chip.
Custom/Mixed-Signal
Analog design flows and teams historically have been isolated from digital design. Analog integrated circuits have typically been full-custom and painstakingly crafted by hand. In addition to being time-consuming and prone to error, this transistor-level design style does not allow an existing design to be easily transferred to a new foundry or process/technology node. With Magma's mixed-signal Titan platform, analog designers can apply their expertise in defining the first circuit topology, but porting to new geometry nodes is easier.
Analog and mixed-signal designers face many challenges in verifying their designs with traditional simulation technology. Many designs require several days or even weeks to converge on an accurate solution. Also, due to increasing design complexity, many designers are unable to thoroughly verify their designs due to capacity limitations. With Magma's FineSIM multi-CPU and multi-machine technology, analog designers are able to simulate large analog designs that could never before be analyzed in Simulation Program with Integrated Circuit Emphasis ("SPICE") or fast-SPICE circuit solvers.
Products
Below is a description of our major products.
Talus® Design™ is a key component of the next-generation RTL-to-GDSII Talus® platform. This product enables logic designers to synthesize, evaluate, and improve the quality of their RTL code, design constraints, testability requirements and floorplan. The physical netlist generated by Talus® Design™ provides a clean hand-off between the RTL designer and layout engineer, eliminating back-to-front iterations necessary for timing closure in conventional flows.
Talus® Vortex™ is our place and route product within the next-generation Talus® platform. Talus® Vortex™ flow begins with design netlist, target library, and design constraints. It utilizes state-of-the-art implementation automation to produce a physical layout and routing connection of the design to meet timing, area, power, clock, and routing requirements for manufacture.
Talus® Vortex™ FX™ is innovative new technology providing the industry's only distributed (multi-machine, multi-threaded) netlist to GDSII implementation solution. Talus® Vortex™ FX™ through Distributed Smart Sync Technology delivers significant capacity and throughput advantages over existing implementation solutions.
Talus® Power Pro™ is an optimization option to Talus® Design™ and Talus® Vortex™ for advanced low-power needs. By using Talus® Power Pro™, dynamic and leakage power can be minimized while meeting design performance, area, and manufacturing
4
requirements. Multiple techniques are employed and embodied in a design flow to maximize the automation required to meet aggressive design schedules.
Tekton™ is our new standalone static timing analyzer. Tekton™ provides both standard timing analysis and signoff analysis (crosstalk and on-chip variation). In addition to being architected for fast execution and capacity, Tekton™ includes the native capability to run multi-mode / multi-corner timing analysis - a key requirement in analyzing designs at 40 nanometers and below.
QCP™ is our new standalone SoC (system-on-chip) parasitic extractor. QCP™ is architected for high capacity and fast execution with accuracy within a few percent of our gold standard QuickCap product. QCP™ provides a complete multi-corner extraction solution that adds only a minimal amount of runtime overhead for each additional PVT (process, voltage, temperature) corner.
Talus® qDRC™ is an integrated-physical-design verification tool for direct use during implementation. Using foundry-certified design-rule runsets, Talus® qDRC™ increases productivity by providing sign-off-quality DRC from within the implementation environment.
Hydra™ is a hierarchical design planning solution that combines designer expertise with automation to significantly improve efficiency in evaluating design feasibility of advanced-node, multimillion-cell designs. Advanced hierarchy aware planning and physical optimization utilizing common analysis engines and a unified data model, enable designers to reliably achieve design closure. Hydra™ is a standalone solution that is also fully integrated into Magma's RTS-to-GDSII flow.
QuickCap® is the industry's leading parasitic extraction technology. QuickCap® is a highly accurate 3D-field solver used in parameter extraction and rules generation, library cell extraction, critical cell analysis, and critical net analysis.
QuickCap® NX™ is an enhanced version of the QuickCap® tool, targeted to address specific design challenges that occur in 90-nanometer and smaller process technologies.
Quartz DRC™ and Quartz LVS™ are targeted to provide the fastest turnaround time of any physical verification tools, with full sign-off accuracy.
SiliconSmart® products provide robust timing, power, and signal integrity models in a variety of industry standard formats.
FineSim Pro™ is a next-generation, highly accurate fast circuit simulator with full-chip analysis capabilities, including advanced post-layout simulation features, high accuracy with low memory usage and high performance.
FineSim SPICE™ is a unique, native parallel, true SPICE simulator that enables the simulation of analog and mixed-signal circuits with full SPICE accuracy, which previously could only be simulated with fast-SPICE simulators.
FineSim Fast Monte Carlo™ is an innovative technology that provides a significant improvement over traditional Monte Carlo methods by providing a faster, more accurate statistical analysis for analog and mixed-signal circuits.
FineWave™ is a waveform viewer and analyzer capable of displaying digital, analog and mixed-mode signals.
Titan Mixed-Signal Design Platform™ is a unified mixed-signal design cockpit with a very high capacity and a very fast database access mechanism. Titan™ comprises user-friendly full-custom schematic and layout editors, an analog simulation environment integrated with the FineSim™ simulator, correct-by-design schematic-driven layout and integration with Magma's tools for physical verification and digital implementation. By fully embedding Talus for digital design, Titan combines full-custom analog design tools with a digital flow for high-level mixed-signal chip design efficiency. Titan™ supports OpenAccess and emerging industry integration standards.
In addition to traditional base platform, Titan™ platform also provides design and layout accelerators, which are targeted solutions that provide new options to analog designers. Each accelerator can be used to augment an existing tool flow, or combined with the Titan Mixed-Signal Platform™ to create a comprehensive mixed-signal design solution.
Titan ADX™ (Analog Design Accelerator) is a model-based analog design and optimization solution that enables reuse of analog blocks. It is available with pre-built FlexCell libraries of design models.
Titan AVP™ (Analog Virtual Prototyper) is a layout-aware schematic design that integrates physical implementation with design intent.
Titan SBR™ (Shape-Based Router) automates difficult routing tasks for a tenfold improvement in productivity. It is used for analog routing, clock/DDR routing and chip-level assembly routing.
Titan ALX™ (Analog Layout Accelerator) automates migration of analog cell layouts between processes while preserving design intent.
SiliconSmart® ACE™, with its embedded FineSim SPICE™ and FineSim Pro™ simulators products, provide robust IP characterization and modeling in timing, power, and signal integrity models in a variety of industry standard formats.
Camelot™ performs failure analysis, fault diagnostics and design debug. Camelot™ imports computer-automated design
5
("CAD") design data from layout versus schematic (LVS) packages to provide visual representation and cross-mapping of circuits. Linked to analytical tools, Camelot™ automatically drives to an exact location for viewing and analysis. In addition, Camelot™ promotes an expanding base of options for failure analysis, circuit debug, and DFM applications.
YieldManager® is a fab-wide defect and yield management system collecting defect, image, review classification, binsort, bitmap, parametric, and equipment/manufacturing execution system data into a single unified database. Powerful extraction and engineering analysis tools make it easy to find the source(s) contributing to yield problems. Additional options available provide for an expanding base of automation and advanced analysis capability.
LogicMap™ is a fully-automated yield-enhancement software solution that identifies the precise circuit trace on failing chips by overlaying failing nets with in-line defect inspection data by layer. Benefits include the ability to perform failure analysis without the need for packaging or probing, and providing real-time statistically meaningful yield fallout and design sensitivity data.
Merlin's Framework™ is a navigation software tool for technologies and techniques including flip chips and back side fault isolation and analysis.
Smart Sampling™ provides an automated method for inline defect sampling of wafer inspection data in conjunction with inline review tools within the semiconductor manufacturing environment.
Boardview™ is a hierarchical expansion of chip-based navigation upwards to board level. Boardview™ provides a 3D view of both the printed circuit boards ("PCB") and die; has capabilities of virtual integration of PCB, BGA and multiple chip layout databases and can trace signals on board, through chips and back to board. It also works on multichip modules ("MCM") and can read layout data of PCB in form of GERBER, Autocad DXF and EXCELLON for drill files providing alignment of dies to the PCB.
Excalibur Litho™ is a CAD design based system designed to address systematic-related fab manufacturing challenges, assist with accelerating litho qualification cycle time and enable design manufacturability analysis/modeling and comprehensive process monitoring (Hot Spot monitoring and ranking). The system links to the FAB yield and defect management systems to help correlate/bin the various yield impacting elements ranging from random defects, bitmap, parametric test and final test and short to the underlying CAD geometrics and their corresponding logic.
Services
We provide consulting and training to help our customers more rapidly adopt our technology. We also provide post-contract support, or maintenance, for our products.
Customers
We license our software products to semiconductor manufacturers and electronic products companies around the world. Some of our major customers include Applied Materials, ARM, Broadcom, Global Foundries, Integrated Device Technology, Marvell, NEC, NVIDIA, Qualcomm, Samsung, Texas Instruments and Toshiba. No individual customer accounted for 10% or more of our consolidated revenues during fiscal 2011.
Product Backlog
As of May1, 2011 and May 2, 2010, we had greater than $331.0 million and $300.0 million, respectively, in backlog, which represents contractual commitments by our customers through purchase orders or contracts. As of May1, 2011 and May 2, 2010, approximately 24% and 20%, respectively, of the backlog in each year is variable based on volume of usage of our products by the customers. We have estimated variable usage, for the purposes of determining our backlog, based on information from customers' forecasts available at contract execution date. It is possible that customers from whom we expect to derive revenue from backlog will cancel, defer or default on their orders and as a result we may not be able to recognize expected revenue from backlog on a timely basis or at all.
Fiscal Year End
We have a 52-53 week fiscal year ending on the Sunday closest to April 30. Our fiscal years consist of four quarters of 13 weeks each except for each fifth or sixth fiscal year, which includes one quarter with 14 weeks. References in this Form 10-K to fiscal 2011 represent the 52 weeks ended May1, 2011, references to fiscal 2010 represent the 52 weeks ended May 2, 2010, and references to fiscal 2009 represent the 52 weeks ended May 3, 2009.
Revenue and Orders Mix
Our licenses revenue in any given quarter depends on the volume of short-term licenses shipped during the quarter and the amount of long-term, ratable and cash receipts revenue from deferred revenue that is recognized out of backlog and recognized on orders received during the quarter. We set our revenue targets for any given period based, in part, upon an assumption that we will achieve a certain level of orders and a certain mix of short-term licenses. The precise mix of orders is subject to substantial
6
fluctuation in any given quarter or multiple quarter periods, and the actual mix of licenses sold affects the revenue we recognize in the period. Even if we achieve the target level of total orders, we may not meet our revenue targets if we are unable to achieve our target license mix. In particular, we may fall short of our revenue targets if we deliver more long-term or ratable licenses than expected, or we may exceed our revenue targets if we deliver more short-term licenses than expected.
Unbilled Accounts Receivable
Unbilled accounts receivable represent revenue that has been recognized in advance of contractual invoicing to the customer. We typically generate invoices 45 days in advance of contractual due dates and invoice the entire amount of the unbilled accounts receivable within one year from the contract inception. As of May1, 2011 and May 2, 2010, unbilled accounts receivable were approximately $8.9 million and $2.9 million, respectively. These amounts were included in accounts receivable on our consolidated balance sheets for these periods.
Revenue by Geographic Areas
We generated 35% of our total revenue from sales outside the United States for fiscal 2011, compared to 41% in fiscal 2010 and fiscal 2009. Additional disclosure regarding financial information on geographic areas is included in Note 16, Segment Information, to our consolidated financial statements in Item 8 of this Form 10-K.
Sales and Marketing
We license our products primarily through a direct sales force focused primarily on industry leaders in the communications, computing, consumer electronics, networking and semiconductor industries. We have North American sales offices in California, Texas, and Canada. Internationally, we have European offices in Germany and the United Kingdom, an office in Israel, and Asian offices in China, India, Japan, South Korea and Taiwan. Our direct sales force is supported by a larger group of field application engineers that work closely with the customers' technical chip design professionals.
As of May1, 2011, we had 265 employees in our marketing, sales and technical sales support organizations.
Competition
The electronic design automation industry is highly competitive and characterized by technological change, evolving standards, and price erosion. Major competitive factors in the market we address include technical innovation, product features and performance, level of integration, reliability, price, total system cost, reduction in design cycle time, customer support and reputation.
We currently compete with companies that hold dominant shares of the electronic design automation market. In particular, Cadence Design Systems, Inc. (“Cadence”) and Synopsys, Inc. (“Synopsys”) are continuing to broaden their product lines to provide an integrated design flow, and we continue to compete with Mentor Graphics Corporation (“Mentor”) in certain product areas, such as physical verification tools. Each of these companies has a longer operating history and significantly greater financial, technical and marketing resources than we do, as well as greater name recognition and a larger installed customer base. These companies also have established relationships with our current and potential customers and can devote substantial resources aimed at preventing us from establishing or enhancing our customer relationships. Our competitors are better able to offer aggressive discounts on their products, a practice that they often employ. Our competitors offer a more comprehensive range of products than we do. For example, we do not offer logic simulation, which can sometimes be an impediment to our winning a particular customer order. In addition, our industry has traditionally viewed acquisitions as an effective strategy for growth in products and market share, and our competitors' greater cash resources and higher market capitalization would likely give them a relative advantage over us in acquiring companies with promising new chip design products or companies that may be too large for us to acquire without a strain on our resources and liquidity. Further consolidation in the electronic design automation market could result in an increasingly competitive environment. Competitive pressures may prevent us from increasing market share or require us to reduce the price of products and services, which could harm our business. To execute our business strategy successfully, we must continue to increase our sales worldwide. If we fail to do so in a timely manner or at all, we may not be able to gain market share and our business and operating results could suffer.
A variety of small companies continue to emerge, developing and introducing new products. Any of these companies could become a significant competitor in the future. We also compete with the internal chip design automation development groups of our existing and potential customers. Therefore, these customers may not require, or may be reluctant to purchase, products offered by independent vendors.
Our competitors may develop or acquire new products or technologies that have the potential to replace our existing or new product offerings. The introduction of these new or additional products by competitors may cause potential customers to either defer purchases of our products or decide against purchasing our products. If we fail to compete successfully, we will not gain market share and our business may fail.
Research and Development
7
We devote a substantial portion of our resources to developing new products and enhancing our existing products, conducting product testing and quality assurance testing, improving our core technology and strengthening our technological expertise in the electronic design automation market. Our research and development expenditures for fiscal 2011, 2010 and 2009 were $49.9 million, $47.0 million and $68.8 million, respectively. We have not had any customer-sponsored research activities since our inception.
As of May1, 2011, our research and development group consisted of 349 employees. We have engineering centers in California and Texas in the United States, and in China, India, the Netherlands and the United Kingdom. Our engineers are focused in the areas of product development, advanced research, product engineering and design services. Our product development group develops our common core technology and is responsible for ensuring that each product fits into this common architecture. Our advanced research group works independently from our product development group to assess and develop new technologies to meet the evolving needs of integrated circuit design automation. Our product engineering group is primarily focused on product releases and customization. Our design services group is specifically focused on, and assists in completing, customer designs for commercial applications.
Intellectual Property
As of May1, 2011, we held, directly or indirectly, more than 75 issued patents. Patent protection affords only limited protection for our technology. Our patents will expire on various dates through February 2029. We have filed, and plan to file, applications for additional patents. We do not know if our patent applications or any future patent application will result in a patent being issued with the scope of the claims we seek, if at all, or whether any patents we may receive will be challenged or invalidated. Rights that may be granted under our patent applications for patents that may be issued in the future may not provide us competitive advantages. Further, patent protection in foreign jurisdictions where we may need this protection may be limited or unavailable.
It is difficult to monitor and prevent unauthorized use of technology, particularly in foreign countries where local laws may not protect our proprietary rights as fully as do laws in the United States. In addition, our competitors may independently develop technology similar to ours. We will continue to assess appropriate occasions for seeking patent and other intellectual property protections for those aspects of our technology that we believe constitute innovations providing significant competitive advantages.
Our success depends in part upon our rights in proprietary software technology. We have patent applications pending for some of our proprietary software technology. In addition to patents, we rely on a combination of trademark, copyright and trade secret laws, and contractual restrictions such as confidentiality agreements and licenses, to establish and protect our proprietary rights. We routinely require our employees, customers and potential business partners to enter into confidentiality and nondisclosure agreements before we will disclose any sensitive aspects of our products, technology or business plans. We require employees to agree to surrender to us any proprietary information, inventions or other intellectual property they generate while employed by us. Despite our efforts to protect our proprietary rights through confidentiality and license agreements, unauthorized parties may attempt to copy or otherwise obtain and use our products or technology. These precautions may not prevent misappropriation or infringement of our intellectual property.
Some of our products and technology include software or other intellectual property licensed from other parties. In addition, we also license software and other intellectual property from other parties for internal use. We may be required or choose to obtain new licenses or renew licenses in the future.
Third parties may infringe or misappropriate our copyrights, trademarks and similar proprietary rights. Many of our contracts contain provisions indemnifying our customers from third-party intellectual property infringement claims. Third parties may assert infringement claims against us and/or our customers. Our products may be found by a court to infringe issued patents that may relate to or are required for our products. In addition, because patent applications in the United States are sometimes not publicly disclosed until the patent is issued, applications may have been filed that relate to our software products. We may be subject to legal proceedings and claims from time to time in the ordinary course of our business, including claims of alleged infringement of the trademarks and other intellectual property rights of third parties. Intellectual property litigation is expensive and time consuming and could divert management's attention away from running our business. If there is a successful claim of infringement, we may be ordered to pay substantial monetary damages, we may be prevented from distributing some of our products, and/or we may be required to develop non-infringing technology or enter into royalty or license agreements. These royalty or license agreements, if required, may not be available on acceptable terms, if at all. Our failure to develop non-infringing technology or license the proprietary rights on a timely basis would harm our business.
Foreign Operations
As indicated above and in Item 2 below, we have offices, including sales offices and engineering centers, located around the world. For additional information regarding risks attendant to our foreign operations, see the discussions under Item 1A, “Risk Factors” including discussion under the headings stating: “Because much of our business is international, we are exposed to risks inherent in doing business internationally that could harm our business. We also intend to expand our international operations. If our revenue from this expansion does not exceed the expenses associated with this expansion, our business and operating results
8
could suffer,” “We are subject to risks associated with changes in foreign currency exchange rates,” and “Failure to obtain export licenses could harm our business by preventing us from licensing or transferring our technology outside of the United States.”
Employees
As of May1, 2011, we had 696 full-time employees, including 349 in research and development, 265 in sales and marketing and 82 in general and administrative. None of our employees are covered by collective bargaining agreements. We believe our relations with our employees are good.
Corporate Information
We were incorporated in Delaware in 1997. Our principal executive offices are located at 1650 Technology Drive, San Jose, California 95110, and our telephone number is (408) 565-7500. Our common stock is traded on the Nasdaq Global Market under the ticker symbol LAVA. Our Web site address is www.magma-da.com. The information on or accessible through our Web site is not incorporated by reference into this Annual Report. Through a link on the "Company--Investors" section of our Web site, we make available, free of charge, our annual reports on Form 10-K, quarterly reports on Form 10-Q, current reports on Form 8-K, and any amendments to those reports filed or furnished pursuant to Section 13(a) or 15(d) of the Securities Exchange Act of 1934, as amended (the “Exchange Act”), as soon as reasonably practicable after they are filed with, or furnished to, the Securities and Exchange Commission (the “SEC”). Additionally, the public may read and copy any materials we file with the SEC at the SEC's Public Reference Room at 100 F Street, NE, Washington, DC 20549. The public may obtain information on the operation of the Public Reference Room by calling the SEC at 1-800-SEC-0330. The SEC maintains an Internet site that contains reports, proxy and information statements, and other information regarding issuers that file electronically with the SEC at the following Internet site: http://www.sec.gov. Financial information about us is set forth in the financial statements below.
9
ITEM 1A. | RISK FACTORS |
Our business faces many risks. The risk factors below describe the material risks to our business of which we are presently aware. If any of the events or circumstances described in the following risk factors actually occurs, our business, financial condition or results of operations could suffer, and the trading price of our common stock could decline.
We rely on a relatively small number of customers for a significant portion of our revenue, and our revenue could decline if customers delay orders or fail to renew licenses or if we are unable to maintain or develop relationships with current or potential customers.
Our business depends on sales to a relatively small number of customers, and we expect that we will generally continue to depend upon a relatively small number of customers for a substantial portion of our revenue for the foreseeable future. If we fail to sell sufficient quantities of our products and services to one or more customers in any particular period, or if a large customer reduces purchases of our products or services, defers orders, defaults on its payment obligations to us, or fails to renew licenses, our business and operating results could be harmed. In addition, if our customers believe that we are not financially sound, they may choose to stop doing business with us, which would materially adversely affect our business and financial condition.
Most of our customers license our software under time-based licensing agreements, with terms that typically range from 15 months to 48 months. Most of our license agreements automatically expire at the end of the term unless the customer renews the license with us or purchases a perpetual license. If our customers do not renew their licenses or renew their licenses with shorter terms, we may not be able to maintain our current revenue or may not generate additional revenue. Some of our license agreements allow customers to terminate an agreement prior to its expiration under limited circumstances-for example, if our products do not meet specified performance requirements or goals. If these agreements are terminated prior to expiration or we are unable to collect under these agreements, our revenue may decline.
Some contracts with extended payment terms provide for payments that are weighted toward the latter part of the contract term. Accordingly, for bundled agreements, as the payment terms are extended, the revenue from these contracts is not recognized evenly over the contract term, but is recognized as the lesser of the cumulative amounts due and payable or ratably. For unbundled agreements, as the payment terms are extended, the revenue from these contracts is recognized as amounts become due and payable. Revenue recognized under these unbundled arrangements will be higher in the latter part of the contract term, which potentially puts our future revenue recognition at greater risk of the customer's continued credit-worthiness. In addition, some of our customers have extended payment terms, which create additional credit risk.
We are currently party to and may enter into debt arrangements in the future, each of which may subject us to restrictive covenants which could limit our ability to operate our business.
We are party to a $40.0 million credit facility with Wells Fargo Capital Finance, LLC, pursuant to which we had outstanding borrowings of $22.9 million of term loans and two letters of credit totaling $1.7 million as of May 1, 2011. Our credit facility imposes various restrictions and covenants on us that limit our ability to incur or guarantee indebtedness, make investments, declare dividends or make distributions, acquire or merge into other entities, sell substantial portions of our assets and grant security interests in our assets. In the future, we may incur additional indebtedness through arrangements such as credit agreements, term loans or the issuance of debt securities that may also impose similar restrictions and covenants. These restrictions and covenants limit, and any future covenants and restrictions may limit, our ability to respond to market conditions, make capital investments or take advantage of business opportunities. Any debt arrangements we enter into may require us to make regular interest or principal payments, which would adversely affect our results of operations.
We cannot assure you that we will be able to satisfy or comply with the provisions, covenants, financial tests and ratios of our debt instruments, which can be affected by events beyond our control. If we fail to satisfy or comply with such provisions, covenants, financial tests and ratios, or if we disagree with our lenders about whether or not we are in compliance, we cannot assure you that we will be able to obtain waivers from our lenders for any failures to comply with our financial covenants or any other terms of the debt instruments. We also may not be able to obtain amendments that will prevent a failure to comply in the future. A breach of any of the provisions, covenants, financial tests or ratios under our debt instruments could result in a default under the applicable agreement, which in turn could accelerate the timing of our repayment obligations such that our indebtedness would become immediately due and payable and could trigger cross-defaults under our other debt instruments, any of which would materially adversely affect our business and financial condition and could make it difficult for us to incur additional indebtedness on comparable terms in the future.
We may be unable to service our indebtedness.
We will be required to generate cash sufficient to conduct our business operations and pay our indebtedness and other liabilities, including all amounts, both principal and interest, as they become due on the 6% Convertible Senior Notes due 2014 Notes (the "2014 Notes") and under our credit facility with the Wells Fargo Bank, N.A. We may not generate sufficient cash flow from operations to cover our anticipated debt service obligations, including making payments on any outstanding notes or our
10
credit facility. Our ability to make principal and interest payments on our indebtedness will depend upon our future performance, which will be subject to general economic conditions, industry cycles and financial, business and other factors affecting our operations, many of which are beyond our control. If we cannot generate sufficient cash flow from operations in the future to service our debt, we may, among other things:
• | seek additional financing in the debt or equity markets, and the documentation governing any future financing may contain covenants that limit or restrict our strategic, operating or financing activities; |
• | attempt to refinance or restructure all or a portion of our indebtedness; |
• | attempt to sell selected assets; |
• | reduce or delay planned capital expenditures; or |
• | reduce or delay planned research and development expenditures. |
These measures may not be successful, may not be sufficient to enable us to service our indebtedness and may harm our business and prospects.
In addition, we may try to access private and public sources of external financing, including debt and equity, to repay our existing indebtedness. Such financing may not be available in sufficient amounts, when needed or on terms acceptable to us, or at all. In addition, any equity financing may not be desirable because of resulting dilution to our stockholders, which may be significant. We also may, from time to time, redeem, tender for, exchange for, or repurchase our securities in the open market or in privately-negotiated transactions depending upon availability of our cash resources, market conditions and other factors. Moreover, the availability of funds under our existing $40.0 million credit facility may be adversely affected by our financial condition, results of operations and incurrence or maintenance of additional debt.
Volatile financial market conditions may impede our access to or increase the cost of financing operations and investments, which could materially adversely affect our business and financial condition.
In recent years, volatility and disruption in the capital and credit markets reached unprecedented levels. Volatility, disruption or tightening of the U.S. and global financial, equity and credit markets could negatively impact our ability to obtain additional sources of financing to repay or restructure our indebtedness or to obtain financing for our operations or investments or may increase the cost of obtaining financing. If we are unable to obtain needed financing or generate sufficient cash from operations, our ability to expand, develop or enhance our services or products, fund our working capital requirements or respond to competitive pressures would be limited, which would materially adversely affect our business and financial condition.
We have a substantial amount of indebtedness that could adversely affect our business, operating results or financial condition.
We currently have, and will continue to have for the foreseeable future, a substantial amount of indebtedness. As of May 1, 2011, we had an aggregate principal amount of approximately $28.0 million in outstanding debt, which was comprised of $3.25 million aggregate principal amount of 2014 Notes. In addition, as of May 1, 2011, we had outstanding borrowings of $22.9 million of term loans and two letters of credit totaling $1.7 million under our credit facility with Wells Fargo Capital Finance, LLC, which expires on October 29, 2014, and $0.1 million of other indebtedness. If cash on hand and cash flow from operations are not sufficient to meet our working capital needs, capital requirements, and debt repayment obligations, we may need to incur additional indebtedness. Our outstanding indebtedness will also require us to use a substantial portion of our cash flow from operations to make debt service payments. If we are unable to generate sufficient cash flow or otherwise obtain funds necessary to make required payments, or if we fail to comply with the various requirements of our indebtedness, we would be in default, which would permit the holders of our indebtedness to accelerate the maturity of the indebtedness and which could cause a default under any other indebtedness then outstanding. Any default under our indebtedness would have a material adverse effect on our business, operating results and financial condition.
In addition, our high level of indebtedness may:
• | make it difficult for us to satisfy our financial obligations; |
• | limit our ability to use our cash flow in our operations, use our available financings to the fullest extent possible, or obtain additional financing for future working capital, capital expenditures, acquisitions or other general corporate purposes; |
• | limit our flexibility to plan for, or react to, changes in our business and industry; |
• | place us at a competitive disadvantage compared to our less leveraged competitors and our competitors with greater access to capital resources; |
• | increase our vulnerability to the impact of adverse economic and industry conditions; |
• | increase our vulnerability in the event of an increase in interest rates if we must incur new debt to satisfy our obligations under our current indebtedness; and |
• | cause our business to go into bankruptcy or cause our business to fail. |
Customer payment defaults may cause us to be unable to recognize revenue from backlog, and changes in the type
11
of orders comprising backlog could affect the proportion of revenue recognized from backlog each quarter, which could have a material adverse effect on our financial condition and results of operations.
Twenty four percent of our revenue backlog is variable based on volume of usage of our products by customers or includes specific future deliverables or is recognized as revenue on a cash receipts basis. Management has estimated variable usage based on customers' forecasts, but there can be no assurance that these estimates will be realized. In addition, it is possible that customers from whom we expect to derive revenue from backlog will default, and, as a result, we may not be able to recognize revenue from backlog as expected. If a customer defaults and fails to pay amounts owed, or if the level of defaults increases, our bad debt expense is likely to increase. Moreover, existing customers may seek to renegotiate preexisting contractual commitments due to adverse changes in their own businesses, which may increase if current economic conditions do not improve or worsen. Any material payment default by our customers or material renegotiation of preexisting contractual commitments could have a material adverse effect on our financial condition and results of operations.
To gain market share and maintain revenue, we must compete successfully against companies that hold a large share of the EDA market and competition is increasing among EDA vendors as customers tightly control their EDA spending and use fewer vendors to meet their needs.
We currently compete with companies that hold dominant shares in the EDA market, such as Cadence Design Systems, Synopsys, Inc. and Mentor Graphics Corporation. Each of these companies has a longer operating history and significantly greater financial, technical and marketing resources than we do, as well as greater name recognition and a larger installed customer base. Our competitors are better able to offer aggressive discounts on their products, a practice they often employ. Competition and corresponding pricing pressures among EDA vendors or other factors could cause the overall market for EDA products to have low growth rates, remain relatively flat or even decrease in terms of overall dollars. In addition, our competitors offer a more comprehensive range of products than we do. For example, we do not offer logic simulation, which can sometimes be an impediment to our winning a particular customer order. Our industry has traditionally viewed acquisitions as an effective strategy for growth in products and market share, and our competitors' greater cash resources and higher market capitalization could give them a relative advantage over us in acquiring companies with promising new chip design products or companies that may be too large for us to acquire without a strain on our resources and liquidity.
Competition in the EDA market has increased as customers rationalized their EDA spending by using products from fewer EDA vendors. Continued consolidation in the EDA market could intensify this trend. In addition, gaining market share in the EDA market can be difficult as it may take years for a customer to move from a competitor. Many of our competitors, such as Cadence, Synopsys and Mentor, have established relationships with our current and potential customers and can devote substantial resources aimed at preventing us from establishing or enhancing our customer relationships. Competitive pressures may prevent us from obtaining new customers and gaining market share, may require us to reduce the price of products and services or cause us to lose existing customers, which could harm our business. To execute our business strategy successfully, we must continue our efforts to increase our sales worldwide. If we fail to do so in a timely manner or at all, we may not be able to gain market share and our business and operating results could suffer.
Also, a variety of small companies continue to emerge, developing and introducing new products that may compete with our products. Any of these companies could become a significant competitor in the future. We also compete with the internal chip design automation development groups of our existing and potential customers. Therefore, these customers may not require, or may be reluctant to purchase, products offered by independent vendors.
Our competitors may develop or acquire new products or technologies that have the potential to replace our existing or new product offerings. The introduction of these new or additional products by competitors may cause potential customers to defer purchases of our products or decide against purchasing our products. If we fail to compete successfully, we will not gain market share, or our market share may decrease, and our business may fail.
If the industries into which we sell our products experience a recession or other cyclical effects affecting our customers' research and development budgets, our revenue would be adversely affected.
Demand for our products is driven by new integrated circuit design projects. The demand from semiconductor and systems companies is uncertain and difficult to predict. A sharp economic downturn (such as that experienced in the semiconductor and systems industries in 2008 and 2009), a reduced number of design starts, a reduction in the complexity of integrated circuits, a reduction in our customers' EDA budgets or consolidation among our customers would have an adverse effect on our revenue and would harm our business and financial condition. The primary customers for our products are companies in the communications, computing, consumer electronics, networking and semiconductor industries. A cutback of research and development budgets or the delay of software purchases by our customers due to a downturn in our customers' markets, in general economic conditions or otherwise would likely result in lower demand for our products and services and could harm our business. The continuing threat of terrorist attacks in the United States and worldwide, the ongoing events in Afghanistan, Iraq, Iran, the Middle East, North Korea and other parts of the world, recent problems with the financial system, such as problems involving banks as well as the mortgage markets and the recent financial crisis, and other worldwide events, including the impact of the earthquakes and related events in
12
Japan, have increased uncertainty in the United States and global economies. If global economic conditions do not improve or worsen, existing customers may decrease their purchases of our software products or delay their implementation of our software products, and prospective customers may decide not to adopt our software products, any of which could negatively impact our business and operating results.
Our industry is subject to cyclical fluctuation, which could affect our operating results.
The electronics industry has historically been subject to cyclical fluctuations in demand for its products, and this trend may continue in the future. These industry downturns have been and may continue to be characterized by diminished product demand, excess manufacturing capacity and subsequent erosion of average selling prices. Any such cyclical industry downturns could harm our operating results.
Our lengthy and unpredictable sales cycle and the large size of some orders make it difficult for us to forecast revenue and increase the magnitude of quarterly fluctuations, which could harm our stock price.
Customers for our software products typically commit significant resources to evaluate available software. The complexity of our products requires us to spend substantial time and effort to assist potential customers in evaluating our software and in benchmarking our products against those of our competitors. As the complexity of the products we sell increases, we expect our sales cycle to lengthen. In addition, potential customers may be limited in their current spending by existing time-based licenses with their legacy vendors. In these cases, customers delay a significant new commitment to our software until the term of the existing license has expired. Also, because our products require our customers to invest significant time and incur significant costs, we must target those individuals within our customers' organizations who are able to make these decisions on behalf of their companies. These individuals tend to be senior management in an organization, typically at the vice president level. We may face difficulty identifying and establishing contact with such individuals. Even after those individuals decide to purchase our products, the negotiation and documentation processes can be lengthy and could lead the decision-maker to reconsider the purchase. Consequently, we may incur substantial expense and devote significant management time and effort to develop potential relationships that do not result in agreements or revenues and that may prevent us from pursuing other opportunities.
Our sales cycle typically ranges between three and nine months but can be longer. Any delay in completing sales in a particular quarter could cause our operating results to fall below expectations. Furthermore, economic downturns, technological changes, litigation risk or other competitive factors could cause some customers to shorten the terms of their licenses significantly, and such shorter terms could in turn have an impact on our total results for orders for this fiscal year. In addition, the precise mix of orders is subject to substantial fluctuation in any given quarter or multiple quarter periods, and the actual mix of licenses sold affects the revenue we recognize in the period. Even if we achieve the target level of total orders, we may not meet our revenue targets if we are unable to achieve our target license mix. In particular, we may fall short of our revenue targets if we deliver more long-term or ratable licenses than expected, or we may exceed our revenue targets if we deliver more short-term licenses than expected.
Consolidation among our customers, as well as within the industries in which we operate, may negatively impact our operating results.
A number of business combinations, including mergers, asset acquisitions and strategic partnerships, among our customers and in the semiconductor and electronics industries have occurred recently, and more could occur in the future. Consolidation among our customers could lead to fewer customers or the loss of customers, increased customer bargaining power, or reduced customer spending on software and services. Moreover, business combinations within the industries in which we compete may result in stronger competition from companies that are better able to compete as sole source vendors to customers. The loss of customers or reduced customer spending could adversely affect our business and financial condition.
Our quarterly results are difficult to predict, and if we fail to reach certain quarterly financial expectations, our stock price is likely to decline.
Our quarterly revenue and operating results fluctuate from quarter to quarter and are difficult to predict. It is likely that our operating results in some periods will be below investor expectations. If this happens, the market price of our common stock is likely to decline. Fluctuations in our future quarterly operating results may be caused by many factors, including:
• | size and timing of customer orders, which are received unevenly and unpredictably throughout a fiscal year; |
• | the mix of products licensed and types of license agreements; |
• | our ability to recognize revenue in a given quarter; |
• | timing of customer license payments; |
• | the relative mix of time-based licenses bundled with maintenance, unbundled time-based license agreements and perpetual license agreements, each of which requires different revenue recognition practices; |
• | size and timing of revenue recognized in advance of actual customer billings and customers with graduated payment schedules which may result in higher accounts receivable balances and days sales outstanding (“DSO”); |
• | changes in accounting rules and practices related to revenue recognition; |
• | the relative mix of our license and services revenue; |
13
• | our ability to win new customers and retain existing customers; |
• | changes in our pricing and discounting practices and licensing terms and those of our competitors; |
• | changes in the level of our operating expenses, including general compensation levels as well as increases in incentive compensation payments that may be associated with future revenue growth; |
• | higher-than-anticipated costs in connection with litigation; |
• | the timing of product releases or upgrades by us or our competitors; and |
• | the integration, by us or our competitors, of newly-developed or acquired products or businesses. |
We have faced lawsuits related to patent infringement and other claims, and we may face additional intellectual property infringement claims or other litigation. Lawsuits can be costly to defend, can take the time of our management and employees away from day-to-day operations, and could result in our losing important rights and paying significant damages.
We have faced lawsuits related to patent infringement and other claims in the past. For example, Synopsys previously filed various suits, including actions for patent infringement, against us. In addition, a putative stockholder class action lawsuit and a putative derivative lawsuit were filed against us. All claims brought against us by Synopsys have been fully resolved by a settlement and a license under the asserted patents, although other similar litigation involving Synopsys or other parties may follow. For another example, we currently face a lawsuit in which one of our insurers, Genesis Insurance Company, seeks the return of $5.0 million it paid towards the settlement of the putative stockholder and derivative lawsuits that arose out of the Synopsys patent infringement lawsuit. The case is pending and described in more detail in Item 1, “Legal Proceedings”. In the future, other parties may assert intellectual property infringement claims or other claims against us or our customers. We may have acquired or may in the future acquire software as a result of our acquisitions, and we could be subject to claims that such software infringes the intellectual property rights of third parties. We also license technology from certain third parties and could be subject to claims if the software that we license is deemed to infringe the rights of others. In addition, we are often involved in or threatened with commercial litigation unrelated to intellectual property infringement claims such as labor litigation and contract claims, and we may acquire companies that are actively engaged in such litigation.
Our products may be found to infringe intellectual property rights of third parties, including third-party patents. In addition, many of our contracts contain provisions in which we agree to indemnify our customers against third-party intellectual property infringement claims that are brought against them based on their use of our products. Also, we may be unaware of filed patent applications that relate to our software products. We believe that the patent portfolios of our competitors generally are far larger than ours. This disparity between our patent portfolio and the patent portfolios of our competitors may increase the risk that they may sue us for patent infringement and may limit our ability to counterclaim for patent infringement or settle through patent cross-licenses.
The outcome of intellectual property litigation and other types of litigation could result in our loss of critical proprietary rights and unexpected operating costs and substantial monetary damages. Intellectual property litigation and other types of litigation are expensive and time-consuming and could divert our management's attention from our business. If there is a successful claim against us for infringement, we may be ordered to pay substantial monetary damages (including punitive damages), be prevented from distributing all or some of our products, and be required to develop non-infringing technology or enter into royalty or license agreements, which may not be available on acceptable terms, if at all. Our failure to develop non-infringing technologies or license any required proprietary rights on a timely basis could harm our business.
Publicly announced developments in litigation matters, as well as other factors, may cause our stock price to decline sharply and suddenly, and we are subject to ongoing risks of securities class action litigation related to volatility in the market price for our common stock.
We may not be successful in defending some or all claims that may be brought against us. Regardless of the outcome, litigation can result in substantial expense and could divert the efforts of our management and technical personnel from our business. In addition, the ultimate resolution of the lawsuits could have a material adverse effect on our financial position, results of operations and cash flow, and harm our ability to execute our business plan.
Our operating results will be harmed if chip designers do not adopt or continue to use Talus, FineSim, the Tekton and Quartz family of products, Titan or our other current and future products.
Talus (and its predecessor product line, Blast Fusion) accounted for the largest portion of our revenue since our inception, and we believe that revenue from Talus, Tekton, FineSim, Titan and Excalibur will account for most of our revenue for the foreseeable future. We have dedicated significant resources to developing and marketing Talus, Tekton, FineSim, Titan, and Excalibur and our other products in order to achieve our growth strategy and financial success. Moreover, if integrated circuit designers do not continue to adopt or use Talus, Tekton, FineSim, Titan, and Excalibur or other current and future products, our operating results will be significantly harmed.
We have a history of losses, except for fiscal 2003 and fiscal 2004, and we had an accumulated deficit of approximately
14
$387.1 million as of May 1, 2011. If we continue to incur losses, the trading price of our stock may decline.
We had an accumulated deficit of approximately $387.1 million as of May 1, 2011. Except for fiscal 2003 and fiscal 2004, we incurred losses in all other fiscal years since our incorporation in 1997. If we incur losses in the future, or if we fail to achieve profitability at levels expected by securities analysts or investors, the market price of our common stock may decline. If we incur losses in the future, we may not be able to maintain or increase our number of employees or our investment in capital equipment, sales, marketing, and research and development programs.
Our operating results may be harmed if our customers do not adopt, or are slow to adopt, 28-nanometer and smaller design geometries on a large scale.
Our customers are currently working on a range of design geometries, including 28-nanometer, 40-nanometer, 65-nanometer, 90-nanometer and 130-nanometer designs. We continue to work towards developing and enhancing our product line in anticipation of increased customer demand for 28-nanometer and other smaller-design geometries. Notwithstanding our efforts to support 28-nanometer and other smaller design geometries, customers may fail to adopt, or may face technical difficulties in adopting these geometries on a large scale and we may be unable to persuade our customers to purchase our related software products. Accordingly, any revenue we receive from enhancements to our products or acquired technologies may be less than the development or acquisition costs. If customers fail to adopt or delay the adoption of 28-nanometer and other smaller design geometries on a large scale, our operating results may be harmed. In addition, if customers are not able to successfully generate profits as they adopt smaller geometries, demand for our products may be adversely affected, and our operating results may be harmed.
Difficulties in developing and achieving market acceptance of new products and delays in planned release dates of our software products and upgrades may harm our business and cause our operating results to decline.
The semiconductor industry is characterized by rapid technology developments, changes in industry standards and customer requirements and frequent new product introductions and improvements. For our business to be successful, we will need to develop or acquire innovative new products. We may not have the financial resources necessary to fund all required future innovations. Expanding into new technologies or extending our product line into areas we have not previously addressed may be more costly or difficult than we presently anticipate. Also, any revenue that we receive from enhancements or new generations of our proprietary software products may be less than the costs that we incur to develop or acquire those technologies and products. If we fail to develop and market new products in a timely manner, or if new products do not meet performance features as marketed, our reputation and our business could suffer.
In particular, the semiconductor industry has recently made significant technological advances in deep sub-micron technology, which have required EDA companies to develop or acquire new products and enhance existing products continuously. The evolving nature of our industry could render our existing products and services obsolete. Our success will depend, in part, on our ability to:
• | enhance our existing products and services; |
• | develop and introduce new products and services in a timely and cost-effective manner that will keep pace with technological developments and evolving industry standards; |
• | address the increasingly sophisticated needs of our customers; and |
• | acquire other companies that have complementary or innovative products. |
If we are unable, for technical, legal, financial or other reasons, to respond in a timely manner to changing market conditions or customer requirements, our business and operating results could be seriously harmed.
Our research and development expenditures may not be sufficient to enable us to develop new products or update existing products, which may reduce our revenue growth, and increases in our research and development expenditures could negatively affect our operating results.
Developing EDA technology and integrating acquired technology into existing platforms is expensive, and these investments often require a long time to generate returns. We devote a substantial portion of our resources to developing new products and enhancing our existing products, conducting product testing and quality assurance testing, improving our core technology and strengthening our technological expertise in the EDA market. We believe that we must continue to devote substantial resources to our research and development efforts to maintain and improve our competitive position. Our research and development expenditures for fiscal year 2011 were $49.9 million, compared to $47.0 million and $68.8 million for fiscal 2010 and fiscal 2009, respectively. If we are required to invest significantly greater resources than anticipated in research and development efforts in the future, our operating expenses would increase, which could negatively affect our operating results. If these increased efforts do not result in a corresponding increase in revenue, our operating results could decline. Further, research and development expenses are likely to fluctuate from time to time to the extent we make periodic incremental investments in research and development, and these investments may be independent of our level of revenue, which could negatively affect our operating results.
Our costs of customer engagement and support are high, so our gross margin may decrease if we incur higher-than-
15
expected costs associated with providing support services in the future or if we reduce our prices.
Because of the complexity of our products, we typically incur high field application engineering support costs to engage new customers and assist them in their evaluations of our products. If we fail to manage our customer engagement and support costs, our operating results could suffer. In addition, our gross margin may decrease if we are unable to manage support costs associated with the services revenue we generate or if we reduce prices in response to competitive pressure.
If chip designers and manufacturers do not integrate our software into existing design flows, or if other software companies do not cooperate in working with us to interface our products with their design flows, demand for our products may decrease.
To implement our business strategy successfully, we must provide products that interface with the software of other EDA software companies. Our competitors may not support efforts by us or by our customers to integrate our products into their existing design flows. We must develop cooperative relationships with competitors so that they will work with us to integrate our software into customers' design flow. Currently, our software is designed to interface with the existing software of Cadence, Synopsys and others. If we are unable to persuade customers to adopt our software products instead of those of competitors (including competitors offering a broader set of products), or if we are unable to persuade other software companies to work with us to interface our software to meet the demands of chip designers and manufacturers, our business and operating results will suffer.
Product defects could cause us to lose customers and revenue, or to incur unexpected expenses.
Our products depend on complex software, which we either developed internally or acquired or licensed from third parties. Our customers may use our products with other companies' products, which also contain complex software. If our software does not meet our customers' performance requirements or meet the performance features as marketed, our customer relationships may suffer. Also, a limited number of our contracts include specified ongoing performance criteria. If our products fail to meet these criteria, it may lead to termination of these agreements and loss of future revenue. Complex software often contains errors. Any failure or poor performance of our software or the third-party software with which it is integrated could result in:
• | delayed market acceptance of our software products; |
• | delays in product shipments; |
• | unexpected expenses and diversion of resources to identify the source of errors or to correct errors; |
• | loss of customers and damage to our reputation; |
• | increased service costs: |
• | delayed or lost revenue; and |
• | product liability claims. |
Our product functions are often critical to our customers, especially because of the resources our customers expend on the design and fabrication of integrated circuits. Many of our licensing agreements contain provisions to provide a limited warranty. In addition, some of our licensing agreements provide the customer with a right of refund for the license fees if we are unable to correct errors reported during the warranty period. If our contractual limitations are unenforceable in a particular jurisdiction or if we are exposed to claims that are not covered by insurance, a successful claim could harm our business. We currently carry insurance coverage and limits that we believe are consistent with similarly situated companies within the EDA industry; however, our insurance coverage may prove insufficient to protect against any claims that we may experience.
We may not be able to hire or retain the number of qualified personnel required for our business, particularly engineering personnel, which would harm the development and sales of our products and limit our ability to grow.
Competition in our industry for senior management, technical, sales, marketing and other key personnel is intense. If we are unable to retain our existing personnel, or attract and train additional qualified personnel, our growth may be limited due to a lack of capacity to develop and market our products.
Our success depends on our ability to identify, hire, train and retain qualified engineering personnel with experience in integrated circuit design. Specifically, we need to be able to continue to attract and retain field application engineers to work with our direct sales force to technically qualify new sales opportunities and perform design work to demonstrate our products' capabilities to customers during the benchmark evaluation process. Competition for qualified engineers is intense, particularly in the Silicon Valley area where our headquarters are located. If we lose the services of a significant number of our employees or if we cannot hire additional employees of the same caliber, we will be unable to increase our sales or implement or maintain our growth strategy.
If we fail to offer and maintain competitive compensation packages for our employees, we might have difficulty recruiting and retaining our employees and our business may be harmed.
If the compensation of our employees is not competitive or satisfactory to the employees, we may have difficulty in recruiting and retaining our employees and our business may be harmed. In today's competitive technology industry, employment decisions
16
of highly skilled personnel are influenced by equity compensation packages.
We issue stock options and restricted stock units and maintain an employee stock purchase plan as a key component of our overall compensation. We may be forced to grant additional options or other equity in order to successfully recruit and retain employees. This in turn could result in:
• | immediate and substantial dilution to investors resulting from the grant of additional options or other equity necessary to retain employees; and |
• | compensation charges against us, which would negatively impact our operating results. |
In addition, the NASDAQ Marketplace Rules require stockholder approval for new equity compensation plans and significant amendments to existing equity compensation plans, including increases in shares available for issuance under such plans, and prohibit brokers holding shares of our common stock in customer accounts from giving a proxy to vote on equity compensation plans unless the beneficial owner of the shares has given voting instructions. These regulations could make it more difficult for us to grant equity compensation to employees in the future. To the extent that these regulations make it more difficult or expensive to grant equity compensation to employees, we may incur increased compensation costs or find it difficult to attract, retain and motivate employees, which could adversely affect our business.
Our success is highly dependent on our ability to successfully motivate and retain our senior executives and other key research and development, sales and marketing employees.
We depend on our senior executives and certain key research and development and sales and marketing personnel, who are critical to our business. Specifically, for our sales force, we have experimented, and continue to experiment, with different systems of sales force compensation. If our incentives are not well designed, we may experience reduced revenue generation, and we may also lose the services of our more productive sales personnel, either of which would reduce our revenue or potential revenue. We do not have long-term employment agreements with any of our key employees, and we do not maintain any key person life insurance policies. Furthermore, our larger competitors may be able to offer more generous compensation packages to executives and key employees, and therefore we risk losing key personnel to those competitors. If we lose the services of any of our key personnel, our product development processes and sales efforts could be harmed. We may also incur increased operating expenses and be required to divert the attention of our senior executives to search for their replacements. The integration of new executives or new personnel could disrupt our ongoing operations.
If we become subject to unfair hiring claims, we could be prevented from hiring needed employees, incur liability for damages and incur substantial costs in defending ourselves.
Companies in our industry that lose employees to competitors frequently claim that these competitors have engaged in unfair hiring practices or that the employment of these persons would involve the disclosure or use of trade secrets. These claims could prevent us from hiring employees or cause us to incur liability for damages. We could also incur substantial costs in defending ourselves or our employees against these claims, regardless of their merits. Defending ourselves from these claims could also divert the attention of our management away from our operations.
We have had to implement a series of restructuring efforts recently. In the event that these efforts result in ineffective interoperability between our products or ineffective collaboration among our employees, or we are unable to continue to manage the pace of our growth, our business could be harmed.
The global economic downturn negatively affected the semiconductor industry and our business, and in response to these adverse conditions we implemented a series of restructuring efforts. We initiated a restructuring plan in May 2008 for which we incurred restructuring charges of $10.7 million in fiscal 2009, $2.7 million in fiscal 2010, and $1.2 million in fiscal 2011, primarily for costs related to severance, expatriate relocation, facilities consolidation and termination, discontinued use of purchased software, and other costs related to the restructuring.
We refer to this restructuring plan herein as the "fiscal 2009 restructuring plan". This reduction in force might harm operating results by making it more difficult for the reduced workforce to take advantage of business opportunities and reach revenue goals. Furthermore, if our organizational structure or the fiscal 2009 restructuring plan results in ineffective interoperability between our products or ineffective collaboration among our employees, then our operating results may be harmed. For example, we could experience delays in new product development that could cause us to lose customer orders, which could harm our operating results. We cannot assure you that all of the anticipated cost reductions of the fiscal 2009 restructuring plan will be realized or that, if semiconductor industry or general economic conditions worsen, we will not be required to make further cost reductions.
To pace the growth of our operations with the growth in our revenue, we must continue to improve administrative, financial and operations systems, procedures and controls. Failure to improve our internal procedures and controls could hinder our efforts to manage our growth adequately, disrupt operations, lead to additional expenses associated with restructuring, lead to deficiencies in our internal controls and financial reporting and otherwise harm our business.
We may be unable to make payments to satisfy our indemnification obligations.
17
We enter into standard license agreements in the ordinary course of business. Pursuant to these agreements, we agree to indemnify certain of our customers for losses suffered or incurred by them as a result of any patent, copyright, or other intellectual property infringement claim by any third party with respect to our products. These indemnification obligations continue over the software license period, and are perpetual in some instances. Our normal business practice is to limit the maximum amount of indemnification to the amount received from the customer. On occasion, the maximum amount of indemnification we may be required to make may exceed our normal business practices. We estimate that the fair value of our indemnification obligations are insignificant, based upon our historical experience concerning product and patent infringement claims. Accordingly, we have no liabilities recorded for indemnification under these agreements as of May 1, 2011. If an indemnification event were to occur, we might not have enough funds to pay our indemnification obligations. Further, any material indemnification payment could have a material adverse effect on our financial condition and the results of our operations.
We have entered into certain indemnification agreements whereby certain of our officers and directors are indemnified for certain events or occurrences while the officer or director is, or was, serving at our request in such capacity. Additionally, in connection with certain of our recent business acquisitions, we agreed to assume, or cause our subsidiaries to assume, indemnification obligations to the officers and directors of the acquired companies. While we have directors and officers insurance that reduces our exposure and enables us to recover a portion of any future amounts paid pursuant to our indemnification obligations to our officers and directors, the maximum potential amount of future payments we could be required to make under these indemnification agreements is unlimited. However, as a result of our directors and officers insurance coverage and our belief that our estimated potential exposure to our officers and directors for indemnification liabilities is minimal, no liabilities have been recorded for these agreements as of May 1, 2011. Therefore, if an indemnification event were to occur, we might not have enough funds to pay our indemnification obligations. Further, any material indemnification payment could have a material adverse effect on our financial condition and the results of our operations.
Acquisitions are an important element of our strategy. We may not find suitable acquisition candidates and we may not be successful in integrating the operations of acquired companies and acquired technology.
Part of our growth strategy is to pursue acquisitions. We expect to continuously evaluate the possibility of accelerating our growth through acquisitions, as is customary in the EDA industry. The decline in the price of our common stock from 2008 levels and our focus on cash management may impact our ability to pursue acquisitions for some period of time. We also may analyze and pursue some acquisitions that are not consummated and, as a result, we may incur significant costs. Achieving the anticipated benefits of past and possible future acquisitions will depend in part upon whether we can integrate the operations, products and technology of acquired companies with our operations, products and technology in a timely and cost-effective manner. The process of integrating acquired companies and acquired technology is complex, expensive and time consuming, and may cause an interruption of, or loss of momentum in, the product development and sales activities and operations of both companies. In addition, the earnout arrangements we use, and expect to continue to use, to consummate some of our acquisitions, pursuant to which we agree to pay additional amounts of contingent consideration based on the achievement of certain revenue, bookings or product development milestones, can sometimes complicate integration efforts. We cannot be sure that we will find suitable acquisition candidates or that acquisitions we complete will be successful. Assimilating previously acquired companies such as Sabio Labs, Inc. (“Sabio”), Knights Technology, Inc. (“Knights”), ACAD Corporation (“ACAD”), Mojave, Silicon Metrics Corporation, or any other companies we have acquired or may seek to acquire in the future, involves a number of other risks, including, but not limited to:
• | adverse effects on existing customer relationships, such as cancellation of orders or the loss of key customers; |
• | adverse effects on existing licensor or supplier relationships, such as termination of certain license agreements; |
• | difficulties in integrating or retaining key employees of the acquired company; |
• | the risk that earnouts based on revenue will prove difficult to administer due to the complexities of revenue recognition accounting; |
• | the risk that actions incentivized by earnout provisions will ultimately prove not to be in our best interest if our interests change over time; |
• | difficulties in integrating the operations of the acquired company, such as information technology resources, manufacturing processes, and financial and operational data; |
• | difficulties in integrating the technologies of the acquired company into our products; |
• | the risk that acquired products will fail to achieve projected sales; |
• | diversion of our management's attention; |
• | failure to realize anticipated cost savings and synergies; |
• | potential incompatibility of business cultures; |
• | post-acquisition discovery of previously unknown liabilities assumed with the acquired business; |
• | unanticipated litigation in connection with or as a result of an acquisition; |
• | potential dilution to existing stockholders if we incur debt or issue equity securities to finance acquisitions; and |
• | additional expenses associated with the amortization of intangible assets. |
18
Because much of our business is international, we are exposed to risks inherent in doing business internationally that could harm our business. We also intend to expand our international operations. If our revenue from this expansion does not exceed the expenses associated with this expansion, our business and operating results could suffer.
During fiscal 2011, we generated 35% of our total revenue from sales outside North America, compared to 41% during fiscal 2010.
To the extent that we expand our international operations, we may need to continue to maintain offices in Europe, the Middle East, and the Asia Pacific region. If our revenue from international operations does not exceed the expense of establishing and maintaining our international operations, our business could suffer. Additional risks we face in conducting business internationally include:
• | difficulties and costs of staffing and managing international operations across different geographic areas; |
• | changes in currency exchange rates and controls; |
• | uncertainty regarding tax and regulatory requirements in multiple jurisdictions; |
• | ineffective legal protection of intellectual property rights; |
• | the possible lack of financial and political stability in foreign countries, preventing overseas sales growth; |
• | current events in North Korea, the Middle East, and other parts of the world, including the recent earthquakes and related events in Japan; |
• | the effects of terrorist attacks in the United States or against U.S. interests overseas; |
• | recent problems with the financial system, such as problems involving banks as well as the mortgage markets and the recent financial crisis; and |
• | any related conflicts or similar events worldwide. |
In addition, our global operations are subject to numerous U.S. and foreign laws and regulations, including those related to anti-corruption, tax, imports and exports, privacy and labor relations. These laws and regulations are complex and may have differing or conflicting legal standards, making compliance difficult and costly. If we violate these laws and regulations, we could be subject to fines, penalties, criminal sanctions, and may be prohibited from conducting business in one or more countries. Although we have implemented policies and procedures to ensure compliance with these laws and regulations, there can be no assurance that our employees, contractors or agents will not violate these laws or regulations. Any violation individually or in the aggregate could have a material adverse effect on our operations and financial condition.
Failure to obtain export licenses could harm our business by preventing us from licensing or transferring our technology outside of the United States.
We are required to comply with U.S. Department of Commerce regulations when shipping our software products and/or transferring our technology outside of the United States or to certain foreign nationals. We believe we have complied with applicable export regulations; however, these regulations are subject to change, and future difficulties in obtaining export licenses for current, future developed and acquired products and technology, or any failure (if any) by us to comply with such requirements in the past, could harm our business, financial conditions and operating results.
We are subject to risks associated with changes in foreign currency exchange rates.
While most of our international sales to date have been denominated in U.S. dollars, our international operating expenses have been denominated in foreign currencies. As a result, a decrease in the value of the U.S. dollar relative to such foreign currencies could increase the relative costs of our overseas operations, which could reduce our operating margins. This exposure is primarily related to a portion of revenue in Japan and operating expenses in Europe, Japan and Asia-Pacific, which are denominated in the respective local currencies. As of May 1, 2011, we had approximately $5.5 million of cash and money market funds in foreign currencies. We enter into foreign exchange forward contracts to mitigate the effects of our currency exposure risk for foreign currency transactions. While we assess the need to utilize financial instruments to hedge currency exposures on an ongoing basis, our assessments may prove incorrect. Therefore, movements in exchange rates could negatively impact our business operating results and financial condition.
Forecasting our tax rates is complex and subject to uncertainty.
Our management must make significant assumptions, judgments and estimates to determine our current provision for income taxes, deferred tax assets and liabilities, and any valuation allowance that may be recorded against our deferred tax assets. These assumptions, judgments and estimates are difficult to make due to their complexity, and the relevant tax law is often changing.
Our future effective tax rates could be adversely affected by the following:
• | an increase in expenses that are not deductible for tax purposes, including stock-based compensation and write-offs of acquired in-process research and development; |
19
• | changes in the valuation of our deferred tax assets and liabilities; |
• | future changes in ownership that may limit realization of certain assets; |
• | changes in forecasts of pre-tax profits and losses by jurisdiction used to estimate tax expense by jurisdiction; |
• | changes in geographic earnings mix; |
• | assessment of additional taxes as a result of federal, state, or foreign tax examinations; or |
• | changes in tax laws or interpretations of such tax laws. |
Future changes in accounting standards, specifically changes affecting revenue recognition, could cause unexpected adverse revenue fluctuations for us.
Future changes in accounting standards or interpretations thereof, specifically those changes affecting software revenue recognition, could require us to change our methods of revenue recognition. These changes could result in deferral of revenue recognized in current periods to subsequent periods or in accelerated recognition of deferred revenue to current periods, each of which could cause shortfalls in meeting the expectations of investors and securities analysts. Our stock price could decline as a result of any shortfall.
Our ability to use our net operating losses (“NOLs”) and other tax attributes to offset future taxable income could be limited by an ownership change and/or decisions by California and other states to suspend the use of NOLs.
We have significant NOLs and research and development (“R&D”) tax credits available to offset our future U.S. federal and state taxable income. Our NOLs are subject to limitations imposed by Section 382 of the Internal Revenue Code (and applicable state law). In addition, our ability to utilize any of our NOLs and other tax attributes may be subject to significant limitations under Section 382 of the Internal Revenue Code (and applicable state law) if we undergo an ownership change. In the event of an ownership change, Section 382 imposes an annual limitation (based upon our value at the time of the ownership change, as determined under Section 382 of the Internal Revenue Code) on the amount of taxable income a corporation may offset with NOLs. If we undergo an ownership change, Section 382 would also limit our ability to use R&D tax credits. In addition, if the tax basis of our assets exceeded the fair market value of our assets at the time of the ownership change, Section 382 could also limit our ability to use amortization of capitalized R&D and goodwill to offset taxable income for the first five years following an ownership change. Any unused annual limitation may be carried over to later years until the applicable expiration date for the respective NOLs. As a result, our inability to utilize these NOLs, credits or amortization as a result of any ownership changes could adversely impact our operating results and financial condition.
In addition, California and certain states have suspended use of NOLs for certain taxable years, and other states are considering similar measures. As a result, we may incur higher state income tax expense in the future. Depending on our future tax position, continued suspension of our ability to use NOLs in states in which we are subject to income tax could have an adverse impact on our operating results and financial condition.
We have incurred and will continue to incur significant costs as a result of being a public company.
As a public company, we incur significant legal, accounting and other expenses. In addition, the Sarbanes-Oxley Act of 2002, as well as rules subsequently implemented by the SEC and the Nasdaq Global Market, including rules to implement the Dodd-Frank Wall Street Reform and Protection Act recently passed by Congress, required changes in the corporate governance practices of public companies, which increase our legal and financial compliance costs and result in a diversion of management time and attention from revenue-generating activities to compliance activities. In particular, we have incurred and will continue to incur administrative expenses relating to compliance with Section 404 of the Sarbanes-Oxley Act, which requires that we implement and maintain an effective system of internal controls and annual certification of our compliance by our independent registered public accounting firm.
We are required to evaluate our internal control over financial reporting under Section 404 of the Sarbanes-Oxley Act of 2002 and any adverse results from such evaluation could result in a loss of investor confidence in our financial reports and have an adverse effect on our stock price.
Pursuant to Section 404 of the Sarbanes-Oxley Act of 2002 (“Section 404”), we are required to report on, and our independent registered public accounting firm is required to attest to, the effectiveness of our internal control over financial reporting. Our assessment of the effectiveness of our internal control over financial reporting must include disclosure of any material weaknesses in our internal control over financial reporting identified by management. We have an ongoing program to perform the system and process evaluation and testing necessary to comply with these requirements. Effective internal controls are necessary for us to provide reliable financial reports. If we cannot provide reliable financial reports, there could be an adverse reaction in the financial marketplace due to a loss of investor confidence in the reliability of our financial statements, which ultimately could negatively impact our stock price.
In addition, we must continue to monitor and assess our internal control over financial reporting because a failure to comply with Section 404 could cause us to delay filing our public reports, potentially resulting in de-listing by the Nasdaq Global Market
20
and penalties or other adverse consequences under our existing contractual arrangements. In particular, pursuant to the indenture for the 2014 Notes, if we fail to file our annual or quarterly reports in accordance with the terms of that indenture, or if we do not comply with certain provisions of the Trust Indenture Act specified in the indenture, after the passage of certain periods of time at the election of a certain minimum number of holders of the 2014 Notes, we may be in default under the indenture unless we pay a fee equal to 1% per annum of the aggregate principal amounts of the 2014 Notes, or the extension fee, to extend the default date. Even if we pay the applicable extension fee, we will eventually be in default for these filing failures if sufficient time passes and we have not made the applicable filing.
The effectiveness of disclosure controls is inherently limited.
We do not expect that our disclosure controls and procedures, or our internal control over financial reporting, will prevent all errors and all fraud. A control system, no matter how well designed and operated, can provide only reasonable, not absolute, assurance that the control system objectives will be met. The design of a control system must also reflect applicable resource constraints, and the benefits of controls must be considered relative to their costs. As a result of these inherent limitations, no evaluation of controls can provide absolute assurance that all control issues and instances of fraud, if any, within our company have been detected. Failure of the control systems to prevent error or fraud could materially adversely impact our financial results and our business.
We may not obtain sufficient patent protection, which could harm our competitive position and increase our expenses.
Our success and ability to compete depends to a significant degree upon the protection for our software and other proprietary technology. We currently have a number of issued patents in the United States, but this number is relatively small in comparison to our competitors. Patents afford only limited protection for our technology. In addition, rights that may be granted under any patent application that may issue in the future may not provide competitive advantages to us. Further, patent protection in foreign jurisdictions where we may need this protection may be limited or unavailable. It is possible that:
• | our pending U.S. and non-U.S. patents may not be issued; |
• | competitors may design around our present or future issued patents or may develop competing non-infringing technologies; |
• | present and future issued patents may not be sufficiently broad to protect our proprietary rights; and |
• | present and future issued patents could be successfully challenged for validity and enforceability. |
We believe the patent portfolios of our competitors are far larger than ours, and this may increase the risk that they may sue us for patent infringement and may limit our ability to counterclaim for patent infringement or settle through patent cross-licenses.
In addition to patents, we rely on trademark, copyright and trade secret laws and contractual restrictions to protect our proprietary rights. If these rights are not sufficiently protected, it could harm our ability to compete and generate income.
In addition to patents, we rely on a combination of trademark, copyright and trade secret laws, and contractual restrictions, such as confidentiality agreements and licenses, to establish and protect our proprietary rights. Our ability to compete and grow our business could suffer if these rights are not adequately protected. We seek to protect our source code for our software, documentation and other written materials under trade secret and copyright laws. We license our software pursuant to agreements, which impose certain restrictions on the licensee's ability to utilize the software. We also seek to avoid disclosure of our intellectual property by requiring employees and consultants with access to our proprietary information to execute confidentiality agreements. Our proprietary rights may not be adequately protected because:
• | laws and contractual restrictions in U.S. and foreign jurisdictions may not prevent misappropriation of our technologies or deter others from developing similar technologies; |
• | competitors may independently develop similar technologies and software; |
• | for some of our trademarks, federal U.S. trademark protection may be unavailable to us; |
• | our trademarks might not be protected or protectable in some foreign jurisdictions; |
• | the validity and scope of our U.S. and foreign trademarks could be successfully challenged; and |
• | policing unauthorized use of our products and trademarks is difficult, expensive and time-consuming, and we may be unable to determine the extent of this unauthorized use. |
The laws of some countries in which we market our products may offer little or no protection for our proprietary technologies. Reverse engineering, unauthorized copying or other misappropriation of our proprietary technologies could enable third parties to benefit from our technologies without paying us for them, which would harm our competitive position and market share.
Our use of open source software could negatively impact our ability to sell our products.
The products, services or technologies we acquire, license, provide or develop may incorporate or use open source software. We monitor our use of open source software in an effort to avoid unintended consequences, such as reciprocal license grants, patent retaliation clauses, and the requirement to license our products at no cost. There is little or no legal precedent for interpreting the terms of these open source licenses; therefore, we may be subject to unanticipated obligations regarding our products that
21
incorporate open source software. In addition, disclosing the content of our source code could limit the intellectual property protection we can obtain or maintain for that source code or the products containing that source code and could facilitate intellectual property infringement claims against us.
The price of our common stock may fluctuate significantly, which may make it difficult for our stockholders to resell our stock at attractive prices.
Our common stock trades on the Nasdaq Global Market under the symbol “LAVA”. There have been previous quarters in which we have experienced shortfalls in revenue and earnings from levels expected by securities analysts and investors, which have had an immediate and significant adverse effect on the trading price of our common stock. Furthermore, the price of our common stock has fluctuated significantly in recent periods.
The market price of our stock is subject to significant fluctuations in response to a number of factors, including the risk factors set forth in this Annual Report on Form 10-K, many of which are beyond our control. Such fluctuations, as well as economic conditions generally, may adversely affect the market price of our common stock.
In addition, equity markets in general and technology companies' equities in particular have recently experienced extreme price and trading volume fluctuations that often have been unrelated or disproportionate to the operating performance of individual companies. These fluctuations have in the past and may in the future adversely affect the price of our common stock, regardless of our operating performance. Recent problems with the financial system, such as problems involving banks as well as the mortgage markets, might increase such market fluctuations.
Our certificate of incorporation and bylaws, Delaware corporate law and the indenture for the 2014 Notes contain anti-takeover provisions that could delay or prevent a change in control even if the change in control would be beneficial to our stockholders. We could also adopt a stockholder rights plan, which could also delay or prevent a change in control.
Delaware law, as well as our certificate of incorporation and bylaws, contain anti-takeover provisions that could delay or prevent a change in control of our company, even if the change in control would be beneficial to the stockholders. These provisions could lower the price that future investors might be willing to pay for shares of our common stock. These anti-takeover provisions:
• | authorize our Board of Directors to create and issue, without prior stockholder approval, preferred stock that can be issued, increasing the number of outstanding shares and deter or prevent a takeover attempt; |
• | prohibit stockholder action by written consent, thereby requiring all stockholder actions to be taken at a meeting of our stockholders; |
• | establish a classified Board of Directors requiring that not all members of the Board be elected at one time; |
• | prohibit cumulative voting in the election of directors, which would otherwise allow less than a majority of stockholders to elect director candidates; and |
• | limit the ability of stockholders to call special meetings of stockholders. |
In addition, the indenture for the 2014 Notes provides that a change in control will be deemed to have occurred under the 2014 Notes if at any time after the issuance of such notes, the “continuing directors” do not constitute a majority of our Board of Directors. In such event, the holders of the 2014 Notes will have the right to require us to purchase all or any part of their 2014 Notes as of a date that is 30 business days after the occurrence of the change in control. This provision could limit the ability of our stockholders to elect directors whose nomination for election by our stockholders is not duly approved by the vote of a majority of our current directors. The indenture for the 2014 Notes also provides that a change in control will be deemed to have occurred under certain circumstances relating to a merger or sale of assets of our company, including a merger in exchange for cash consideration. In such event, the holders of the 2014 Notes will have the right to require us to purchase all or any part of their 2014 Notes, which could discourage, delay or prevent a change in control of our company.
Section 203 of the Delaware General Corporation Law and the terms of our equity incentive plans also may discourage, delay or prevent a change in control of our company. Section 203 generally prohibits a Delaware corporation from engaging in a business combination with an interested stockholder for three years after the date the stockholder became an interested stockholder. Our equity incentive plans include change-in-control provisions that allow us to grant options or other equity awards that will become vested immediately upon a change in control.
Our Board of Directors also has the power to adopt a stockholder rights plan, which could delay or prevent a change in control of us even if the change in control is generally beneficial to our stockholders. These plans, sometimes called “poison pills,” are sometimes criticized by institutional investors or their advisors and could affect our rating by such investors or advisors. If our Board were to adopt such a plan, it might have the effect of reducing the price that new investors are willing to pay for shares of our common stock.
There may be dilution to our current stockholders upon achievement of various milestones pursuant to our mergers and acquisitions.
There may be dilution to our current stockholders upon achievement of various milestones pursuant to our mergers and acquisitions. Such dilution would also dilute the voting power and ownership interest of our existing stockholders and could cause the market price of our common stock to decline and could increase the fluctuations in our stock price.
Our business operations may be adversely affected in the event of an earthquake or other natural disaster.
22
Our corporate headquarters and much of our research and development operations are located in San Jose, California, in California's Silicon Valley region, which is an area known for its seismic activity. Other of our offices in the United States and in other countries around the world may be adversely impacted by catastrophic events, such as the recent earthquake and tsunami in Japan. If an earthquake, fire, tsunami or other significant natural disaster, whether the result of global climate change or other factors, occurs at or near any of our offices, our operations may be interrupted, which could have a material adverse impact on our business, financial condition and/or operating results. In addition, if a natural disaster impacts a significant number of our customers, our business and results of operations could suffer.
23
ITEM 1B. | UNRESOLVED STAFF COMMENTS |
None
ITEM 2. | PROPERTIES |
Our corporate headquarters are located in San Jose, California, where we occupy approximately 106,854 square feet under two leases, both of which expire on October 31, 2011. We lease North American sales offices in California and Texas. In addition, we lease European offices in Germany, the Netherlands and the United Kingdom, an office in Israel, and Asian offices in China, India, Japan, South Korea and Taiwan. We believe our current facilities are adequate to support our current and near-term operations. However, if we need additional space, adequate space may not be available on commercially reasonable terms.
ITEM 3. | LEGAL PROCEEDINGS |
We are subject to certain legal proceedings and disputes that arise in the ordinary course of business from time to time. The number and significance of these legal proceedings and disputes may increase as our size changes. Any claims against us, whether meritorious or not, could be time consuming, result in costly litigation, require significant amounts of management time and result in the diversion of significant operational resources. As a result, these legal proceedings and disputes could harm our business and have an adverse effect on our consolidated financial statements. However, the results of any litigation or dispute are inherently uncertain and, at May1, 2011, no estimate could be made of the loss or range of loss, if any, from such litigation matters and disputes. Liabilities are recorded when a loss is probable and the amount can be reasonably estimated. No accrued legal settlement liabilities are recorded on the consolidated balance sheets as of May1, 2011 or May 2, 2010. Litigation settlement and legal fees are expensed in the period in which they are incurred.
In Genesis Insurance Company v. Magma Design Automation, et al., Case No. 06-5526-JW, filed on September 8, 2006 in the United States District Court for the Northern District of California, Genesis seeks a declaration of its rights and obligations under an excess directors and officers liability policy for defense and settlement costs arising out of the securities class action against us, in re: Magma Design Automation, Inc. Securities Litigation, as well as a related derivative lawsuit. Genesis seeks a return of $5.0 million it paid towards the settlement of the securities class action and derivative lawsuits from us or from another of our excess directors and officers liability insurers, National Union. We contend that either Genesis or National Union owes the settlement amounts, but not us. The trial court granted summary judgment for us and National Union, finding that Genesis owed the settlement amount. Genesis appealed to the Ninth Circuit Court of Appeals, and we cross-appealed. On July 12, 2010, the Court of Appeals reversed, ruling that Genesis does not owe the settlement amount under its policy, and remanded the case to the trial court for further proceedings. On December 20, 2010, the trial court ruled on various cross-motions that National Union owes the settlement amount to Genesis. The court entered a judgment in favor of Genesis and Magma on March 2, 2011, requiring that National Union pay $5.0 million plus prejudgment interest to Genesis. On April 1, 2011, National Union appealed the trial court's judgment to the Ninth Circuit Court of Appeals. The opening brief of National Union is due by July 11, 2011. While there can be no assurance as to the ultimate disposition of the litigation, we do not believe that its resolution will have a material adverse effect on our financial position, results of operations or cash flows.
ITEM 4. | REMOVED AND RESERVED |
24
PART II
ITEM 5. | MARKET FOR REGISTRANT'S COMMON EQUITY, RELATED STOCKHOLDER MATTERS AND ISSUER PURCHASES OF EQUITY SECURITIES |
Our common stock is traded on the Nasdaq Global Market under the symbol “LAVA”. Public trading in our common stock commenced on November 20, 2001. Prior to that, there was no public market for our common stock. As of July 12, 2011, there were 222 holders of record (not including beneficial holders of stock held in street names) of our common stock.
The following table sets forth, for the periods indicated, the high and low per share sale prices of our common stock, as reported by the Nasdaq Global Market.
High | Low | ||||||
Fiscal 2011 | |||||||
Fourth quarter | $ | 7.15 | $ | 5.28 | |||
Third quarter | $ | 5.75 | $ | 3.93 | |||
Second quarter | $ | 4.41 | $ | 2.72 | |||
First quarter | $ | 3.71 | $ | 2.61 | |||
Fiscal 2010 | |||||||
Fourth quarter | $ | 3.88 | $ | 2.24 | |||
Third quarter | $ | 2.80 | $ | 2.01 | |||
Second quarter | $ | 2.64 | $ | 1.35 | |||
First quarter | $ | 2.23 | $ | 1.08 | |||
The following graph compares the cumulative 5-year total return to holders of our common stock relative to the cumulative total returns of the NASDAQ Composite Index and the NASDAQ Computer & Data Processing Index. The graph assumes that the value of the investment in our common stock and in each index was $100 on April 2, 2006 and tracks it (including reinvestment of dividends) through May1, 2011. The comparisons in the table are required by the SEC and are not intended to forecast or be indicative of possible future performance of the common stock.
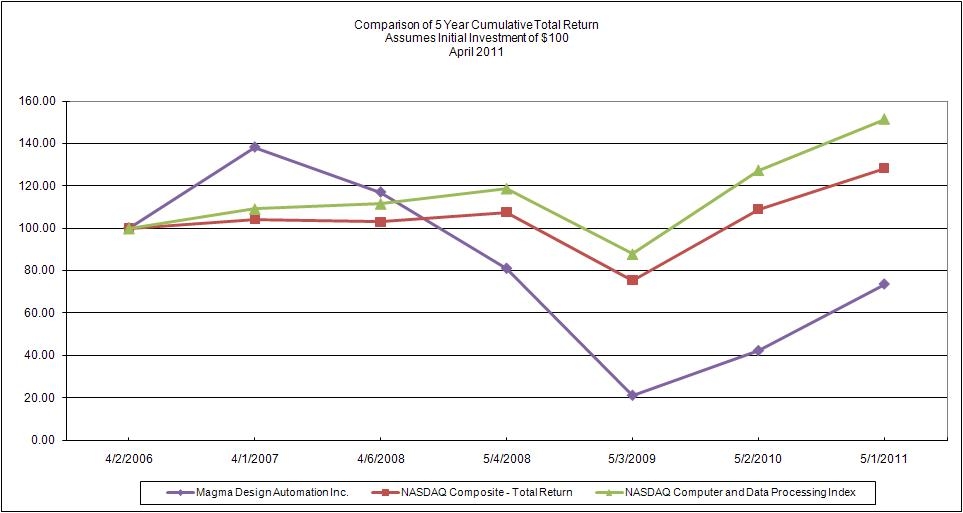
25
April 02, 2006 | April 01, 2007 | April 06, 2008 | May 4, 2008 | May 3, 2009 | May 2, 2010 | May 1, 2011 | ||||||||
Magma Design Automation, Inc. | $100 | $138.27 | $116.99 | $80.92 | $20.92 | $42.08 | $73.53 | |||||||
NASDAQ Composite | $100 | $104.19 | $102.93 | $107.57 | $75.48 | $108.91 | $128.28 | |||||||
NASDAQ Computer & Data | $100 | $109.11 | $111.61 | $118.73 | $87.93 | $127.41 | $151.43 | |||||||
* $100 invested on 4/2/2006 in stock or index, including reinvestment of dividends. Indexes calculated on month-end basis.
The above performance graph shall not be deemed “filed” for purposes of Section 18 of the Exchange Act or otherwise subject to the liabilities under that section and shall not be deemed to be incorporated by reference into any filing of Magma under the Securities Act of 1933, as amended, or the Exchange Act.
Dividend Policy
We have not declared or paid cash dividends on our common stock and do not anticipate paying any cash dividends in the foreseeable future. Our credit facility restricts our ability to pay dividends. We expect to retain future earnings, if any, to fund the development and growth of our business. Our Board of Directors will determine future dividends, if any.
Recent Sales of Unregistered Securities
None.
Purchases of Equity Securities by the Issuer
Effective January 31, 2011, our Board of Directors approved an increase in our stock repurchase program that was announced in March 2008 by an additional $10.0 million over the original authorization of $20.0 million. During fiscal 2011, we used approximately $5.3 million to repurchase 1,318,475 shares of common stock in the open market. The repurchase prices ranged from $2.82 to $5.03 per share. The repurchased shares were retired immediately subsequent to the purchase. During the fourth quarter of fiscal 2011 we did not repurchase any shares of our common stock. As of May 1, 2011, we have $19.7 million remaining available under our stock repurchase program for authorized repurchases of our common stock.
ITEM 6. | SELECTED FINANCIAL DATA |
The following selected consolidated financial data are qualified by reference to, and should be read in conjunction with, “Management's Discussion and Analysis of Financial Condition and Results of Operations” below and the Consolidated Financial Statements and related Notes included in Item 8 of this Annual Report. The selected consolidated balance sheet data as of May1, 2011 and May 2, 2010 and selected consolidated statements of operations data for the years ended May1, 2011, May 2, 2010 and May 3, 2009 are derived from our audited consolidated financial statements included elsewhere in this Annual Report. The selected consolidated balance sheet data as of May 3, 2009, April 6, 2008 and April 1, 2007 and the selected consolidated statements of operations data for the years ended April 6, 2008 and April 1, 2007 were derived from audited consolidated financial statements not included in this Annual Report. Our historical results are not necessarily indicative of our future results.
Fiscal Year Ended | |||||||||||||||||||
May 1, 2011 | May 2, 2010 | May 3, 2009 | April 6, 2008 | April 1, 2007 | |||||||||||||||
(in thousands, except per share data) | |||||||||||||||||||
Consolidated Statements of Operations Data: | |||||||||||||||||||
Revenue | $ | 139,286 | $ | 123,077 | $ | 146,957 | $ | 214,419 | $ | 178,153 | |||||||||
Cost of Revenue | $ | 19,443 | $ | 20,553 | $ | 48,329 | $ | 49,354 | $ | 54,579 | |||||||||
Operating income (loss)(1)(2)(5)(6) | $ | 4,426 | $ | (7,825 | ) | $ | (124,198 | ) | $ | (24,732 | ) | $ | (67,773 | ) | |||||
Other income (expense), net(3)(4)(6) | $ | (6,831 | ) | $ | (2,251 | ) | $ | (4,280 | ) | $ | (2,436 | ) | $ | 7,269 | |||||
Net income (loss) | $ | (3,262 | ) | $ | (3,334 | ) | $ | (129,242 | ) | $ | (33,808 | ) | $ | (61,185 | ) | ||||
Net income (loss) per share—basic | $ | (0.05 | ) | $ | (0.07 | ) | $ | (2.89 | ) | $ | (0.83 | ) | $ | (1.67 | ) | ||||
Net income (loss) per share—diluted | $ | (0.05 | ) | $ | (0.07 | ) | $ | (2.89 | ) | $ | (0.83 | ) | $ | (1.67 | ) | ||||
26
As of | |||||||||||||||||||
May 1, 2011 | May 2, 2010 | May 3, 2009 | April 6, 2008 | April 1, 2007 | |||||||||||||||
(in thousands) | |||||||||||||||||||
Consolidated Balance Sheet Data: | |||||||||||||||||||
Cash and cash equivalents, short-term and long-term investments | $ | 47,088 | $ | 74,355 | $ | 50,796 | $ | 67,508 | $ | 56,038 | |||||||||
Total assets | $ | 106,472 | $ | 122,123 | $ | 127,033 | $ | 237,310 | $ | 239,517 | |||||||||
Convertible notes, net | $ | 3,395 | $ | 51,469 | $ | 47,600 | $ | 45,291 | $ | 58,408 | |||||||||
Other non-current liabilities | $ | 22,161 | $ | 16,090 | $ | 12,889 | $ | 11,264 | $ | 1,689 | |||||||||
Total stockholders’ equity (deficit) | $ | 23,720 | $ | (4,282 | ) | $ | (13,111 | ) | $ | 106,448 | $ | 87,307 | |||||||
(1) | Includes a charge of $12.5 million relating to litigation settlement expense for fiscal 2007. |
(2) | Includes charges of $2.3 million and $1.3 million, for fiscal 2008 and 2007, respectively, for in-process research and development. |
(3) | Includes gains on extinguishment of convertible notes of $6.5 million for fiscal 2007. |
(4) | Includes charges on issuance of debt with conversion feature, of $1.5 million, $1.4 million and $0.1 million for fiscal 2009, 2008 and 2007, respectively. |
(5) | Fiscal 2009 net loss includes a $60.1 million charge for goodwill impairment. |
(6) | Fiscal 2011 net loss includes loss on extinguishment of 2014 Notes of $2.1 million and inducement fees on conversion of 2014 Notes of $2.3 million. |
27
ITEM 7. | MANAGEMENT'S DISCUSSION AND ANALYSIS OF FINANCIAL CONDITION AND RESULTS OF OPERATIONS |
This Management's Discussion and Analysis of Financial Condition and Results of Operations section should be read in conjunction with “Selected Financial Data” and our consolidated financial statements and results appearing elsewhere in this Annual Report. Throughout this section, and elsewhere in this Form 10-K, we make forward-looking statements within the meaning of Section 27A of the Securities Act of 1933 and Section 21E of the Securities Exchange Act of 1934. Any statements that do not relate to historical or current facts or matters are forward-looking statements. You can often identify these and other forward-looking statements by terms such as “becoming,” “may,” “will,” “should,” “predicts,” “potential,” “continue,” “anticipates,” “believes,” “estimates,” “seeks,” “expects,” “plans,” “intends,” the negative of such terms or other comparable terminology, or the use of future tense. Statements concerning current conditions may also be forward-looking if they imply a continuation of current conditions. These forward-looking statements include, but are not limited to:
• | our belief that our current facilities are adequate to support our current and near-term operations |
• | our expectations about future revenue , including the product sources of such future revenue, and our belief that revenue fluctuations are a result of timing of customer purchases of service |
• | our expectation that we will attain a certain level of cash flow from license sales, maintenance agreements, consulting contracts, customer contracts, acquired workforce and acquired developed technologies and patents |
• | our expectation that our sales cycle will lengthen |
• | our expectation that we will generally continue to depend upon a relatively small number of customers for a substantial portion of our revenue |
• | our expectation that we will retain future earnings, if any, to fund the development and growth of our business |
• | our expectations concerning our backlog orders |
• | our belief that we have sufficient capital resources to fund our anticipated operating and working capital requirements, capital investments and debt service |
• | our expected capital expenditures during fiscal 2012 and their expected purposes, and our expected sources of such capital expenditures |
• | our belief that our acquisitions will enable us to compete successfully in the EDA industry and our expectation that we will be able to make acquisitions in the future |
• | our expectation that we will be able to continue to use earnout arrangements to consummate our acquisitions and our belief that these arrangements will not complicate integration efforts |
• | our stock price volatility |
Although we believe that the expectations reflected in the forward-looking statements contained herein are reasonable, and we have based these expectations on our beliefs and assumptions, such expectations may prove to be incorrect. Our actual results of operations and financial performance could differ significantly from those expressed in or implied by our forward-looking statements. These statements involve certain known and unknown risks and uncertainties. Factors that could cause or contribute to such differences include, but are not limited to, the risks discussed under the heading “Risk Factors” in Item 1A of this Annual Report on Form 10-K. We do not intend, and undertake no obligation, to update any of our forward-looking statements after the date of this Annual Report on Form 10-K to reflect actual results or future events or circumstances.
Fiscal Year End
References in this Form 10-K to fiscal 2011 represent the 52 weeks ended May1, 2011, references to fiscal 2010 represent the 52 weeks ended May 2, 2010 and references to fiscal 2009 represent the 52 weeks ended May 3, 2009.
Executive Summary
We provide EDA software products and related services. Our software enables chip designers to reduce the time it takes to design and produce complex integrated circuits (“IC”) used in the wireless, communications, computing, consumer electronics, networking and semiconductor industries. Our products are used in all major phases of the chip development cycle and comprise an integrated solution for both digital and analog circuitry, from initial planning and design through physical implementation and a linear multi-computing scalable analog simulation. Our focus is on software used to design the most technologically-advanced integrated circuits, specifically those with minimum feature sizes of 65 nanometers and smaller, including the newest 28-nanometer process node. See Item 1, “Business” for a more complete description of our business
As an EDA software provider, we generate substantially all our revenue from the semiconductor and electronics industries.
28
Our customers typically fund purchases of our software and services out of their research and development (“R&D”) budgets. As a result, our revenue is heavily influenced by our customers' long-term business outlook and willingness to invest in new chip designs.
The semiconductor industry is highly volatile and cost sensitive. Our customers focus on controlling costs and reducing risk, lowering R&D expenditures, cutting back on design starts, purchasing from fewer suppliers, and requiring more favorable pricing and payment terms from suppliers. In addition, intense competition among suppliers of EDA products has resulted in pricing pressure on EDA products.
To support our customers, we have focused on providing technologically advanced products to address each step in the IC design process, as well as integrating these products into broad platforms, and expanding our product offerings. Our goal is to be the EDA technology supplier of choice for our customers as they pursue longer-term, broader and more flexible relationships with fewer suppliers.
Our accomplishments during fiscal 2011 include:
• | Validation by Taiwan Semiconductor Manufacturing Company ("TSMC") of the Titan Mixed-Signal Design Platform™, and FineSim SPICE™and FineSim Pro™ circuit simulation products, for TSMC's first Analog/Mixed-Signal Reference Flow targeting TSMC's most advanced 28-nanometer process technology in addition to Titan platform support for TSMC 40-nanometer and 65-nanometer iPDK. |
• | Release of Titan ALX™ and Titan AVP™, layout productivity improvement products within the Titan™ platform for Analog/Mixed-Signal Design. |
• | Release of Tekton™, a new standalone timing analysis platform that leverages breakthrough technology to address complex-sign-off challenges and is uniquely suited for today's most challenging designs. |
• | Release of QCP ™, a new standalone extractor that provides fast, high capacity, high accuracy extraction for the most complex SoC designs. Validated by TSMC at 28 nanometer. |
• | Availability of Talus® 1.24, latest release of our RTL-to-GDSII chip implementation system, which has successfully delivered 28 nanometer designs for key customers. Talus® 1.2 incorporates our new MX timing and extraction engines that are based on our standalone sign-off quality Tekton timing and QCP extraction products. |
• | Availability of SiliconSmart ACE™ , a next-generation intellectual property characterization and modeling tool that sets a new standard in IP characterization and modeling for designs targeted at 28 nanometer and smaller process nodes. |
• | Release of TSMC Integrated Sign-off Flow support for Magma's OCP, Quartz DRC™ and Quartz LVS™ . |
• | Release of FineSim Fast Monte Carlo™, a statistical simulation and Monte Carlo analysis product delivering up to 100 times speed improvement over traditional Monte Carlo analysis. |
• | Release of BoardView™, a new software that extends CAD navigation and circuit debug from ICs to "PCB" and "MCM". BoardView™ is the only commercially available tool to integrate IC and PCB circuit debug with online signal trace and CAD navigation |
• | Releases of Talus Vortex 1.2 and Talus Vortex FX, which demonstrated advantages in throughput and capacity. |
• | Titan was qualified for reference flows from TSMC, TowerJazz and Lfoundry, and Titan's market presence doubled as we finished the year with 25 customers. |
• | We signed more than 35 new FineSim customers and now have more than 100 FineSim customers. |
• | Overall, we added 41 new customers, growing our customer base by more than 13%. |
• | More than 100 existing customers expanded their relationship with our company by licensing additional Magma technology beyond what they already had. We closed nearly 50 transactions during the year at levels greater than half a million dollars. |
• | We established a representative-based sales channel to expand our market reach with access to emerging startup semiconductor companies and independent design firms. This channel performed ahead of schedule, signing three new logos in the fourth quarter and closing four times the business it delivered in the third quarter. |
Below is a summary of our operations for fiscal 2011:
• | Revenue for fiscal 2011 was $139.3 million, an increase of 13% from the prior year. Licenses and bundled licenses and services sales for fiscal 2011 and 2010 accounted for approximately 82% and 76%, respectively, of our revenue. |
• | In fiscal 2011, cash provided by operating and investing activities, as shown on our consolidated statements of cash flows, was $13.6 million and $15.2 million, respectively, and cash used in financing activities was $39.3 million, as compared to |
29
cash provided by operating, investing and financing activities of $16.0 million, $3.7 million and $4.8 million, respectively, in fiscal 2010.
• | Basic and diluted net loss per share decreased from $0.07 per share in fiscal 2010 to $0.05 per share in fiscal 2011. |
• | Our employee headcount increased to 696 as of May1, 2011, up from 677 as of May 2, 2010. Most of the increase in employees represents additional research and development and sales and marketing personnel. |
Global Markets
Recent market and economic conditions have been challenging with tighter credit conditions and continued slow global economic growth through fiscal 2010 and fiscal 2011. Continued concerns about the global financial and banking system, systemic impact of inflation (or deflation), energy costs, geopolitical issues, the availability and cost of credit, the U.S. mortgage market and a declining real estate market in the U.S. have contributed to increased market volatility and diminished expectations for the global economy generally.
As a result of these market conditions, the availability and cost of credit has been and may continue to be adversely affected by illiquid credit markets and wider credit spreads. Concern about the stability of the financial markets has led many lenders and institutional investors to reduce, and in some cases, cease to provide funding to borrowers. However, growth rates in the semi-conductor industry have recovered recently. If these market conditions decline, they may limit our or our customer's ability to access the capital markets to meet liquidity needs, resulting in an adverse effect on our financial condition and results of operations.
Critical Accounting Policies and Estimates
In preparing our consolidated financial statements, we make estimates, assumptions and judgments that can have a significant impact on our revenue, operating income or loss and net income or loss, as well as on the value of certain assets and liabilities on our balance sheet. We believe that the estimates, assumptions and judgments involved in the accounting policies described below have the most significant potential impact on our financial statements, so we consider these to be our critical accounting policies. We consider the following accounting policies related to revenue recognition, stock-based compensation, unbilled accounts receivable, allowance for doubtful accounts, cash equivalent, short-term and long-term investments, strategic investments, asset purchases and business combinations, valuation of long-lived assets and income taxes to be our most critical policies due to the estimation processes involved in each.
Revenue recognition
We earn revenue on software arrangements involving multiple elements (such as software products, upgrades, enhancements, maintenance, installation and training). Revenue is allocated to each element based on the relative fair values of the elements. The fair value of an element must be based on evidence that is specific to us. If evidence of fair value does not exist for each element of a license arrangement and maintenance is the only undelivered element, then all revenue for the license arrangement is recognized over the term of the agreement. If evidence of fair value does exist for the elements that have not been delivered, but does not exist for one or more delivered elements, then revenue is recognized using the residual method, under which recognition of revenue for the undelivered elements is deferred and the residual license fee is recognized as revenue immediately.
Our revenue recognition policy is detailed in Note 1, The Company and Summary of Significant Accounting Policies, to the consolidated financial statements in Item 8 of this Form 10-K. Management has made significant judgments related to revenue recognition. Specifically, in connection with each transaction involving our products (referred to as an “arrangement” in the accounting literature) we must evaluate whether our fee is “fixed or determinable” and we must assess whether “collectability is probable.” These judgments are discussed below.
The fee is fixed or determinable. With respect to each arrangement, we must make a judgment as to whether the arrangement fee is fixed or determinable. If the fee is fixed or determinable, then revenue is recognized upon delivery of software (assuming other revenue recognition criteria are met). If the fee is not fixed or determinable, then the revenue is recognized when customer installments are due and payable.
In order for an arrangement to be considered to have fixed or determinable fees, 100% of the license, services and initial post contract support fee is to be paid within one year or less from the order date. We have a history of collecting fees on such arrangements according to contractual terms. Arrangements with payment terms extending beyond twelve months are considered not to be fixed or determinable.
Collectability is probable. In order to recognize revenue, we must make a judgment about the collectability of the arrangement fee. Our judgment of the collectability is applied on a customer-by-customer basis pursuant to our credit review policy. We typically sell to customers for which there is a history of successful collection. New customers are subjected to a credit review process, which evaluates the customers' financial positions and ability to pay. If it is determined from the outset of an arrangement that collectability is not probable based upon our credit review process, revenue is recognized on a cash receipts basis (as each payment is collected).
30
Licenses revenue and bundled licenses and services revenue
We derive licenses revenue primarily from licenses of our design and implementation software and, to a lesser extent, from licenses of our analysis and verification products. We license our products under time-based and perpetual licenses whereby licenses revenue is recognized after the execution of a license agreement and the delivery of the product to the customer, provided that there are no uncertainties surrounding the product acceptance, fees are fixed or determinable, collection is probable and there are no remaining obligations other than maintenance.
For perpetual licenses and unbundled time-based license arrangements, where maintenance is included for the first period of the license term, with maintenance thereafter renewable by the customer at the substantive rates stated in their agreements with us, the stated rate for maintenance renewal is vendor-specific objective evidence (“VSOE”) of the fair value of maintenance in these arrangements. For these arrangements, licenses revenue is recognized using the residual method in the period in which the license agreement is executed assuming all other revenue recognition criteria are met. Where an arrangement involves extended payment terms, revenue recognized using the residual method is limited to amounts due and payable.
The Company provides design methodology assistance and specialized services relating to generalized turnkey design services. The Company has VSOE of fair value for consulting and training services. Therefore, revenue from such services is recognized when such services are performed provided all other revenue recognition criteria are met. The Company's consulting services generally are not essential to the functionality of the software. The Company's software products are fully functional upon delivery and implementation does not require any significant modification or alteration. The Company's services to its customers often include assistance with product adoption and integration and specialized design methodology assistance. Customers typically purchase these professional services to facilitate the adoption of the Company's technology and dedicate personnel to participate in the services being performed, but they may also decide to use their own resources or appoint other professional service organizations to provide these services. Software products are billed separately and independently from consulting services, which are generally billed on a time-and-materials or milestone-achieved basis. The Company generally recognizes revenue from consulting services as the services are performed.
Where consulting and training services are included in bundled arrangements that include time-based licenses and PCS where VSOE of PCS has not been established, the Company recognizes the entire arrangement fee ratably over the PCS service period, beginning with the delivery of the software, provided that all other revenue recognition criteria are met.
For transactions that include bundled maintenance for the entire license term we have no VSOE of fair value of maintenance. Therefore, we recognize licenses revenue ratably over the maintenance period. If an arrangement involves extended payment terms-that is, where payment for less than 100% of the arrangement fee is due within one year of the contract date, we recognize revenue to the extent of the lesser of the amount due and payable or the ratable portion. Where consulting and training services are included in bundled arrangements that include time-based licenses and post contract support (“PCS”) where VSOE of PCS has not been established, we recognize the entire arrangement fee ratably over the PCS service period, beginning with the delivery of the software, provided that all other revenue recognition criteria are met. We classify the revenue recognized from these transactions separately as bundled licenses and services revenue in our consolidated statements of operations.
If we were to change any of these assumptions or judgments, it could cause a material increase or decrease in the amount of revenue that we report in a particular period. Amounts invoiced relating to arrangements where revenue cannot be recognized are reflected on our balance sheet as deferred revenue and recognized over time as the applicable revenue recognition criteria are satisfied.
Services revenue
We derive services revenue primarily from consulting and training for our software products and from maintenance fees for our products. Most of our license agreements include maintenance, generally for a one-year period, renewable annually. Services revenue from maintenance arrangements is recognized on a straight-line basis over the maintenance term. Because we have VSOE of fair value for consulting and training services, revenue is recognized as these services are performed or completed provided all other revenue recognition criteria are met. Our consulting and training services are generally not essential to the functionality of the software. Our products are fully functional upon delivery of the product. Additional factors considered in determining whether the revenue should be accounted for separately include, but are not limited to: degree of risk, availability of services from other vendors, timing of payments and impact of milestones or acceptance criteria on our ability to recognize the software license fee.
Stock-based compensation
Stock-based compensation expense is measured at the grant date, based on the fair value of the award, and is recognized as expense, net of estimated forfeitures, over the vesting period of the award.
Determining the fair value of stock-based awards at the grant date requires the input of various highly subjective assumptions, including expected future stock price volatility, expected term of instruments and expected forfeiture rates. We established the expected term for employee options and awards, as well as forfeiture rates, based on the historical settlement experience, while
31
giving consideration to vesting schedules and to options that have estimated life cycles less than the contractual terms. Assumptions for option exercises and pre-vesting terminations of options were stratified for employee groups with sufficiently distinct behavior patterns. Expected future stock price volatility was developed based on the average of our historical weekly stock price volatility and average implied volatility. These input factors are subjective and are determined using management's judgment. If actual results differ significantly from these estimates, stock-based compensation expense and our results of operations could be materially affected.
Unbilled accounts receivable
Unbilled accounts receivable represent revenue that has been recognized in advance of being invoiced to the customer. In all cases, the revenue and unbilled receivables are for contracts that are non-cancelable, in which there are no contingencies and where the customer has taken delivery of both the software and the encryption key required to operate the software. We typically generate invoices 45 days in advance of contractual due dates, and we invoice the entire amount of the unbilled accounts receivable within one year from the contract inception.
Allowances for doubtful accounts
We maintain allowances for doubtful accounts for estimated losses resulting from the inability of our customers to make required payments. We regularly review the adequacy of our accounts receivable allowance after considering the size of the accounts receivable balance, each customer's expected ability to pay and our collection history with each customer. We review significant invoices that are past due to determine if an allowance is appropriate using the factors described above. We also monitor our accounts receivable for concentration in any one customer, industry or geographic region.
As of May1, 2011 and May 2, 2010, one customer accounted for 26% and 10%, respectively, of total receivables. The allowance for doubtful accounts represents our best estimate, but changes in circumstances relating to accounts receivable may result in a requirement for additional allowances in the future. If actual losses are significantly greater than the allowance we have established, our sales and marketing expenses and reported net loss would increase. Conversely, if actual credit losses are significantly less than our allowance, our general and administrative expenses would decrease and our reported net income would increase.
Fair value option for financial assets and financial liabilities
We have elected to account for certain financial instruments and certain other items at fair value, with changes in fair value recognized in earnings each reporting period. The election, called the fair value option, enabled us to account for a financial asset or liability at fair value.
We adopted the fair value option in the first quarter of fiscal 2009. Our adoption of the fair value option permits us to elect to carry certain financial instruments at fair value with corresponding changes in fair value reported in the results of operations. The election to carry an instrument at fair value is made at the individual contract level and can be made only at origination or inception of the instrument, or upon the occurrence of an event that results in a new basis of accounting. Our election is on a prospective basis and is irrevocable.
During the second quarter of fiscal 2009, we elected fair value accounting for the purchased put option recorded in connection with the Auction Rate Securities ("ARS") settlement agreement signed with UBS Financial Services, Inc. ("UBS"). This election was made in order to mitigate volatility in earnings caused by accounting for the purchased put option and underlying ARS under different methods.
We recorded a gain of $38,000 in fiscal 2011, which is reported in “Valuation gain, net” in the consolidated statements of operations. During fiscal 2010, we recorded a gain of $1.8 million for the ARS. This gain was partly offset by losses related to the purchased put option of $1.4 million.
Cash equivalent and short-term investments
Our investments are typically classified as available-for-sale, and are recorded on the balance sheet at fair value as of the balance sheet date, with gains or losses considered to be temporary in nature reported as a component of other comprehensive income (loss) within the stockholders' equity on our consolidated balance sheets. As of January 2, 2009, investments in ARS have been classified as trading, and are recorded on the balance sheet at fair value as of the balance sheet date, with gains or losses recorded as other income or expense on our consolidated statements of operations.
During the first quarter of fiscal 2011, we exercised the purchased put option and liquidated the $16.8 million of ARS. A gain of $38,000 on liquidation is recorded in “Valuation gain, net” in the consolidated statements of operation in fiscal 2011.
In October 2008, we entered into an agreement with UBS, which provided us with Auction Rate Securities Rights (“Rights”) to sell our ARS at par value to UBS at any time during the period June 30, 2010 through July 2, 2012. These Rights were a separate freestanding instrument accounted for separately from the ARS, and were registered, nontransferable securities accounted for as a purchased put option initially recorded at fair value. Additionally, UBS offered a “no net cost” loan to us of up to 75% of the
32
market value of the ARS as determined by UBS until June 30, 2010. Due to our entering into this agreement with UBS, the ARS previously reported as available-for-sale were transferred to trading securities.
The purchased put option gave us the right to sell the ARS to UBS for a price equal to par value during the period June 30, 2010 to July 2, 2012. The fair value of the purchased put option at May 2, 2010 represented the difference between the ARS with an estimated time to liquidity of 4.0 years and the ARS with an estimated time to liquidity of 0.2 year as the purchased put option allowed for the acceleration of liquidity and the avoidance of a below-market coupon rate.
We measure fair value based on a three-tier fair value hierarchy, which prioritizes the inputs used in measuring fair value. These tiers include: Level 1, defined as observable inputs such as quoted prices in active markets; Level 2, defined as inputs other than quoted prices in active markets that are either directly or indirectly observable; and Level 3, defined as unobservable inputs in which little or no market data exists, therefore requiring an entity to develop its own assumptions.
Based on the Level 3 valuation and the transfer of the ARS from the available-for-sale category to the trading category, we recorded an other-than-temporary loss of $2.8 million in valuation gain (loss), net in the second quarter of fiscal 2009 including the transfer of accumulated temporary losses of $0.9 million from other comprehensive loss previously recorded as a component of stockholders' equity.
Accounting for asset purchases and business combinations
We are required to allocate the purchase price of acquired assets and business combinations to the tangible and intangible assets acquired and liabilities assumed, as well as in-process research and development based on their estimated fair values. Such a valuation requires management to make significant estimates and assumptions, especially with respect to the value of intangible assets.
Critical estimates in valuing certain of the intangible assets include but are not limited to: future expected cash flows from license sales, maintenance agreements, consulting contracts, customer contracts, acquired workforce and acquired developed technologies and patents; expected costs to develop the in-process research and development into commercially viable products and estimated cash flows from the projects when completed; the acquired company's brand awareness and market position, as well as assumptions about the period of time the acquired brand will continue to be used in the combined company's product portfolio; and discount rates. Management's estimates of fair value are based upon assumptions believed to be reasonable, but which are inherently uncertain and unpredictable. Assumptions may be incomplete or inaccurate, and unanticipated events and circumstances may occur.
Other estimates associated with the accounting for business combinations may change as additional information becomes available regarding the assets acquired and liabilities assumed, which could result in changes in the purchase price allocation.
Goodwill impairment
We test goodwill for impairment at the reporting unit level (operating segment or one level below an operating segment) on an annual basis and between annual tests if we believe an impairment of goodwill may have occurred. Application of the goodwill impairment test requires judgment, including the identification of reporting units, assigning assets and liabilities to reporting units, assigning goodwill to reporting units, and determining the fair value of the reporting units. We have determined that we have one reporting unit (see Note 16, Segment Information, to our consolidated financial statements in Item 8). Significant judgments required to estimate the fair value of reporting units include estimating future cash flows, determining appropriate discount rates and other assumptions. Changes in these estimates and assumptions could materially affect the determination of fair value for the reporting units. Any impairment losses recorded in the future could have a material adverse impact on our financial condition and results of operations.
We use a two-step approach to determining whether and by how much goodwill has been impaired. The first step requires a comparison of the fair value of the Company (reporting unit) to its net book value. To determine the fair value, we use a market approach. Under the market approach, the fair value of the reporting unit is based on quoted market prices and the number of shares outstanding of our common stock. If the fair value is greater than net book value, no impairment is deemed to have occurred. If the fair value is less, then the second step must be performed to determine the amount, if any, of actual impairment. We use the income method for the second step. The income method is based on a discounted future cash flow approach that uses estimates, including the following for the reporting unit: revenue, based on assumed market growth rates and our assumed market share; estimated costs; and appropriate discount rates based on the particular business's weighted average cost of capital. Our estimates of market segment growth, market segment share and costs are based on historical data, various internal estimates and certain external sources, and are based on assumptions that are consistent with the plans and estimates that we use to manage the underlying business. Our business consists of both established and emerging technologies and our forecasts for emerging technologies are based upon internal estimates and external sources rather than historical information.
During fiscal 2011 and fiscal 2010, we did not believe that circumstances existed that showed the existence of impairment
33
indicators and, accordingly, we evaluated our goodwill for impairment on an annual basis only. We conducted our annual goodwill impairment test at December 31, 2010 and December 31, 2009, respectively, using the market approach for the first step. At December 31, 2010 and December 31, 2009, we determined that the fair value of the reporting unit was greater than the book value of the net assets of the reporting unit and therefore concluded there was no impairment of goodwill. Accordingly, we did not proceed to the second step.
During fiscal 2009, we conducted this test during the third quarter and concluded that events had occurred and circumstances had changed during the third fiscal quarter of fiscal 2009 that showed the existence of impairment indicators, including a significant decline in our stock price and continued deterioration in the EDA software products market and the related impact on our revenue forecasts. Consistent with our approach in our annual impairment testing, in assessing the fair value of the reporting unit, we considered both the market approach and income approach. At December 31, 2008, using the step one market approach, we determined that the fair value of our reporting units was less than the book value of the net assets of the reporting unit and accordingly, we performed step two of the impairment test.
In step two of the impairment test, we determined the implied fair value of the goodwill and compared it to the carrying value of the goodwill. With the assistance of a third party valuation firm, we allocated the fair value of the reporting unit to all of its assets and liabilities as if the reporting unit had been acquired in a business combination and the fair value of the reporting unit was the price paid to acquire the reporting unit. The excess of the fair value of the reporting unit over the amount assigned to its assets and liabilities is the implied fair value of goodwill. Our step two analysis resulted in a reduction in fair value of goodwill, and therefore, we recognized an impairment charge of $60.1 million in the third quarter of fiscal 2009.
Valuation of intangibles and long-lived assets
Our intangible assets include acquired intangibles, excluding goodwill. Acquired intangibles with definite lives are amortized on a straight-line basis over the remaining estimated economic life of the underlying products and technologies (original lives assigned are one to six years). For assets to be held and used, we review the remaining estimated economic life whenever events or changes in circumstances indicate that the carrying amount of a long-lived asset may not be recoverable. Recoverability of an asset is measured by comparison of its carrying amount to the expected future undiscounted cash flows that the asset is expected to generate. If it is determined that an asset is not recoverable, an impairment loss is recorded in the amount by which the carrying amount of the asset exceeds its fair value. Based on our review, no impairment is indicated.
Income taxes
Significant judgment is required in determining our provision for income taxes. In the ordinary course of business, there are many transactions and calculations where the ultimate tax outcome is uncertain. The amount of income taxes we pay could be subject to audits by federal, state, and foreign tax authorities, which could result in proposed assessments. Although we believe that our estimates are reasonable, no assurance can be given that the final outcome of these tax matters will not be different from what was reflected in our historical income tax provisions.
Deferred tax assets and liabilities result primarily from temporary timing differences between book and tax valuation of assets and liabilities, as well as federal and state net operating loss and credit carryforwards. We assess the likelihood that our net deferred tax assets will be recovered from future taxable income and, to the extent we believe that the recovery is not likely, we establish a valuation allowance. We consider all available positive and negative evidence including our past operating results, the existence of cumulative losses in the most recent fiscal years, future taxable income, and ongoing prudent and feasible tax planning strategies in assessing the amount of the valuation allowance. As of May1, 2011, we believe a valuation allowance against our U.S. net deferred tax assets is required. We will continue to evaluate the realizability of the deferred tax assets on a quarterly basis. Future reversals or increases to our valuation allowance could have a significant impact on our future earnings.
Strategic investments in privately-held companies
Our strategic equity investments consist of preferred stock and convertible notes that are convertible into preferred or common stock of several privately-held companies. The carrying value of our portfolio of strategic equity investments totaled $0.5 million at May1, 2011. Our ability to recover our investments in private, non-marketable equity securities and convertible notes and to earn a return on these investments is primarily dependent on how successfully these companies are able to execute on their business plans and how well their products are accepted, as well as their ability to obtain additional capital funding to continue operations.
Under our accounting policy, the carrying value of a non-marketable investment is the amount paid for the investment unless it has been determined to be other than temporarily impaired, in which case we write the investment down to its estimated fair value. For equity investments where our ownership interest is between 20% to 50%, or where we can exercise significant influence on the investee's operating or financial decisions, we record our share of net equity income (loss) of the investee based on our proportionate ownership.
We review all of our investments periodically for impairment; however, for non-marketable equity securities, the fair value analysis requires significant judgment. This analysis includes assessment of each investee's financial condition, the business outlook
34
for its products and technology, its projected results and cash flows, the likelihood of obtaining subsequent rounds of financing and the impact of any relevant contractual equity preferences held by us or others. If an investee obtains additional funding at a valuation lower than our carrying amount, we presume that the investment is other than temporarily impaired, unless specific facts and circumstances indicate otherwise, such as when we hold contractual rights that give us a preference over the rights of other investors. As the equity markets have experienced volatility over the past few years, we have experienced substantial impairments in our portfolio of non-marketable equity securities. If equity market conditions do not improve, as companies within our portfolio attempt to raise additional funds, the funds may not be available to them, or they may receive lower valuations, with more onerous investment terms than in previous financings, and the investments will likely become impaired. However, we are not able to determine at the present time which specific investments are likely to be impaired in the future, or the extent or timing of individual impairments. We recorded write-downs related to these non-marketable equity investments of $0.1 million and $0.1 million for both the fiscal years 2011 and 2010, respectively, for our proportionate share in the net losses of the investee companies.
During the third quarter of fiscal 2011, Xilinx, Inc. purchased 100% of the outstanding stock of AutoESL Design, Inc., for $24.0 million in cash and future contingent cash payments. Our 10% ownership interest in AutoESL, at the time of the sale resulted in $1.9 million in cash at closing and $0.5 million in contingent proceeds. The contingent proceeds consist of an amount equal to 20% of the initial consideration to be held in escrow and released for payment 12 months from the date of the agreement, to secure the indemnification obligations of the seller. The escrow proceeds represent a security from the AutoESL stockholders to indemnify and hold Xilinx harmless should it suffer any monetary damages paid, incurred or sustained from (a) any breach of or inaccuracy in a representation or warranty of AutoESL; (b) any failure of AutoESL to perform or comply with any covenant or agreement applicable to the merger agreement; (c) fraud; (d) any liability for taxes or any claims by any third-party alleging or involving pre-closing taxes; (e) any inaccuracy in any information to be delivered to Xilinx for the merger; and (f) any amounts paid to holders of dissenting shares in excess of the amount they would have been entitled to pursuant to the terms of the merger. The proceeds (net of expenses) of $1.9 million offset against the net book value of the investment of $1.0 million on the date of sale of the investment resulted in a net gain of $0.9 million, which was recorded in the Statement of Operations in Other Income.
The escrow amount is a contingency representing incremental income and will be recognized if and when all contingencies are resolved.
During the fourth quarter of fiscal 2010, Synopsys, Inc. purchased 100% of the outstanding stock of Zerosoft, Inc., for $24.0 million in cash and future contingent cash payments. Our 35% ownership interest in Zerosoft, Inc. at the time of the sale resulted in $4.7 million in cash at closing and $4.3 million in contingent proceeds. The contingent proceeds consist of a holdback amount equal to 10% of the initial consideration to be held in escrow and released for payment 15 months from the date of the agreement to secure the indemnification obligations of the sellers, and earnout consideration based upon the achievement of certain annual product performance improvement milestones for the three years subsequent to the sale agreement. The proceeds (net of expenses) of $4.6 million offset against the net book value of the investment of $1.4 million on the date of sale of the investment resulted in a net gain of $3.2 million, which was recorded in the Statement of Operations in Other Income.
The holdback amount and earnout consideration are gain contingencies each representing incremental income and will be recognized if and when all contingencies are resolved.
Results of Operations
Revenue overview
Revenue is comprised of licenses revenue, services revenue, and bundled licenses and services revenue. Licenses revenue consists of fees for time-based or perpetual licenses of our software products. Bundled licenses and services revenue consists of fees for software licenses and PCS where we do not have VSOE of fair value of PCS. Services revenue consists of fees for services, such as customer training, consulting and PCS associated with licenses where we have established VSOE to account for services separately. We recognize revenue based on the specific terms and conditions of the license contracts with our customer for our products and services as described in detail above under the caption “Critical Accounting Policies and Estimates.”
In our consolidated financial statements, we classify our license arrangements as either bundled or unbundled. Bundled license contracts include maintenance with the license fee and do not include optional maintenance periods. Unbundled license contracts have separate maintenance fees and include optional maintenance periods. The Company offers various contractual terms to its customers in designing license agreements to accommodate customer preferences, which are unrelated to product performance and service requirements, order volume, or pricing. The contractual terms that result in the recognition of bundled licenses and services revenue are subject to customer preferences and have historically been inconsistently elected by customers. Moreover, revenue from existing long-term contracts frequently shifts between revenue categories, with no change in the aggregate revenues recognized from such contracts. In light of the foregoing, the Company has concluded that changes in results of the bundled licenses and services revenue category generally do not indicate a material trend in the Company's historical or future performance and therefore are not discussed below.
For management reporting and analysis purposes, we classify our revenue as either licenses or services. Bundled licenses and
35
services are divided into their component parts and included with either licenses or services for management analysis.
Licenses revenue is divided into the following categories:
• | Ratable |
• | Due & Payable |
• | Up-Front |
• | Cash Receipts |
Services revenue is analyzed separately from the licenses revenue portion.
We use these classifications of revenue to provide greater insight into the reporting and monitoring of trends in the components of our revenue and to assist us in managing our business. The characterization of an individual contract may change over time. For example, a contract originally characterized as Ratable may be redefined as Cash Receipts if that customer has difficulty in making payments in a timely fashion. In cases where a contract has been re-characterized for management reporting and analysis purposes, prior periods are not restated to reflect that change.
Ratable. For bundled time-based licenses, we recognize licenses revenue ratably over the contract term, or as customer payments become due and payable, if less. In our statements of operations the revenue for these bundled arrangements for both license and service is classified as bundled licenses and services. For management reporting and analysis purposes we separate the licenses portion from the services portion of the revenue. We generally refer to these licenses as “Ratable” and we generally refer to all time-based licenses recognized on a ratable basis as “Long-Term,” independent of the actual length of term of the license.
Due & Payable. For unbundled time-based licenses where the payment terms extend greater than one year from the arrangement effective date, we recognize licenses revenue on a due and payable basis. For management reporting and analysis purposes, we generally refer to this type of license as “Due & Payable.”
Up-Front. For unbundled time-based and perpetual licenses, we recognize licenses revenue upon shipment if the payment terms require the customer to pay 100% of the license fee and the initial period of PCS within one year from the agreement date and payments are generally linear. In all of these cases, the contracts are non-cancelable, and the customer has taken delivery of both the software and the encryption key required to operate the software. For management reporting and analysis purposes, we generally refer to this type of license as “Up-Front,” where the license is either perpetual or time-based.
Cash Receipts. We recognize revenue from customers who have not met our predetermined credit criteria on a cash receipts basis to the extent that revenue has otherwise been earned. We recognize licenses revenue as we receive cash payments from these customers. For management reporting and analysis purposes, we refer to this type of licenses revenue as “Cash Receipts.”
Our licenses revenue in any given quarter depends upon the mix and volume of perpetual or short-term licenses ordered during the quarter and the amount of long-term ratable, due & payable, and cash receipts licenses revenue recognized during the quarter. In general, we refer to licenses revenue recognized from perpetual or time-based licenses during the quarter as “Up-Front” revenue, for management reporting and analysis purposes. All other types of revenue are generally referred to as revenue from backlog, such as licenses revenue recognized during the current period from perpetual or time-based licenses from contracts entered into in prior periods. We set our revenue targets for any given period based, in part, upon an assumption that we will achieve a certain level of orders and a certain mix of short-term licenses. The precise mix of orders fluctuates substantially from period to period and affects the revenue we recognize in the period. If we achieve our target level of total orders but are unable to achieve our target license mix, we may not meet our revenue targets (if we have more-than-expected long-term licenses) or may exceed them (if we have more-than-expected short-term or perpetual licenses). If we achieve the target license mix but the overall level of orders is below the target level, then we also may not meet our revenue targets as described in the risk factors in Item 1A of this Form 10-K.
Services revenue
Services revenue is primarily from consulting and training for our software products and from maintenance fees for our products. Most of our license agreements include maintenance, generally for a one-year period, renewable annually. Services revenue from maintenance arrangements is recognized ratably over the maintenance term. Because we have VSOE of fair value for consulting and training services, revenue is recognized as these services are performed or completed provided all other revenue recognition criteria are met. However, where consulting and training services are included in bundled arrangements that include time-based licenses and PCS where VSOE of PCS has not been established, the entire arrangement fee is recognized ratably over the PCS service period, beginning with the delivery of the software, provided that all other revenue recognition criteria are met.
Revenue, cost of revenue and gross profit
The table below sets forth the fluctuations in revenue, cost of revenue and gross profit data by category as defined for management reporting and analysis purposes for fiscal 2011, fiscal 2010 and fiscal 2009 (in thousands, except for percentage
36
data):
Year Ended: | % Change | ||||||||||||||||||||||||||
May1, 2011 | % of Revenue | May 2, 2010 | % of Revenue | May 3, 2009 | % of Revenue | 2011 / 2010 | 2010 / 2009 | ||||||||||||||||||||
Revenue | |||||||||||||||||||||||||||
Licenses revenue | |||||||||||||||||||||||||||
Ratable | $ | 22,174 | 16 | % | $ | 25,453 | 21 | % | $ | 29,040 | 20 | % | (13 | )% | (12 | )% | |||||||||||
Due & Payable | 52,727 | 38 | % | 47,642 | 39 | % | 44,871 | 31 | % | 11 | % | 6 | % | ||||||||||||||
Up-Front* | 23,212 | 17 | % | 7,946 | 6 | % | 23,376 | 16 | % | 192 | % | (66 | )% | ||||||||||||||
Cash Receipts | 10,157 | 7 | % | 6,017 | 5 | % | 6,537 | 4 | % | 69 | % | (8 | )% | ||||||||||||||
Total Licenses revenue** | 108,270 | 78 | % | 87,058 | 71 | % | 103,824 | 71 | % | 24 | % | (16 | )% | ||||||||||||||
Services revenue** | 31,016 | 22 | % | 36,019 | 29 | % | 43,133 | 29 | % | (14 | )% | (16 | )% | ||||||||||||||
Total Revenue | 139,286 | 100 | % | 123,077 | 100 | % | 146,957 | 100 | % | 13 | % | (16 | )% | ||||||||||||||
Cost of Revenue | |||||||||||||||||||||||||||
License | 3,573 | 3 | % | 4,424 | 4 | % | 26,382 | 18 | % | (19 | )% | (83 | )% | ||||||||||||||
Services | 15,870 | 11 | % | 16,129 | 13 | % | 21,947 | 15 | % | (2 | )% | (27 | )% | ||||||||||||||
Total cost of sales | 19,443 | 14 | % | 20,553 | 17 | % | 48,329 | 33 | % | (5 | )% | (57 | )% | ||||||||||||||
Gross Profit | $ | 119,843 | 86 | % | $ | 102,524 | 83 | % | $ | 98,628 | 67 | % | 17 | % | 4 | % | |||||||||||
* Includes $14,572 or 10% of total revenue from new contracts for fiscal 2011, $7,778 or 6% of total revenue from new contracts for fiscal 2010 and $12,832 or 9% of total revenue from new contracts for fiscal 2009.
** Bundled licenses and services in the consolidated statement of operations consists of $21,374 of licenses revenue and $5,904 of service revenue for fiscal 2011, $24,833 of licenses revenue and $6,767 of service revenue for fiscal 2010, and $27,350 of licenses revenue and $6,081 of service revenue for fiscal 2009.
We market our products and related services to customers in four geographic regions: North America, Europe (including Europe, the Middle East and Africa), Japan, and Asia-Pacific (including India, South Korea, Taiwan, Hong Kong and the People's Republic of China). Internationally, we market our products and services primarily through our subsidiaries and various distributors. Revenue is attributed to geographic areas based on the country in which the customer is domiciled. The table below sets forth geographic distribution of revenue data for fiscal 2011, fiscal 2010 and fiscal 2009 (in thousands, except for percentage data):
Year Ended: | % Change | ||||||||||||||||||||||||||
May1, 2011 | % of Revenue | May 2, 2010 | % of Revenue | May 3, 2009 | % of Revenue | 2011 / 2010 | 2010 / 2009 | ||||||||||||||||||||
North America | $ | 90,321 | 65 | % | $ | 72,100 | 59 | % | $ | 86,576 | 59 | % | 25 | % | (17 | )% | |||||||||||
International | |||||||||||||||||||||||||||
Europe | 10,818 | 8 | % | 12,927 | 11 | % | 17,893 | 12 | % | (16 | )% | (28 | )% | ||||||||||||||
Japan | 14,844 | 10 | % | 14,637 | 11 | % | 24,975 | 17 | % | 1 | % | (41 | )% | ||||||||||||||
Asia-Pacific (excluding Japan) | 23,303 | 17 | % | 23,413 | 19 | % | 17,513 | 12 | % | — | % | 34 | % | ||||||||||||||
Total International | 48,965 | 35 | % | 50,977 | 41 | % | 60,381 | 41 | % | (4 | )% | (16 | )% | ||||||||||||||
Total Revenue | $ | 139,286 | 100 | % | $ | 123,077 | 100 | % | $ | 146,957 | 100 | % | 13 | % | (16 | )% | |||||||||||
Revenue
Revenue for fiscal 2011 was $139.3 million, an increase of 13% from fiscal 2010.
Licenses revenue increased by 24% in fiscal 2011 compared to fiscal 2010. The increase in licenses revenue was due to the enhanced versions of several existing products gaining initial market acceptance with new and existing key customers.
Licenses revenue decreased by 16% in fiscal 2010 compared to fiscal 2009. The decrease in licenses revenue was primarily the result of the downturn in the semiconductor and systems industries, which caused customers to reduce spending. Although licenses revenue in fiscal 2010 decreased as compared to fiscal 2009, licenses revenue as percentage of total revenue remained the same due to the enhanced versions of several existing products gaining initial market acceptance.
The change in licenses revenue by categories:
• | Ratable and Due & Payable revenue combined increased by $1.8 million, but decreased 2% as a percentage of total revenue in fiscal 2011 as compared to fiscal 2010. The increase in revenue is the result of the mix and volume of revenue |
37
from backlog from long-term Ratable and Due & Payable contracts recognized during the year compared to Up-Front revenue. The mix and volume of contracts is primarily driven by customer requirements and is within our expected target of revenue from backlog. The marginal decrease as a percentage of total revenue is due to the increase in revenue from Up-Front revenue during fiscal 2011.
Ratable and Due & Payable revenue combined decreased $0.8 million or 1% in fiscal 2010 as compared to fiscal 2009. The decrease was due to the decrease in total revenue due to the continued downturn in the economic conditions.
• | Up-Front revenue increased by $15.3 million or 192% in fiscal 2011 as compared to fiscal 2010. Up-Front revenue as a percentage of total revenue increased by 11% in fiscal 2011 as compared to fiscal 2010. The increase as a percentage of total revenue is the result of the mix and volume of Up-Front revenue recognized during the year compared to revenue from backlog from long term Ratable and Due & Payable contracts. The mix and volume of Up-Front contracts is primarily driven by customer requirements and includes $14.6 million, or 10% of total revenue for fiscal 2011, from new contracts entered into during fiscal 2011, and is within our target of having Up-Front revenue comprise 10% or less of total revenue. |
Up-Front revenue decreased $15.4 million or 66% in fiscal 2010 as compared to fiscal 2009. Up-Front revenue as a percentage of total revenue decreased by 10% in fiscal 2010 as compared to fiscal 2009. The decrease was due to the overall decrease in revenue due to the downturn in the semiconductor and systems industries, which caused customers to reduce spending. The decrease was also due to our intent to increase the portion of revenue based on backlog to 90% or more of total revenue to reduce volatility and increase predictability of our revenues.
• | Cash Receipts revenue increased by $4.1 million or 69% in fiscal 2011 as compared to fiscal 2010. The increase is due to additional customers classified as cash receipts as a result of a continued concern for the financial condition of some of our customers. |
Cash receipts revenue decreased by $0.5 million or 8% in fiscal 2010 as compared to fiscal 2009. Although cash receipts as a percentage of revenue increased to 5% in fiscal 2010 as compared to 4% in fiscal 2009, the decrease in cash receipts revenue was due to the decrease in the total revenue in fiscal 2010 as compared to fiscal 2009.
Services revenue decreased by $5.0 million or 14% in fiscal 2011 as compared to fiscal 2010 and $7.1 million or 16% in fiscal 2010 as compared to fiscal 2009. Service revenue as a percentage of total revenue decreased by 7% in fiscal 2011 as compared to fiscal 2010 and remained the same in fiscal 2010 and fiscal 2009. We believe the fluctuations were a result of timing of customers' purchase of training and consulting services.
North America revenue increased 25% in fiscal 2011 as compared to fiscal 2010. The increase was due to the enhanced versions of several existing products gaining initial market acceptance with new and existing key customers.
North America revenue decreased 17% during fiscal 2010 compared to fiscal 2009. The decrease in North American revenue was primarily the result of the global impact of a sharp downturn in the semiconductor industry, a reduced number of design starts, a reduction of electronic design automation budgets and customers experiencing end-market softness in demand.
International revenue decreased by 4% for fiscal 2011 as compared to fiscal 2010. The decrease was due to the acquisition of a customer that generated Up-Front revenue in fiscal 2010, but no revenue in fiscal 2011, as the acquirer is not a customer.
International revenue decreased by 16% for fiscal 2010 compared to fiscal 2009. The decrease in international revenue was primarily the result of the global impact of a sharp downturn in the semiconductor industry, a reduced number of design starts, a reduction of electronic design automation budgets and customers experiencing end-market softness in demand.
No individual customer accounted for 10% or more of total revenue during the fiscal years 2011, 2010 and 2009.
Cost of Revenue
Cost of licenses revenue primarily consists of amortization of acquired developed technology and other intangible assets that are fixed in nature and variable expenses such as royalties, and allocated outside sales representative expenses.
Cost of licenses revenue decreased by $0.9 million or 19% during fiscal 2011, compared to fiscal 2010. Amortization charges related to acquired developed technology and intangible assets decreased during 2011 by $0.7 million as compared to fiscal 2010 primarily due to the complete amortization of intangibles acquired in connection with the acquisition of various companies. In addition, the decrease in the cost of licenses revenue was due to the decrease in third party distributor commissions by $0.2 million.
Cost of licenses revenue decreased by $22.0 million or 83% during fiscal 2010, compared to fiscal 2009. Amortization charges related to acquired developed technology and intangible assets decreased during 2010 by $21.4 million compared to fiscal 2009 primarily due to the complete amortization of intangibles acquired with the Mojave acquisition, which were fully amortized at the end of fiscal 2009. In addition, the decrease in the cost of licenses revenue was due to the decrease in third party distributor commissions by $0.2 million, and a decrease of $0.3 million in costs related to expensed equipment. The remainder of the fluctuation in cost of licenses revenue was accounted for by other individually insignificant items.
38
Cost of services revenue primarily consists of personnel and related costs to provide product support, training and consulting services. Cost of services revenue also includes stock-based compensation expenses and asset depreciation.
Cost of services revenue decreased by $0.3 million or 2% for fiscal 2011 compared to fiscal 2010. The change was primarily due to a net decrease of $0.3 million in the allocation of pre-sale costs (primarily application engineering costs) from sales and marketing costs which were a result of staff reductions under the fiscal 2009 restructuring plan.
Cost of services revenue decreased by $5.8 million or 27% for fiscal 2010 compared to fiscal 2009. The change was primarily due to a net decrease of $5.7 million in the allocation of pre-sale costs (primarily application engineering costs) from sales and marketing costs which were a result of staff reductions under the fiscal 2009 restructuring plan. The remainder of the fluctuation in cost of licenses revenue was accounted for by other individually insignificant items.
Operating expenses
The table below sets forth the fluctuations in operating expenses from fiscal 2010 to fiscal 2011 and from fiscal 2009 to fiscal 2010 (in thousands, except percentage data):
% Change | ||||||||||||||||||
Year Ended: | May1, 2011 | May 2, 2010 | May 3, 2009 | 2011 / 2010 | 2010 / 2009 | |||||||||||||
Operating Expenses | ||||||||||||||||||
Research and development | $ | 49,895 | $ | 47,024 | $ | 68,751 | 6 | % | (32 | )% | ||||||||
Sales and marketing | 44,625 | 41,247 | 56,024 | 8 | % | (26 | )% | |||||||||||
General and administrative | 18,642 | 18,214 | 24,307 | 2 | % | (25 | )% | |||||||||||
Impairment of goodwill | — | — | 60,089 | — | % | (100 | )% | |||||||||||
Amortization of intangible assets | 1,055 | 1,134 | 2,994 | (7 | )% | (62 | )% | |||||||||||
Restructuring charge | 1,200 | 2,730 | 10,661 | (56 | )% | (74 | )% | |||||||||||
Total operating expenses | $ | 115,417 | $ | 110,349 | $ | 222,826 | 5 | % | (50 | )% | ||||||||
Percent of total revenue | ||||||||||||||||||
Research and development | 36 | % | 38 | % | 47 | % | ||||||||||||
Sales and marketing | 32 | % | 34 | % | 38 | % | ||||||||||||
General and administrative | 13 | % | 15 | % | 17 | % | ||||||||||||
Impairment of goodwill | — | % | — | % | 41 | % | ||||||||||||
Amortization of intangible assets | 1 | % | 1 | % | 2 | % | ||||||||||||
Restructuring charge | 1 | % | 2 | % | 7 | % | ||||||||||||
Total operating expenses | 83 | % | 90 | % | 152 | % | ||||||||||||
• | Research and development expense increased by $2.9 million or 6% in fiscal 2011 as compared to fiscal 2010 primarily due to an increase in employee compensation expense by $3.2 million as a result of salary restorations implemented at the beginning of the fiscal year. The increase in research and development expense in fiscal 2011 was also attributable to an increase in travel and entertainment costs of $0.3 million and an increase in consulting expenses by $0.4 million. The above increases were offset by a decrease in the allocations of common expenses, such as information technology and facility related expenses of $1.1 million. |
Research and development expense decreased by $21.7 million in fiscal 2010 as compared to fiscal 2009 primarily due to a decrease in employee compensation expense and the related benefits by $12.9 million as a result of lower headcount and employee salary reductions implemented mid-year in fiscal 2009. The decrease in research and development expense in fiscal 2010 was also attributable to a decrease in travel and entertainment costs of $0.4 million, a decrease in software maintenance costs of $0.3 million due to the maintenance costs being fully amortized, a decrease in consulting costs of $1.5 million, a decrease in the stock-based compensation expense by $2.8 million and a decrease in the allocations of common expenses, such as information technology and facility related expenses, of $3.6 million.
• | Sales and marketing expense increased by $3.4 million or 8% in fiscal 2011 as compared to fiscal 2010 primarily due to an increase in compensation expense and related benefits of $3.6 million as a result salary restorations implemented at the beginning of fiscal 2011. The increase is also attributable to an increase in travel and entertainment expense of $0.9 million, an increase in marketing expense of $0.3 million and an increase in bad debt expense of $0.1 million. The increases were offset by a decrease in the allocation of common expenses, such as information technology and facility related expenses, of $0.9 million, a decrease in consulting expense of $0.3 million and a decrease in commission expense |
39
of $0.4 million.
Sales and marketing expense decreased by $14.8 million in fiscal 2010 as compared to fiscal 2009 primarily due to a decrease in compensation expense and related benefits of $12.4 million as a result of lower headcount and employee salary reductions implemented mid-year in fiscal 2009. The decrease in sales and marketing expense in fiscal 2010 was also attributable to a decrease in travel expenses of $1.1 million, a decrease in commission expenses of $0.7 million, a $0.9 million decrease in bad debt expense, a decrease in the stock-based compensation of $1.3 million, a decrease in marketing related activities of $1.0 million and a decrease in the allocation of common expenses, such as information technology and facility related expenses of $2.9 million. The decrease in sales and marketing expense was offset by a decrease in the allocation of pre-sale costs (primarily application engineering costs) to cost of services revenue of $5.7 million.
• | General and administrative expense increased by $0.4 million or 2% in fiscal 2011 compared to fiscal 2010 primarily due to an increase in compensation expense and the related benefits of $1.3 million and an increase in legal fee by $0.4 million. The increases were offset by decrease of $0.6 million in consulting fees and a $0.6 million decrease in deferred stock-based compensation. The remaining decreases were due to a decrease in other discretionary operating expenses. |
General and administrative expense decreased by $6.1 million in fiscal 2010 compared to fiscal 2009 primarily due to a decrease in compensation expense and the related benefits of $2.9 million, a decrease of $0.5 million in legal fees due to settlement of the derivative lawsuit, a decrease of $1.2 million in stock-based compensation expense due to our option exchange program, and a decrease of $1.2 million in consulting expense due to our cost reduction efforts. The remaining decreases were due to a decrease in other discretionary operating expenses.
Subsequent to year end, we began an investigation, overseen by the Audit Committee of the Board of Directors, of whistleblower allegations related to business expense reimbursements, executive and other employee compensation, and restructuring costs. The investigation was concluded in the first quarter of fiscal 2012. As further discussed in Item 9A, Controls and Procedures, of this Form 10-K, certain deficiencies in our internal control over financial reporting (as defined in Exchange Act Rule 13a-15(f)) were revealed. In conducting the investigation, we incurred legal and administrative costs, currently estimated to be between $1.6 million and $1.8 million, which will be included in general and administrative expense in the first quarter of fiscal 2012.
• | Amortization of intangible assets decreased by 7% in fiscal 2011 compared to fiscal 2010 and 62% in fiscal 2010 compared to fiscal 2009, primarily, for both periods, due to several existing developed technologies and patents having been fully amortized. |
The intangible assets amortized include licensed technology, customer relationship or base, patents, customer contracts, assembled workforces, no shop rights, non-competition agreements and trademarks that were identified in the purchase price allocation for each business combination and asset purchase transaction.
• | Restructuring charge of $1.2 million in fiscal 2011 represents the charges related to payments and adjustments made to the previously estimated amounts for discontinued purchased software and severance related to our continued realignment of business objectives and adjustments to our previously determined restructuring estimates. The discontinued purchased software refers to the Company's legacy customer relationship management tool ("CRM tool"), which the Company is contractually obligated to license through January 30, 2012. Management determined the CRM tool was no longer providing any economic benefit. Because the Company was still liable for the final payment on the contract, management recorded a restructuring liability and a restructuring expense of $0.7 million during fiscal 2011. |
Restructuring costs of $2.7 million in fiscal 2010 represents the charges related to our continued realignment of business objectives and adjustments to our previously determined restructuring estimates.
Restructuring costs of $10.7 million in fiscal 2009 represents employee termination and facility consolidation and closure charges resulting from our realignment to current business objectives.
Other items
The table below sets forth the fluctuations in other items from fiscal 2010 to fiscal 2011 and from fiscal 2009 to fiscal 2010 (in thousands, except percentage data):
40
% Change | ||||||||||||||||||
Year Ended: | May1, 2011 | May 2, 2010 | May 3, 2009 | 2011 / 2010 | 2010 / 2009 | |||||||||||||
Operating income (expense), net | ||||||||||||||||||
Interest income | $ | 137 | $ | 256 | $ | 637 | (46 | )% | (60 | )% | ||||||||
Interest and amortization of debt discount/ premium | (2,342 | ) | (4,397 | ) | (4,357 | ) | (47 | )% | 1 | % | ||||||||
Valuation gain (loss), net | 38 | 404 | (442 | ) | (91 | )% | (191 | )% | ||||||||||
Loss on extinguishment of debt, notes due in 2014 | (2,093 | ) | — | — | 100 | % | — | % | ||||||||||
Inducement fees on conversion of notes due in 2014 | (2,256 | ) | — | — | 100 | % | — | % | ||||||||||
Other income (expense), net | (315 | ) | 1,486 | (118 | ) | (121 | )% | (1,359 | )% | |||||||||
Total other income (expense), net | $ | (6,831 | ) | $ | (2,251 | ) | $ | (4,280 | ) | 203 | % | (47 | )% | |||||
Benefit from (provision for) income taxes | $ | (857 | ) | $ | 6,742 | $ | (764 | ) | (113 | )% | (982 | )% | ||||||
• | Interest income decreased by 46% in fiscal 2011 compared to fiscal 2010 primarily due to lower interest rates in fiscal 2010 on investments. |
Interest income decreased by 60% in fiscal 2010 compared to fiscal 2009 primarily due to lower interest rates in fiscal 2010 on investments.
• | Interest expense primarily represents amortization of debt premium and issuance costs in connection with the 2014 Notes, interest on our term debt and interest on the 2014 Notes. |
Interest expense decreased in fiscal 2011 compared to fiscal 2010 by $2.1 million. The decrease in the interest expense was due to a decrease in the debt discount and issuance costs by $1.5 million. In the prior year, the expense related to the amortization of debt discount and issuance costs related to the 2010 Notes whereas in fiscal 2011, the amortization related to debt issuance costs of the 2014 Notes which was offset by the amortization of the debt premium on the 2014 Notes. The decrease is also attributable to a decrease of $1.0 million of interest on the 2014 Notes due to a reduction in the Notes. During fiscal 2011 we repurchased $2.75 million of the 2014 Notes and converted $20.7 million of the 2014 Notes into common stock. The above decreases were offset by an increase in the interest expense on the term debt by $0.5 million due to additional term debt of $10.0 million in fiscal 2011 from Wells Fargo Capital, LLC.
Interest expense increased in fiscal 2010 compared to fiscal 2009 primarily due to an additional $0.1 million interest expense related to the line of credit facility, $0.7 million increase in the interest expense on the 2014 Notes due to the 2014 Notes having a higher interest rate as compared to the Company's 2% Convertible Senior Notes due 2010 (the “2010 Notes”). The above was offset by a decrease of $0.7 million on the debt discount/premium amortization related to the 2010 Notes net of amortization of premium related to the 2014 Notes.
• | Valuation gain, net represented a net gain of $38,000 in fiscal 2011. See the discussion in Note 3“Fair Value of Financial Instruments”, included in our consolidated financial statements. |
Valuation gain (loss), net increased by $0.8 million in fiscal 2010 as compared to fiscal 2009 primarily due to the recognition of a gain of $1.8 million on the ARS securities offset by a loss on put option of $1.4 million in fiscal 2010 as compared to a fiscal 2009 gain of $0.3 million on the ARS securities offset by a loss of $0.7 million on the put option on the ARS securities.
• | Loss on extinguishment of debt, notes due 2014 represents the loss incurred on the repurchase of $2.75 million of aggregate principal amount of the 2014 Notes for $4.8 million during the first fiscal quarter of 2011. |
• | Inducement fees on conversion of notes due in 2014 represents the fees incurred on the conversion of $20.7 million of aggregate principal amount of the 2014 Notes into 11.5 million shares of common stock during the second fiscal quarter of 2011. |
• | Other income (expense), net decreased by $1.8 million in fiscal 2011 as compared to fiscal 2010. The decrease was mainly due to the decrease in the gain on the sale of strategic investments. In fiscal 2011, we sold our investment in AutoESL, Inc for a gain of $0.9 million, whereas, in fiscal 2010 we sold our investment in Zerosoft, Inc for a gain of $3.2 million, which was offset by $0.3 million of losses of our proportionate investment in other strategic investments. |
Other income (expense), net increased by $1.6 million in fiscal 2010 as compared to fiscal 2009 due to an increase in the foreign exchange gain by $1.2 million, a gain on sale of strategic investment, net of losses, of $2.9 million and a gain of $0.3 million on extinguishment of debt. The increase was offset by an increase in the unrealized foreign exchange loss of $2.8 million.
41
• | Benefit from (provision for) income taxes. Our effective tax (provision) benefit rate was (35.6)%, 66.9%, and (0.6)% in the fiscal years ended May1, 2011, May 2, 2010, and May 3, 2009, respectively. Our effective tax rates vary from the U.S. statutory rate primarily due to changes in our U.S. valuation allowance, goodwill impairment, state taxes, foreign income taxed at other than U.S. rates, stock compensation expenses, research and development tax credits, reserves for uncertain tax positions, and foreign withholding taxes for which no U.S. tax benefits were received due to our full U.S. valuation allowance. Worldwide income tax (expense) benefit was $(0.9) million, $6.7 million, and $(0.8) million in fiscal years ended May1, 2011, May 2, 2010 and May 3, 2009, respectively. The results for the fiscal year ended May 2, 2010 include a $7.8 million tax benefit related to South Korea withholding tax that was recognized as income during the second quarter ended November 1, 2009. |
During fiscal 2010, we received new information related to the unrecognized tax benefit related to withholding taxes in South Korea. This information was not available to us in previous financial reporting periods and is considered new information for purposes of assessing the Company's uncertain tax positions. We considered this new information collectively with all other information available and concluded that it is more-likely-than-not the licenses revenue sourced in South Korea is not subject to withholding tax, and therefore, that the full amount of the tax position will ultimately be realized. Accordingly, a $7.8 million tax benefit related to South Korean withholding tax was recognized into income, and a corresponding decrease in long term tax liabilities was recorded. The recognition of the tax benefit is a discrete item and does not have any current period or future period cash impact.
We are in a net deferred tax asset position, for which a full valuation allowance has been recorded against our U.S. net deferred tax assets. We will continue to provide a valuation allowance against our U.S. net deferred tax assets until it becomes more likely than not that the deferred tax assets are realizable. We will continue to evaluate the realizability of the deferred tax assets on a quarterly basis.
We are subject to income taxes in the United States and in numerous foreign jurisdictions and, in the ordinary course of business, there are many transactions and calculations where the ultimate tax determination is uncertain. The statute of limitations for adjustments to our historic tax obligations will vary from jurisdiction to jurisdiction. The Company's larger jurisdictions provide a statute of limitations ranging from three to six years. In the U.S., the statute of limitations remains open for fiscal years 2004 and forward. At May1, 2011, we do not anticipate that our total unrecognized tax benefits will significantly change due to any settlement of examination or expiration of statute of limitations within the next twelve months. In addition, we do not believe that the ultimate settlement of these obligations will materially affect our liquidity.
Liquidity and Capital Resources
As of | May1, 2011 | May 2, 2010 | May 3, 2009 | ||||||||
Cash, cash equivalents | $ | 47,088 | $ | 57,518 | $ | 32,888 | |||||
Short term investments | — | 16,837 | — | ||||||||
Long term investments | — | — | 17,908 | ||||||||
Cash, cash equivalents, short term and long term investments | $ | 47,088 | $ | 74,355 | $ | 50,796 | |||||
For the year ended: | |||||||||||
Net cash flows provided by (used in) operating activities | $ | 13,550 | $ | 16,004 | $ | (5,419 | ) | ||||
Net cash flows provided by (used in) investing activities | $ | 15,231 | $ | 3,745 | $ | (2,415 | ) | ||||
Net cash flows provided by (used in) financing activities | $ | (39,302 | ) | $ | 4,762 | $ | 766 | ||||
As of May1, 2011, our total cash and cash equivalents, was $47.1 million as compared to cash and cash equivalents and short -term investments, excluding restricted cash, of $74.4 million and $50.8 million as of May 2, 2010 and May 3, 2009, respectively. In fiscal 2011 our primary sources of cash consisted of cash from operations, proceeds from our term debt, cash from our sale of ARS securities, sale of strategic investments and proceeds from the issuance of common stock to employees. Our primary uses of cash in fiscal 2011 were repayment of our 2010 Notes, repayment of revolving debt, repurchases of 2014 Notes and repurchases of treasury stock. In fiscal 2010, our primary sources of cash consisted of cash from operations, release of restricted cash related to our line of credit and acquisition related earnouts, sale of a strategic investment, proceeds from term debt and proceeds from the issuance of common stock to employees. Our primary uses of cash in fiscal 2010 were repayment of the revolving note and secured credit line, repayment of lease obligations, payments related to prior acquisitions, and purchases of property and equipment. In fiscal 2009, our primary sources of cash consisted of proceeds from issuance of common stock to employees, cash borrowed under our line of credit and revolving note and proceeds from maturities and sale of investments. Our primary uses of cash in fiscal 2009 consisted of cash used in operating activities, the repurchase of a portion of our Zero Coupon Convertible Subordinated Notes due May 15, 2008, payments related to contingent consideration related to business combination and intangible asset a
42
cquisitions, purchases of property and equipment, setting aside restricted cash for the revolving note and setting aside cash for escrow arrangements pursuant to various business combinations pursuant to their respective agreements.
We have no short-term investments on the consolidated balance sheets as of May 1, 2011. The short term investments on the consolidated balance sheets as at May 2, 2010 consisted of ARS that were AAA rated and were secured by pools of student loans guaranteed by state regulated higher education agencies and reinsured by the U.S. Department of Education and the UBS purchased put option. The ARS investments were classified as long-term investments on the consolidated balance sheet as of May 3, 2009.
Historically, liquidity for investors in ARS was provided via an auction process that reset the applicable interest rate generally every 28 days, allowing investors to either roll over their investments or sell them at par. Beginning in the fourth quarter of fiscal 2008, there was insufficient demand for these types of investments during the auctions and, as a result, these securities became illiquid.
In October 2008, we entered into an agreement with UBS that provided us with Rights to sell our ARS at par value to UBS at any time during the period June 30, 2010 through July 2, 2012. These Rights were a separate freestanding instrument accounted for separately from the ARS, and are registered, nontransferable securities accounted for as a purchased put option initially recorded at fair value. Under the Rights agreement, UBS could, at its discretion, sell the ARS at any time through July 2, 2012 without prior notice to us and must pay us par value for the ARS within one day of the sale transaction settlement. Additionally, UBS offered a “no net cost” secured line of credit to us up to 75% of the market value of the ARS as determined by UBS until June 30, 2010. Due to our entering into this agreement with UBS and enabling UBS to sell the ARS at any time, the ARS previously reported as available-for-sale were transferred to trading securities.
During the first quarter of fiscal 2011, we exercised our put option and liquidated the $16.8 million of ARS and repaid the outstanding $11.2 million secured line of credit to UBS.
As of May 2, 2010, there was insufficient observable market information available to determine the fair value of our ARS.
As of May 2, 2010, we engaged a third party valuation service to model Level 3 fair value using an income approach and two scenarios: one based on a 0.2 year term and no put option, and a second based on a 4.0 year term with a put option. We reviewed the methodologies employed by the third party models. This included a review of all relevant data inputs and the appropriateness of key model assumptions.
The pricing assumptions for the ARS included the coupon rate, the estimated time to liquidity, current market rates for publicly traded student loans of similar credit rating and an adjustment for lack of liquidity. The student loans are AAA rated and are secured by pools of student loans guaranteed by state regulated higher education agencies and reinsured by the U.S. Department of Education, and have maturities ranging from 2031 to 2047. The coupon rate was assumed to equal the stated maximum auction rate being received, which is determined based on the applicable 91-day U.S. Treasury rate plus 1.20% premium according to provisions outlined in each security's agreement. The current estimated time to liquidity was 4.0 years based on (i) expectations from industry brokers for liquidity in the market and (ii) the period over which UBS and other broker-dealers that had issued ARS have agreed to redeem certain ARS at par value.
The purchased put option gave us the right to sell the ARS to UBS for a price equal to par value during the period June 30, 2010 to July 2, 2012, providing liquidity for the ARS sooner than the currently estimated 4.0 years. The fair value of the purchased put option represented the difference between the ARS with an estimated time to liquidity of 4.0 years and the ARS with an estimated time to liquidity of 0.2 year as the purchased put option allowed for the acceleration of liquidity and the avoidance of a below-market coupon rate over the two year time period.
Based on the Level 3 valuation and the transfer of the ARS from the available-for-sale category to the trading category, we recorded an other-than-temporary loss of $2.8 million in valuation gain (loss), net in the second quarter of fiscal 2009 including the transfer of accumulated temporary losses of $0.9 million from other comprehensive loss previously recorded as a component of stockholders' equity. For fiscal 2009, the total loss on the ARS, including the other than temporary loss of $0.3 million, was reported in the valuation gain (loss), net in the consolidated statement of operations, this loss was offset by gains related to the purchase put option of $0.7 million. For the fiscal 2010, we recorded an unrealized gain on the ARS of $1.8 million offset by losses related to the purchased put option of $1.4 million. For fiscal 2011, we recorded a gain of $38,000 on liquidation of the ARS securities.
Net cash provided by/used in operating activities
Net cash provided by operating activities decreased by $2.5 million in fiscal 2011 compared to fiscal 2010. The decrease was primarily due to an increase in cost and expenses of $0.4 million, a decrease in cash from customers of $7.6 million, a decrease in prepaid and other assets of $1.0 million and a decrease in accrued liabilities by $1.8 million; offset by an increase in long term liabilities of $7.4 million. The decrease in cash from customers was a decrease in accounts receivable collection offset by an increase in deferred revenue due to a difference in the timing of invoices being issued and revenue recognition; while cost and expenses increased due to salary restorations implemented at the beginning of fiscal 2011. Research and Development costs
43
increased from $47.0 million in fiscal 2010 to $49.9 million in fiscal 2011. Sales and Marketing costs increased from $41.2 million in fiscal 2010 to $44.6 million in fiscal 2011 and General and Administration expenses increased from $18.2 million in fiscal 2010 to $18.6 million in fiscal 2011.
Net cash provided by operating activities increased by $21.4 million in fiscal 2010 compared to fiscal 2009. The increase was primarily due to a decrease in cost and expenses of $22.4 million, a decrease in the use of cash for accounts payable and accrued liabilities of $21.2 million, and a decrease in prepaid expenses of $0.8 million, offset by an increase in cash from customers of $14.7 million and an increase in long term liabilities of $8.3 million. Cost and expenses decreased due to the reduction in force and the closure of various facilities as part of our fiscal 2009 restructuring plan. The decrease in the use of cash for accounts payable, accrued liabilities and prepaid expenses was mainly due to the reduction in costs and expenses in fiscal 2010 as compared to fiscal 2009.
Net cash provided by/used in investing activities
Net cash provided by investing activities increased by $11.5 million in fiscal 2011 as compared to fiscal 2010. The increase was primarily due to the increase in cash received from the exercise of the purchased put option related to the ARS securities of $15.4 million and decrease of $1.0 million with respect to acquisition related earnouts, offset by a decrease in proceeds received from the sale of strategic investments by $3.0 million, decrease due to release of restricted cash by $1.5 million and purchase of equipment of $0.4 million.
Net cash provided by investing activities increased by $6.2 million in fiscal 2010 as compared to fiscal 2009. The increase was due to the sale of our investment in a privately held technology company for business and strategic purposes (net of additional investments) by $6.4 million, the release of $1.5 million of restricted cash related to acquisition related earnouts and a decrease in acquisition related earnouts by $2.5 million. The above decreases were offset by an increase of $0.7 million in purchases of property and equipment and a decrease of $3.5 million in proceeds from sale of investments.
We expect to make capital expenditures of approximately $5.0 million to $6.0 million during fiscal 2012. These capital expenditures will be used to support selling, marketing and product development activities. We will use capital lease financing as well as our cash and cash equivalents to fund these purchases. In addition, we may make earnout payments related to prior acquisitions and acquire additional technologies and strategic equity investments in the future using our cash and cash equivalents.
Net cash provided by/ used in financing activities
Net cash used in financing activities increased by $44.0 million in fiscal 2011 as compared to fiscal 2010. During fiscal 2011 we paid $23.2 million of the remaining principal balance of the 2010 Notes. We also used $9.9 million to repay the UBS secured credit line and for the reduction in the amount received in term debt (net of payments) by $7.9 million. In addition the release of restricted cash of $7.2 million, decrease due to our purchase of treasury stock by $5.3 million and decrease due to repurchase of 2014 Notes for $4.8 million. The above decreases were offset by repayment of $12.2 million for revolving note in 2010 and increase in the proceeds received from the exercise of stock options of $1.8 million.
Net cash provided by financing activities increased by $4.0 million in fiscal 2010 as compared to fiscal 2009. The primary source of cash was cash drawn against the term debt with Wells Fargo for $15.0 million, the release of restricted cash of $7.5 million maintained for the Wells Fargo Line of Credit, and proceeds from exercise of common stock for $2.2 million. We used $12.2 million for repayment of line of credit from Wells Fargo, repayment of lease obligations of $2.6 million, and issuance costs of $1.9 million for the 2014 Notes and $0.8 million issuance costs related to the term debt from Wells Fargo.
Capital resources
Cash and cash equivalents available for use aggregated a total of $47.1 million at May1, 2011. We also have $13.0 million available for borrowing under our revolving note with Wells Fargo Capital Finance, LLC as described below.
We believe that our existing cash and cash equivalents, our available borrowing and our operating cash flows will be sufficient to repay the current portion of the quarterly Term Loan A (as defined below) and Term Loan B (as defined below) installments of $0.6 million and $0.4 million per quarter, respectively, and to meet our anticipated operating and working capital requirements and fund our capital investments in the ordinary course of business for at least the next 12 months.
During the first quarter of fiscal 2011, we exercised our purchased put option on the ARS and liquidated the $16.9 million of ARS with UBS and used the proceeds to pay the $11.2 million UBS secured credit line.
In recent years, we have funded our operations primarily through operating cash flows and through the issuance of convertible debt and equity securities. In the first quarter of fiscal 2009, we began implementing cost reduction measures that continued through the end of fiscal 2011. While we were successful in refinancing our debt during fiscal 2011 and fiscal 2010, given the uncertain economic conditions generally, and in the semiconductor industry, capital and credit markets in particular, we have increased our focus on cash management and identifying and taking actions to sustain and enhance our liquidity position. In addition to the actions taken to reduce our level of outstanding indebtedness as further described below, these actions include
44
operational expense reduction initiatives and re-timing or eliminating certain capital spending or research and development projects. As a result of these efforts and other factors, we generated positive cash flow of $13.6 million and $16.0 million from operations in fiscal 2011 and fiscal 2010, respectively.
Our ability to fund our cash needs over the short and long term will depend on our ability to continue to generate cash from operations, which is subject to general economic and financial market conditions, competition, maintaining our existing credit facility and other factors. If we are unable to generate sufficient cash from operations for these purposes, we may be required to access the capital and credits markets for additional liquidity, and we cannot guarantee that we will be able to do so on satisfactory terms or at all. In particular, continued concerns about the global financial and banking system, systemic impact of inflation (or deflation), energy costs, geopolitical issues, the availability and cost of credit, the U.S. mortgage market and a declining real estate market in the U.S. have contributed to continued uncertainty for the global economy generally. If these market conditions continue, the availability and cost of credit may be adversely affected and we may be unable, or limited in our ability, to access the capital markets to meet our liquidity needs, resulting in an adverse impact on our financial position and results of operations.
However, any of these factors could have a materially adverse impact on our financial position and results of operations. For a complete discussion of the risks facing our business, including our liquidity, please see Part II, Item 1A, “Risk Factors.”
Revolving Loans and Term Debt
On March 19, 2010, we entered into a new four-year credit facility with Wells Fargo Capital Finance, LLC as amended, (the “New Credit Facility”), which replaced our previous $15.0 million secured revolving line of credit facility with Wells Fargo Bank, N.A. (the “Credit Facility”). The New Credit Facility provides for a revolving loan not to exceed $15.0 million and a term loan of $15.0 million (“Term Loan A”). The New Credit Facility is secured by a first priority interest in all of our assets. The Term Loan A repayments are in equal quarterly installments of $0.6 million, beginning October 31, 2010.
We subsequently executed three amendments in order to clarify certain administrative and operational aspects of the New Credit Facility. The amendments were executed in June 2010, July 2010 and September 2010, respectively, and did not materially alter the terms and conditions of the New Credit Facility. In October 2010, we executed a fourth amendment, which expanded the New Credit Facility with an additional term loan of $10.0 million (“Term Loan B”) and extended the maturity date to October 2014. The repayments of Term Loan B principal amounts are in equal installments of $0.4 million beginning April 30, 2011.
Under the terms of the New Credit Facility, outstanding borrowings and letter of credit liabilities may not, at any time, exceed the greater of $40.0 million or 50% of all “post-contract support” revenues and “time based license fee” revenues for the preceding twelve-month period. These requirements could, but to date have not, limited our borrowing availability.
The revolving loan and Term Loan A bear interest at either a LIBOR Rate or a Base Rate, at management's election, in each case determined as follows (plus a margin of 4.50 percentage points): (A) if at a LIBOR Rate, at a per annum rate equal to the LIBOR Rate of the greater of (i) 1.00% per annum and (ii) the one, two or three month LIBOR rate quoted by Bloomberg and (B) if at the Base Rate, the greatest of (i) the Federal Funds Rate plus 0.5%, (ii) the three month LIBOR Rate plus 1.0% and (iii) the Wells Fargo prime rate. Term Loan B bears interest at either a LIBOR Rate or a Base Rate, at management's election, in each case determined as follows (plus a margin of 3.00 percentage points): (A) if at a LIBOR Rate, at a per annum rate equal to the LIBOR Rate of the greater of (i) 1.00% per annum or (ii) the one, two or three month LIBOR rate quoted by Bloomberg and (B) if at the Base Rate the greatest of (i) the Federal Funds Rate plus 0.5%, (ii) the three month LIBOR Rate plus 1.0% and (iii) the Wells Fargo prime rate. In addition, we are required to pay fees of 0.5% per annum on the unused amount of the New Credit Facility, and 2.5% per annum for each letter of credit issued and quarterly administrative fees of $10,000.
We are required to pay interest and fees monthly, with the outstanding principal amount plus all accrued but unpaid interest and fees payable in full at the maturity date of October 29, 2014.
The proceeds of the New Credit Facility have been used to refinance some of our existing indebtedness, including repayment of the Credit Facility and a portion of our 2010 Notes, and to finance general corporate purposes, including permitted acquisitions and permitted investments, capital expenditures, working capital, letters of credit, and fees and expenses associated with the New Credit Facility.
The New Credit Facility contains covenants that, among other things, limit our ability to create liens, merge, consolidate, dispose of assets, incur indebtedness and guarantees, repurchase or redeem capital stock and indebtedness, make certain investments, acquisitions and capital expenditures, enter into certain transactions with affiliates or change the nature of our business. Events of default under the New Credit Facility, include, but are not limited to, payment defaults, covenant defaults, breaches of representations and warranties, cross defaults to certain other material agreements and indebtedness, bankruptcy and other insolvency events, actual or asserted invalidity of security interests or loan documents, and certain change of control events.
The New Credit Facility also restricts our ability to pay dividends or make other distributions on our stock and requires that we maintain certain financial conditions. As of May 1, 2011, we had borrowed $25.0 million of term debt and had repaid installments totaling to $1.7 million of Term Loan A and $0.4 million of Term Loan B. As of May 1, 2011, we had $13.0 million in unused
45
revolving loans net of accrued interest of $0.3 million under the New Credit Facility.
As of May1, 2011, we were in compliance with the covenants contained in the New Credit Facility.
Convertible notes
On September 11, 2009, we completed an exchange offer pursuant to which an aggregate principal amount of $26.7 million of our 2010 Notes were exchanged for $26.7 million principal amount of newly issued 2014 Notes. As a result of the exchange, approximately $23.2 million principal amount of the 2010 Notes remained outstanding as of May 2, 2010. On May 15, 2010, we repaid the $23.2 million remaining outstanding balance of the 2010 Notes.
Our 2014 Notes mature on May 15, 2014 and bear interest at 6% per annum, with interest payable on May 15 and November 15 of each year, commencing May 15, 2010. The 2014 Notes are convertible into shares of our common stock at an initial conversion price of $1.80 per share, for an aggregate of approximately 14.83 million shares. Upon conversion, the holders of the 2014 Notes will receive shares of our common stock. The 2014 Notes are unsecured senior indebtedness, which rank equally in right of payment to the New Credit Facility. The 2014 Notes are effectively subordinated in right of payment to the New Credit Facility, to the extent of the security interest held by Wells Fargo Bank in our assets. After May 15, 2013, we have the option to redeem the 2014 Notes for cash in an amount equal to 100% of the aggregate outstanding principal amount at the time of such redemption.
During the first quarter of fiscal 2011, we repurchased $2.75 million aggregate principal amount of the 2014 Notes, representing approximately 10.3% of the previously outstanding aggregate principal amount of the 2014 Notes, in private transactions. These purchases were funded from our working capital.
During the second quarter of fiscal 2011, we engaged in separately negotiated transactions with certain holders of our 2014 Notes. Pursuant to those transactions, the holders converted an aggregate principal amount of $20.7 million of the 2014 Notes, representing 77.5% of the previously outstanding aggregate principal amount, into 11.5 million shares of our common stock. We incurred an inducement fee of $2.3 million on of the 2014 Notes.
As of May1, 2011, approximately $3.25 million of the 2014 Notes remained outstanding and are convertible into approximately 1.80 million shares of our common stock. From time to time, we may enter into additional transactions in the future with respect to the repurchase or conversion of the $3.25 million remaining balance of convertible notes due May 2014 whenever conditions are sufficiently attractive. We will evaluate any such transactions in light of then-existing market conditions, taking into account our current liquidity and prospects for future access to capital. The amounts involved in any such transactions, individually or in the aggregate, may be material.
Repurchases of common stock
Effective January 31, 2011, the Board of Directors approved an increase in the Company's stock buy-back program, authorizing us to purchase up to $30.0 million of our common stock, an increase in $10.0 million over the original authorization of $20.0 million announced in fiscal 2008.
During fiscal 2011, we used approximately $5.3 million to repurchase 1,318,475 shares of our common stock in the open market. The repurchase prices ranged from $2.82 to $5.03 per share. The repurchased shares were retired immediately subsequent to the purchase. During the fourth quarter of fiscal 2011, we did not repurchase any shares of our common stock. As of May 1, 2011 we have $19.7 million remaining available under our stock repurchase program for authorized repurchases of our common stock.
Contractual obligations
As of May1, 2011, our principal contractual obligations are $38.0 million from fiscal 2012 through fiscal 2016. Contractual obligations consist of the operating leases on our office facilities for $4.8 million, $2.6 million in capital lease obligations for computer equipment, $2.8 million of purchase obligations, a term loan of $22.9 million, $1.7 million in letters of credit, and $3.25 million in 2014 Notes. We have no material commitments for capital expenditures and, as a result of the cost reduction plans we initiated in fiscal 2009, we do not anticipate an increase in our capital expenditures and lease commitments. Purchase obligations represent an estimate of all open purchase orders and contractual obligations in the normal course of business for which we have not received the goods or services as of May1, 2011. Although open purchase orders are considered enforceable and legally binding, the terms generally allow us the option to cancel, reschedule and adjust our requirements based on our business needs prior to the delivery of goods or performance of services. In addition, we have other obligations for goods and services entered into in the normal course of business. These obligations, however, are either unenforceable or not legally binding or are subject to change based on our business decisions.
Our acquisition agreements related to certain business combination and asset purchase transactions have obligated us to pay certain contingent cash consideration based on meeting certain financial or project milestones and continued employment of certain employees. As of May1, 2011, we did not have any outstanding contingent cash considerations to be paid under our acquisition agreements. The earnout period on our acquisitions ended March 31, 2011.
46
The table below summarizes our significant contractual obligations at May1, 2011, and the effect such obligations are expected to have on our liquidity and cash flows in future periods (in millions). The operating lease obligations and purchase obligations were not recorded in our consolidated balance sheets as of May1, 2011.
Payment due by period | |||||||||||||||||||
Total | Less Than 1 Year | 1-3 Years | 4-5 Years | After 5 Years | |||||||||||||||
Operating lease obligations | $ | 4.8 | $ | 3.3 | $ | 1.5 | $ | — | $ | — | |||||||||
Capital lease obligations | 2.6 | 1.3 | 1.3 | — | — | ||||||||||||||
Convertible notes | 3.2 | — | — | 3.2 | — | ||||||||||||||
Purchase obligations | 2.8 | 1.9 | 0.9 | — | — | ||||||||||||||
Term Debt | 22.9 | 3.8 | 7.5 | 11.6 | — | ||||||||||||||
Total | $ | 36.3 | $ | 10.3 | $ | 11.2 | $ | 14.8 | $ | — | |||||||||
Income taxes
As of May1, 2011 and May 2, 2010, we recorded unrecognized tax benefits of $20.6 million and $18.4 million, respectively, of which $1.4 million and $1.6 million, respectively, are included in our long-term tax liabilities on our consolidated balance sheet. We are not able to estimate the amount or timing of any cash payments required to settle these liabilities; however, we do not anticipate the settlement of the liabilities will require payment of cash within the next twelve months and do not believe that the ultimate settlement of these obligations will materially affect our liquidity.
Off-balance sheet arrangements
As of May1, 2011, we did not have any “off-balance-sheet arrangements,” as defined in Item 303(a)(4)(ii) of Regulation S-K.
Indemnification Obligations
We enter into standard license agreements in the ordinary course of business. Pursuant to these agreements, we agree to indemnify our customers for losses suffered or incurred by them as a result of any patent, copyright, or other intellectual property infringement claim by any third party with respect to our products. These indemnification obligations continue over the software license period, and are perpetual in some instances. Our normal business practice is to limit the maximum amount of indemnification to the amount received from the customer. On occasion, the maximum amount of indemnification we may be required to make may exceed our normal business practices. We estimate the fair value of our indemnification obligations as insignificant, based on our historical experience concerning product and patent infringement claims. Accordingly, we have no liabilities recorded for indemnification under these agreements as of May1, 2011.
We have agreements whereby our officers and directors are indemnified for certain events or occurrences while the officer or director is, or was, serving at our request in such capacity. The maximum potential amount of future payments we could be required to make under these indemnification agreements is unlimited; however, we retain directors and officers insurance that reduces our exposure and enables us to recover portions of amounts paid. As a result of our insurance coverage, we believe the estimated fair value of these indemnification agreements is minimal. Accordingly, no liabilities have been recorded for these agreements as of May1, 2011.
In connection with certain of our recent business acquisitions, we have also agreed to assume, or cause our subsidiaries to assume, the indemnification obligations of those companies to their respective officers and directors. No liabilities have been recorded for these agreements as of May1, 2011.
Warranties
We warrant to our customers that our products will conform to the documentation provided. To date, there have been no payments or material costs incurred related to fulfilling these warranty obligations. Accordingly, we have no liabilities recorded for these warranties as of May1, 2011. We assess the need for a warranty accrual on a quarterly basis, and there can be no guarantee that a warranty accrual will not become necessary in the future.
47
ITEM 7A. | QUANTITATIVE AND QUALITATIVE DISCLOSURES ABOUT MARKET RISK |
Interest Rate Risk
Our exposure to market risk for changes in interest rates relates primarily to our investment portfolio. The primary objective of our investment activities is to preserve principal while maximizing yields without significantly increasing risk. This is accomplished by investing in widely diversified short-term and long-term investments, consisting primarily of investment grade securities. As of May1, 2011, a hypothetical 100 basis point increase in interest rates would not result in a material impact on the fair value of our cash equivalents and short-term investments.
The fair value of our fixed rate long-term debt is sensitive to interest rate changes. Interest rate changes would result in increases or decreases in the fair value of our debt, due to differences between market interest rates and rates in effect at the inception of our debt obligation. Changes in the fair value of our fixed rate debt have no impact on our cash flows or consolidated financial statements.
Credit Risk
Financial instruments that potentially subject the Company to concentrations of credit risk consist principally of cash, cash equivalents, short-term investments and accounts receivable. The Company's cash, cash equivalents and short-term investments generally consist of government agencies, municipal obligations and money market funds with high-quality financial institutions. Accounts receivable are typically unsecured and are derived from license and service sales. The Company performs ongoing credit evaluations of its customers and maintains allowances for doubtful accounts.
Foreign Currency Exchange Rate Risk
A majority of our revenue, expense, and capital purchasing activities are transacted in U.S. dollars. However, we transact some portions of our business in various foreign currencies, primarily related to a portion of revenue in Japan and operating expenses in Europe, Japan and Asia-Pacific. Accordingly, we are subject to exposure from adverse movements in foreign currency exchange rates. As of May1, 2011, we had approximately $5.5 million of cash and money market funds in foreign currencies. We entered into foreign currency forward contracts to mitigate exposure in movements between the U.S. dollar and Japanese yen and U.S. dollar and Indian rupee. The derivatives do not qualify for hedge accounting treatment. We recognize the gain and loss on foreign currency forward contracts in the same period as the remeasurement loss and gain of the related foreign currency-denominated exposures. In fiscal 2011 and 2010, net foreign exchange loss totaled $1.2 million and $1.4 million, respectively, and was included in “Other (expense), net” in our consolidated statements of operations.
48
ITEM 8. | FINANCIAL STATEMENTS AND SUPPLEMENTARY DATA |
MAGMA DESIGN AUTOMATION, INC. AND SUBSIDIARIES
Index to Consolidated Financial Statements and Financial Statement Schedules
Page | |
Consolidated Financial Statements: | |
Supplementary Financial Data: | |
Financial Statement Schedules: | |
49
REPORT OF INDEPENDENT REGISTERED PUBLIC ACCOUNTING FIRM
Board of Directors and Stockholders
Magma Design Automation, Inc.
We have audited the accompanying consolidated balance sheets of Magma Design Automation, Inc. (a Delaware corporation) and subsidiaries (the “Company”) as of May 1, 2011 and May 2, 2010, and the related consolidated statements of operations, stockholders' equity (deficit) and comprehensive income (loss), and cash flows for each of the three years in the period ended May 1, 2011. Our audits of the basic financial statements included the financial statement schedules listed in the index appearing under Item 15(a)(2). These financial statements and financial statement schedules are the responsibility of the Company's management. Our responsibility is to express an opinion on these financial statements and financial statement schedules based on our audits.
We conducted our audits in accordance with the standards of the Public Company Accounting Oversight Board (United States). Those standards require that we plan and perform the audit to obtain reasonable assurance about whether the financial statements are free of material misstatement. An audit includes examining, on a test basis, evidence supporting the amounts and disclosures in the financial statements. An audit also includes assessing the accounting principles used and significant estimates made by management, as well as evaluating the overall financial statement presentation. We believe that our audits provide a reasonable basis for our opinion.
In our opinion, the consolidated financial statements referred to above present fairly, in all material respects, the financial position of Magma Design Automation, Inc. and subsidiaries as of May 1, 2011 and May 2, 2010, and the results of their operations and their cash flows for each of the three years in the period ended May 1, 2011 in conformity with accounting principles generally accepted in the United States of America. Also in our opinion, the related financial statement schedules, when considered in relation to the basic consolidated financial statements taken as a whole, presents fairly, in all material respects, the information set forth therein.
We also have audited, in accordance with the standards of the Public Company Accounting Oversight Board (United States), the Company's internal control over financial reporting as of May 1, 2011, based on criteria established in Internal Control-Integrated Framework issued by the Committee of Sponsoring Organizations of the Treadway Commission (COSO) and our report dated July 14, 2011, expressed an unqualified opinion on the effectiveness of the Company's internal control over financial reporting.
/S/ GRANT THORNTON LLP
San Francisco, California
July 14, 2011
50
REPORT OF INDEPENDENT REGISTERED PUBLIC ACCOUNTING FIRM
Board of Directors and Stockholders
Magma Design Automation, Inc.
We have audited Magma Design Automation, Inc. and subsidiaries' (a Delaware Corporation) internal control over financial reporting as of May 1, 2011, based on criteria established in Internal Control-Integrated Framework issued by the Committee of Sponsoring Organizations of the Treadway Commission (COSO). Magma Design Automation, Inc.'s management is responsible for maintaining effective internal control over financial reporting and for its assessment of the effectiveness of internal control over financial reporting, included in the accompanying Management's Report on Internal Control over Financial Reporting. Our responsibility is to express an opinion on Magma Design Automation Inc.'s internal control over financial reporting based on our audit.
We conducted our audit in accordance with the standards of the Public Company Accounting Oversight Board (United States). Those standards require that we plan and perform the audit to obtain reasonable assurance about whether effective internal control over financial reporting was maintained in all material respects. Our audit included obtaining an understanding of internal control over financial reporting, assessing the risk that a material weakness exists, testing and evaluating the design and operating effectiveness of internal control based on the assessed risk, and performing such other procedures as we considered necessary in the circumstances. We believe that our audit provides a reasonable basis for our opinion.
A company's internal control over financial reporting is a process designed to provide reasonable assurance regarding the reliability of financial reporting and the preparation of financial statements for external purposes in accordance with generally accepted accounting principles. A company's internal control over financial reporting includes those policies and procedures that (1) pertain to the maintenance of records that, in reasonable detail, accurately and fairly reflect the transactions and dispositions of the assets of the company; (2) provide reasonable assurance that transactions are recorded as necessary to permit preparation of financial statements in accordance with generally accepted accounting principles, and that receipts and expenditures of the company are being made only in accordance with authorizations of management and directors of the company; and (3) provide reasonable assurance regarding prevention or timely detection of unauthorized acquisition, use, or disposition of the company's assets that could have a material effect on the financial statements.
Because of its inherent limitations, internal control over financial reporting may not prevent or detect misstatements. Also, projections of any evaluation of effectiveness to future periods are subject to the risk that controls may become inadequate because of changes in conditions, or that the degree of compliance with the policies or procedures may deteriorate.
In our opinion, Magma Design Automation, Inc. and subsidiaries maintained, in all material respects, effective internal control over financial reporting as of May 1, 2011, based on criteria established in Internal Control-Integrated Framework issued by COSO.
We also have audited, in accordance with the standards of the Public Company Accounting Oversight Board (United States), the consolidated balance sheets of Magma Design Automation, Inc. and subsidiaries as of May 1, 2011 and May 2, 2010 and the related consolidated statements of operations, stockholders' equity (deficit) and comprehensive income (loss), and cash flows for each of the three years in the period ended May 1, 2011. Our audits of the basic financial statements included the financial statement schedules listed in the index appearing under Item 15(a)(2). Our report dated July 14, 2011 expressed an unqualified opinion on those financial statements and financial statement schedules.
/S/ GRANT THORNTON LLP
San Francisco, California
July 14, 2011
51
MAGMA DESIGN AUTOMATION, INC. AND SUBSIDIARIES
CONSOLIDATED BALANCE SHEETS
(in thousands, except share data)
May1, 2011 | May 2, 2010 | ||||||
ASSETS | |||||||
Current assets: | |||||||
Cash and cash equivalents | $ | 47,088 | $ | 57,518 | |||
Restricted cash | — | 250 | |||||
Short-term investments, pledged as collateral for secured credit line | — | 16,837 | |||||
Accounts receivable, net including receivable from related parties $2,181 and $1,667 at May 1, 2011 and May 2, 2010 | 35,530 | 17,401 | |||||
Prepaid expenses and other current assets | 3,915 | 4,472 | |||||
Total current assets | 86,533 | 96,478 | |||||
Property and equipment, net | 6,066 | 5,979 | |||||
Intangible assets, net | 3,691 | 7,487 | |||||
Goodwill | 7,415 | 7,093 | |||||
Other assets | 2,767 | 5,086 | |||||
Total assets | $ | 106,472 | $ | 122,123 | |||
LIABILITIES AND STOCKHOLDERS' EQUITY (DEFICIT) | |||||||
Current liabilities: | |||||||
Accounts payable | $ | 3,697 | $ | 2,220 | |||
Accrued expenses | 14,160 | 16,347 | |||||
Secured credit line | — | 11,162 | |||||
Current portion of term debt | 3,750 | 1,688 | |||||
Current portion of other long-term liabilities | 1,199 | 1,901 | |||||
Deferred revenue | 34,390 | 25,528 | |||||
Convertible notes, net of debt discount of $44 at May 2, 2010 | — | 23,206 | |||||
Total current liabilities | 57,196 | 82,052 | |||||
Convertible notes, including (premium) of ($145) and ($1,574) at May 1, 2011 and May 2, 2010, respectively | 3,395 | 28,263 | |||||
Long-term portion of term debt | 19,188 | 13,312 | |||||
Long-term tax liabilities | 1,703 | 1,856 | |||||
Other long-term liabilities | 1,270 | 922 | |||||
Total liabilities | 82,752 | 126,405 | |||||
Commitments and contingencies (Note 15) | |||||||
Stockholders' equity (deficit): | |||||||
Common stock (par value $0.0001, 150,000,000 shares authorized; 70,099,670 and 67,062,656 shares issued and outstanding, respectively, at May 1, 2011 and 55,025,286 and 51,988,272 shares issued and outstanding, respectively, at May 2, 2010) | 7 | 6 | |||||
Additional paid-in capital | 447,328 | 417,131 | |||||
Accumulated deficit | (387,087 | ) | (383,824 | ) | |||
Treasury stock at cost (3,037,014 shares at May 1, 2011 and May 2, 2010, respectively) | (32,615 | ) | (32,615 | ) | |||
Accumulated other comprehensive loss | (3,913 | ) | (4,980 | ) | |||
Total stockholders' equity (deficit) | 23,720 | (4,282 | ) | ||||
Total liabilities and stockholders' equity (deficit) | $ | 106,472 | $ | 122,123 | |||
52
MAGMA DESIGN AUTOMATION, INC. AND SUBSIDIARIES
CONSOLIDATED STATEMENTS OF OPERATIONS
(in thousands, except per share data)
Fiscal Year Ended | |||||||||||
May1, 2011 | May 2, 2010 | May 3, 2009 | |||||||||
Revenue: | |||||||||||
Licenses | $ | 86,896 | $ | 62,225 | $ | 76,474 | |||||
Bundled licenses and services | 27,278 | 31,600 | 33,431 | ||||||||
Services | 25,112 | 29,252 | 37,052 | ||||||||
Total revenue | 139,286 | 123,077 | 146,957 | ||||||||
Cost of revenue: | |||||||||||
Licenses | 2,863 | 3,142 | 19,416 | ||||||||
Bundled licenses and services | 3,634 | 4,282 | 10,459 | ||||||||
Services | 12,946 | 13,129 | 18,454 | ||||||||
Total cost of revenue | 19,443 | 20,553 | 48,329 | ||||||||
Gross profit | 119,843 | 102,524 | 98,628 | ||||||||
Operating expenses: | |||||||||||
Research and development | 49,895 | 47,024 | 68,751 | ||||||||
Sales and marketing | 44,625 | 41,247 | 56,024 | ||||||||
General and administrative | 18,642 | 18,214 | 24,307 | ||||||||
Impairment of goodwill | — | — | 60,089 | ||||||||
Amortization of intangible assets | 1,055 | 1,134 | 2,994 | ||||||||
Restructuring charge | 1,200 | 2,730 | 10,661 | ||||||||
Total operating expenses | 115,417 | 110,349 | 222,826 | ||||||||
Operating income (loss) | 4,426 | (7,825 | ) | (124,198 | ) | ||||||
Other income (expense): | |||||||||||
Interest income | 137 | 256 | 637 | ||||||||
Interest and amortization of debt discount/ premium | (2,342 | ) | (4,397 | ) | (4,357 | ) | |||||
Valuation gain (loss), net | 38 | 404 | (442 | ) | |||||||
Loss on extinguishment of debt, notes due in 2014 | (2,093 | ) | — | — | |||||||
Inducement fees on conversion of notes due in 2014 | (2,256 | ) | — | — | |||||||
Other income (expense), net | (315 | ) | 1,486 | (118 | ) | ||||||
Other, net | (6,831 | ) | (2,251 | ) | (4,280 | ) | |||||
Net loss before income taxes | (2,405 | ) | (10,076 | ) | (128,478 | ) | |||||
Benefit from (provision for) income taxes | (857 | ) | 6,742 | (764 | ) | ||||||
Net loss | $ | (3,262 | ) | $ | (3,334 | ) | $ | (129,242 | ) | ||
Net loss per share, basic and diluted | $ | (0.05 | ) | $ | (0.07 | ) | $ | (2.89 | ) | ||
Shares used in per share calculation, basic and diluted | 61,343 | 49,639 | 44,698 | ||||||||
The accompanying notes are an integral part of these consolidated financial statements.
53
MAGMA DESIGN AUTOMATION, INC. AND SUBSIDIARIES
CONSOLIDATED STATEMENTS OF STOCKHOLDERS' EQUITY (DEFICIT) AND COMPREHENSIVE INCOME (LOSS)
(in thousands, except for shares)
The accompanying notes are an integral part of these consolidated financial statements.
Common Stock | Additional Paid-in Capital | Accumulated Deficit | Treasury Stock | Accumulated Other Comprehensive Income (Loss) | Total Stockholders' Equity (Deficit) | Comprehensive Loss | |||||||||||||||||||
Shares | Amount | Shares | Amount | ||||||||||||||||||||||
BALANCES AT May 4, 2008 | 43,789,936 | $ | 5 | $ | 382,849 | $ | (251,244 | ) | (3,037,952 | ) | $ | (32,625 | ) | $ | (4,798 | ) | $ | 94,187 | |||||||
Issuance of common stock under stock incentive plans | 3,527,673 | — | 4,693 | — | 938 | 10 | — | 4,703 | |||||||||||||||||
Retirement of common stock | (76,470 | ) | — | (1,342 | ) | — | — | — | — | (1,342 | ) | ||||||||||||||
Repurchase of common stock | (18,291 | ) | — | (10 | ) | — | — | — | — | (10 | ) | ||||||||||||||
Stock-based compensation expense, net of forfeitures | — | — | 18,239 | — | — | — | — | 18,239 | |||||||||||||||||
Stock option exchange | — | — | 913 | — | — | — | — | 913 | |||||||||||||||||
Effect of fair value election of 2% 2010 Notes exchange | — | — | — | (1,490 | ) | — | — | — | (1,490 | ) | |||||||||||||||
Reissuance of treasury stock | — | — | — | (6 | ) | — | — | — | (6 | ) | |||||||||||||||
Comprehensive loss: | |||||||||||||||||||||||||
Net loss | — | — | — | (127,750 | ) | — | — | — | (127,750 | ) | $ | (127,750 | ) | ||||||||||||
Foreign currency translation adjustments | — | — | — | — | — | — | (1,558 | ) | (1,558 | ) | (1,558 | ) | |||||||||||||
Net unrealized gain on investments | — | — | — | — | — | — | 1,003 | 1,003 | 1,003 | ||||||||||||||||
Other comprehensive loss | (555 | ) | |||||||||||||||||||||||
Total comprehensive loss | $ | (128,305 | ) | ||||||||||||||||||||||
BALANCES AT MAY 3, 2009 | 47,222,848 | $ | 5 | $ | 405,342 | $ | (380,490 | ) | (3,037,014 | ) | $ | (32,615 | ) | $ | (4,798 | ) | $ | (13,111 | ) | ||||||
Issuance of common stock under stock incentive plans | 4,784,117 | 1 | 2,628 | — | — | — | — | 2,629 | |||||||||||||||||
Retirement of common stock | (14,285 | ) | — | (1,654 | ) | — | — | — | — | (1,654 | ) | ||||||||||||||
Repurchase of common stock | (4,408 | ) | — | — | — | — | — | — | — | ||||||||||||||||
Stock-based compensation expense, net of forfeitures | — | — | 13,875 | — | — | — | — | 13,875 | |||||||||||||||||
Effect of fair value election of 2% 2010 Notes exchange | — | — | (3,060 | ) | — | — | — | — | (3,060 | ) | |||||||||||||||
Comprehensive loss: | |||||||||||||||||||||||||
Net loss | — | — | — | (3,334 | ) | — | — | — | (3,334 | ) | $ | (3,334 | ) | ||||||||||||
Foreign currency translation adjustments | — | — | — | — | — | — | 373 | 373 | 373 | ||||||||||||||||
Other comprehensive income | 373 | ||||||||||||||||||||||||
Total comprehensive loss | $ | (2,961 | ) | ||||||||||||||||||||||
BALANCES AT MAY 2, 2010 | 51,988,272 | $ | 6 | $ | 417,131 | $ | (383,824 | ) | (3,037,014 | ) | $ | (32,615 | ) | $ | (4,798 | ) | $ | (4,282 | ) | ||||||
Issuance of common stock under stock incentive plans | 4,898,972 | 1 | 4,002 | — | — | — | — | 4,003 | |||||||||||||||||
Retirement of common stock | — | (2,261 | ) | — | — | — | — | (2,261 | ) | ||||||||||||||||
Repurchase of common stock | (1,318,475 | ) | (1 | ) | (5,273 | ) | — | — | — | — | (5,274 | ) | |||||||||||||
Stock-based compensation expense, net of forfeitures | — | — | 13,065 | — | — | — | — | 13,065 | |||||||||||||||||
Conversion of 2014 Notes | 11,493,887 | 1 | 20,664 | — | — | — | — | 20,665 | |||||||||||||||||
Comprehensive loss: | |||||||||||||||||||||||||
Net loss | — | — | — | (3,263 | ) | — | — | — | (3,263 | ) | $ | (3,262 | ) | ||||||||||||
Foreign currency translation adjustments | — | — | — | — | — | — | 1,067 | 1,067 | 1,067 | ||||||||||||||||
Other comprehensive income | 1,067 | ||||||||||||||||||||||||
Total comprehensive loss | $ | (2,195 | ) | ||||||||||||||||||||||
BALANCES AT MAY 1, 2011 | 67,062,656 | $ | 7 | $ | 447,328 | $ | (387,087 | ) | (3,037,014 | ) | $ | (32,615 | ) | $ | (3,913 | ) | $ | 23,720 | |||||||
54
MAGMA DESIGN AUTOMATION, INC. AND SUBSIDIARIES
CONSOLIDATED STATEMENTS OF CASH FLOWS
(in thousands)
Fiscal Year Ended | |||||||||||
May1, 2011 | May 2, 2010 | May 3, 2009 | |||||||||
Cash flows from operating activities: | |||||||||||
Net loss | $ | (3,262 | ) | $ | (3,334 | ) | $ | (129,242 | ) | ||
Adjustments to reconcile net loss to net cash provided by (used in) operating activities: | |||||||||||
Depreciation | 4,538 | 6,278 | 8,633 | ||||||||
Amortization of intangible assets | 4,166 | 4,978 | 28,270 | ||||||||
Provision for doubtful accounts (net of recovery) | 143 | (174 | ) | 1,124 | |||||||
Amortization of debt discount and debt issuance costs | 572 | 1,976 | 2,562 | ||||||||
Amortization of debt premium | (310 | ) | (240 | ) | — | ||||||
Gain on extinguishment of convertible notes | — | (278 | ) | — | |||||||
Loss on extinguishment of convertible notes due 2014 | 2,093 | — | — | ||||||||
Inducement fee on conversion of convertible notes due 2014 | 2,256 | — | — | ||||||||
Loss on auction rate securities | — | 1,407 | 2,174 | ||||||||
Gain on purchased put option | (38 | ) | (1,811 | ) | (1,732 | ) | |||||
Loss (gain) on strategic equity investments | (791 | ) | (2,647 | ) | 290 | ||||||
Stock-based compensation | 13,093 | 13,876 | 19,151 | ||||||||
Restructuring charges | 1,200 | 2,730 | 10,661 | ||||||||
Impairment of goodwill | — | — | 60,089 | ||||||||
Other non-cash items | (46 | ) | 40 | (305 | ) | ||||||
Changes in operating assets and liabilities, net of effect of acquisitions: | |||||||||||
Accounts receivable | (17,291 | ) | 9,746 | 3,063 | |||||||
Prepaid expenses and other assets | 506 | 1,482 | 691 | ||||||||
Accounts payable | 1,457 | 1,008 | (2,044 | ) | |||||||
Accrued expenses | (3,353 | ) | (1,115 | ) | (19,308 | ) | |||||
Deferred revenue | 8,918 | (10,193 | ) | 9,899 | |||||||
Other long-term liabilities | (301 | ) | (7,725 | ) | 605 | ||||||
Net cash flows provided by (used in) operating activities | 13,550 | 16,004 | (5,419 | ) | |||||||
Cash flows from investing activities: | |||||||||||
Cash paid for business and asset acquisitions, net of cash acquired | (958 | ) | (1,943 | ) | (4,467 | ) | |||||
Purchase of property and equipment | (2,288 | ) | (1,885 | ) | (1,147 | ) | |||||
Proceeds from maturities and sale of available-for-sale investments | 16,875 | 1,475 | 5,000 | ||||||||
Sale (Purchase) of strategic investments | 1,602 | 4,633 | (1,801 | ) | |||||||
Restricted cash | — | 1,465 | — | ||||||||
Net cash flows provided by (used in) investing activities | 15,231 | 3,745 | (2,415 | ) | |||||||
The accompanying notes are an integral part of these consolidated financial statements.
55
MAGMA DESIGN AUTOMATION, INC. AND SUBSIDIARIES
CONSOLIDATED STATEMENTS OF CASH FLOWS-(Continued)
(in thousands)
Fiscal Year Ended | |||||||||||
May 1, 2011 | May 2, 2010 | May 3, 2009 | |||||||||
Cash flows from financing activities: | |||||||||||
Proceeds from issuance of common stock, net | 4,005 | 2,243 | 3,789 | ||||||||
Repayment of 2% 2010 Notes | (23,250 | ) | — | — | |||||||
Exchange of 2% 2010 Notes | — | (26,689 | ) | — | |||||||
Issuance of 6% 2014 Notes | — | 26,689 | — | ||||||||
Issuance costs related to the 6% 2014 Notes | — | (1,852 | ) | — | |||||||
Issuance costs related to term debt | (112 | ) | (823 | ) | — | ||||||
Retirement of restricted stock | (2,261 | ) | (1,270 | ) | (1,351 | ) | |||||
Proceeds (repayments) of revolving note | — | (12,181 | ) | 12,181 | |||||||
Purchase of Treasury Stock | (5,273 | ) | — | — | |||||||
Proceeds from term debt | — | 15,000 | 12,550 | ||||||||
Repayment of lease obligations | (2,287 | ) | (2,564 | ) | (1,972 | ) | |||||
Repayment of convertible notes | — | — | (15,216 | ) | |||||||
Repayment of secured credit line | (11,162 | ) | (1,291 | ) | — | ||||||
Restricted cash | 250 | 7,500 | (9,215 | ) | |||||||
Payment of Inducement fees on conversion of 6% 2014 Notes | (2,279 | ) | — | — | |||||||
Proceeds from term loan | 7,938 | — | — | ||||||||
Repurchase 6% 2014 Notes | (4,839 | ) | — | — | |||||||
Net cash provided by (used in) financing activities | (39,270 | ) | 4,762 | 766 | |||||||
Effect of foreign currency translation changes on cash and cash equivalents | 59 | 119 | 327 | ||||||||
Net change in cash and cash equivalents | (10,430 | ) | 24,630 | (6,741 | ) | ||||||
Cash and cash equivalents, beginning of period | 57,518 | 32,888 | 39,629 | ||||||||
Cash and cash equivalents, end of period | $ | 47,088 | $ | 57,518 | $ | 32,888 | |||||
Supplemental disclosure of cash flow information | |||||||||||
Non-cash investing and financing activities: | |||||||||||
Conversion of 6% 2014 Notes to common stock | $ | 20,665 | $ | — | $ | — | |||||
Purchase of equipment under capital leases | $ | 2,149 | $ | 463 | $ | 2,297 | |||||
Purchase of software under installment payment agreement | $ | — | $ | — | $ | 909 | |||||
Issuance of common stock in connection with acquisitions | $ | — | $ | — | $ | 908 | |||||
Cash Paid for: | |||||||||||
Interest | $ | 1,330 | $ | 2,673 | $ | 1,793 | |||||
Income Taxes | $ | 827 | $ | 674 | $ | 1,942 | |||||
The accompanying notes are an integral part of these consolidated financial statements.
56
NOTES TO CONSOLIDATED FINANCIAL STATEMENTS
Note 1. | The Company and Summary of Significant Accounting Policies |
The Company
Magma Design Automation, Inc. (the “Company” or “Magma”), a Delaware corporation, was incorporated on April 1, 1997. The Company provides design and implementation, analysis and verification software that enables chip designers to reduce the time it takes to design and produce complex integrated circuits used in the communications, computing, consumer electronics, networking and semiconductor industries. The Company has licensed its products to major semiconductor companies and electronic products manufacturers in Asia, Europe and the United States.
Principles of consolidation
The consolidated financial statements of Magma include the accounts of the Company and its wholly-owned subsidiaries. All significant intercompany balances and transactions have been eliminated. Accounts denominated in foreign currency have been translated from their functional currency to the U.S. dollar.
Fiscal year end
The Company has a 52-53 week fiscal year ending on the Sunday closest to April 30. The Company's fiscal years consist of four quarters of 13 weeks each except for each fifth or sixth fiscal year, which includes one quarter with 14 weeks.
References in this Form 10-K to fiscal 2011 represent the 52 weeks ended May1, 2011, references to fiscal 2010 represent the 52 weeks ended May 2, 2010 and references to fiscal 2009 represent the 52 weeks ended May 3, 2009.
Reclassifications
Certain immaterial amounts in the fiscal 2010 and 2009 consolidated financial statements have been reclassified to conform to the fiscal 2011 presentation.
Use of estimates
Preparation of the consolidated financial statements in conformity with accounting principles generally accepted in the United States of America requires management to make estimates and assumptions that affect the reported amounts of assets and liabilities and disclosure of contingent assets and liabilities at the date of the consolidated financial statements and the reported amounts of revenues and expenses during the reporting period. Management periodically evaluates such estimates and assumptions for continued reasonableness. Appropriate adjustments, if any, to the estimates used are made prospectively based upon such periodic evaluation. Actual results could differ from those estimates.
Revenue recognition
Revenue is comprised of licenses revenue, bundled licenses and services revenue, and services revenue. Licenses revenue consists of fees for time-based or perpetual licenses of the Company's software products. Bundled licenses and services revenue consists of fees for software licenses and post-contract customer support (“PCS”), where the Company does not have vendor specific objective evidence (“VSOE”) of fair value of PCS. Services revenue consists of fees for services, such as customer training, consulting and PCS associated with unbundled license arrangements. PCS sold with unbundled license arrangements is renewable after the initial PCS period expires, generally in one-year increments for a fixed percentage of the net license fee.
The Company recognizes revenue when all of the following criteria are met:
• | Persuasive evidence of an arrangement exists, |
• | Delivery has occurred, |
• | The vendor's fee is fixed or determinable, and |
• | Collectability is probable. |
The Company defines each of the four criteria above as follows:
Persuasive evidence of an arrangement exists. It is the Company's customary practice to have a written contract, which is signed by both the customer and Magma, or a purchase order from those customers that have previously negotiated an end-user license arrangement or volume purchase agreement, prior to recognizing revenue on an arrangement.
Delivery has occurred. The Company's software may be either physically or electronically delivered to its customers. For those products that are delivered physically, the Company's standard transfer terms are FOB shipping point. For an electronic delivery of software, delivery is considered to have occurred when the customer has been provided with the access codes that allow the customer to take immediate possession of the software on its hardware.
57
If an arrangement includes undelivered products or services that are essential to the functionality of the delivered product, delivery is not considered to have occurred.
The fee is fixed or determinable. The fee customers pay for products is negotiated at the outset of an arrangement. If the license fees are a function of variable-pricing mechanisms such as the number of units distributed or copied by the customer, or the expected number of users in an arrangement, such fees are not recognized as revenue until such time as amounts become fixed or determinable. In addition, where the Company grants extended payment terms to a customer, the Company's fees are not considered to be fixed or determinable at the inception of the arrangement.
The Company considers arrangements to have extended payment terms where less than 100% of the license and initial period PCS fee is due within one year from the order date. For bundled agreements, revenue from such arrangements is recognized at the lesser of the aggregate of amounts due and payable or ratably. For unbundled agreements, revenue from such arrangements is recognized as amounts become due and payable. Payments received from customers in advance of revenue being recognized are presented as deferred revenue on the consolidated balance sheets.
Collectability is probable. Collectability is assessed on a customer-by-customer basis. The Company typically sells to customers for which there is a history of successful collection. New customers are subjected to a credit review process that evaluates the customers' financial positions and ultimately their ability to pay. If it is determined from the outset of an arrangement that collectability is not probable based upon the Company's credit review process, revenue is recognized on a cash receipts basis (as each payment is collected).
Multiple element arrangements. The Company allocates revenue on software arrangements involving multiple elements to each element based on the relative fair values of the elements. The Company's determination of fair value of each element in multiple element arrangements is based on VSOE. The Company limits its assessment of VSOE for each element to the price charged when the same element is sold separately or renewal rates of PCS.
The Company has analyzed all of the elements included in its multiple-element arrangements and determined that it has sufficient VSOE to allocate revenue to the PCS components of its perpetual and time-based license products and consulting. Accordingly, assuming all other revenue recognition criteria are met, revenue from unbundled licenses is recognized upon delivery using the residual method and revenue from PCS is recognized ratably over the PCS term. If an unbundled arrangement involves extended payment terms, revenue recognized using the residual method is limited to amounts due and payable. The Company recognizes revenue from bundled licenses ratably over the term of the license period, as the license and PCS portions of a bundled license are not sold separately. Revenue from bundled arrangements with extended payment terms is recognized as the lesser of amounts due and payable or ratable portion of the entire fee.
Certain of the Company's time-based licenses include the rights to specified and unspecified additional products. Revenue from contracts with the rights to unspecified additional software products is recognized ratably over the contract term. The Company recognizes revenue from time-based licenses that include both unspecified additional software products and extended payment terms that are not considered to be fixed or determinable in an amount that is the lesser of amounts due and payable or the ratable portion of the entire fee. Revenue from licenses that include a right to specified upgrades is deferred until the upgrades are delivered because there is no VSOE for the specific upgrade.
The Company provides design methodology assistance and specialized services relating to generalized turnkey design services. The Company has VSOE of fair value for consulting and training services. The Company's consulting services generally are not essential to the functionality of the software. The Company's software products are fully functional upon delivery and implementation does not require any significant modification or alteration. The Company's services to its customers often include assistance with product adoption and integration and specialized design methodology assistance. Customers typically purchase these professional services to facilitate the adoption of the Company's technology and dedicate personnel to participate in the services being performed, but they may also decide to use their own resources or appoint other professional service organizations to provide these services. Software products are billed separately and independently from consulting services, which are generally billed on a time-and-materials or milestone-achieved basis. The Company generally recognizes revenue from consulting and training services as the services are performed provided all other revenue recognition criteria are met.
Where consulting and training services are included in bundled arrangements that include time-based licenses and PCS where VSOE of PCS has not been established, the Company recognizes the entire arrangement fee ratably over the PCS service period, beginning with the delivery of the software, provided that all other revenue recognition criteria are met.
Cost of revenue
Cost of revenue includes cost of licenses revenue, cost of bundled licenses and services revenue and cost of services revenue. Cost of licenses revenue primarily consists of amortization of acquired developed technology and other intangible assets, software maintenance costs, royalties and allocated outside sale representative expenses. Cost of bundled licenses and services revenue includes allocation of license and service costs. Cost of services revenue primarily consists of personnel and related costs to provide product support, consulting services and training, as well as stock-based compensation, asset depreciation, and allocated outside
58
sales representative expenses.
Commission expense
The Company recognizes sales commission expense as it is earned by its employees based on the terms of the respective commission plan. According to the terms of the commission plan, commissions for orders recorded are paid by the Company to employees over a period of time, typically over two to six quarters, depending on the size of the respective orders.
Unbilled receivables
Unbilled receivables represent revenue that has been recognized in the financial statements in advance of contractual invoicing to the customer. The Company typically generates invoices 45 days in advance of contractual due dates and will invoice all of the unbilled receivables within one year. In all cases, the revenue and unbilled receivables are for contracts that are non-cancelable, in which there are no contingencies and where the customer has taken delivery of both the software and the encryption key required to operate the software. Unbilled receivables were approximately $8.9 million at May1, 2011 and $2.9 million at May 2, 2010, and are included in accounts receivable on the consolidated balance sheets for each of these periods.
Research and development expenses
Research and development expenses are charged to expense as incurred.
Capitalized software
Software development costs incurred in the research and development of new software products and enhancements to existing software products are expensed as incurred until technological feasibility in the form of a working model has been established. The Company's software is usually available for general release concurrent with the establishment of technological feasibility, and accordingly no significant costs have been capitalized to date.
Software included in property and equipment includes amounts paid during the application development stage for purchased software and customization services, including conversion of old data and expenditures for software used internally.
Foreign currency
Generally, financial statements of foreign subsidiaries are measured using the local currency of the subsidiary as the functional currency. Accordingly, assets and liabilities of the subsidiaries are translated at current rates of exchange at the balance sheet date, and all revenue and expense items are translated using average exchange rates. At May 1, 2011 and May 2, 2010, cumulative foreign currency translation gains and loss are included in accumulated other comprehensive loss on the consolidated balance sheets.
Derivative Financial Instruments
The Company enters into foreign currency forward exchange contracts with financial institutions to minimize the impact of currency exchange rate movements on the Company's operating results. A foreign currency forward exchange contract acts as a hedge by increasing in value when underlying expenses increase due to changes in foreign exchange rates. Conversely, a foreign currency forward exchange contract decreases in value when underlying expenses decrease due to changes in foreign exchange rates.
The Company's forward contracts are not designated as accounting hedges and, therefore, the unrealized gains and losses are recognized in other expense, net, in the accompanying consolidated statements of operations, with the unrealized gains and losses of these forward contracts being recorded as accrued liabilities or other current assets. The Company does not use forward contracts for trading purposes.
The Company's forward contracts each have maturities of less than one year. The Company's foreign currency exchange contracts are valued using Level 2 inputs. Recognized gains or losses with respect to current hedging activities will ultimately depend on how accurately the Company is able to match the amount of currency forward exchange contracts with underlying currency exposures.
The notional fair value of outstanding forward exchange contracts was approximately $0 million and $2.1 million as of May1, 2011 and May 2, 2010, respectively. The Company had realized losses of $0.1 million, $0.6 million and $0.8 million on foreign currency forward exchange contracts for the years ended May1, 2011, May 2, 2010 and May 3, 2009, respectively. As of May1, 2011 and May 2, 2010 the Company recorded an unrealized loss of approximately $0 and $19,000, respectively, in other current liabilities.
Cash equivalent and short-term investments
Cash equivalents consist of highly liquid debt instruments purchased with an original or remaining maturity of three months or less. Investments with an original maturity at the time of purchase between three and twelve months are classified as short-term investments and investments that have a maturity date more than twelve months from the balance sheet date are classified
59
as long-term investments.
These investments are typically classified as trading, and the gains or losses are recorded in other income or expense on the statement of operations or available-for-sale, and are recorded on the balance sheet at fair value as of the balance sheet date, with gains or losses considered to be temporary in nature reported as a component of other comprehensive income (loss) within the stockholders' equity on the consolidated balance sheets. As of May1, 2011, all the investments were held in cash and cash equivalents.
The Company has no short-term investments on its consolidated balance sheets as of May 1, 2011. The short-term investments on the consolidated balance sheets as of May 2, 2010 consisted of Auction Rate Securities's ("ARS") that are AAA rated and were secured by pools of student loans guaranteed by state regulated higher education agencies and reinsured by the U.S. Department of Education and the UBS purchased put option.
Restricted cash
The Company's total restricted cash balance was $0 million and $0.2 million as of May1, 2011 and May 2, 2010, respectively. The restricted cash as of May 2, 2010 related to cash held in a certificate of deposit account as security per an agreement with the Company's corporate credit card facility.
Concentration of credit risk
Financial instruments that potentially subject the Company to concentrations of credit risk consist principally of cash, cash equivalents, short-term investments and accounts receivable. The Company's cash, cash equivalents and short-term investments generally consist of government agencies, municipal obligations and money market funds with high-quality financial institutions. Accounts receivable are typically unsecured and are derived from license and service sales. The Company performs ongoing credit evaluations of its customers and maintains allowances for doubtful accounts.
At May1, 2011 and May 2, 2010, one customer accounted for 26% and 10%, respectively, of accounts receivable. The Company had no customers representing 10% or more of revenue for each of the fiscal years ended May1, 2011, May 2, 2010 and May 3, 2009.
Trade accounts receivable
Trade accounts receivable are recorded at the invoiced amount and do not bear interest. The allowance for doubtful accounts is Magma's best estimate of the amount of probable credit losses in the Company's existing accounts receivable. The Company determines the allowance based on historical write-off experience, current market trends, and for larger accounts, the ability to pay outstanding balances. Magma continually reviews its allowances for collectability. Past due balances over 90 days and other higher risk amounts are reviewed individually for collectability. Account balances are charged off against the allowance after collection efforts have been exhausted and the potential for recovery is considered remote.
Goodwill
Magma conducts a goodwill impairment analysis annually and as necessary if changes in facts and circumstances indicate that the fair value of Magma's reporting unit may be less than its carrying amount. Magma's goodwill impairment test consists of two steps. Magma performed a goodwill impairment test at December 31, 2008 and recorded an impairment of goodwill of $60.1 million in fiscal 2009. In fiscal 2011 and 2010, Magma did not record any impairment of goodwill.
Intangibles
The Company's intangible assets include acquired intangibles, excluding goodwill. Acquired intangibles with definite lives are amortized on a straight-line basis over the remaining estimated economic life of the underlying products and technologies (original lives assigned are one to six years). The Company reviews its long-lived assets for impairment whenever events or changes in circumstances indicate that the carrying amount of a long-lived asset may not be recoverable. Recoverability of an asset is measured by comparison of its carrying amount to the expected future undiscounted cash flows that the asset is expected to generate. If it is determined that an asset is not recoverable, an impairment loss is recorded in the amount by which the carrying amount of the asset exceeds its fair value. Based on the Company's review, no impairment existed as of May 1, 2011 and May 2, 2010.
Leases
Magma uses operating leases in its operations. For leases that contain rent escalations or rent concessions, Magma records the total rent payable during the lease term on a straight-line basis over the term of the lease. Magma records the difference between the rents paid and the straight-line rent as a deferred rent liability in the accompanying consolidated balance sheets.
Advertising
Magma expenses the costs of advertising as incurred. Advertising expense was approximately $0.1 million in fiscal 2011,
60
$0.2 million in fiscal 2010 and $0.3 million in fiscal 2009, and is included in sales and marketing in the accompanying consolidated statements of operations.
Property and equipment
Property and equipment are recorded at cost. Depreciation of property and equipment is based on the straight-line method over the estimated useful lives of the related assets, generally three to five years. Leasehold improvements are amortized on the straight-line method over the shorter of the lease term or the estimated useful life of the asset. Maintenance and repair costs are charged to operations as incurred.
Property and equipment consisted of the following (in thousands):
May1, 2011 | May 2, 2010 | ||||||
Property and equipment: | |||||||
Computer equipment | $ | 32,282 | $ | 30,827 | |||
Software | 8,788 | 8,390 | |||||
Furniture and fixtures | 4,161 | 4,040 | |||||
Leasehold improvements | 5,856 | 5,701 | |||||
Total Property and equipment | 51,087 | 48,958 | |||||
Accumulated depreciation and amortization | (45,021 | ) | (42,979 | ) | |||
Net Property and equipment | $ | 6,066 | $ | 5,979 | |||
Depreciation expense was $4.5 million, $6.3 million and $8.6 million, respectively, for the years ended May1, 2011, May 2, 2010 and May 3, 2009.
The cost of equipment acquired under capital leases included in property and equipment was $7.4 million and $6.8 million respectively, as of May1, 2011 and May 2, 2010. Accumulated amortization of the leased equipment was $4.9 million, and $4.7 million, respectively, as of May1, 2011 and May 2, 2010. Amortization of assets reported under capital leases was included with depreciation expense.
Impairment of long-lived assets
The Company reviews long-lived assets, such as property and equipment, for impairment whenever events or changes in circumstances indicate that the carrying amount of the assets may not be fully recoverable. An impairment loss would be recognized for assets to be held and used when estimated undiscounted future cash flows expected to result from the use of the asset and its eventual disposition is less than its carrying amount. Impairment, if any, is measured as the amount by which the carrying amount of the assets exceeds the fair value of the assets. Assets to be disposed of are reported at the lower of the carrying amount or fair value less costs to sell.
Strategic investments
The Company invests in debt and equity of private companies as part of its business strategy. Magma classifies investments as cost method investments or equity method investments. The Company regularly reviews the assumptions underlying the operating performance and cash flow forecasts based on information provided by these investee companies. Assessing each investment's carrying value requires significant judgment by management as this financial information may be more limited, may not be as timely and may be less accurate than information available from publicly traded companies. If the Company determines, based on the best available evidence, that the carrying value of an investment is impaired, the Company writes down the carrying value of an investment to its estimated fair value and records the related write-down as a loss in equity investment, which is included in other income (expense), net in its consolidated statements of operations. No impairments have been recorded on the Company's strategic investments.
The investments are included in other long-term assets in the consolidated balance sheets. The carrying value of the Company's strategic investments was (in thousands):
May1, 2011 | May 2, 2010 | ||||||
Non-Marketable Securities - Application of Cost Method | $ | — | $ | 721 | |||
Non-Marketable Securities - Application of Equity Method | 531 | 622 | |||||
Total | $ | 531 | $ | 1,343 | |||
The carrying value of a cost method non-marketable investment is the amount paid for the investment unless it has been determined to be other than temporarily impaired, in which case the Company writes the investment down to its estimated fair
61
value.
For equity method investments where the Company's ownership interest is between 20% to 50%, or where the Company can exercise significant influence on the investee's operating or financial decisions, the Company records its share of net equity income (loss) of the investee based on its proportionate ownership. The Company invested $0.8 million in Helic, Inc during fiscal 2009, bringing its ownership in Helic to 8%. One of the Company's executives is a member of the board of directors of Helic, which permits the Company to exercise significant influence on Helic's operating decisions. The investment in Helic is accounted as an equity investment.
During the third quarter of fiscal 2011, the Company sold its percentage interest in AutoESL Design, Inc. to Xilinx, Inc. for $1.9 million in cash at closing and $0.5 million in contingent proceeds. The contingent proceeds consist of an amount equal to 20% of the initial consideration to be held in escrow and released for payment 12 months from the date of the agreement, to secure the indemnification obligations of the Company as one of the sellers. The proceeds (net of expenses) of $1.9 million to the Company offset against the net book value of the investment of $1.0 million on the date of sale of the investment resulted in a net gain of $0.9 million, which was recorded in the consolidated statement of operations in other income.
The escrow amount is a contingency representing potential incremental income and will be recognized if and when all contingencies are resolved.
During the fourth quarter of fiscal 2010, the Company sold its 35% ownership interest in Zerosoft, Inc. to Synopsys, Inc for $4.7 million in cash at closing and $4.3 million in contingent proceeds. The contingent proceeds consist of a holdback amount equal to 10% of the initial consideration to be held in escrow and released for payment 15 months from the date of the agreement to secure the indemnification obligations of the Company as one of the sellers, and earnout consideration based upon the achievement of certain annual product performance improvement milestones for the three years subsequent to the sale agreement. The proceeds (net of expenses) of $4.6 million to the Company offset against the net book value of the investment of $1.4 million on the date of sale of the investment resulted in a net gain of $3.2 million, which was recorded in the statement of operations in other income in fiscal 2010.
The holdback amount and earnout consideration are gain contingencies each representing potential incremental income and will be recognized if and when all contingencies are resolved.
The Company recorded its share of net loss incurred by the Company's strategic investments as a net loss on equity investment of $0.1 million, $0.1 million and $0.3 million for the fiscal years ended May1, 2011, May 2, 2010 and May 3, 2009, respectively.
Income taxes
Income taxes are accounted for under the asset and liability method. Deferred tax assets and liabilities are recognized for the future tax consequences attributable to differences between the financial statement carrying amounts of existing assets and liabilities and their respective tax bases and operating loss and tax credit carry-forwards. Deferred tax assets and liabilities are measured using enacted tax rates expected to apply to taxable income in the years in which those temporary differences are expected to be recovered or settled. The effect on deferred tax assets and liabilities of a change in tax rates is recognized in income in the period that includes the enactment date. A valuation allowance is recorded against deferred tax assets if it is more likely than not that all or a portion of the deferred tax assets will not be realized.
Treasury stock reissuance
Shares of common stock repurchased by the Company that are not retired are recorded at cost as treasury stock and result in a reduction of stockholders' equity in the Company's consolidated balance sheets. From time to time, treasury shares may be reissued as part of the Company's stock-based compensation programs. When shares are reissued, the Company uses the weighted average cost method for determining cost. If the issuance price is higher than the cost, the excess of the issuance price over cost is credited to additional paid-in capital (“APIC”). If the issuance price is lower than the cost, the difference is first charged against any credit balance in APIC from treasury stock and the balance is charged to retained earnings (accumulated deficit). During the years ended May1, 2011 and May 2, 2010, the Company did not reissue shares from treasury stock.
Stock-based compensation
The Company accounts for stock-based employee compensation arrangements based on fair value recognition of share-based payment arrangements, including stock options, restricted stock, restricted stock units and shares issued under the Employee Stock Purchase Plan (“ESPP”). Additionally, the Company has elected to use the straight-line method to recognize its stock-based compensation expenses over the options and awards vesting periods.
The Company uses the Black-Scholes option pricing model to determine the fair value of each stock option grant and each purchase right granted under its ESPP. The fair value of each restricted stock and restricted stock unit is determined using the fair value of the Company's common stock on the date of the grant. Determining the fair value of stock-based awards at the grant date requires the input of various highly subjective assumptions, including expected future stock price volatility, expected term of
62
instruments and expected forfeiture rates.
The Company has not recognized a net income tax benefit for stock-based compensation expense for current and prior year periods because it is more likely than not that the deferred tax assets associated with this expense will not be realized. To the extent the Company realizes the deferred tax assets associated with the stock-based compensation expense in the future, the income tax effects of such an event may be recognized at that time. Cash retained as a result of tax benefits for tax deductions in excess of the compensation expense recorded for those options is required to be classified as cash from financing activities. The Company recorded no such excess tax benefits for the fiscal year ended May1, 2011, May 2, 2010 and May 3, 2009.
Fair value of financial instruments
Financial instruments consist of cash and cash equivalents, short and long-term investments, accounts receivable and payable, accrued liabilities, convertible notes, auction rate securities and purchased put options. The carrying amounts of cash and cash equivalents, short-term investments, accounts receivable and payable and accrued liabilities approximate their fair values because of the short-term nature of those instruments. The Company has estimated the fair value of its convertible senior notes and its ARS investment and the put option related to the ARS by using available market information and valuation. Assets and liabilities carried at fair value are classified and disclosed in one of the following three levels:
Level 1: Quoted market prices in active markets for identical assets or liabilities.
Level 2: Observable market-based inputs or unobservable inputs that are corroborated by market data.
Level 3: Unobservable inputs that are not corroborated by market data.
The following table summarizes the Company's carrying values and market-based fair values of these financial instruments as of May1, 2011 and May 2, 2010 (in thousands):
Carrying Value | Estimated Fair Value | ||||||
May1, 2011 | |||||||
Convertible senior notes due 2014 | $ | 3,250 | $ | 12,065 | |||
May 2, 2010 | |||||||
Convertible senior notes due 2010 | $ | 23,250 | $ | 23,250 | |||
Convertible senior notes due 2014 | $ | 26,689 | $ | 47,405 | |||
Auction rate securities | $ | 16,512 | $ | 16,512 | |||
Purchased put options | $ | 325 | $ | 325 | |||
Information on the carrying value of the convertible notes is provided in Note 9, Convertible Notes. Information on the carrying value of the ARS and purchased put option is provided in Note 3, Fair Value of Financial Instruments.
Comprehensive income (loss)
The Company classifies items of other comprehensive income (loss) by their nature in the financial statements and displays the accumulated balance of other comprehensive income separately from retained earnings and additional paid-in-capital in the equity section of the consolidated balance sheet. Comprehensive income (loss) includes all changes in equity (net assets) during a period from non-owner sources. Comprehensive income (loss) is shown in the consolidated statement of stockholders' equity.
Components of accumulated other comprehensive losses as of May1, 2011 and May 2, 2010 were as follows (in thousands):
Year Ended | |||||||
May1, 2011 | May 2, 2010 | ||||||
Foreign currency translation adjustments | $ | 3,913 | $ | (4,980 | ) | ||
Accumulated Other Comprehensive loss | $ | 3,913 | $ | (4,980 | ) | ||
Adoption of New Accounting Pronouncements
In January 2010, the FASB issued an update, Improving Disclosures about Fair Value Measurements, to ASC 820, Fair Value Measurements and Disclosures, to provide additional disclosures about (1) the different classes of assets and liabilities measured at fair value, (2) the valuation techniques and inputs used, (3) the activity in Level 3 fair value measurements, and (4) the transfers between Levels 1, 2, and 3. The update is effective for interim and annual reporting periods beginning after December 15, 2009, except for the separate disclosures about purchases, sales, issuances, and settlements relating to Level 3 measurements, which shall be effective for fiscal years beginning after December 15, 2010, and for interim periods within those fiscal years. In the
63
period of initial adoption, the reporting entity is not required to provide the disclosures to previous periods presented for comparative purposes, but will be required to provide this comparative information for periods ending after initial adoption. The Company has adopted the additional disclosures requirements effective in the third quarter of fiscal 2011.
Recently Issued Accounting Pronouncements
In December 2010, the FASB issued guidance that clarifies when to perform Step 2 of the Goodwill Impairment Test for reporting units with zero or negative carrying amounts (“ASU 2010-28”). Under the amended guidance, an entity must consider whether it is more likely than not that goodwill impairment exists for reporting units with a zero or negative. In determining whether it is more likely than not that goodwill impairment exists, an entity should consider whether there are any adverse qualitative factors indicating that impairment may exist. The qualitative factors are consistent with the existing guidance in ASC 350-25-35-30. If it is more likely than not that goodwill impairment exists, the second step of the goodwill impairment test in ASC 350-20-35 must be performed to measure the amount of goodwill impairment loss, if any. For public entities, ASU 2010-28 is effective for fiscal years, and interim periods within those fiscal year, beginning after December 15, 2010 and early adoption is not permitted. Through fiscal 2011, the Company has historically had negative carrying values. To the extent the Company experiences negative carrying values in the future, this update will be applicable to the Company. The adoption of this amendment is not expected to have a material impact on the Company's consolidated financial statements.
In December 2010, the FASB issued guidance to address the diversity in practice of the presentation of pro forma information for business combinations (“ASU 2010-29”). Under the amended guidance, a public entity that presents comparative financial statements must disclose the pro forma revenue and earnings of the combined entity as though the business combination had occurred as of the beginning of the prior annual reporting period. If comparative financial statements are not presented, the entity must disclose the pro forma revenue and earnings of the combined entity for the current reporting period as though the acquisition date for all business combinations that occurred during the year had been as of the beginning of the annual reporting period. The amendments also expand the supplemental pro forma disclosures to include a description of the nature and amount of material, nonrecurring pro forma adjustments directly attributable to the business combination included in the reported pro forma revenue and earnings. ASU 2010-29 are effective prospectively for business combinations for which the acquisition date is on or after the beginning of the first annual reporting period beginning on or after December 15, 2010 and early adoption is permitted. To the extent the Company consummates any business combinations in the future, this update will be applicable to the Company. The adoption of this amendment is not expected to have a material impact on the Company's consolidated financial statements.
In October 2009, the FASB issued an amendment to ASC 605-25, Multiple Element Arrangements (“ASC 605-25”), which modifies how a company separates consideration in multiple-delivery arrangements. The amendment establishes a selling price hierarchy for determining the selling price of a deliverable. The amendment also clarifies the allocation of revenue is based on entity-specific assumptions rather than assumptions of a marketplace participant. The amendment also eliminates the residual method of allocating revenue and requires the use the relative selling price method for non-software revenue arrangements. This amendment to ASC 605-25 is effective for new revenue arrangements entered into or modified in fiscal years beginning after June 15, 2010 and is effective for the Company on May 2, 2011. Early adoption is permitted. The adoption of this amendment is not expected to have a material impact on the Company's consolidated financial statements.
In October 2009, the FASB issued an amendment to ASC 985-605, which modifies the accounting model for revenue arrangements that include both tangible products and software elements. This amendment to ASC 985-605 is effective for new revenue arrangements entered into or modified in fiscal years beginning after June 15, 2010. Early adoption is permitted. The Company does not sell products that include both tangible products and software elements, therefore this amendment will not impact the Company's consolidated financial statements.
In April 2010, the FASB issued an amendment to ASC 605, Revenue Recognition, to provide guidance on defining a milestone and determining when it may be appropriate to apply the milestone method of revenue recognition for research or development transactions. This amendment to ASC 605 is effective on a prospective basis for milestones achieved in fiscal years, and interim periods within those years, beginning on or after June 15, 2010. Early adoption is permitted. The Company does not provide research or development for others and does not recognize revenue using the milestone method, therefore this amendment will not impact the Company's consolidated financial statements.
Note 2.Fair Value Option
During the second quarter of fiscal 2009, the Company elected fair value accounting for the purchased put option recorded in connection with the ARS settlement agreement signed with UBS (see Note 3 Fair Value of Financial Instruments). This election was made in order to mitigate volatility in earnings caused by accounting for the purchased put option and underlying ARS under different methods. The election of fair value led to a $0.4 million loss for fiscal 2010, included in “Valuation gain (loss), net” with the purchased put option asset recorded in long-term investments pledged as collateral for the secured credit line.
Note 3. | Fair Value of Financial Instruments |
The following table is a reconciliation of financial assets measured at fair value using significant unobservable inputs (Level
64
3) during the fiscal years ended May1, 2011 and May 2, 2010 (in thousands):
Year Ended | |||||||
May 1, 2011 | May 2, 2010 | ||||||
Beginning balance | $ | 16,837 | $ | 17,908 | |||
Net sales and settlements | (16,875 | ) | (1,475 | ) | |||
Transfers in and/or (out) of Level 3 | — | 1,811 | |||||
Gain (losses) on auction rate securities | 38 | (1,407 | ) | ||||
Ending balance | $ | — | $ | 16,837 | |||
As of May 1, 2011, the Company had cash and cash equivalents of $47.1 million that were classified as Level 1 investments and were quoted at market price. As of May 2, 2010, the ARS's were accounted as Level 3 investments.
Cash, cash equivalents and short-term investments are included in the consolidated balance sheets as follows (in thousands):
Cost | Gross Realized Gains | Gross Realized Losses | Estimated Fair Value | ||||||||||||
May1, 2011 | |||||||||||||||
Cash and cash equivalents | |||||||||||||||
Cash (U.S. and international) | $ | 47,088 | $ | — | $ | — | $ | 47,088 | |||||||
Total cash and cash equivalents | $ | 47,088 | $ | — | $ | — | $ | 47,088 | |||||||
May 2, 2010 | |||||||||||||||
Cash and cash equivalents | |||||||||||||||
Cash (U.S. and international) | $ | 57,518 | $ | — | $ | — | $ | 57,518 | |||||||
Total cash and cash equivalents | 57,518 | — | — | 57,518 | |||||||||||
Short-term investments: | |||||||||||||||
Auction rate securities | 16,875 | — | (38 | ) | 16,837 | ||||||||||
Total cash and cash equivalents and short-term investments | $ | 74,393 | $ | — | $ | (38 | ) | $ | 74,355 | ||||||
The realized losses for the year ended May 2, 2010 were primarily associated with failed ARS as discussed below. Gross realized losses from the sales of marketable securities were immaterial for all periods presented.
The notional fair value of outstanding forward exchange contracts was approximately $0 million and $2.1 million as of May1, 2011 and May 2, 2010, respectively. The Company had realized gain of $0.1 million and realized losses of $0.6 million and $0.8 million on foreign currency forward exchange contracts for the years ended May 1, 2011, May 2, 2010 and May 3, 2009, respectively. As of May 1, 2011 and May 2, 2010, the Company recorded an unrealized gain of $0 and $19,000 in other current assets.
The Company has no short-term investments on its consolidated balance sheets as of May 1, 2011. The short term investments on the consolidated balance sheets as of May 2, 2010 consisted of ARS that were AAA rated and were secured by pools of student loans guaranteed by state regulated higher education agencies and reinsured by the U.S. Department of Education . Due to liquidity issues caused by the global financial crisis, in October 2008, the Company entered into an agreement with UBS which provided it with Auction Rate Securities Rights (“Rights”) to sell the ARS at par value to UBS at any time during the period June 30, 2010 through July 2, 2012. These Rights were a separate freestanding instrument accounted for separately from the ARS, and were registered, nontransferable securities accounted for as a purchased put option initially recorded at fair value. Under the Rights agreement, UBS could, at its discretion, sell the ARS at any time through July 2, 2012 without prior notice to the Company and be required to pay the Company par value for the ARS within one day of the sale transaction settlement. Additionally, UBS offered a “no net cost” secured line of credit to the Company of up to 75% of the market value of the ARS as determined by UBS that expired on June 30, 2010. Due to the Company entering into this agreement with UBS and enabling UBS to sell the ARS at any time, the ARS previously reported as available-for-sale were transferred to trading securities as of May 2, 2010.
During the first quarter of fiscal 2011, the Company exercised its put option and liquidated the $16.8 million of ARS and repaid the outstanding $11.2 million secured line of credit to UBS.
As of May 2, 2010, there was insufficient observable market information available to determine the fair value of the Company's ARS. As of May 2, 2010, the Company engaged a third party valuation service to model Level 3 fair value using an income
65
approach. The Company reviewed the methodologies employed by the third party models. This included a review of all relevant data inputs and the appropriateness of key model assumptions (in thousands):
Fair Value at May 2, 2010 | |||||||||||
Balance at May 2, 2010 | Significant Other Observable Inputs (Level 2) | Significant Unobserved Inputs (Level 3) | |||||||||
Trading Securities | |||||||||||
Student Loans AAA rating | |||||||||||
Market Value per UBS @75% liquidity | $ | 11,283 | $ | — | $ | 11,283 | |||||
Add: Value of the illiquid portion using 0.2 year term | 5,554 | — | 5,554 | ||||||||
Fair Value of Student Loans using 0.2 year term | $ | 16,837 | $ | — | $ | 16,837 | |||||
Student Loans AAA rating | |||||||||||
Value of security before liquidity adjustment | $ | 17,272 | $ | — | $ | 17,272 | |||||
Less: Discount for lack of liquidity using the 4.0 year term | (760 | ) | — | (760 | ) | ||||||
Total student loans AAA rating | 16,512 | — | 16,512 | ||||||||
Purchased Put Option | |||||||||||
Value of put option prior to risk adjustment | 326 | — | 326 | ||||||||
Less: Adjustment of credit risk @0.15% | (1 | ) | — | (1 | ) | ||||||
Total purchased put option | 325 | — | 325 | ||||||||
Fair Value of Student Loans using a 4.0 year term | $ | 16,837 | $ | — | $ | 16,837 | |||||
The pricing assumptions for the ARS included the coupon rate, the estimated time to liquidity, current market rates for publicly traded student loans of similar credit rating and an adjustment for lack of liquidity. The student loans are AAA rated and are secured by pools of student loans guaranteed by state regulated higher education agencies and reinsured by the U.S. Department of Education, and have maturities ranging from 2031 to 2047. The coupon rate was assumed to equal the stated maximum auction rate being received, which is determined based on the applicable 91-day U.S. Treasury rate plus 1.20% premium according to provisions outlined in each security's agreement. The estimated time to liquidity was 4.0 years based on (i) expectations from industry brokers for liquidity in the market and (ii) the period over which UBS and other broker-dealers that had issued ARS have agreed to redeem certain ARS at par value.
The purchased put option gave the Company the right to sell the ARS to UBS for a price equal to par value during the period June 30, 2010 to July 2, 2012, providing liquidity for the ARS sooner than the estimated 4.0 years. As the Company planned to exercise the purchased put option on or around June 30, 2010, the value of the purchased put option was determined based on (i) the ability to sell the securities thereby creating liquidity approximately 0.2 year before the ARS market was expected to become liquid and (ii) the avoidance of receiving below-market coupon rate while the security is illiquid and auctions are failing. The fair value of the purchased put option represents the difference between the ARS with an estimated time to liquidity of 4.0 years and the ARS with an estimated time to liquidity of 0.2 year as the purchased put option allowed for the acceleration of liquidity and the avoidance of a below-market coupon rate over the two year time period.
Based on the Level 3 valuation and the transfer of the ARS from the available-for-sale category to the trading category, the Company recorded an other-than-temporary loss of $2.8 million in valuation gain (loss), net in the second quarter of fiscal 2009, including the transfer of accumulated temporary losses of $0.9 million from other comprehensive loss previously recorded as a component of stockholders' equity. For fiscal 2009, total other-than-temporary impairment loss on auction rate securities of $0.3 million was reported in the valuation gain (loss), net in the consolidated statement of operations, this loss was offset by gains related to the purchase put option of $0.7 million. For the year ended May 2, 2010, the Company recorded a realized gain on the ARS of $1.8 million, offset by losses related to the purchased put option of $1.4 million. Upon the exercise of the purchased put option in the first quarter of fiscal 2011, the Company recorded a gain of $38,000 which was reported in “Valuation gain, net” in the consolidated statements of operations.
Note 4. | Basic and Diluted Net Income (Loss) Per Share |
The Company computes net income (loss) per share by dividing net income (loss) (numerator) by the weighted average number of common shares outstanding (denominator) during the period. Diluted net income (loss) per share is impacted by equity instruments considered to be potential common shares, if dilutive, computed using the “treasury stock” method of accounting. Potentially dilutive common shares outstanding include shares issuable under the Company's stock-based compensation plans such as stock options, restricted stock, restricted stock units and employee stock purchase plan, as well as shares issuable upon
66
conversion of redeemable convertible notes.
A summary of weighted average shares used in basic and diluted net income (loss) per share for the fiscal years ended May1, 2011, May 2, 2010 and May 3, 2009 is as follows (in thousands):
Years Ended | |||||||||||
May1, 2011 | May 2, 2010 | May 3, 2009 | |||||||||
Numerator | |||||||||||
Net loss | $ | (3,262 | ) | $ | (3,334 | ) | $ | (129,242 | ) | ||
Denominator | |||||||||||
Weighted-average common shares for basic net income (loss) per share | 61,343 | 49,639 | 44,698 | ||||||||
Dilutive effect of common shares equivalents from stock - based compensation plans | — | — | — | ||||||||
Weighted-average common shares for diluted net income (loss) per share | 61,343 | 49,639 | 44,698 | ||||||||
Certain shares issuable under stock options, restricted stock, restricted stock units and the employee stock purchase plan were excluded from the computation of diluted net income (loss) per share in periods when their effect was anti-dilutive; either because the Company incurred a net loss for the period, the exercise price of the options was greater than the average market price of the common stock during the period, or the effect was anti-dilutive as a result of applying the “treasury stock” method. In addition, certain common shares issuable upon conversion of convertible notes were excluded from the computation of diluted net income (loss) per share because their effect was anti-dilutive as a result of applying the “if converted” method.
A summary of the potential common shares excluded from diluted net income (loss) per share for years ended May1, 2011, May 2, 2010 and May 3, 2009 are as follows (in thousands):
Years Ended | |||||
May1, 2011 | May 2, 2010 | May 3, 2009 | |||
Total shares of common stock issuable under Company's stock-based compensation plans | 11,033 | 11,975 | 13,058 | ||
Shares of common stock issuable upon conversion of convertible notes | 6,011 | 19,706 | 3,329 | ||
Note 5. | Balance Sheet Components |
Significant components of certain balance sheet items are as follows (in thousands):
May1, 2011 | May 2, 2010 | ||||||
Accounts receivable, net: | |||||||
Trade accounts receivable, including receivable from related parties $2,181 and $1,667 at May 1, 2011 and May 2, 2010 | $ | 26,750 | $ | 14,475 | |||
Unbilled receivable | 8,939 | 2,943 | |||||
Gross accounts receivable | 35,689 | 17,418 | |||||
Allowance for doubtful accounts | (159 | ) | (17 | ) | |||
Total accounts receivable | $ | 35,530 | $ | 17,401 | |||
Accrued expenses: | |||||||
Accrued sales commissions | $ | 1,160 | $ | 2,098 | |||
Accrued bonuses | 4,013 | 4,456 | |||||
Other payroll and related accruals | 5,219 | 4,168 | |||||
Acquisition accrual | 60 | 353 | |||||
Accrued professional fees | 368 | 475 | |||||
Income taxes payable | 326 | 277 | |||||
Restructuring accrual | 769 | 2,366 | |||||
Other | 2,245 | 2,154 | |||||
Total accrued expenses | $ | 14,160 | $ | 16,347 | |||
67
Note 6. | Acquisitions |
The Company did not make any acquisitions or material asset purchases during the fiscal years ended May1, 2011 or May 2, 2010.
Pursuant to the agreement to acquire SabioLabs, Inc. ("Sabio") during the fiscal year ended May 4, 2008, the Company held back cash consideration of $1.5 million and approximately 213,000 shares of Company common stock valued at $2.2 million to secure certain indemnification obligations of Sabio that may arise for a 15-month period from the date of acquisition. The Company classified the $1.5 million of cash as restricted cash. The Sabio indemnification period ended May 26, 2009; accordingly, the Company released the restricted cash at that time.
For a number of Magma's previously completed acquisitions, the Company has agreed to pay contingent considerations in cash and/or stock to former stockholders of the acquired companies based on the acquired business' achievement of certain technology or financial milestones. The following table summarizes the additions to goodwill and intangible assets recorded by the Company for contingent considerations paid or payable to former stockholders of the acquired companies (in thousands):
Year Ended | |||||||||||||||||||||||
May1, 2011 | May 2, 2010 | May 3, 2009 | |||||||||||||||||||||
Cash | Common Stock Value | Cash | Common Stock Value | Cash | Common Stock Value | ||||||||||||||||||
Goodwill: | |||||||||||||||||||||||
Sabio Labs, Inc | $ | 322 | $ | — | $ | 427 | $ | — | $ | 2,484 | $ | — | |||||||||||
Total goodwill additions | $ | 322 | $ | — | $ | 427 | $ | — | $ | 2,484 | $ | — | |||||||||||
Intangible assets: | |||||||||||||||||||||||
Mojave | $ | — | $ | — | $ | — | $ | — | $ | 920 | $ | 908 | |||||||||||
Other | 370 | — | 347 | — | 102 | — | |||||||||||||||||
Total intangible asset additions | $ | 370 | $ | — | $ | 347 | $ | — | $ | 1,022 | $ | 908 | |||||||||||
Total earnout consideration | $ | 692 | $ | — | $ | 774 | $ | — | $ | 3,506 | $ | 908 | |||||||||||
Note 7. Goodwill and Other Intangible Assets
The following table summarizes the components of goodwill, other intangible assets and related accumulated amortization balances, which were recorded as a result of business combinations and asset purchases (in thousands):
Weighted | May1, 2011 | May 2, 2010 | |||||||||||||||||||||||||||||||
Average Life (months) | Gross Carrying Amount | Goodwill Impairment | Accumulated Amortization | Net Carrying Amount | Gross Carrying Amount | Goodwill Impairment | Accumulated Amortization | Net Carrying Amount | |||||||||||||||||||||||||
Goodwill | $ | 7,415 | $ | — | $ | — | $ | 7,415 | $ | 7,093 | $ | — | $ | — | $ | 7,093 | |||||||||||||||||
Other intangible assets: | |||||||||||||||||||||||||||||||||
Developed technology | 43 | $ | 115,496 | $ | — | $ | (114,237 | ) | $ | 1,259 | $ | 115,436 | $ | — | $ | (112,897 | ) | $ | 2,539 | ||||||||||||||
Licensed technology | 40 | 42,356 | — | (41,480 | ) | 876 | 42,046 | — | (39,291 | ) | 2,755 | ||||||||||||||||||||||
Customer relationship or base | 70 | 5,575 | — | (4,505 | ) | 1,070 | 5,575 | — | (3,981 | ) | 1,594 | ||||||||||||||||||||||
Patents | 57 | 13,015 | — | (13,015 | ) | — | 13,015 | — | (13,004 | ) | 11 | ||||||||||||||||||||||
Acquired customer contracts | 33 | 1,390 | — | (1,089 | ) | 301 | 1,390 | — | (1,090 | ) | 300 | ||||||||||||||||||||||
Assembled workforce | 45 | 1,252 | — | (1,252 | ) | — | 1,252 | — | (1,248 | ) | 4 | ||||||||||||||||||||||
Non-competition agreements | 36 | 600 | — | (600 | ) | — | 600 | — | (572 | ) | 28 | ||||||||||||||||||||||
Trademark | 67 | 900 | — | (715 | ) | 185 | 900 | — | (644 | ) | 256 | ||||||||||||||||||||||
Total | $ | 180,584 | $ | — | $ | (176,893 | ) | $ | 3,691 | $ | 180,214 | $ | — | $ | (172,727 | ) | $ | 7,487 | |||||||||||||||
The increase in gross carrying amount of goodwill and intangible assets is the result of payment of contingent consideration discussed above.
Goodwill is reviewed annually or whenever events or circumstances occur which indicate that goodwill might be impaired. The Company uses a two-step approach to determining whether and by how much goodwill has been impaired. The process of evaluating the potential impairment of goodwill is highly subjective and requires significant judgment. In estimating the fair value of the Company, the Company made estimates and judgments about future revenues and cash flows for its reporting unit.
68
To determine the fair value of a reporting unit, the Company uses a market approach. Under the market approach, the fair value of the reporting unit is based on quoted market prices and the number of shares outstanding of the Company's common stock. The first step requires a comparison of the fair value of the Company (reporting unit) to its net book value. If the fair value is greater than net book value, no impairment is deemed to have occurred. If the fair value is less, then the second step must be performed to determine the amount, if any, of actual impairment. The Company uses the income method for the second step. The income method is based on a discounted future cash flow approach that uses estimates including the following for the reporting unit: revenue, based on assumed market growth rates and its assumed market share; estimated costs; and appropriate discount rates based on the particular business's weighted average cost of capital. The Company's estimates of market segment growth, market segment share and costs are based on historical data, various internal estimates and certain external sources, and are based on assumptions that are consistent with the plans and estimates it uses to manage the underlying business. The Company's business consists of both established and emerging technologies and its forecasts for emerging technologies are based upon internal estimates and external sources rather than historical information.
During fiscal 2011 and fiscal 2010, the Company conducted its annual goodwill impairment test at December 31, 2010 and December 31, 2009, respectively using the market approach for the first step. At December 31, 2010 and December 31, 2009, the Company determined that the fair value of its reporting unit is greater than the book value of the net assets of the reporting unit and therefore concluded there is no impairment of goodwill.
During fiscal 2009, the Company conducted its annual goodwill impairment test at December 31, 2008. The Company concluded that events had occurred and circumstances had changed during the third quarter of fiscal 2009 which showed the existence of impairment indicators, including a significant decline in the Company's stock price and continued deterioration in the EDA software products market and the related impact on revenue forecasts of the Company. Consistent with the Company's approach in its annual impairment testing, in assessing the fair value of the reporting unit, the Company considered both the market approach and income approach. At December 31, 2008, using the step one market approach, the Company determined that the fair value of its reporting unit was less than the book value of the net assets of the reporting unit and accordingly, the Company performed step two of the impairment test.
In step two of the impairment test, the Company determined the implied fair value of the goodwill and compared it to the carrying value of the goodwill. With the assistance of a third party valuation firm, the Company allocated the fair value of the reporting unit to all of its assets and liabilities as if the reporting unit had been acquired in a business combination and the fair value of the reporting unit was the price paid to acquire the reporting unit. The excess of the fair value of the reporting unit over the amount assigned to its assets and liabilities is the implied fair value of goodwill. The Company's step two analysis resulted in a reduction in fair value of goodwill and the Company therefore recognized an impairment charge of $60.1 million in fiscal 2009.
The Company has included the amortization expense on intangible assets that relate to products sold in cost of licenses revenue, while the remaining amortization is shown as a separate line item on the Company's consolidated statements of operations. The amortization expense related to intangible assets was as follows (in thousands):
Year Ended | |||||||||||
May1, 2011 | May 2, 2010 | May 3, 2009 | |||||||||
Amortization of intangible assets included in: | |||||||||||
Cost of revenue-licenses | $ | 2,491 | $ | 2,746 | $ | 18,680 | |||||
Cost of revenue-bundled licenses and services | 620 | 1,098 | 6,596 | ||||||||
Operating expenses | 1,055 | 1,134 | 2,994 | ||||||||
Total | $ | 4,166 | $ | 4,978 | $ | 28,270 | |||||
As of May1, 2011 the estimated future amortization expense of other intangible assets in the table above is as follows (in thousands):
Fiscal Year | Estimated Amortization Expense | ||
2012 | $ | 2,098 | |
2013 | 1,135 | ||
2014 | 294 | ||
2015 | 118 | ||
2016 | 46 | ||
Thereafter | — | ||
$ | 3,691 | ||
69
Note 8. | Restructuring Charge |
In fiscal 2009, the Company initiated a restructuring plan (“FY 2009 Restructuring Plan”) designed to improve its cost structure and to better align its resources and improve operating efficiencies. The Company recorded pre-tax restructuring charges of $1.2 million , $2.7 million and $10.7 million during fiscal 2011, fiscal 2010 and fiscal 2009, respectively, in connection with the FY 2009 Restructuring Plan. These costs relate to severance, expatriate relocation, facilities consolidation and termination, discontinued use of purchased software, and other costs related to the restructuring. The purchased software refers to the Company's legacy customer relationship management tool ("CRM tool"), which the Company is contractually obligated to license through January 30, 2012. Management determined the CRM tool was no longer providing any economic benefit and that the Company was still liable for the final payment on the contract. Accordingly, management recorded a restructuring liability and a restructuring expense of $0.7 million during fiscal 2011.
The cash payments associated with the net restructuring liability are expected to be paid through fiscal 2012. The restructuring liability activity was as follows (in thousands):
Severance | Relocation | Facilities and Other | Net Liability | ||||||||||||
Balance at May 2, 2010 | $ | 1,998 | $ | 9 | $ | 427 | $ | 2,434 | |||||||
Restructuring provision | 516 | (9 | ) | 693 | 1,200 | ||||||||||
Cash payments | (2,286 | ) | — | (579 | ) | (2,865 | ) | ||||||||
Balance at May 1, 2011 | $ | 228 | $ | — | $ | 541 | $ | 769 | |||||||
Note 9. | Convertible Notes |
The Company's 2% Convertible Senior Notes due 2010 (the “2010 Notes”) matured on May 15, 2010. These notes bore interest at 2% per annum, with interest payable on May 15 and November 15 of each year, commencing May15, 2007. During the first quarter of fiscal 2011, the Company paid the remaining principal balance and the outstanding interest on the 2010 Notes of approximately $23.2 million.
The 2010 Notes were convertible into shares of the Company's common stock at an initial conversion price of $15.00 per share, for an aggregate of approximately 1.55 million shares. The 2010 Notes were unsecured senior indebtedness of Magma, which ranked equally in right of payment to Magma's Wells Fargo credit facility and the 6% Convertible Senior Notes due 2014 (the “2014 Notes”) issued following the exchange offer described below. The 2010 Notes were effectively subordinated in right of payment to the Wells Fargo credit facility to the extent of the security interest held by Wells Fargo Bank in the assets of the Company. The Company had an option to redeem the 2010 Notes for cash in an amount equal to 100% of the aggregate outstanding principal amount at the time of such redemption. The 2010 Notes also contained a net share settlement provision that required the Company to deliver to a holder upon conversion of the holder's 2010 Notes cash equal to the lesser of $1,000 and the conversion value of the 2010 Notes, and in the event that the conversion value is in excess of $1,000 upon conversion of the 2010 Notes, cash or common stock at the Company's election.
On September 11, 2009, the Company completed an exchange offer pursuant to which an aggregate principal amount of $26.7 million of its 2010 Notes were exchanged for $26.7 million principal amount of newly issued 2014 Notes. Because the terms of the 2014 Notes were substantially different from the 2010 Notes, the exchange offer was treated as an extinguishment of the $26.7 million principal amount of the 2010 Notes. Following the exchange offer, the principal balance outstanding on the 2010 Notes was approximately $23.2 million. This amount was included in current liabilities. During the first quarter of fiscal 2011, the Company paid the remaining principal balance and the outstanding interest on the 2010 Notes of approximately $23.2 million. In connection with this repayment, the remaining balance of the debt discount and unamortized debt issuance costs related to the remaining 2010 Notes of $44,000 as of May 2, 2010 was written off to other income in the statement of operations.
The fair value of the 2014 Notes when issued in connection with the exchange offer described above was allocated between the fair market value of the 2010 Notes extinguished and the reacquisition of the equity component originally recognized upon issuance of the 2010 Notes. The Company initially recorded the 2014 Notes at fair value of $28.5 million, including a debt premium of $1.8 million. The debt premium is being amortized to interest expense over the term of the 2014 Notes. A total of $1.9 million of underwriting and legal fees related to the 2014 Notes offering was capitalized upon issuance and is being amortized over the term of the 2014 Notes using the effective interest method. An amount of $3.0 million was recorded for the reacquisition of the equity component related to the 2010 Notes as a reduction to additional paid-in-capital. During fiscal 2011, the Company recorded amortization of debt premium of $0.2 million and amortization of debt issuance costs of $0.2 million.
In fiscal 2010, the Company recognized a net gain of $0.3 million on the extinguishment of the 2010 Notes. The net gain is comprised of a $1.2 million gain on the difference between the fair market value of the 2014 Notes and the $26.7 million principal amount of the 2010 Notes that was extinguished, which is offset by the reacquisition of the equity component and the write-off of approximately $0.8 million and $0.1 million in debt discount and issuance costs, respectively, related to the 2010 Notes
70
exchanged.
The 2014 Notes mature on May 15, 2014 and bear interest at 6% per annum, with interest payable on May 15 and November 15 of each year, commencing May 15, 2010. The 2014 Notes are convertible into shares of the Company's common stock at an initial conversion price of $1.80 per share, for an aggregate of approximately 14.8 million shares. Upon conversion, the holders of the 2014 Notes will receive shares of common stock of the Company. Except in limited specific circumstances related to a change in control, holders will not receive a cash settlement; therefore, the Company is not required to separately account for the liability and equity components on the 2014 Notes. The 2014 Notes are unsecured senior indebtedness of Magma, which rank equally in right of payment to Magma's credit facility with Wells Fargo Capital Finance, LLC (see Note 10, “Term Loan and Revolving Loans”). The 2014 Notes are effectively subordinated in right of payment to the Wells Fargo credit facility to the extent of the security interest held by Wells Fargo Bank in the assets of the Company. After May 15, 2013, the Company has the option to redeem the 2014 Notes for cash in an amount equal to 100% of the aggregate outstanding principal amount at the time of such redemption.
During the first quarter of fiscal 2011, the Company repurchased an aggregate principal amount of $2.75 million of the 2014 Notes for $4.8 million in cash in private transactions. A loss on extinguishment of the 2014 Notes of $2.1 million is accounted for in the condensed consolidated statements of operations as “Loss on extinguishment of debt, notes due in 2014”.
During the second quarter of fiscal 2011, the Company engaged in separately negotiated transactions with certain holders of its 2014 Notes to convert outstanding 2014 Notes to common stock. Pursuant to those transactions, the holders converted an aggregate principal amount of $20.7 million of the 2014 Notes into 11.5 million shares of the Company's common stock. The 2014 Notes were converted at $1.80 per share per the initial indenture agreement at issuance. On conversion of the notes, the Company incurred $2.3 million in inducement fees, which are accounted for in the condensed statements of operations as “Inducement fees on conversion of notes due in 2014”. As of May 1, 2011, approximately $3.25 million of the 2014 Notes remained outstanding and are convertible into approximately 1.81 million shares of the Company's common stock.
Note 10. | Term Loan and Revolving Loans |
On March 19, 2010, the Company entered into a new four-year credit facility with Wells Fargo Capital Finance, LLC, (as amended, the “New Credit Facility”), which replaced the Company's $15.0 million secured revolving line of credit facility with Wells Fargo Bank, N.A. (the “Credit Facility”). The New Credit Facility provides for a revolving loan not to exceed $15.0 million and a term loan of $15.0 million (“Term Loan A”). The New Credit Facility is secured by a first priority interest in all of the Company's assets. The Term Loan A repayments are in equal quarterly installments of $0.6 million, beginning October 31, 2010.
The Company subsequently executed three amendments in order to clarify certain administrative and operational aspects of the New Credit Facility. The amendments were executed in June 2010, July 2010 and September 2010, respectively, and did not materially alter the terms and conditions of the New Credit Facility. In October 2010, the Company executed a fourth amendment, which expanded the New Credit Facility with an additional term loan of $10.0 million (“Term Loan B”) and extended the maturity date to October 2014. The repayments of Term Loan B principal amounts are in equal installments of $0.4 million beginning April 30, 2011.
Under the terms of the New Credit Facility, outstanding borrowings and letter of credit liabilities may not, at any time, exceed the greater of $40.0 million or 50% of all “post-contract support” revenues and “time based license fee” revenues for the preceding twelve-month period. These requirements could, but to date have not, limited the Company's borrowing availability.
The revolving loan and Term Loan A bear interest at either a LIBOR Rate or a Base Rate, at management's election, in each case determined as follows (plus a margin of 4.50 percentage points): (A) if at a LIBOR Rate, at a per annum rate equal to the LIBOR Rate of the greater of (i) 1.00% per annum and (ii) the one, two or three month LIBOR rate quoted by Bloomberg and (B) if at the Base Rate, the greatest of (i) the Federal Funds Rate plus 0.5%, (ii) the three month LIBOR Rate plus 1.0% and (iii) the Wells Fargo prime rate. Term Loan B bears interest at either a LIBOR Rate or a Base Rate, at management's election, in each case determined as follows (plus a margin of 3.00 percentage points): (A) if at a LIBOR Rate, at a per annum rate equal to the LIBOR Rate of the greater of (i) 1.00% per annum and (ii) the one, two or three month LIBOR rate quoted by Bloomberg and (B) if at the Base Rate the greatest of (i) the Federal Funds Rate plus 0.5%, (ii) the three month LIBOR Rate plus 1.0% and (iii) the Wells Fargo prime rate. In addition, the Company is required to pay fees of 0.5% per annum on the unused amount of the New Credit Facility, and 2.5% per annum for each letter of credit issued and quarterly administrative fees of $10,000.
The Company is required to pay interest and fees monthly, with the outstanding principal amount plus all accrued but unpaid interest and fees payable in full at the maturity date of October 29, 2014.
The New Credit Facility contains covenants that limit the Company's ability to create liens, merge, consolidate, dispose of assets, incur indebtedness and guarantees, repurchase or redeem capital stock and indebtedness, make certain investments, acquisitions and capital expenditures, enter into certain transactions with affiliates or change the nature of the Company's business. Events of default under the New Credit Facility include, but are not limited to, payment defaults, covenant defaults, breaches of representations and warranties, cross defaults to certain other material agreements and indebtedness, bankruptcy and other
71
insolvency events, actual or asserted invalidity of security interests or loan documents, and certain change of control events.
The New Credit Facility also restricts the Company's ability to pay dividends or make other distributions on the Company's stock and requires that the Company maintain certain financial conditions. As of May 1, 2011, the Company had borrowed $25.0 million of term debt and paid three installments of $0.6 million each totaling to $1.7 million on Term Loan A and one installment of $0.4 million on Term Loan B. As of May 1, 2011, the unused amount of revolving loan, net of accrued interest under the New Credit Facility, was $13.0 million. As of May 1, 2011, the Company was in compliance with the covenants contained in the New Credit Facility.
The New Credit Facility replaced a credit facility the Company entered into a credit facility with Wells Fargo Capital Finance , LLC, (the "Credit Facility") on October 31, 2008. As amended by the First Amendment dated March 11, 2009, the Second Amendment dated May 21, 2009, and the Third Amendment dated October 1, 2009, the Credit Facility (i) provided for a single revolving line of credit note of up to $15.0 million, which replaced the two previous $7.5 million revolving line of credit notes, (ii) eliminated the requirement that Magma maintain a minimum accounts receivable borrowing base and cash collateral, and (iii) extended the term of the line of credit to September 30, 2010. The note bore an annual interest rate equal to a fluctuating rate of 3.5% above the one month LIBOR rate on outstanding borrowings. The Credit Facility, among other things required that the Company provide certain financial statements to Wells Fargo, restricted the Company's ability to pay dividends or make other distributions on its stock and required that the Company maintain certain financial conditions.
Note 11. | Secured Line of Credit |
In October 2008, the Company obtained a secured line of credit with UBS in conjunction with the settlement agreement it entered into with UBS with respect to the Company's ARS. During the first quarter of fiscal 2011, the Company exercised its ARS put option and liquidated the $16.8 million of ARS and used part of the proceeds to repay its outstanding $11.2 million secured line of credit with UBS (see Note 3 “Fair Value of Financial Instruments”).
As amended January 22, 2009, the secured line of credit was a 100% Loan-to-Par Value No Net Cost loan program. Under this program, the interest rate was based on the lesser of either the weighted average ARS coupon rate or the published UBS Bank rate. This new rate applied to existing outstanding balances and new advances. The initial line of credit obtained in October 2008 was due on demand and allowed for borrowings of up to 75% of the market value of the ARS, as determined by UBS, pledged as collateral for the line of credit. Prior to January 22, 2009, advances under this agreement bore interest at LIBOR plus 1.0% with interest payments payable monthly.
Note 12. | Stockholders' Equity |
Stock Incentive Plans
2010 Stock Incentive Plan
The 2010 Stock Incentive Plan (“2010 Plan”) was approved by the stockholders in September 2010. Under the 2010 Plan, the Company, with the approval of the Compensation Committee of the Board of Directors (the “Committee”), or its delegates, may grant incentive stock options or non-qualified stock options to purchase common stock to employees, directors, advisors, and consultants. They may also be awarded stock appreciation rights ("SARs"), restricted stock, stock bonuses, stock units, performance share awards, and other cash or share-based awards based on the value of the common stock. The shares of common stock delivered under the 2010 Plan may be newly-issued shares or shares held by the Company as treasury stock. The maximum number of shares that may be delivered in connection with awards granted under the 2010 Plan equals (1) 9,810,093 shares (which is the sum of the 5,388,195 shares first authorized for issuance under the 2010 Plan plus the number of shares previously available for award grants under the Company's Amended and Restated 2001 Stock Incentive Plan (“2001 Plan”) that became available for award grants under the 2010 Plan when it was approved), plus (2) any shares covered by awards outstanding under the 2001 Plan on September 23, 2010 that are not issued (or that are forfeited back to the Company) because the related award expired or terminated without the award having been vested, exercised or paid, as the case may be. Among other limitations, the 2010 Plan also provides that a maximum of 1,000,000 shares may be subject to stock options and stock appreciation rights granted to any one individual in any calendar year. The Committee determines the exercise price per share; however, the exercise price of an incentive stock option cannot be less than 100% of the fair market value of the common stock on the option grant date (110% of the fair market value of the common stock on the option grant date for 10% stockholders). The term of the 2010 Plan continues until August 5, 2020 unless it is terminated earlier in accordance with its terms. As of May 1, 2011, there were options to purchase 8,447,013 shares outstanding under the 2010 Plan, and 8,955,807 shares were available for the grant of future options or other awards under the 2010 Plan.
2004 Employment Inducement Award Plan
The 2004 Employment Inducement Award Plan (“Inducement Plan”) was adopted by the Board of Directors on August 30, 2004. Under the Inducement Plan, the Company, with the approval of the Committee, was permitted to grant non-qualified stock options to new hire employees who are not executive officers of the Company as well as, restricted common shares, SARs or stock
72
unit awards. The Committee determined whether an award may be granted, the number of shares/options awarded, the date an award may be exercised, vesting and the exercise price. Each award was subject to an agreement between each applicable employee and the Company. The initial number of shares of common stock issuable under the Inducement Plan was 1,000,000 shares, subject to adjustment for certain changes in the Company's capital structure. On January 24, 2006, the Inducement Plan was amended by the Committee to increase the maximum aggregate number of options, SARs, stock units and restricted shares that may be awarded under the Inducement Plan to 2,000,000 shares. As of May 1, 2011, there were options to purchase 65,050 shares outstanding under the Inducement Plan, and no shares available for the grant of future options or other awards under the Inducement Plan. Subsequent to approval by the stockholders of the 2010 Incentive Plan, the Company's authority to grant new awards under the Inducement Plan terminated effective as of August 6, 2010.
2001 Stock Incentive Plan
The 2001 Plan was approved by the stockholders in August 2001. Under the 2001 Plan, the Company, with the approval of the Committee or its delegates, was permitted to grant incentive stock options or non-qualified stock options to purchase common stock to employees, directors, advisors, and consultants as well as restricted common shares, SARs or stock units based on the value of the common stock. The initial number of shares of common stock issuable under the 2001 Plan was 2,000,000 shares, subject to adjustment for certain changes in the Company's capital structure. As of January 1 of each year, commencing with January 1, 2002, the aggregate number of options, restricted awards, SARs, and stock units that could be awarded under the 2001 Plan automatically increased by a number equal to the lesser of 6% of the total number of fully diluted shares of common stock then outstanding, 6,000,000 shares of common stock, or any lesser number as is determined by the Board of Directors. The Committee determined the exercise price per share; however, the exercise price of an incentive stock option could not be less than 100% of the fair market value of the common stock on the option grant date, and the exercise price of a non-qualified stock option could not be less than the par value of the common stock subject to such non-qualified stock options.
As a result of 2010 Plan becoming effective, no shares of the Company's common stock are available for future issuance under the 2001 Plan. As of May 2, 2011, there were options to purchase 7,820,678 shares outstanding under the 2001 Plan.
1998 Stock Incentive Plan
In the fiscal year ended March 31, 1999, the Company adopted the 1998 Stock Incentive Plan (“1998 Plan”). Under the 1998 Plan, the Company was permitted to grant options to purchase common stock to employees, directors, and consultants. Options granted under the 1998 Plan were either incentive stock options or non-qualified stock options. The exercise price of incentive stock options and non-qualified stock options were no less than 100% and 85%, respectively, of the fair market value per share of the Company's common stock on the grant date (110% of fair market value in certain instances), as determined by the Board of Directors. Pursuant to the 1998 Plan, the Board of Directors also had the authority to set the term of the options (no longer than ten years from the date of grant, five years in certain instances). Under the terms of the 1998 Plan, the options become exercisable prior to vesting, and the Company has the right to repurchase such shares at their original purchase price if the optionee is terminated from service prior to vesting. Such rights expire as the options vest over the vesting period, which is generally four years. At May 1, 2011, there were no unvested shares subject to the Company's repurchase rights.
As a result of the 2001 Plan becoming effective, no shares of the Company's common stock are available for future issuance under the 1998 Plan. At May 1, 2011, there were options to purchase 52,285 shares outstanding under the 1998 Plan.
Employee Stock Purchase Plan
The amended and restated Employee Stock Purchase Plan (“Purchase Plan” or “ESPP”) was established in August 6, 2010, and was effective on December 1, 2010. Employees, including officers and employee directors but excluding 5% or greater stockholders, are eligible to participate if they are employed for more than 20 hours per week and five months in any calendar year. The Purchase Plan provides for a series of overlapping offering periods with a duration of 24 months, with new offering periods, beginning in March 1, June 1, September 1 and December 1 of each year and the purchase dates under the new offering periods would be the last day of February, May, August and November. The maximum number of shares a participant can purchase during a single accumulation is 2,500 shares. The Purchase Plan allows employees to purchase common stock through payroll deductions of up to 15% of their eligible compensation. Such deductions will accumulate over a three-month accumulation period without interest. After such accumulation period, shares of common stock will be purchased at a price equal to 85% of the fair market value per share of common stock on either the first day preceding the offering period or the last date of the accumulation period, whichever is less. During the year ended May 1, 2011 a total of 1,399,653 shares with an average price of $1.03 were issued under the original plan and a total of 1,474,708 shares with an average price of $1.17 were issued under the amended Purchase Plan. During fiscal 2010 and 2009 a total of 2,355,171 and 2,009,043 shares with an average price of $0.95 and $1.85 per share were issued under the original Purchase Plan.
A total of 5,200,000 common shares may be issued under the Purchase Plan after September 23, 2010. As of May1, 2011, a total of 3,725,292 shares of common stock remained available for issuance under the Purchase Plan.
Option Exchange Program
73
In fiscal 2009, the Company filed a Tender Offer Statement on Schedule TO with the SEC relating to an offer by the Company to exchange (the “Exchange Offer”) certain options to purchase up to an aggregate of 6,223,830 shares of the Company's Common Stock, whether vested or unvested, that were granted with an exercise price per share above $4.00. These eligible options could be exchanged for Restricted Stock Units (“RSUs”) upon the terms and subject to the conditions set forth in the Exchange Offer. The Company's executive officers, members of the Company's Board of Directors, and the Company's consultants were not eligible to participate in the Exchange Offer.
The Exchange Offer permitted eligible option holders to exchange eligible underwater options for a lesser number of RSUs. The exchange ratio was determined based on the pricing of the original option. The new RSUs have vesting terms based on the individual option holder's service history with the Company.
Options to purchase 5,374,016 shares of the Company's common stock at an average exercise price of $9.92 per share were exchanged for 1,813,303 RSUs. The option exercise prices ranged from $4.34 to $25.85 per share. The RSUs were issued on December 18, 2008 when the market price and the fair value was $0.98 per share of common stock. There is no exercise price for the RSUs. As of December 18, 2008, there was unamortized expense of $5.2 million remaining on the cancelled and unvested option shares.
With the assistance of a third party actuarial firm, the Company determined incremental value of the RSUs to be $1.4 million; therefore the total expense to be amortized over the vesting period of the RSUs is $6.6 million, or $3.66 per share.
Repurchase and Retirement of Common Stock
Effective January 31, 2011, the Company's Board of Directors approved an increase in the Company's stock buy-back program, authorizing the Company to purchase up to $30.0 million of its common stock, an increase in $10.0 million over the original authorization of $20.0 million announced in fiscal 2008.
During fiscal 2011, the Company used approximately $5.3 million to repurchase approximately 1,318,475 shares of its common stock in the open market. The repurchase prices ranged from $2.82 to $5.03 per share. The repurchased shares were retired immediately subsequent to the purchase.
Note 13. | Employee Benefit Plan |
Effective April 1, 1997, the Company adopted a plan (the “401(k) Plan”) that is intended to qualify under Section 401(k) of the Internal Revenue Code of 1986. The 401(k) Plan covers essentially all employees. Eligible employees may make voluntary contributions to the 401(k) Plan up to 100% of their annual eligible compensation, subject to limitations under IRS regulations. The Company is permitted to make contributions to the 401(k) Plan as determined by the Board of Directors. The Company has not made any contributions to the 401(k) Plan.
Note 14. | Stock-Based Compensation |
The stock-based compensation recognized in the consolidated statements of operations was as follows (in thousands):
Year Ended | |||||||||||
May1, 2011 | May 2, 2010 | May 3, 2009 | |||||||||
Cost of revenue | $ | 1,561 | $ | 1,569 | $ | 1,551 | |||||
Research and development expense | 4,627 | 4,598 | 7,405 | ||||||||
Sales and marketing expense | 3,769 | 3,964 | 5,280 | ||||||||
General and administrative expense | 3,136 | 3,745 | 4,915 | ||||||||
Total stock-based compensation expense | $ | 13,093 | $ | 13,876 | $ | 19,151 | |||||
The Company has adopted several stock incentive plans providing stock-based awards to employees, directors, advisors and consultants, including stock options, restricted stock and restricted stock units. The Company also has adopted the ESPP, which enables employees to purchase shares of the Company's common stock. Stock-based compensation expense recognized in the consolidated statements of operations by type of award in fiscal years 2011, 2010 and 2009, was as follows (in thousands):
Year Ended | |||||||||||
May1, 2011 | May 2, 2010 | May 3, 2009 | |||||||||
Stock options | $ | 2,429 | $ | 2,725 | $ | 6,279 | |||||
Restricted stock and restricted stock units | 6,522 | 7,479 | 9,594 | ||||||||
Employee stock purchase plan | 4,142 | 3,672 | 3,278 | ||||||||
Total stock-based compensation expense | $ | 13,093 | $ | 13,876 | $ | 19,151 | |||||
74
Stock Options and Employee Stock Purchase Plan
The Company uses the Black-Scholes option pricing model to determine the fair value of its stock options and ESPP awards. The Black-Scholes option pricing model incorporates various highly subjective assumptions, including expected future stock price volatility and expected terms of the instruments. The Company established the expected term for employee options and awards, as well as forfeiture rates, based on the historical settlement experience, while giving consideration to vesting schedules and to options that have life cycles less than the contractual terms. Assumptions for option exercises and pre-vesting terminations of options were stratified for employee groups with sufficiently distinct behavior patterns. Expected future stock price volatility was developed based on the average of the Company's historical weekly stock price volatility and average implied volatility. The risk-free interest rate for the period within the expected life of the option is based on the yield of United States Treasury notes at the time of grant. The expected dividend yield used in the calculation is zero as the Company has not historically paid dividends.
The assumptions used in the Black-Scholes model and the weighted average grant date fair value per share were as follows:
Year Ended | |||||||||||
May1, 2011 | May 2, 2010 | May 3, 2009 | |||||||||
Stock options: | |||||||||||
Expected life (years) | 3.89 | 3.23 | 3.56 | ||||||||
Volatility | 71 | % | 71-88% | 46-81% | |||||||
Risk-free interest rate | 0.67%-1.63% | 1.50-2.10% | 1.20-3.56% | ||||||||
Expected dividend yield | — | % | — | % | — | ||||||
Weighted average grant date fair value | $ | 2.22 | $ | 1.30 | $ | 0.79 | |||||
ESPP awards: | |||||||||||
Expected life (years) | 1.13 | 1.13 | 1.13 | ||||||||
Volatility | 71 | % | 71-88% | 45-81% | |||||||
Risk-free interest rate | 0.29%-0.71% | 0.29%-0.54% | 0.67-2.25% | ||||||||
Expected dividend yield | — | % | — | % | — | % | |||||
Weighted average grant date fair value | $ | 2.47 | $ | 0.88 | $ | 2.07 | |||||
As of May1, 2011, there was approximately $3.3 million of unrecognized stock-based compensation expense, net of estimated forfeitures, related to stock option grants, which will be recognized over the remaining weighted average vesting period of approximately 2.5 years.
As of May1, 2011, the Company had $4.0 million of total unrecognized compensation expense, net of estimated forfeitures, related to the ESPP, which will be recognized over the remaining weighted average vesting period of 1.13 years. Cash received from the purchase of shares under the ESPP was $3.2 million during fiscal 2011, $2.2 million during fiscal 2010 and $3.7 million during fiscal 2009.
A summary of the changes in stock options outstanding and exercisable under the Company's stock incentive plans during the fiscal years ended May1, 2011 and May 2, 2010 is as follows (in thousands, except year and per share amounts):
75
Number of Shares | Weighted Average Price per Share | Weighted Average Remaining Contractual Term (Years) | Aggregate Intrinsic Value | ||||||||||
Options outstanding at May 3, 2009 | 9,152 | $ | 6.73 | 3.74 | $ | 2,910 | |||||||
Granted | 1,228 | $ | 2.28 | ||||||||||
Exercised | (350 | ) | $ | 1.10 | |||||||||
Forfeited | (561 | ) | $ | 2.15 | |||||||||
Expired | (405 | ) | $ | 9.30 | |||||||||
Options outstanding at May 2, 2010 | 9,064 | $ | 6.51 | 3.00 | $ | 9,798 | |||||||
Granted | 997 | $ | 4.13 | ||||||||||
Exercised | (680 | ) | $ | 1.25 | |||||||||
Forfeited | (206 | ) | $ | 2.84 | |||||||||
Expired | (728 | ) | $ | 11.33 | |||||||||
Options outstanding at May 1, 2011 | 8,447 | $ | 6.33 | 2.73 | $ | 19,721 | |||||||
Vested and expected to vest at May 1, 2011 | 8,232 | $ | 6.40 | 2.30 | $ | 19,157 | |||||||
Exercisable at May 1, 2011 | 6,429 | $ | 7.40 | 2.38 | $ | 12,663 | |||||||
The total intrinsic value of options exercised was $2.5 million, $0.5 million and $17,000 during fiscal 2011, fiscal 2010 and fiscal 2009, respectively. Cash received from stock option exercises was $0.8 million in fiscal 2011, $0.4 million in fiscal 2010 and $0.1 million during fiscal 2009.
Restricted Stock and Restricted Stock Units
Restricted stock and restricted stock units were granted to employees at par value under the Company's stock incentive plans, or assumed in connection with an acquisition. In general, restricted stock and restricted stock unit awards vest over two to four years and are subject to the employees' continuing service to the Company.
The cost of restricted stock and restricted stock unit awards is determined using the fair value of the Company's common stock on the date of the grant, and compensation expense is recognized over the vesting period, which is generally one to four years.
A summary of the changes in restricted stock outstanding during the fiscal years ended May1, 2011 and May 2, 2010 is presented below (in thousands, except per share amounts):
Number of Shares | Weighted Average Grant Date Fair Value per Share | |||||
Shares nonvested at May 3, 2009 | 94 | $ | 11.33 | |||
Granted | — | $ | — | |||
Vested | (69 | ) | $ | 11.89 | ||
Forfeited | (20 | ) | $ | 9.65 | ||
Shares nonvested at May 2, 2010 | 5 | $ | 10.28 | |||
Granted | — | $ | — | |||
Vested | (5 | ) | $ | — | ||
Forfeited | — | $ | 10.28 | |||
Shares nonvested at May 1, 2011 | — | $ | — | |||
As of May1, 2011, the Company did not have any unrecognized stock-based compensation expense, net of estimated forfeitures, related to restricted stock awards.
A summary of the changes in restricted stock units outstanding during the fiscal years ended May1, 2011 and May 2, 2010 is presented below (in thousands, except per share amounts):
76
Number of Shares | Weighted Average Grant Date Fair Value per Share | |||||
Shares nonvested at May 3, 2009 | 2,148 | $ | 2.92 | |||
Granted | 2,633 | $ | 1.66 | |||
Vested | (2,733 | ) | $ | 2.31 | ||
Forfeited | (220 | ) | $ | 1.64 | ||
Shares nonvested at May 2, 2010 | 1,828 | $ | 2.17 | |||
Granted | 1,876 | $ | 3.48 | |||
Vested | (1,860 | ) | $ | 2.66 | ||
Forfeited | (179 | ) | $ | 2.02 | ||
Shares nonvested at May 1, 2011 | 1,665 | $ | 3.60 | |||
As of May1, 2011, there was $5.4 million of unrecognized stock-based compensation expense, net of estimated forfeitures, related to restricted stock unit awards, which will be recognized over the remaining weighted average vesting period of approximately 1.7 years.
The total fair value of restricted stock units that were vested was $7.9 million during fiscal 2011, $5.6 million during fiscal 2010 and $4.1 million during fiscal 2009.
Note 15. | Commitments and Contingencies |
Commitments
The Company leases its facilities under several non-cancelable operating leases expiring at various dates through December 2013. The Company also leases its computer equipment under several capital leases. Approximate future minimum lease payments under these operating and capital leases at May1, 2011 are as follows (in thousands):
Fiscal Year | Operating Leases | Capital Leases | Sublease Income | |||||||||
2012 | $ | 3.3 | $ | 1.3 | $ | (0.2 | ) | |||||
2013 | 1.2 | 1.3 | — | |||||||||
2014 | 0.3 | — | — | |||||||||
2015 | — | — | — | |||||||||
2016 | — | — | — | |||||||||
Thereafter | — | — | — | |||||||||
Total expected future commitments | $ | 4.8 | $ | 2.6 | $ | (0.2 | ) | |||||
The future minimum lease payments under capital leases includes $0.1 million of interest in each of fiscal years 2012 and 2013. Rent expense for the years ended May1, 2011, May 2, 2010 and May 3, 2009, was approximately $5.2 million, $5.7 million and $8.0 million, respectively.
Contingencies
The Company is subject to various legal proceedings and disputes that arise in the ordinary course of business from time to time. The number and significance of these legal proceedings and disputes may increase as the Company's size changes. Any claims against the Company, whether meritorious or not, could be time consuming, result in costly litigation, require significant amounts of management time and result in the diversion of significant operational resources. As a result, these legal proceedings and disputes could harm the Company's business and have an adverse effect on its consolidated financial statements. However, the results of any litigation or dispute are inherently uncertain and, as of May1, 2011, no estimate could be made of the loss or range of loss, if any, from such litigation matters and disputes. Liabilities are recorded when a loss is probable and the amount can be reasonably estimated. No accrued legal settlement liabilities are recorded on the consolidated balance sheets as of May1, 2011 or May 2, 2010. Litigation settlement and legal fees are expensed in the period in which they are incurred.
In Genesis Insurance Company v. Magma Design Automation, et al., Case No. 06-5526-JW, filed on September 8, 2006 in the United States District Court for the Northern District of California, Genesis seeks a declaration of its rights and obligations under an excess directors and officers liability policy for defense and settlement costs arising out of the securities class action against the Company, in re: Magma Design Automation, Inc. Securities Litigation, as well as a related derivative lawsuit. Genesis seeks a return of $5.0 million it paid towards the settlement of the securities class action and derivative lawsuits from the Company
77
or from another of the Company's excess directors and officers liability insurers, National Union. The Company contends that either Genesis or National Union owes the settlement amounts, but not the Company. The trial court granted summary judgment for the Company and National Union, finding that Genesis owed the settlement amount. Genesis appealed to the Ninth Circuit Court of Appeals, and the Company cross-appealed. On July 12, 2010, the Court of Appeals reversed, ruling that Genesis does not owe the settlement amount under its policy, and remanded the case to the trial court for further proceedings. On December 20, 2010, the trial court ruled on various cross-motions that National Union owes the settlement amount to Genesis. The court entered a judgment in favor of Genesis and the Company on March 2, 2011, requiring that National Union pays $5.0 million plus prejudgment interest to Genesis. On April 1, 2011 National Union appealed the trial court's judgment to the Ninth Circuit Court of Appeals. The opening brief of National Union is due by July 11, 2011. While there can be no assurance as to the ultimate disposition of the litigation, the Company does not believe that its resolution will have a material adverse effect on the Company's financial position, results of operations or cash flows.
Indemnification Obligations
The Company enters into standard license agreements in the ordinary course of business. Pursuant to these agreements, the Company agrees to indemnify its customers for losses suffered or incurred by them as a result of any patent, copyright, or other intellectual property infringement claim by any third party with respect to the Company's products. These indemnification obligations continue over the agreements' software license period, and are perpetual in some instances. The Company's normal business practice is to limit the maximum amount of indemnification to the amount received from the customer. On occasion, the maximum amount of indemnification the Company may be required to provide may exceed the amount received from the customer. The Company estimates the fair value of its indemnification obligations to be insignificant, based upon its historical experience concerning product and patent infringement claims. Accordingly, the Company has no liabilities recorded for indemnification under these agreements as of May1, 2011.
The Company has agreements whereby its officers and directors are indemnified for certain events or occurrences while the officer or director is, or was, serving at the Company's request in such capacity. The maximum potential amount of future payments the Company could be required to make under these indemnification agreements is unlimited; however, the Company has a directors' and officers' liability insurance policy that reduces its exposure and enables the Company to recover a portion of future amounts paid. As a result of the Company's insurance policy coverage, the Company believes the estimated fair value of these indemnification agreements is minimal. Accordingly, no liabilities have been recorded for these agreements as of May1, 2011.
In connection with certain of the Company's recent business acquisitions, the Company has also agreed to assume, or cause its subsidiaries to assume, the indemnification obligations of those companies to their respective officers and directors. No liabilities have been recorded for these agreements as of May1, 2011.
Warranties
The Company offers certain customers a warranty that its products will conform to the documentation provided with the products. To date, there have been no payments or material costs incurred related to fulfilling these warranty obligations. Accordingly, the Company has no liabilities recorded for these warranties as of May1, 2011. The Company assesses the need for a warranty accrual on a quarterly basis, and there can be no guarantee that a warranty accrual will not become necessary in the future.
Note 16. | Segment Information |
The Company reports segment information using the “management approach.” Under this approach, operating segments are identified in substantially the same manner as they are reported internally and used by the Company's chief operating decision maker (“CODM”) for purposes of evaluating performance and allocating resources. Based on this approach, the Company has one reportable segment as the CODM reviews financial information on a basis consistent with that presented in the consolidated financial statements.
Revenue from North America, Europe, Japan and the Asia Pacific region, which includes India, South Korea, Taiwan, Hong Kong and the People's Republic of China, was as follows (in thousands, except for percentages shown):
78
Year Ended | |||||||||||
May1, 2011 | May 2, 2010 | May 3, 2009 | |||||||||
North America* | $ | 90,321 | $ | 72,100 | $ | 86,576 | |||||
Europe | 10,818 | 12,927 | 17,893 | ||||||||
Japan | 14,844 | 14,637 | 24,975 | ||||||||
Asia-Pacific (excluding Japan) | 23,303 | 23,413 | 17,513 | ||||||||
$ | 139,286 | $ | 123,077 | $ | 146,957 | ||||||
Year Ended | |||||||||||
May1, 2011 | May 2, 2010 | May 3, 2009 | |||||||||
North America* | 65 | % | 59 | % | 59 | % | |||||
Europe | 8 | % | 10 | % | 12 | % | |||||
Japan | 10 | % | 12 | % | 17 | % | |||||
Asia-Pacific (excluding Japan) | 17 | % | 19 | % | 12 | % | |||||
100 | % | 100 | % | 100 | % | ||||||
* Substantially all of the Company's North America revenue related to the United States for all periods presented.
For the fiscal years ended 2011, 2010 and 2009, the Company had no customers representing 10% or more of total revenue.
The Company has substantially all of its long-lived assets located in the United States.
Note 17. | Income Taxes |
Income tax expense (benefit) consisted of the following (in thousands):
Year Ended | |||||||||||
May1, 2011 | May 2, 2010 | May 3, 2009 | |||||||||
Current: | |||||||||||
Federal | $ | (21 | ) | $ | (280 | ) | $ | (228 | ) | ||
State | 13 | 14 | (113 | ) | |||||||
Foreign | 1,113 | (6,602 | ) | 1,549 | |||||||
Total current | 1,105 | (6,868 | ) | 1,208 | |||||||
Deferred: | |||||||||||
Foreign | (248 | ) | 126 | (444 | ) | ||||||
Total income tax expense (benefit) | $ | 857 | $ | (6,742 | ) | $ | 764 | ||||
Net loss before provision (benefit) for income taxes consisted of (in thousands):
Fiscal Year Ended | |||||||||||
May1, 2011 | May 2, 2010 | May 3, 2009 | |||||||||
United States | $ | (4,016 | ) | $ | (20,270 | ) | $ | (148,538 | ) | ||
International | 1,611 | 10,194 | 20,060 | ||||||||
Total net loss before provision (benefit) for income taxes | $ | (2,405 | ) | $ | (10,076 | ) | $ | (128,478 | ) | ||
Income tax expense (benefit) differed from the amounts computed by applying the U.S. federal income tax rate of 35% to pretax loss as a result of the following (in thousands):
79
Fiscal Year Ended | |||||||||||
May1, 2011 | May 2, 2010 | May 3, 2009 | |||||||||
Federal tax benefit at statutory rate | $ | (842 | ) | $ | (3,527 | ) | $ | (44,445 | ) | ||
Permanent differences | 6,184 | 12,262 | 6,868 | ||||||||
Goodwill and intangibles | — | — | 25,157 | ||||||||
State tax, net of federal benefit | (271 | ) | (485 | ) | (5,336 | ) | |||||
Foreign tax withholding, not benefited for U.S. tax purposes | 400 | 520 | 539 | ||||||||
Foreign tax rate differential | (99 | ) | (10,621 | ) | (6,475 | ) | |||||
Credits | (2,001 | ) | (5,140 | ) | 3,259 | ||||||
Change in valuation allowance | (2,517 | ) | 429 | 21,292 | |||||||
Other | 3 | (180 | ) | (95 | ) | ||||||
Total income tax expense (benefit) | $ | 857 | $ | (6,742 | ) | $ | 764 | ||||
The Company has not provided for U.S. income taxes on undistributed earnings of a majority of its foreign subsidiaries because it intends to permanently re-invest these earnings outside the U. S. The cumulative amount of such undistributed earnings upon which no U.S. income taxes have been provided as of May1, 2011 and May 2, 2010 was approximately $8.5 million and $9.9 million, respectively.
In fiscal 2010, the Company received new information related to its unrecognized tax benefit related to withholding taxes in South Korea. This information was not available to the Company in previous financial reporting periods and was considered new information for purposes of assessing the Company's uncertain tax positions as required. The Company considered this new information collectively with all other information available and concluded that it was more-likely-than-not the licenses revenue sourced in South Korea is not subject to withholding tax, and therefore, that the full amount of the tax position will ultimately be realized. Accordingly, a $7.8 million tax benefit related to South Korean withholding tax was recognized as a benefit from income taxes in the consolidated statements of operations, and a corresponding decrease in the long term tax liabilities in the consolidated balance sheets at May 2, 2010. The recognition of the tax benefit does not have any current period or future period cash impact.
The types of temporary differences that give rise to significant portions of the Company's deferred tax assets and liabilities are as follows (in thousands):
May1, 2011 | May 2, 2010 | ||||||
Deferred tax assets: | |||||||
Capitalized costs | $ | 1,404 | $ | 1,544 | |||
Accrued liabilities | 10,101 | 5,692 | |||||
Property and equipment | 7,899 | 7,976 | |||||
Accrued compensation related expenses | 8,578 | 7,778 | |||||
Net operating loss and credit carryforwards | 52,821 | 61,374 | |||||
Litigation settlement | 2,137 | 2,364 | |||||
Other | 634 | 319 | |||||
Gross deferred tax assets | 83,574 | 87,047 | |||||
Valuation allowance | (81,928 | ) | (84,446 | ) | |||
Total deferred tax assets | 1,646 | 2,601 | |||||
Acquired intangible assets | (1,078 | ) | (1,814 | ) | |||
Unrealized foreign exchange | — | (468 | ) | ||||
Net deferred tax assets | $ | 568 | $ | 319 | |||
As of May1, 2011, the Company had net operating loss carry-forwards for federal and state income tax purposes of approximately $162.8 million and $59.9 million, respectively, available to reduce future income subject to income taxes. The federal and state net operating loss carry-forwards will begin to expire in 2019 and 2012, respectively. The Company also has research credit carry-forwards for federal and California tax purposes of approximately $20.2 million and $18.4 million, respectively, available to reduce future income subject to income taxes. The federal research credit carry-forwards will begin to expire in 2012 and the California research credits carry forward indefinitely.
The Company's management believes that, based on a number of factors, it is more likely than not, that all or some portion of the deferred tax assets will not be realized; and accordingly, for the year ended May1, 2011, the Company has provided a v
80
aluation allowance against the Company's U.S. net deferred tax assets. The net change in the valuation allowance was a decrease of $2.5 million and an increase of $0.4 million for the years ended May1, 2011, and May 2, 2010, respectively.
The Company is currently under examination by certain foreign tax authorities. At the present time, it is difficult to predict the results of the tax examination and the timing of the final resolution. The Company's management does not believe that the outcome of this examination would have a material impact to its financial statements. The Company's larger jurisdictions provide a statute of limitations ranging from three to six years. In the U.S., the statute of limitations remains open for fiscal years 2004 and forward.
As of May1, 2011, the Company had approximately $20.6 million of total gross unrecognized tax benefits, of which $1.4 million, if recognized, would favorably affect its effective tax rate in future periods and $1.6 million, if recognized, would result in a credit to additional paid-in capital. The remaining $17.6 million of unrecognized tax benefits, if recognized, would result in an increase in deferred tax assets. However, the Company currently has a full valuation allowance against its U.S. net deferred tax assets which would impact the timing of the effective tax rate benefit should any of such uncertain tax positions be favorably settled in the future.
The Company has adopted the accounting policy that interest and penalties recognized are classified as part of its income taxes. In fiscal 2011, the Company recorded a reversal of $(0.1) million of such interest and penalty expense and as of May1, 2011 the balance of such accrued interest and penalty was $0.3 million.
The following table shows the changes in the gross amount of unrecognized tax benefits as of May1, 2011 (in thousands):
Balance as of May 2, 2010 | $ | 18,404 | |
Gross amount of increases in unrecognized tax benefits for tax positions taken in current year | 1,945 | ||
Gross amount of increases in unrecognized tax benefits for tax positions taken in prior year | 637 | ||
Decreases in unrecognized tax benefits resulting from the lapse of statute of limitation | (356 | ) | |
Balance as of May 1, 2011 | $ | 20,630 | |
The Company does not anticipate that its total unrecognized tax benefits will significantly change due to settlement of examination or the expiration of statute of limitation during the next twelve months.
Note 18. | Related Party Transactions |
In fiscal 2004, the Company began leasing a building for its corporate headquarters from one of its customers under a seven-year lease agreement. The lease was amended in February 2007. In March 2010, the lease was extended for an additional three years. The lease expires in fiscal 2014. In fiscal 2011, 2010 and 2009, the Company recorded $0.9 million, $0.7 million and $0.9 million, respectively, of rent expense and recognized $6.7 million, $6.7 million and $8.1 million from the sale of software licenses to this customer. Accounts receivable from the customer were $2,181 and $1,667 at May 1, 2011 and May 2, 2010
A member of the Company's Board of Directors also serves as a Board member for a customer of Magma. Magma recognized revenue from the sale of software licenses to this customer representing 3% for fiscal 2011 and 0% each for fiscal 2010 and 2009, respectively.
Note 19. | Subsequent Events |
Subsequent to year end, the Company began an investigation, overseen by the Audit Committee of the Board of Directors, of whistleblower allegations related to business expense reimbursements, executive and other employee compensation, and restructuring costs. The investigation was concluded in the first quarter of fiscal 2012. As further discussed in Item 9A of this Form 10-K, certain deficiencies in the Company's internal control over financial reporting (as defined in Exchange Act Rule 13a-15(f)) were revealed. In conducting the investigation, the Company has incurred legal and administrative costs, currently estimated to be between $1.6 million and $1.8 million, which will be included in general and administrative expense in the first quarter of fiscal 2012.
Selected Consolidated Quarterly Financial Data (Unaudited)
The following table presents selected unaudited consolidated financial data for each of the eight quarters in the two-year period ended May1, 2011. In the Company's opinion, this unaudited information has been prepared on the same basis as the audited information and includes all adjustments (consisting of only normal recurring adjustments) necessary for a fair statement of the financial information for the period presented.
81
Quarter | |||||||||||||||
First | Second | Third | Fourth | ||||||||||||
FY 2011 | |||||||||||||||
Revenue | $ | 32,556 | $ | 33,926 | $ | 34,765 | $ | 38,039 | |||||||
Gross profit | $ | 27,814 | $ | 28,863 | $ | 29,862 | $ | 33,304 | |||||||
Net income (loss) | $ | (3,258 | ) | $ | (2,714 | ) | $ | 961 | $ | 1,749 | |||||
Net income (loss) per share—Basic(1) | $ | (0.06 | ) | $ | (0.04 | ) | $ | 0.01 | $ | 0.03 | |||||
Net income (loss) per share—Diluted(1) | $ | (0.06 | ) | $ | (0.04 | ) | $ | 0.01 | $ | 0.02 | |||||
Quarter | |||||||||||||||
First | Second | Third | Fourth | ||||||||||||
FY 2010 | |||||||||||||||
Revenue | $ | 28,841 | $ | 29,662 | $ | 30,965 | $ | 33,609 | |||||||
Gross profit | $ | 24,004 | $ | 24,481 | $ | 25,763 | $ | 28,276 | |||||||
Net income (loss) | $ | (4,312 | ) | $ | 4,344 | $ | (2,638 | ) | $ | (728 | ) | ||||
Net income (loss) per share—Basic(1) | $ | (0.09 | ) | $ | 0.09 | $ | (0.05 | ) | $ | (0.01 | ) | ||||
Net income (loss) per share—Diluted(1) | $ | (0.09 | ) | $ | 0.08 | $ | (0.05 | ) | $ | (0.01 | ) | ||||
(1) Earnings per share is computed independently for each of the quarters presented. The sum of the quarterly earnings per share in fiscal 2011and 2010 does not equal the total computed for the year due to rounding.
82
Schedule II-Valuation and Qualifying Accounts
Years Ended May1, 2011, May 2, 2010 and May 3, 2009
(in thousands, except per share data)
Balance at Beginning of Period | Additions Charged to Costs and Expenses | Write-offs, Net of Recoveries | Balance at End of Period | ||||||||||
Year ended May 1, 2011 | |||||||||||||
Allowance for doubtful accounts | $ | 17 | 205 | (63 | ) | $ | 159 | ||||||
Year ended May 2, 2010 | |||||||||||||
Allowance for doubtful accounts | $ | 191 | 76 | (250 | ) | $ | 17 | ||||||
Year ended May 3, 2009 | |||||||||||||
Allowance for doubtful accounts | $ | 376 | 1,124 | (1,309 | ) | $ | 191 | ||||||
ITEM 9. | CHANGES IN AND DISAGREEMENTS WITH ACCOUNTANTS ON ACCOUNTING AND FINANCIAL DISCLOSURE |
We expect to hold our 2011 Annual Meeting of Stockholders on October 20, 2011.
ITEM 9A. | CONTROLS AND PROCEDURES |
Evaluation of Disclosure Controls and Procedures.
Under the supervision and with the participation of our management, including our principal executive officer and principal financial officer, we conducted an evaluation of the effectiveness of the design and operation of our disclosure controls and procedures, as defined in Rules 13a-15(e) and 15d-15(e) under the Securities Exchange Act of 1934, as amended (the “Exchange Act”), as of the end of the period covered by this report (the “Evaluation Date”). Based on that evaluation, our principal executive officer and principal financial officer concluded that, as of the Evaluation Date, our disclosure controls and procedures were effective. In arriving at this conclusion, management considered the results of the investigation overseen by the Audit Committee of the Board of Directors, of whistleblower allegations related to business expense reimbursements, executive and other employee compensation, and restructuring costs. The investigation was concluded in the first quarter of fiscal 2012. The investigation was conducted by independent legal and accounting firms hired by the Audit Committee. During the investigation certain deficiencies in the Company's internal control over financial reporting (as defined in Exchange Act Rule 13a-15(f)) were revealed.
Management's Report on Internal Control over Financial Reporting.
Our management is responsible for establishing and maintaining adequate internal control over financial reporting (as defined in Rules 13a-15(f) and 15d-15(f) under the Exchange Act). Under the supervision and with the participation of the Company's management, including our principal executive officer and principal financial officer, we assessed the effectiveness of our internal control over financial reporting as of the Evaluation Date. In making this assessment, management used the criteria set forth by the Committee of Sponsoring Organizations of the Treadway Commission (“COSO”) in Internal Control-Integrated Framework. Based on our assessment using those criteria, management concluded that our internal control over financial reporting was effective as of the Evaluation Date. In arriving at this conclusion, management considered the results of the investigation overseen by the Audit Committee of the Board of Directors. The investigation was conducted by independent legal and accounting firms hired by the Audit Committee. During the investigation certain deficiencies in the Company's internal control over financial reporting (as defined in Exchange Act Rule 13a-15(f)) were revealed. It was determined that deficiencies exist in the internal controls related to business expense reimbursements, the allocation of bonuses, and our whistleblower process.
Because of inherent limitations, internal control over financial reporting may not prevent or detect all misstatements. Also, projections of any evaluation of effectiveness to future periods are subject to the risk that controls may become inadequate because of changes in conditions, or that the degree of compliance with the policies or procedures may deteriorate.
Our independent registered public accounting firm has issued an attestation report on the effectiveness of our internal control over financial reporting. This report appears under Item 8 of this Form 10-K.
Changes in Internal Control over Financial Reporting. In the course of our investigation, certain deficiencies in the Company's internal control over financial reporting (as defined in Exchange Act Rule 13a-15(f)) (“internal controls”) were revealed. We are reviewing the relevant internal controls and related compliance policies and procedures for remediation, including the review, expansion and formalization of policies relating to expense reports and reimbursement procedures and the enhancement of training of employees regarding compliance with these and other policies. We are in the process of determining and intend to implement, changes to relevant internal controls. However, there were no changes in our internal control over financial reporting that occurred during our last fiscal quarter that have materially affected, or are reasonably likely to materially affect, our internal
83
control over financial reporting.
ITEM 9B. | OTHER INFORMATION |
Not applicable.
84
PART III
ITEM 10. | DIRECTORS, EXECUTIVE OFFICERS AND CORPORATE GOVERNANCE |
Information required by this item relating to our directors and our compliance with Section 16(a) of the Exchange Act will be presented under the captions “Magma's Board of Directors -- Director Independence,” “Magma's Board of Directors -- Board Committees and Charters,” “Election of Directors,” "Executive Officers" and “Section 16(a) Beneficial Ownership Reporting Compliance” in our definitive proxy statement to be filed with the SEC and mailed to our stockholders in connection with our 2011 Annual Meeting of Stockholders to be held on October 20, 2011 (“2011 Definitive Proxy Statement”). That information is incorporated into this report by reference.
We have adopted a Code of Conduct and Ethics that applies to all of our directors and employees, including our principal executive officer, principal financial officer, controller. This Code of Conduct and Ethics is posted on our website at http://investor.magma-da.com/governance.cfm. If applicable, we intend to satisfy our disclosure obligations regarding our amendment to, or waiver from, a provision of this Code of Conduct and Ethics that applies to our directors, principal executive officer, principal financial officer, controller or persons performing similar functions by posting such information on our website at http://investor.magma-da.com/governance.cfm.
ITEM 11. | EXECUTIVE COMPENSATION |
Information relating to executive compensation will be presented under the caption “Executive Compensation” in our 2011 Definitive Proxy Statement. That information is incorporated into this report by reference.
ITEM 12. | SECURITY OWNERSHIP OF CERTAIN BENEFICIAL OWNERS AND MANAGEMENT AND RELATED STOCKHOLDER MATTERS |
Information relating to the security ownership of our common stock by our management and other beneficial owners will be presented under the caption “Security Ownership of Certain Beneficial Owners and Management” in our 2011 Definitive Proxy Statement. That information is incorporated into this report by reference. Information relating to securities authorized for issuance under equity compensation plans will be presented under the caption “Equity Compensation Plan Information” in our 2011 Definitive Proxy Statement. That information is incorporated into this report by reference.
ITEM 13. | CERTAIN RELATIONSHIPS AND RELATED TRANSACTIONS AND DIRECTOR INDEPENDENCE |
Information required by this Item 13 is incorporated by reference from the information contained under the captions “Magma's Board of Directors - Director Independence” and “Certain Relationships and Related Transactions” in our 2011 Definitive Proxy Statement.
ITEM 14. | PRINCIPAL ACCOUNTANT FEES AND SERVICES |
The information required by this item is incorporated by reference from the information contained under the caption “Ratification of Independent Registered Public Accountants-Audit and Non-Audit Fees” and “Ratification of Independent Registered Public Accountants--Pre-Approval Policies and Procedures” contained in our 2011 Definitive Proxy Statement.
85
PART IV
ITEM 15. | EXHIBITS AND FINANCIAL STATEMENT SCHEDULES |
(a) | The following documents are filed as part of this report on Form 10-K: |
(1) | Consolidated Financial Statements. Reference is made to the Index to Registrant's Consolidated Financial Statements under Item 8 in Part II of this Form 10-K. |
(2) | Financial Statement Schedules. Reference is made to the Index to Registrant's Consolidated Financial Statements under Item 8 in Part II of this Form 10-K. |
(3) | Exhibits. Reference is made to Item 15(b) below. |
(b) | Exhibits. |
The exhibit list in the Exhibit Index is incorporated herein by reference as the list of exhibits required as part of this item.
(c) | Financial statements schedules. |
Reference is made to Item 15(a)(2) above.
86
SIGNATURES
Pursuant to the requirements of Section 13 or 15(d) of the Securities Exchange Act of 1934, the registrant has duly caused this report to be signed on its behalf by the undersigned, thereunto duly authorized.
Dated: July 14, 2011
MAGMA DESIGN AUTOMATION, INC. | |
By | /s/ Rajeev Madhavan |
Rajeev Madhavan, Chief Executive Officer | |
By | /s/ Peter S.Teshima |
Peter S. Teshima, Corporate Vice President, Finance and Chief Financial Officer | |
Pursuant to the requirements of the Securities Exchange Act of 1934, this report has been signed below by the following persons on behalf of the Registrant and in the capacities and on the dates indicated.
Name | Title | Date | ||
/s/ Rajeev Madhavan | Chief Executive Officer and Director (Principal Executive Officer) | July 14, 2011 | ||
Rajeev Madhavan | ||||
/s/ Peter S. Teshima | Corporate Vice President, Finance and Chief Financial Officer (Principal Financial Officer and Principal Accounting Officer) | July 14, 2011 | ||
Peter S. Teshima | ||||
/s/ Roy E. Jewell | President, Chief Operating Officer and Director | July 14, 2011 | ||
Roy E. Jewell | ||||
/s/ Kevin C. Eichler | Director | July 14, 2011 | ||
Kevin C. Eichler | ||||
/s/ Govind Kizhepat | Director | July 14, 2011 | ||
Govind Kizhepat | ||||
/s/ Susumu Kohyama | Director | July 14, 2011 | ||
Susumu Kohyama | ||||
/s/ Thomas Rohrs | Director | July 14, 2011 | ||
Thomas Rohrs | ||||
/s/ David Sugishita | Director | July 14, 2011 | ||
David Sugishita | ||||
87
EXHIBIT INDEX
Incorporated by Reference | ||||||
Exhibit Number | Exhibit Description | Form | File No. | Exhibit | Filing Date | Filed Herewith |
2.1 | Agreement and Plan of Merger Dated as of December 20, 2007 by and among Magma Design Automation, Inc., Sabio Labs, Inc., Sabio Acquisition Corp., Sabio Labs, LLC and David Colleran, as Representative | 8-K | 000-33213 | 2.1 | February 27, 2008 | |
3.1 | Amended and Restated Certificate of Incorporation | 10-K | 000-33213 | 3.1 | June 28, 2002 | |
3.2 | Certificate of Correction to the Amended and Restated Certificate of Incorporation | 10-K | 000-33213 | 3.2 | June 28, 2002 | |
3.3 | Amended and Restated Bylaws | 10-K | 000-33213 | 3.3 | June 28, 2002 | |
4.1 | Form of Common Stock Certificate | S-1/A | 333-60838 | 4.1 | November 15, 2001 | |
4.2 | Form of Registration Rights Agreement, dated March 5, 2007, by and between Magma Design Automation, Inc. and certain other parties thereto | 8-K | 000-33213 | 10.2 | March 5, 2007 | |
4.3 | Indenture, dated as of September 11, 2009, between Magma Design Automation, Inc. and U.S. Bank National Association, as Trustee. | 8-K | 000-33213 | 4.1 | September 15, 2009 | |
10.1# | 2010 Stock Incentive Plan | DEF 14 A | 000-33213 | A | August 11, 2010 | |
10.2# | 2010 Stock Option Incentive Agreement | 10Q | 000-33213 | 10.3 | December 9, 2010 | |
10.3# | 2010 Restricted Stock Unit Agreement | 10Q | 000-33213 | 10.4 | December 9, 2010 | |
10.4# | 2001 Stock Incentive Plan, as amended | 10-K | 000-33213 | 10.1 | June 16, 2008 | |
10.5# | 2001 Stock Incentive Plan-Form Notice of Grant of Stock Options for Executive Officers | 10-Q | 000-33213 | 10.2 | November 14, 2005 | |
10.6# | 2001 Stock Incentive Plan-Form of Notice of Grant of Stock Options and Stock Option Agreement | 10-K | 000-33213 | 10.21 | June 16, 2008 | |
10.7# | 2001 Stock Incentive Plan-Form of Notice of Grant of Award and Stock Unit Agreement | 10-K | 000-33213 | 10.22 | June 16, 2008 | |
10.8# | 2001 Stock Incentive Plan-Form of Notice of Grant of Award and Restricted Share Agreement | 10-K | 000-33213 | 10.23 | June 16, 2008 | |
10.9# | 2001 Stock Incentive Plan-Form of Notice of Stock Option Award and Stock Option Agreement (U.S. employees) for replacement options in connection with the Registrant's Offer to Exchange Outstanding Options to Purchase Common Stock, dated June 27, 2005 (as amended August 5, 2005) | SC TO-I/A | 005-77999 | 99(a)(10)(A) | August 5, 2005 | |
10.10# | 2001 Stock Incentive Plan-Form of Notice of Stock Option Award and Stock Option Agreement (for international employees other than those residing in China, Israel, India and the United Kingdom) for replacement options in connection with the Registrant's Offer to Exchange Outstanding Options to Purchase Common Stock, dated June 27, 2005 (as amended August 5, 2005) | SC TO-I/A | 005-77999 | 99(a)(10)(B) | August 5, 2005 | |
10.11# | 2001 Stock Incentive Plan-Form of Notice of Stock Option Award and Stock Option Agreement (for employees residing in China, Israel and India) for replacement options in connection with the Registrant's Offer to Exchange Outstanding Options to Purchase Common Stock, dated June 27, 2005 (as amended August 5, 2005) | SC TO-I/A | 005-77999 | 99(a)(10)(C) | August 5, 2005 | |
88
10.12# | 2001 Stock Incentive Plan-Form of Notice of Stock Option Award and Stock Option Agreement (for employees residing in the United Kingdom) for replacement options in connection with the Registrant's Offer to Exchange Outstanding Options to Purchase Common Stock, dated June 27, 2005 (as amended August 5, 2005) | SC TO-I/A | 005-77999 | 99(a) | August 5, 2005 | |
10.13# | 2001 Stock Incentive Plan-Form of restricted stock unit agreement (for U.S. employees) | SC TO-I/A | 005-77999 | 99(a)(1)(G) | November 20, 2008 | |
10.14# | 2001 Stock Incentive Plan-Form of restricted stock unit agreement (for non-U.S. employees) | SC TO-I/A | 005-77999 | 99(a)(1)(H) | November 20, 2008 | |
10.15# | 2001 Stock Incentive Plan-Forms of stock option agreement (non-U.S. employees) | SC TO-I/A | 005-77999 | 99(d)(10) | November 20, 2008 | |
10.16# | 2001 Employee Stock Purchase Plan, as amended | 10-K | 000-33213 | 10.3 | June 16, 2008 | |
10.17# | 2004 Employment Inducement Award Plan, as amended | 8-K | 000-33213 | 10.1 | January 30, 2006 | |
10.18# | 2004 Employee Inducement Award Plan-Forms of stock option agreement | SC TO-I/A | 005-77999 | 99(d)(12) | November 20, 2008 | |
10.19# | 1998 Stock Incentive Plan | S-1 | 333-60838 | 10.4 | May 14, 2001 | |
10.20# | 1998 Stock Incentive Plan-Form of stock option agreement | S-1/A | 333-60838 | 10.10 | August 14, 2001 | |
10.21# | 1998 Stock Incentive Plan-Form of Amendment to Stock Option Agreement | S-1/A | 333-60838 | 10.11 | August 14, 2001 | |
10.22# | Summary of RSU Change in Control Vesting Provisions | 8-K | 000-33213 | 10.1 | July 21, 2008 | |
10.23# | Summary of Standard Director Compensation Arrangements for Non-Employee Directors (contained on pages 10-12 of the proxy statement for the Company's annual meeting filed August 11, 2010) | DEF 14A | 000-33213 | August 11, 2010 | ||
10.24# | Form of Indemnification Agreement (between the Registrant and the following directors and executive officers: Kevin C. Eichler, Thomas M. Rohrs, Chester J. Silvestri, Susumu Kohyama, Rajeev Madhavan, Roy E. Jewell, Peter S. Teshima, David Sugishita and Govind Kizhepat) | 10-Q | 000-33213 | 10.5 | March 12, 2009 | |
10.25# | Form of Tier 1 Magma Design Automation Employment and Severance Agreement (between the Registrant and the following executive officers: Rajeev Madhavan, Roy E. Jewell and Peter S. Teshima) | 10-Q | 000-33213 | 10.3 | March 12, 2009 | |
10.26# | Form of Tier 2 Magma Design Automation Employment and Severance Agreement | 10-Q | 000-33213 | 10.4 | March 12, 2009 | |
10.27 | Lease for corporate headquarters dated June 19, 2003, between Registrant and 3Com Corporation (assumed by Marvell Technology from 3Com) | 10-Q | 000-33213 | 10.2 | November 14, 2003 | |
10.28 | Office Lease Agreement between Registrant and CA-Skyport I Limited Partnership dated December 28, 2006, for the premises located at 1650 Technology Drive, San Jose, California | 10-Q | 0-33213 | 10.1 | February 8, 2007 | |
10.29 | Sub-Sub Lease Agreement between Registrant and Siemens Communications Inc. dated November 15, 2006 and becoming effective on December 28, 2006 | 10-Q | 0-33213 | 10.2 | February 8, 2007 | |
10.30 | Amendment Number One dated January 24, 2007 to Lease dated June 19, 2003, between Registrant and 3Com Corporation (assumed by Marvell Technology from 3Com) | 10-K | 000-33213 | 10.30 | June 6, 2007 | |
10.31 | Credit Agreement, effective as of March 19, 2010, by and between the Registrant and Wells Fargo Bank, N.A. | |||||
89
Amendment Number One to Credit Agreement and Consent, dated as of June 24, 2010, by and between the lenders identified therein, the Registrant and Wells Fargo Capital Finance. | 10-Q | 000-33213 | 10.5 | December 9, 2010 | ||
10.32 | Amendment Number Two to Credit Agreement and Consent, dated as of July 30, 2010, by and between the lenders identified therein, the Registrant and Wells Fargo Capital Finance. | 10-Q | 000-33213 | 10.6 | December 9, 2010 | |
10.33 | Amendment Number Three to Credit Agreement and Consent, dated as of September 15, 2010, by and between the lenders identified therein, the Registrant and Wells Fargo Capital Finance, LLC. | 10-Q | 000-33213 | 10.7 | December 9, 2010 | |
10.34 | Amendment Number Four to Credit Agreement and Consent, dated as of October 29, 2010, by and between the lenders identified therein, the Registrant and Wells Fargo Capital Finance. | 10-Q | 000-33213 | 10.8 | December 9, 2010 | |
21.1 | List of Subsidiaries | X | ||||
23.1 | Consent of Grant Thornton LLP | X | ||||
31.1 | Rule 13a-14(a)/15d-14(a) Certification of Chief Executive Officer | X | ||||
31.2 | Rule 13a-14(a)/15d-14(a) Certification of Chief Financial Officer | X | ||||
32.1 | Certification of Chief Executive Officer furnished pursuant to 18 U.S.C. Section 1350, as adopted pursuant to Section 906 of the Sarbanes-Oxley Act of 2002 | X | ||||
32.2 | Certification of Chief Financial Officer furnished pursuant to 18 U.S.C. Section 1350, as adopted pursuant to Section 906 of the Sarbanes-Oxley Act of 2002 | X | ||||
# Indicates management contract or compensatory plan or arrangement.
± Portions of this agreement have been omitted pursuant to a request for confidential treatment.
90