Attached files
| file | filename |
|---|---|
| 8-K - 8-K - ONE LIBERTY PROPERTIES INC | a11-15108_18k.htm |
Exhibit 99.1
|
|
One Liberty Properties June 2011 www.1liberty.com |
|
|
Safe Harbor Statement Certain information contained in this presentation, together with other statements and information publicly disseminated by One Liberty Properties, Inc. (the “Company”), constitute forward looking statements within the meaning of Section 27A of Securities Act of 1933, as amended, and Section 21E of the Securities and Exchange Act of 1934, as amended. These statements involve assumptions and forecasts that are based upon our current assessments of certain trends, risks and uncertainties, which assumptions appear to be reasonable to us at the time they are made. These amounts may fluctuate as a result of unexpected lease defaults by our tenants or fluctuations in the economy that affect our tenants. We intend such forward looking statements to be covered by the safe harbor provision for forward looking statements contained in the Private Securities Litigation Reform Act of 1995 and include this statement for the purpose of complying with these safe harbor provisions. Information regarding certain important factors that could cause actual outcomes or other events to differ materially from any such forward looking statements appear in the Company’s Annual Report on Form 10-K for the year ended December 31, 2010 and in particular the section entitled “Item 1A, Risk Factors”. You should not rely on forward looking statements since they involve known and unknown risks, uncertainties and other factors which are, in some cases, beyond our control and which could materially affect actual results or performance referred to above. We undertake no obligation to publicly update or revise any forward-looking statements included in this presentation, whether as a result of new information, future events or otherwise. 2 |
|
|
One Liberty Overview Internally managed net lease equity REIT focused on U.S. single tenant commercial real estate Weighted average lease term of almost 9 years 89 properties totaling 5.2 million square feet, including five joint venture properties Diversified portfolio by tenant, property & geography 60% of assets are Retail, 20% Industrial/Flex, 20% Office and other sectors Disciplined investment approach balanced through Fundamental real estate analysis, and Tenant credit evaluation to ensure cash flow stability Insider ownership in excess of 20% Largest investor is Gould Investors LP since 1989 3 |
|
|
Investment Highlights 8.4% dividend yield (1) High performing portfolio with embedded growth At least 97.5% year end occupancy for each of the last five years 2011 rental income (2) of $41.7 million represents a 4.6% increase over 2010 (3) Manageable debt maturities over the next three years Ability to leverage human capital beyond the REIT Proven ability to make acquisitions through long-standing relationships 2010 acquisitions total $72.3 million, consisting of 14 properties 2011 acquisitions 2 properties for $3.9 million closed 2 properties for $8 million under “hard” contract Pipeline of diverse opportunities in excess of $250 million Strong industry relationships driving growing acquisition opportunities (1) Based on stock price of $15.67 as of June 14, 2011 Our 2011 (2) contractual rental income includes, after giving effect to any abatements, concessions or adjustments (i) rental income that is payable to us in 2011 under leases existing at June 15, 2011 excluding rental income from two tenants that are debtors in bankruptcy proceedings and (ii) rental income that is payable to us in 2011 on our tenancy in common interest. Our share of the rental income payable to our joint ventures in 2011 will be approximately $1.4 million; such sum is not included in 2011 contractual rental income. (3) Based on 2010 contractual rental income as reported and defined in the 12/31/09 10-K 4 |
|
|
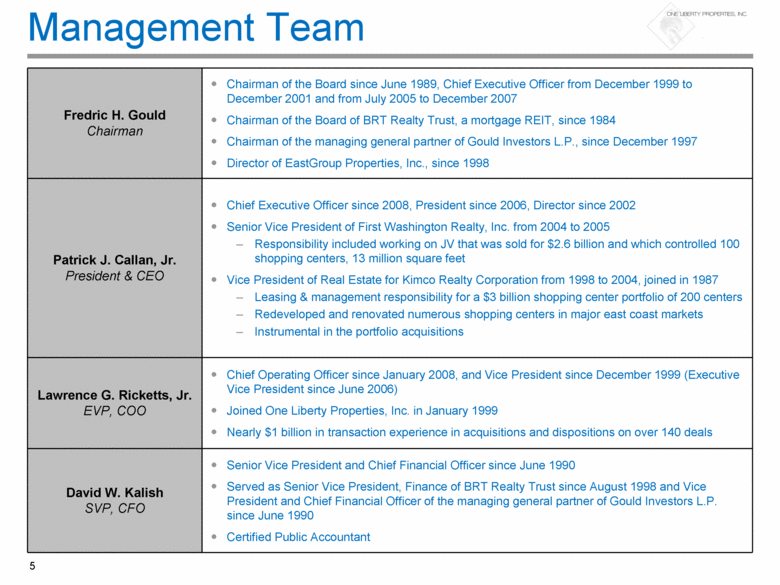
Management Team Fredric H. Gould Chairman Chairman of the Board since June 1989, Chief Executive Officer from December 1999 to December 2001 and from July 2005 to December 2007 Chairman of the Board of BRT Realty Trust, a mortgage REIT, since 1984 Chairman of the managing general partner of Gould Investors L.P., since December 1997 Director of EastGroup Properties, Inc., since 1998 Patrick J. Callan, Jr. President & CEO Chief Executive Officer since 2008, President since 2006, Director since 2002 Senior Vice President of First Washington Realty, Inc. from 2004 to 2005 Responsibility included working on JV that was sold for $2.6 billion and which controlled 100 shopping centers, 13 million square feet Vice President of Real Estate for Kimco Realty Corporation from 1998 to 2004, joined in 1987 Leasing & management responsibility for a $3 billion shopping center portfolio of 200 centers Redeveloped and renovated numerous shopping centers in major east coast markets Instrumental in the portfolio acquisitions Lawrence G. Ricketts, Jr. EVP, COO Chief Operating Officer since January 2008, and Vice President since December 1999 (Executive Vice President since June 2006) Joined One Liberty Properties, Inc. in January 1999 Nearly $1 billion in transaction experience in acquisitions and dispositions on over 140 deals David W. Kalish SVP, CFO Senior Vice President and Chief Financial Officer since June 1990 Served as Senior Vice President, Finance of BRT Realty Trust since August 1998 and Vice President and Chief Financial Officer of the managing general partner of Gould Investors L.P. since June 1990 Certified Public Accountant 5 |
|
|
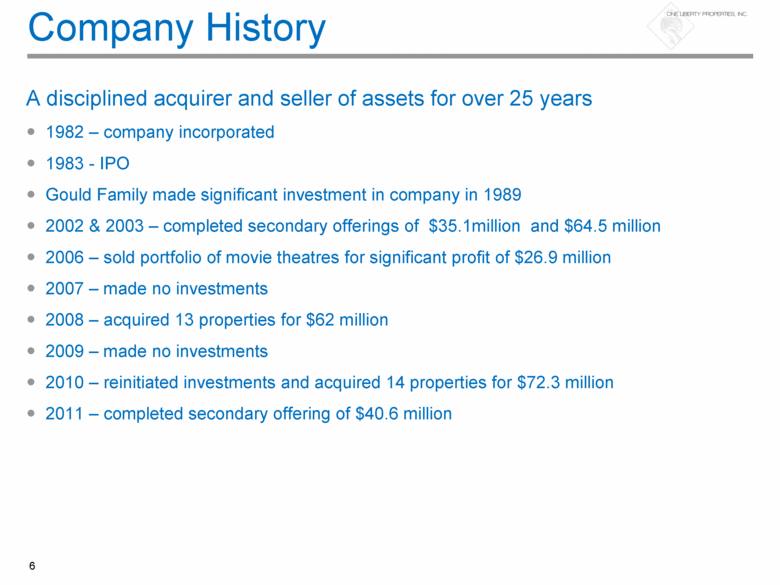
Company History A disciplined acquirer and seller of assets for over 25 years 1982 – company incorporated 1983 - IPO Gould Family made significant investment in company in 1989 2002 & 2003 – completed secondary offerings of $35.1million and $64.5 million 2006 – sold portfolio of movie theatres for significant profit of $26.9 million 2007 – made no investments 2008 – acquired 13 properties for $62 million 2009 – made no investments 2010 – reinitiated investments and acquired 14 properties for $72.3 million 2011 – completed secondary offering of $40.6 million 6 |
|
|
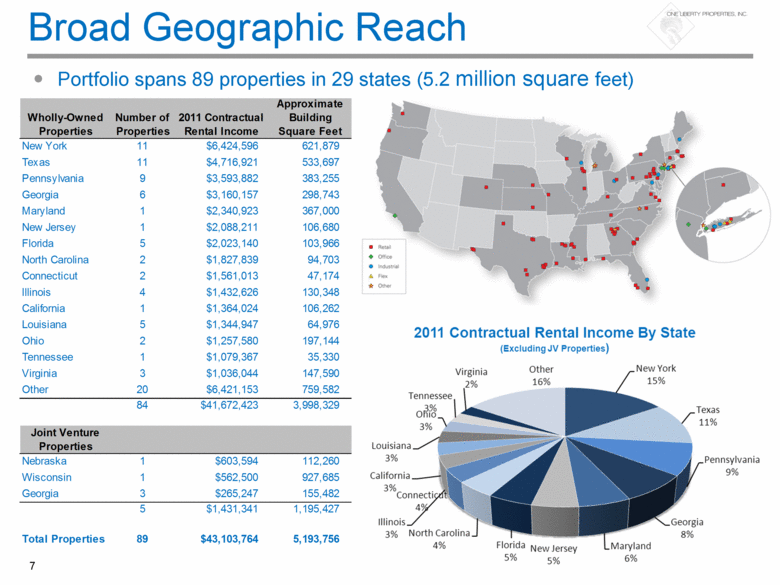
Broad Geographic Reach 7 Portfolio spans 89 properties in 29 states (5.2 million square feet) Wholly-Owned Properties Number of Properties 2011 Contractual Rental Income Approximate Building Square Feet New York 11 $6,424,596 621,879 Texas 11 $4,716,921 533,697 Pennsylvania 9 $3,593,882 383,255 Georgia 6 $3,160,157 298,743 Maryland 1 $2,340,923 367,000 New Jersey 1 $2,088,211 106,680 Florida 5 $2,023,140 103,966 North Carolina 2 $1,827,839 94,703 Connecticut 2 $1,561,013 47,174 Illinois 4 $1,432,626 130,348 California 1 $1,364,024 106,262 Louisiana 5 $1,344,947 64,976 Ohio 2 $1,257,580 197,144 Tennessee 1 $1,079,367 35,330 Virginia 3 $1,036,044 147,590 Other 20 $6,421,153 759,582 84 $41,672,423 3,998,329 Joint Venture Properties Nebraska 1 $603,594 112,260 Wisconsin 1 $562,500 927,685 Georgia 3 $265,247 155,482 5 $1,431,341 1,195,427 Total Properties 89 $43,103,764 5,193,756 |
|
|
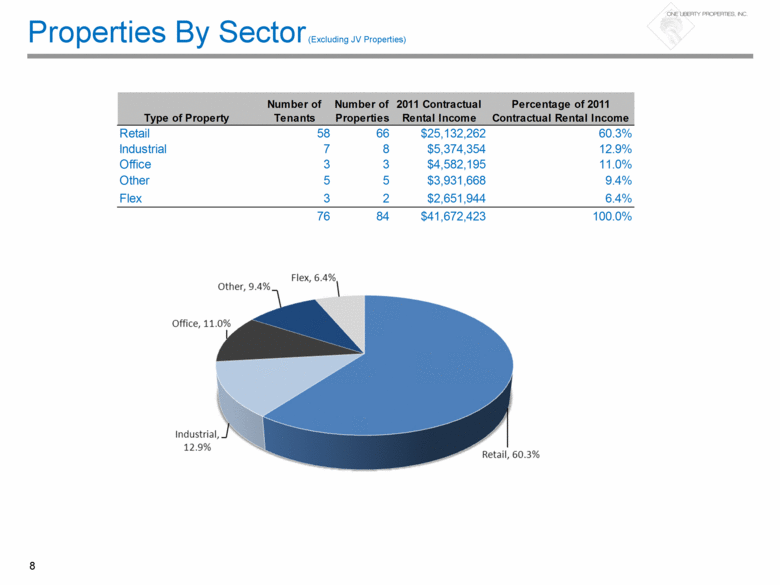
Properties By Sector (Excluding JV Properties) 8 Type of Property Number of Tenants Number of Properties 2011 Contractual Rental Income Percentage of 2011 Contractual Rental Income Retail 58 66 $25,132,262 60.3% Industrial 7 8 $5,374,354 12.9% Office 3 3 $4,582,195 11.0% Other 5 5 $3,931,668 9.4% Flex 3 2 $2,651,944 6.4% 76 84 $41,672,423 100.0% |
|
|
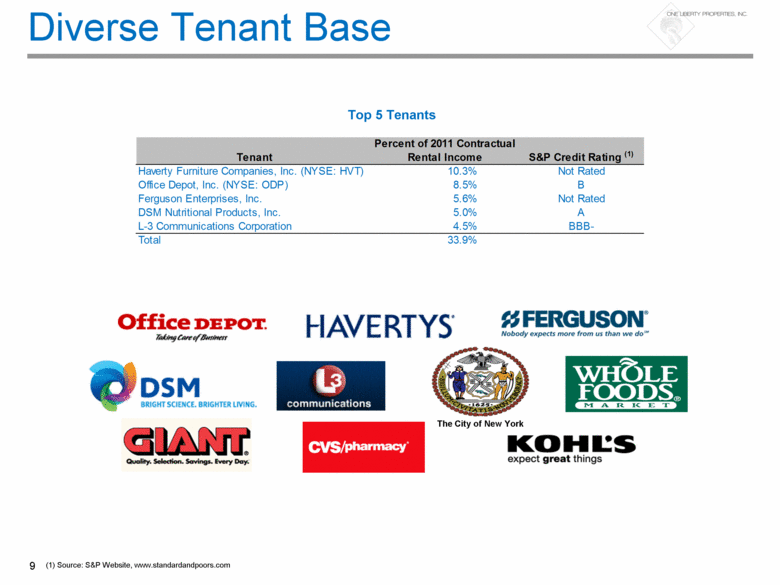
Diverse Tenant Base Top 5 Tenants (1) Source: S&P Website, www.standardandpoors.com 9 Tenant Percent of 2011 Contractual Rental Income S&P Credit Rating (1) Haverty Furniture Companies, Inc. (NYSE: HVT) 10.3% Not Rated Office Depot, Inc. (NYSE: ODP) 8.5% B Ferguson Enterprises, Inc. 5.6% Not Rated DSM Nutritional Products, Inc. 5.0% A L-3 Communications Corporation 4.5% BBB- Total 33.9% |
|
|
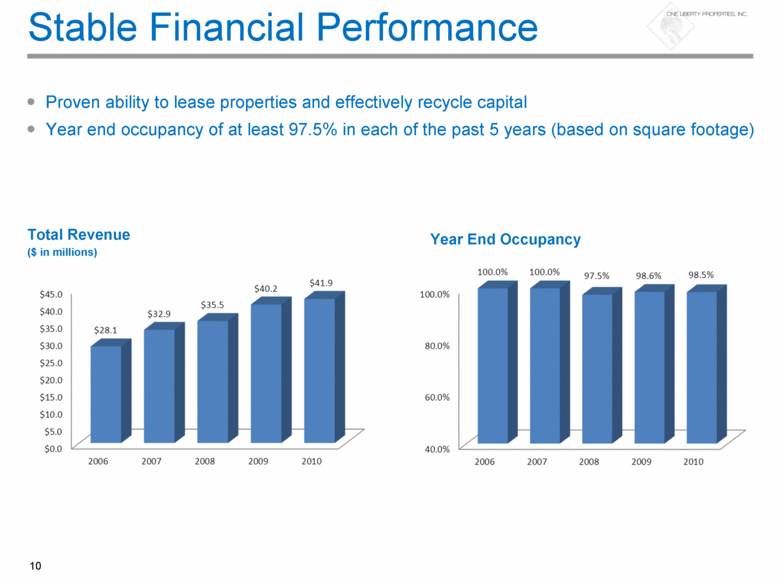
Stable Financial Performance Total Revenue ($ in millions) Proven ability to lease properties and effectively recycle capital Year end occupancy of at least 97.5% in each of the past 5 years (based on square footage) Year End Occupancy 10 |
|
|
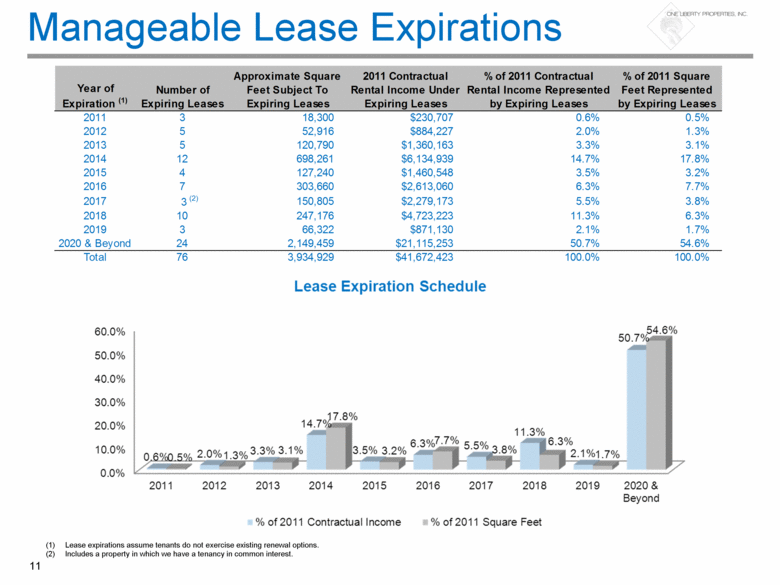
Manageable Lease Expirations (1) Lease expirations assume tenants do not exercise existing renewal options. (2) Includes a property in which we have a tenancy in common interest. 11 Year of Expiration (1) Number of Expiring Leases Approximate Square Feet Subject To Expiring Leases 2011 Contractual Rental Income Under Expiring Leases % of 2011 Contractual Rental Income Represented by Expiring Leases % of 2011 Square Feet Represented by Expiring Leases 2011 3 18,300 $230,707 0.6% 0.5% 2012 5 52,916 $884,227 2.0% 1.3% 2013 5 120,790 $1,360,163 3.3% 3.1% 2014 12 698,261 $6,134,939 14.7% 17.8% 2015 4 127,240 $1,460,548 3.5% 3.2% 2016 7 303,660 $2,613,060 6.3% 7.7% 2017 3 (2) 150,805 $2,279,173 5.5% 3.8% 2018 10 247,176 $4,723,223 11.3% 6.3% 2019 3 66,322 $871,130 2.1% 1.7% 2020 & Beyond 24 2,149,459 $21,115,253 50.7% 54.6% Total 76 3,934,929 $41,672,423 100.0% 100.0% |
|
|
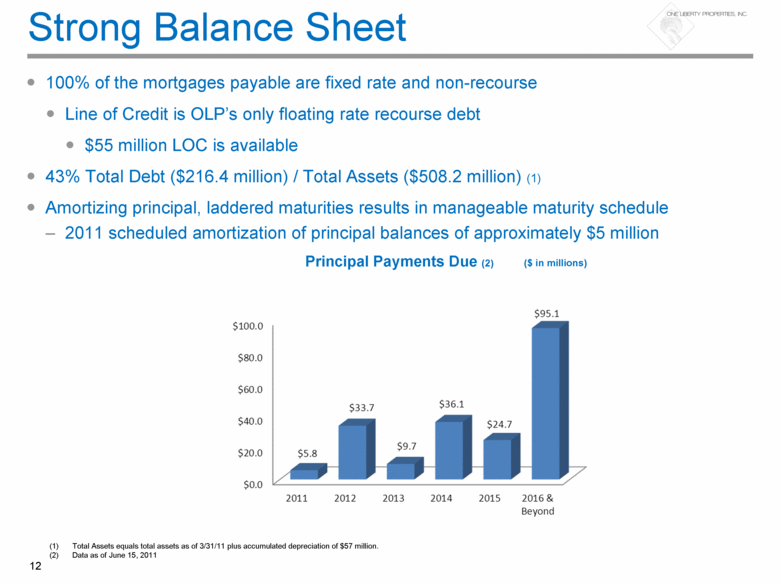
Strong Balance Sheet 100% of the mortgages payable are fixed rate and non-recourse Line of Credit is OLP’s only floating rate recourse debt $55 million LOC is available 43% Total Debt ($216.4 million) / Total Assets ($508.2 million) (1) Amortizing principal, laddered maturities results in manageable maturity schedule 2011 scheduled amortization of principal balances of approximately $5 million (1) Total Assets equals total assets as of 3/31/11 plus accumulated depreciation of $57 million. (2) Data as of June 15, 2011 Principal Payments Due (2) ($ in millions) 12 |
|
|
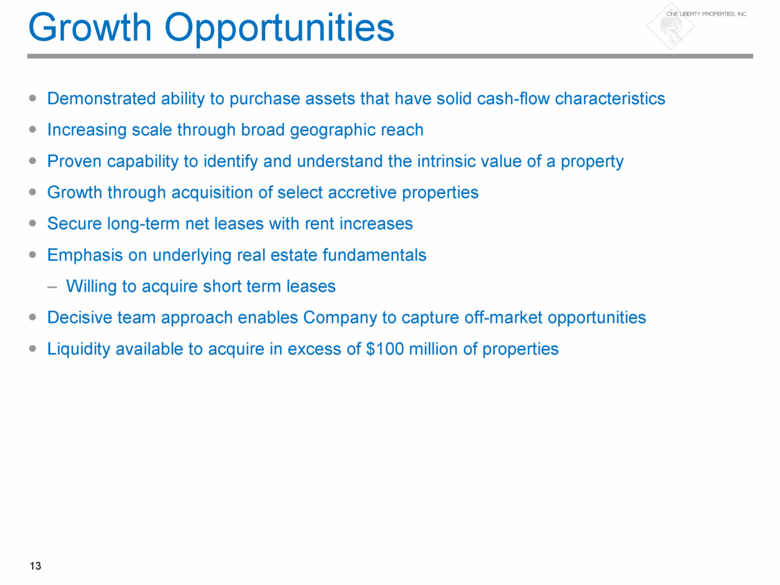
Growth Opportunities Demonstrated ability to purchase assets that have solid cash-flow characteristics Increasing scale through broad geographic reach Proven capability to identify and understand the intrinsic value of a property Growth through acquisition of select accretive properties Secure long-term net leases with rent increases Emphasis on underlying real estate fundamentals Willing to acquire short term leases Decisive team approach enables Company to capture off-market opportunities Liquidity available to acquire in excess of $100 million of properties 13 |
|
|
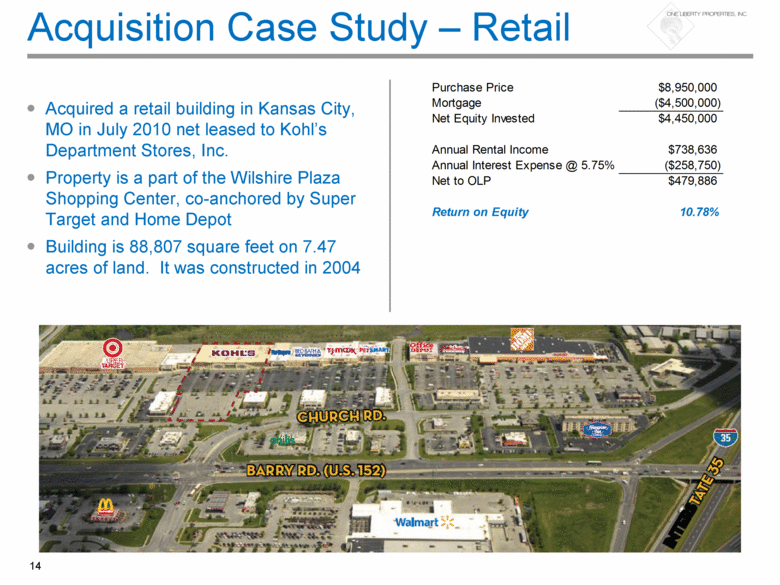
Acquisition Case Study – Retail Acquired a retail building in Kansas City, MO in July 2010 net leased to Kohl’s Department Stores, Inc. Property is a part of the Wilshire Plaza Shopping Center, co-anchored by Super Target and Home Depot Building is 88,807 square feet on 7.47 acres of land. It was constructed in 2004 14 Purchase Price $8,950,000 Mortgage ($4,500,000) Net Equity Invested $4,450,000 Annual Rental Income $738,636 Annual Interest Expense @ 5.75% ($258,750) Net to OLP $479,886 Return on Equity 10.78% |
|
|
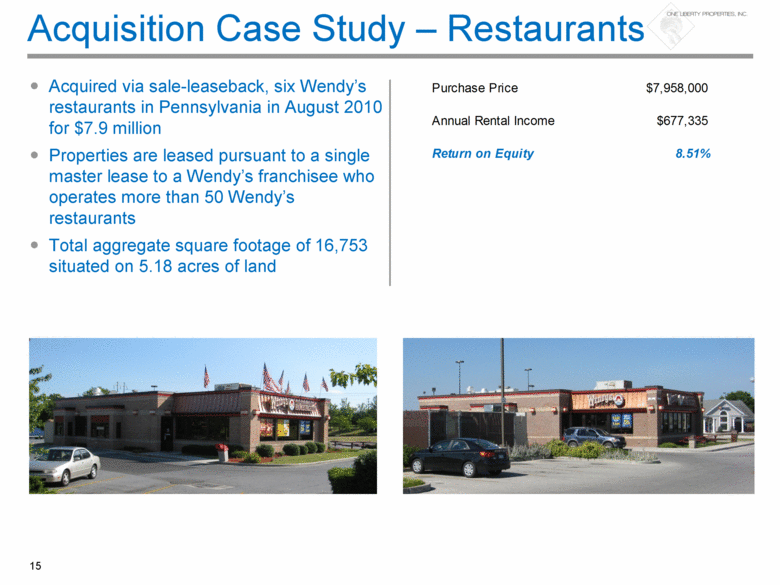
Acquisition Case Study – Restaurants Acquired via sale-leaseback, six Wendy’s restaurants in Pennsylvania in August 2010 for $7.9 million Properties are leased pursuant to a single master lease to a Wendy’s franchisee who operates more than 50 Wendy’s restaurants Total aggregate square footage of 16,753 situated on 5.18 acres of land 15 Purchase Price $7,958,000 Annual Rental Income $677,335 Return on Equity 8.51% |
|
|
Top Tenants Profiles |
|
|
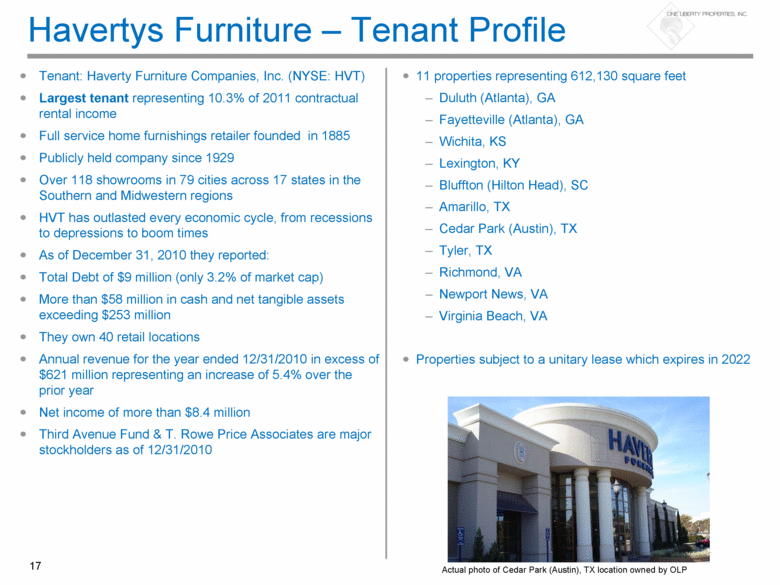
Havertys Furniture – Tenant Profile 17 Tenant: Haverty Furniture Companies, Inc. (NYSE: HVT) Largest tenant representing 10.3% of 2011 contractual rental income Full service home furnishings retailer founded in 1885 Publicly held company since 1929 Over 118 showrooms in 79 cities across 17 states in the Southern and Midwestern regions HVT has outlasted every economic cycle, from recessions to depressions to boom times As of December 31, 2010 they reported: Total Debt of $9 million (only 3.2% of market cap) More than $58 million in cash and net tangible assets exceeding $253 million They own 40 retail locations Annual revenue for the year ended 12/31/2010 in excess of $621 million representing an increase of 5.4% over the prior year Net income of more than $8.4 million Third Avenue Fund & T. Rowe Price Associates are major stockholders as of 12/31/2010 11 properties representing 612,130 square feet Duluth (Atlanta), GA Fayetteville (Atlanta), GA Wichita, KS Lexington, KY Bluffton (Hilton Head), SC Amarillo, TX Cedar Park (Austin), TX Tyler, TX Richmond, VA Newport News, VA Virginia Beach, VA Properties subject to a unitary lease which expires in 2022 Actual photo of Cedar Park (Austin), TX location owned by OLP |
|
|
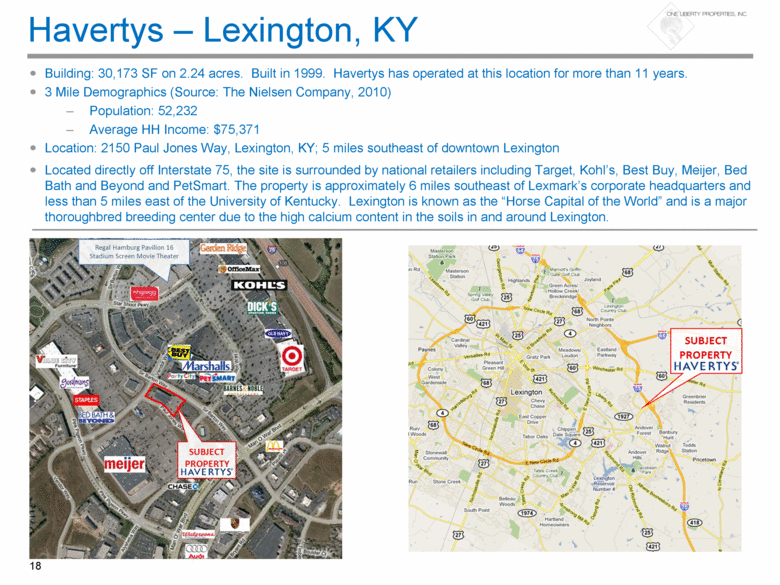
Havertys – Lexington, KY Building: 30,173 SF on 2.24 acres. Built in 1999. Havertys has operated at this location for more than 11 years. 3 Mile Demographics (Source: The Nielsen Company, 2010) Population: 52,232 Average HH Income: $75,371 Location: 2150 Paul Jones Way, Lexington, KY; 5 miles southeast of downtown Lexington Located directly off Interstate 75, the site is surrounded by national retailers including Target, Kohl’s, Best Buy, Meijer, Bed Bath and Beyond and PetSmart. The property is approximately 6 miles southeast of Lexmark’s corporate headquarters and less than 5 miles east of the University of Kentucky. Lexington is known as the “Horse Capital of the World” and is a major thoroughbred breeding center due to the high calcium content in the soils in and around Lexington. 18 |
|
|
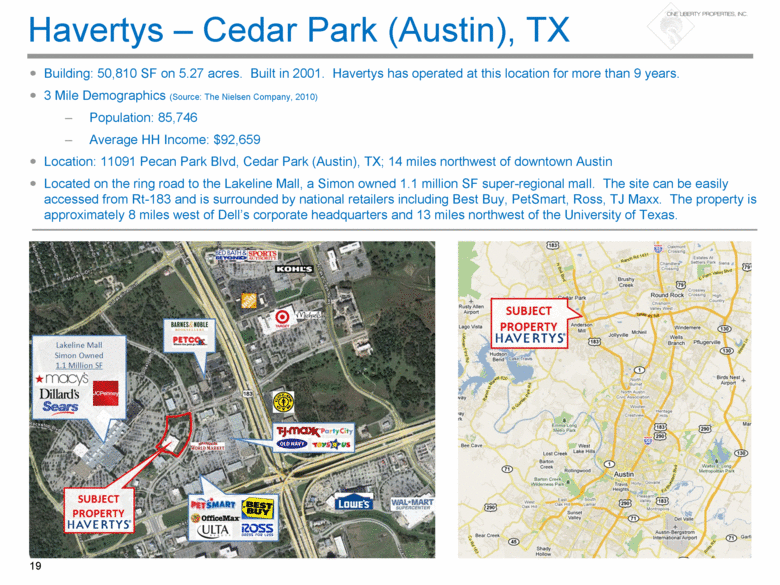
Havertys – Cedar Park (Austin), TX Building: 50,810 SF on 5.27 acres. Built in 2001. Havertys has operated at this location for more than 9 years. 3 Mile Demographics (Source: The Nielsen Company, 2010) Population: 85,746 Average HH Income: $92,659 Location: 11091 Pecan Park Blvd, Cedar Park (Austin), TX; 14 miles northwest of downtown Austin Located on the ring road to the Lakeline Mall, a Simon owned 1.1 million SF super-regional mall. The site can be easily accessed from Rt-183 and is surrounded by national retailers including Best Buy, PetSmart, Ross, TJ Maxx. The property is approximately 8 miles west of Dell’s corporate headquarters and 13 miles northwest of the University of Texas. 19 |
|
|
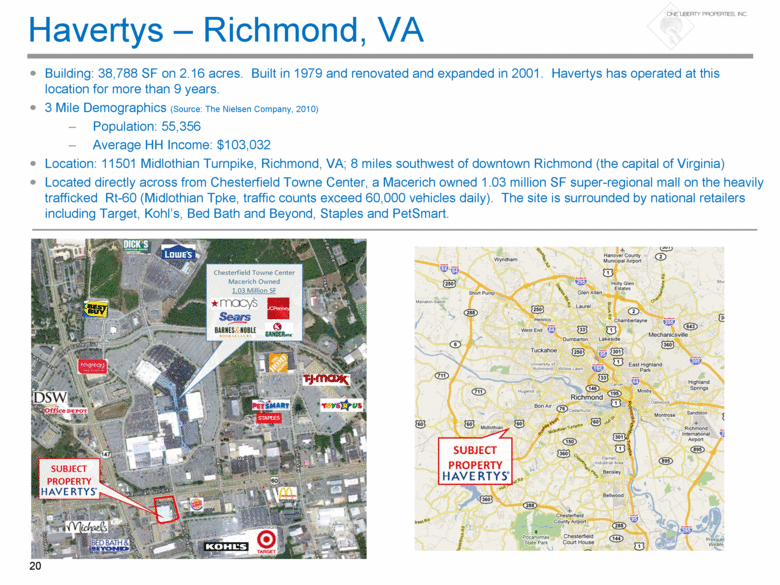
Havertys – Richmond, VA Building: 38,788 SF on 2.16 acres. Built in 1979 and renovated and expanded in 2001. Havertys has operated at this location for more than 9 years. 3 Mile Demographics (Source: The Nielsen Company, 2010) Population: 55,356 Average HH Income: $103,032 Location: 11501 Midlothian Turnpike, Richmond, VA; 8 miles southwest of downtown Richmond (the capital of Virginia) Located directly across from Chesterfield Towne Center, a Macerich owned 1.03 million SF super-regional mall on the heavily trafficked Rt-60 (Midlothian Tpke, traffic counts exceed 60,000 vehicles daily). The site is surrounded by national retailers including Target, Kohl’s, Bed Bath and Beyond, Staples and PetSmart. 20 |
|
|
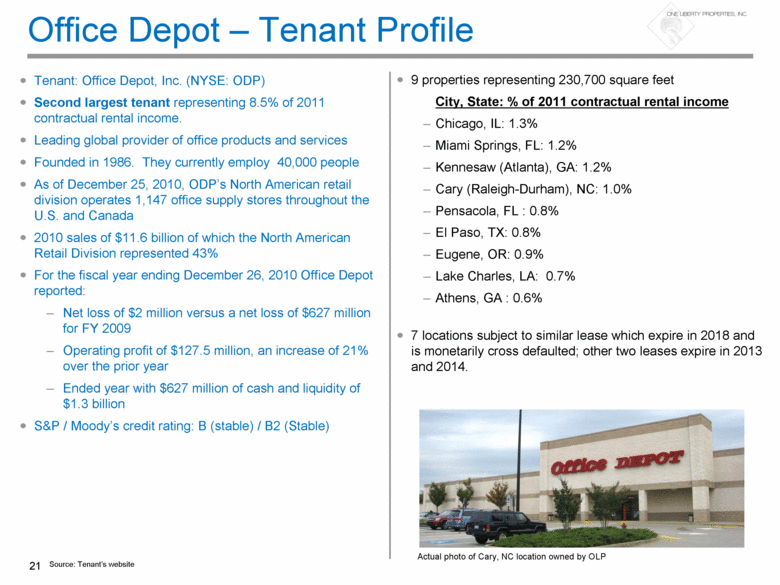
Office Depot – Tenant Profile 21 Source: Tenant’s website Tenant: Office Depot, Inc. (NYSE: ODP) Second largest tenant representing 8.5% of 2011 contractual rental income. Leading global provider of office products and services Founded in 1986. They currently employ 40,000 people As of December 25, 2010, ODP’s North American retail division operates 1,147 office supply stores throughout the U.S. and Canada 2010 sales of $11.6 billion of which the North American Retail Division represented 43% For the fiscal year ending December 26, 2010 Office Depot reported: Net loss of $2 million versus a net loss of $627 million for FY 2009 Operating profit of $127.5 million, an increase of 21% over the prior year Ended year with $627 million of cash and liquidity of $1.3 billion S&P / Moody’s credit rating: B (stable) / B2 (Stable) 9 properties representing 230,700 square feet City, State: % of 2011 contractual rental income Chicago, IL: 1.3% Miami Springs, FL: 1.2% Kennesaw (Atlanta), GA: 1.2% Cary (Raleigh-Durham), NC: 1.0% Pensacola, FL : 0.8% El Paso, TX: 0.8% Eugene, OR: 0.9% Lake Charles, LA: 0.7% Athens, GA : 0.6% 7 locations subject to similar lease which expire in 2018 and is monetarily cross defaulted; other two leases expire in 2013 and 2014. Actual photo of Cary, NC location owned by OLP |
|
|
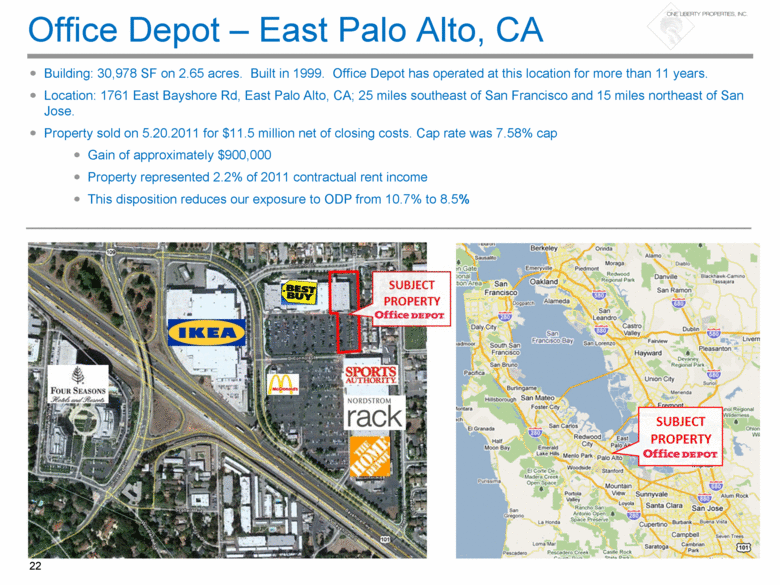
Office Depot – East Palo Alto, CA Building: 30,978 SF on 2.65 acres. Built in 1999. Office Depot has operated at this location for more than 11 years. Location: 1761 East Bayshore Rd, East Palo Alto, CA; 25 miles southeast of San Francisco and 15 miles northeast of San Jose. Property sold on 5.20.2011 for $11.5 million net of closing costs. Cap rate was 7.58% cap Gain of approximately $900,000 Property represented 2.2% of 2011 contractual rent income This disposition reduces our exposure to ODP from 10.7% to 8.5% 22 |
|
|
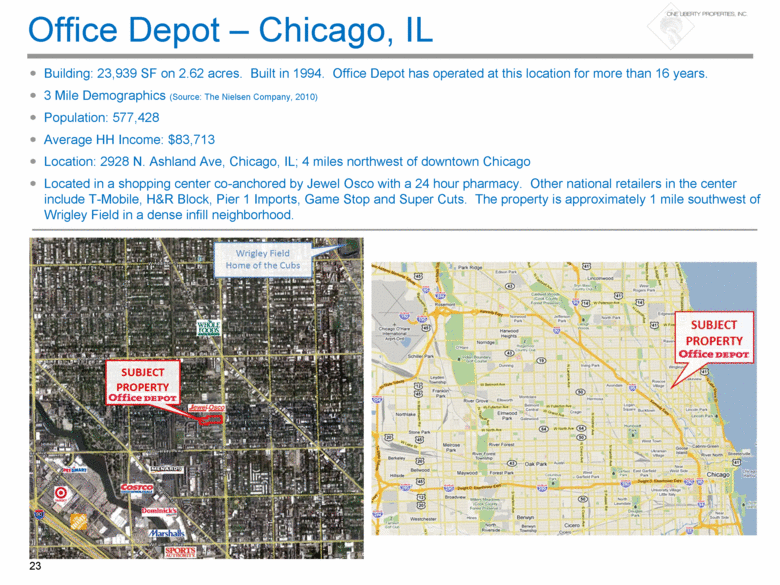
Office Depot – Chicago, IL Building: 23,939 SF on 2.62 acres. Built in 1994. Office Depot has operated at this location for more than 16 years. 3 Mile Demographics (Source: The Nielsen Company, 2010) Population: 577,428 Average HH Income: $83,713 Location: 2928 N. Ashland Ave, Chicago, IL; 4 miles northwest of downtown Chicago Located in a shopping center co-anchored by Jewel Osco with a 24 hour pharmacy. Other national retailers in the center include T-Mobile, H&R Block, Pier 1 Imports, Game Stop and Super Cuts. The property is approximately 1 mile southwest of Wrigley Field in a dense infill neighborhood. 23 |
|
|
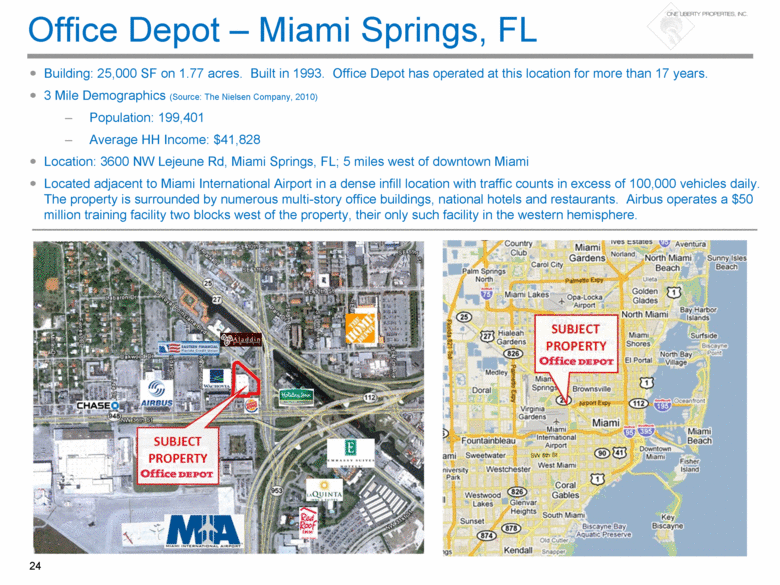
Office Depot – Miami Springs, FL Building: 25,000 SF on 1.77 acres. Built in 1993. Office Depot has operated at this location for more than 17 years. 3 Mile Demographics (Source: The Nielsen Company, 2010) Population: 199,401 Average HH Income: $41,828 Location: 3600 NW Lejeune Rd, Miami Springs, FL; 5 miles west of downtown Miami Located adjacent to Miami International Airport in a dense infill location with traffic counts in excess of 100,000 vehicles daily. The property is surrounded by numerous multi-story office buildings, national hotels and restaurants. Airbus operates a $50 million training facility two blocks west of the property, their only such facility in the western hemisphere. 24 |
|
|
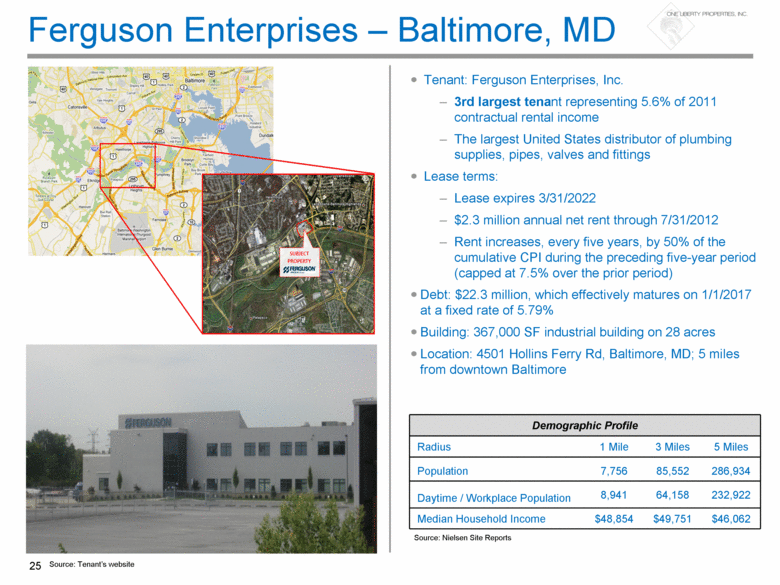
Ferguson Enterprises – Baltimore, MD Tenant: Ferguson Enterprises, Inc. 3rd largest tenant representing 5.6% of 2011 contractual rental income The largest United States distributor of plumbing supplies, pipes, valves and fittings Lease terms: Lease expires 3/31/2022 $2.3 million annual net rent through 7/31/2012 Rent increases, every five years, by 50% of the cumulative CPI during the preceding five-year period (capped at 7.5% over the prior period) Debt: $22.3 million, which effectively matures on 1/1/2017 at a fixed rate of 5.79% Building: 367,000 SF industrial building on 28 acres Location: 4501 Hollins Ferry Rd, Baltimore, MD; 5 miles from downtown Baltimore Demographic Profile Radius 1 Mile 3 Miles 5 Miles Population 7,756 85,552 286,934 Daytime / Workplace Population 8,941 64,158 232,922 Median Household Income $48,854 $49,751 $46,062 25 Source: Tenant’s website Source: Nielsen Site Reports |
|
|
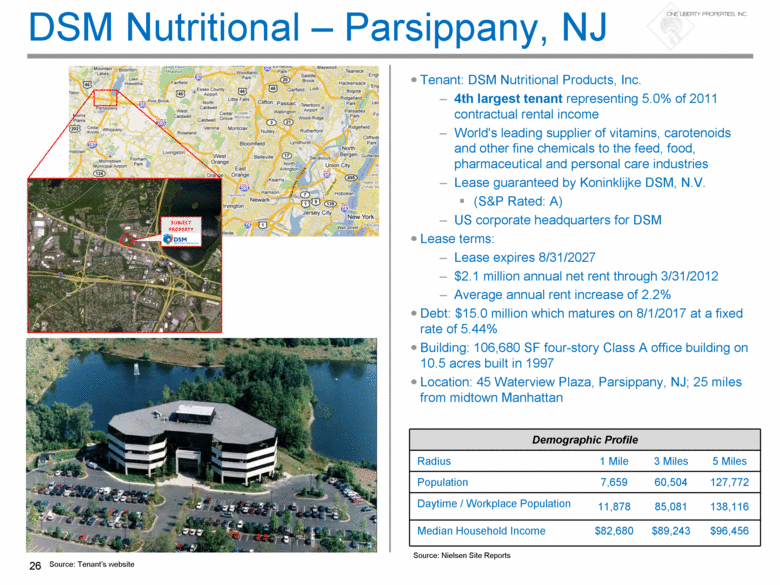
DSM Nutritional – Parsippany, NJ Tenant: DSM Nutritional Products, Inc. 4th largest tenant representing 5.0% of 2011 contractual rental income World's leading supplier of vitamins, carotenoids and other fine chemicals to the feed, food, pharmaceutical and personal care industries Lease guaranteed by Koninklijke DSM, N.V. (S&P Rated: A) US corporate headquarters for DSM Lease terms: Lease expires 8/31/2027 $2.1 million annual net rent through 3/31/2012 Average annual rent increase of 2.2% Debt: $15.0 million which matures on 8/1/2017 at a fixed rate of 5.44% Building: 106,680 SF four-story Class A office building on 10.5 acres built in 1997 Location: 45 Waterview Plaza, Parsippany, NJ; 25 miles from midtown Manhattan Demographic Profile Radius 1 Mile 3 Miles 5 Miles Population 7,659 60,504 127,772 Daytime / Workplace Population 11,878 85,081 138,116 Median Household Income $82,680 $89,243 $96,456 26 Source: Tenant’s website Source: Nielsen Site Reports |
|
|
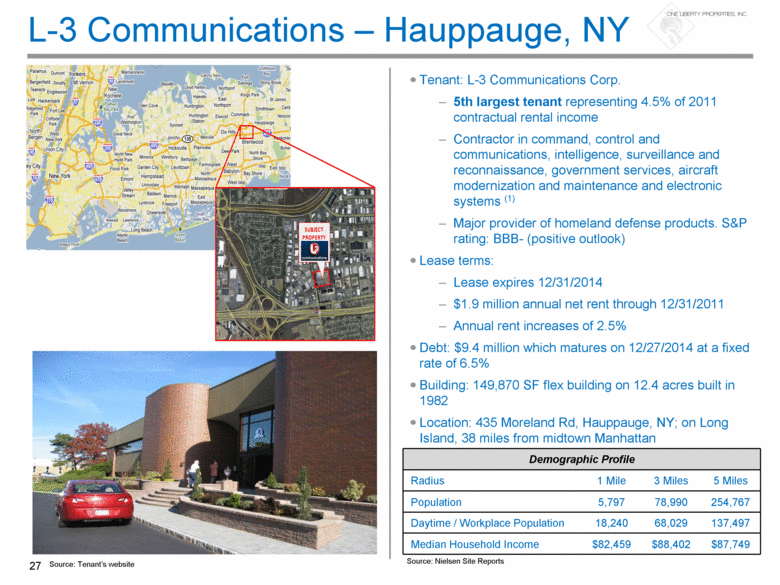
L-3 Communications – Hauppauge, NY Tenant: L-3 Communications Corp. 5th largest tenant representing 4.5% of 2011 contractual rental income Contractor in command, control and communications, intelligence, surveillance and reconnaissance, government services, aircraft modernization and maintenance and electronic systems (1) Major provider of homeland defense products. S&P rating: BBB- (positive outlook) Lease terms: Lease expires 12/31/2014 $1.9 million annual net rent through 12/31/2011 Annual rent increases of 2.5% Debt: $9.4 million which matures on 12/27/2014 at a fixed rate of 6.5% Building: 149,870 SF flex building on 12.4 acres built in 1982 Location: 435 Moreland Rd, Hauppauge, NY; on Long Island, 38 miles from midtown Manhattan Demographic Profile Radius 1 Mile 3 Miles 5 Miles Population 5,797 78,990 254,767 Daytime / Workplace Population 18,240 68,029 137,497 Median Household Income $82,459 $88,402 $87,749 27 Source: Tenant’s website Source: Nielsen Site Reports |
|
|
Investment Highlights 8.4% dividend yield (1) At least 97.5% year end occupancy for each of the last five years High performing portfolio with embedded growth Manageable debt maturities over the next three years Proven ability to make acquisitions through long-standing relationships Strong industry relationships driving growing acquisition opportunities (1) Based on stock price of $15.67 as of 6/14/2011 28 |
|
|
Appendix |
|
|
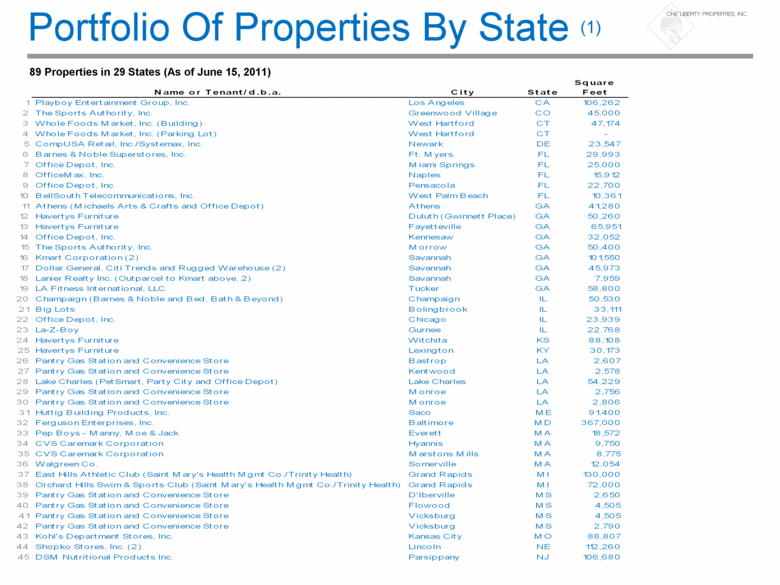
Portfolio Of Properties By State (1) 89 Properties in 29 States (As of June 15, 2011) Sq uar e N ame o r T enant / d .b .a. C it y St at e Feet 1 Playboy Entertainment Group, Inc. Los Angeles CA 106,262 2 The Sports Authority, Inc. Greenwood Village CO 45,000 3 Whole Foods M arket, Inc. (Building) West Hartford CT 47,174 4 Whole Foods M arket, Inc. (Parking Lot) West Hartford CT - 5 CompUSA Retail, Inc./Systemax, Inc. Newark DE 23,547 6 Barnes & Noble Superstores, Inc. Ft. M yers FL 29,993 7 Of f ice Depot , Inc. M iami Springs FL 25,000 8 OfficeM ax, Inc. Naples FL 15,912 9 Of f ice Depot , Inc. Pensacola FL 22,700 10 BellSouth Telecommunications, Inc. West Palm Beach FL 10,361 11 At hens (M ichaels Art s & Craf t s and Of f ice Depot ) At hens GA 41,280 12 Havert ys Furnit ure Dulut h (Gwinnet t Place) GA 50,260 13 Havert ys Furnit ure Fayet t eville GA 65,951 14 Of f ice Depot , Inc. Kennesaw GA 32,052 15 The Sports Authority, Inc. M orrow GA 50,400 16 Kmart Corporat ion (2) Savannah GA 101,550 17 Dollar General, Cit i Trends and Rugged Warehouse (2) Savannah GA 45,973 18 Lanier Realt y Inc. (Out parcel t o Kmart above, 2) Savannah GA 7,959 19 LA Fit ness Int ernat ional, LLC Tucker GA 58,800 20 Champaign (Barnes & Noble and Bed, Bath & Beyond) Champaign IL 50,530 21 Big Lots Bolingbrook IL 33,111 22 Office Depot, Inc. Chicago IL 23,939 23 La-Z-Boy Gurnee IL 22,768 24 Havertys Furniture Witchita KS 88,108 25 Havertys Furniture Lexington KY 30,173 26 Pant ry Gas St at ion and Convenience St ore Bast rop LA 2,607 27 Pant ry Gas St at ion and Convenience St ore Kent wood LA 2,578 28 Lake Charles (Pet Smart , Part y Cit y and Of f ice Depot ) Lake Charles LA 54,229 29 Pant ry Gas St at ion and Convenience St ore M onroe LA 2,756 30 Pant ry Gas St at ion and Convenience St ore M onroe LA 2,806 31 Huttig Building Products, Inc. Saco M E 91,400 32 Ferguson Enterprises, Inc. Baltimore M D 367,000 33 Pep Boys - M anny, M oe & Jack Everett M A 18,572 34 CVS Caremark Corporation Hyannis M A 9,750 35 CVS Caremark Corporation M arstons M ills M A 8,775 36 Walgreen Co. Somerville M A 12,054 37 East Hills At hlet ic Club (Saint M ary's Healt h M gmt Co./Trinit y Healt h) Grand Rapids M I 130,000 38 Orchard Hills Swim & Sport s Club (Saint M ary's Healt h M gmt Co./ Trinit y He alt h) Grand Rapids M I 72,000 39 Pant ry Gas St at ion and Convenience Store D'lberville M S 2,650 40 Pant ry Gas St at ion and Convenience Store Flowood M S 4,505 41 Pant ry Gas St at ion and Convenience Store Vicksburg M S 4,505 42 Pant ry Gas St at ion and Convenience Store Vicksburg M S 2,790 43 Kohl's Department St ores, Inc. Kansas Cit y M O 88,807 44 Shopko St ores, Inc. (2) Lincoln NE 112,260 45 DSM Nutritional Products Inc. Parsippany NJ 106,680 |
|
|
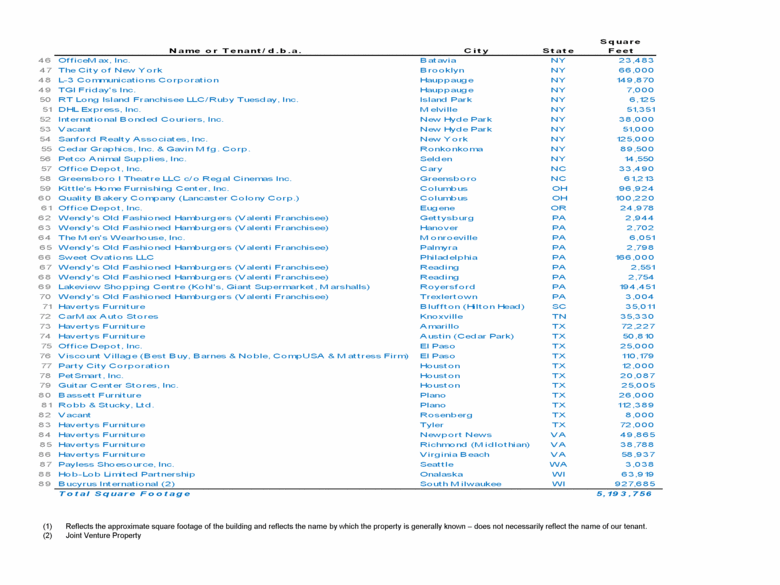
Name o r Tenant / d.b.a. City State Square Feet 46 OfficeMax, Inc. Batavia NY 23,483 47 The City of New York Brooklyn NY 66,000 48 L-3 Communicat ions Corporat ion Hauppauge NY 149,870 49 TGI Friday's Inc. Hauppauge NY 7,000 50 RT Long Island Franchisee LLC/Ruby Tuesday, Inc. Island Park NY 6,125 51 DHL Express, Inc. Melville NY 51,351 52 International Bonded Couriers, Inc. New Hyde Park NY 38,000 53 Vacant New Hyde Park NY 51,000 54 Sanford Realty Associates, Inc. New York NY 125,000 55 Cedar Graphics, Inc. & Gavin Mfg. Corp. Ronkonkoma NY 89,500 56 Petco Animal Supplies, Inc. Selden NY 14,550 57 Of f ice Depot, Inc. Cary NC 33,490 58 Greensboro I Theatre LLC c/o Regal Cinemas Inc. Greensboro NC 61,213 59 Kit t le's Home Furnishing Center, Inc. Columbus OH 96,924 60 Quality Bakery Company (Lancaster Colony Corp.) Columbus OH 100,220 61 Off ice Depot , Inc. Eugene OR 24,978 62 Wendy's Old Fashioned Hamburgers (Valenti Franchisee) Get tysburg PA 2,944 63 Wendy's Old Fashioned Hamburgers (Valenti Franchisee) Hanover PA 2,702 64 The M en's Wearhouse, Inc. Monroeville PA 6,051 65 Wendy's Old Fashioned Hamburgers (Valenti Franchisee) Palmyra PA 2,798 66 Sweet Ovat ions LLC Philadelphia PA 166,000 67 Wendy's Old Fashioned Hamburgers (Valenti Franchisee) Reading PA 2,551 68 Wendy's Old Fashioned Hamburgers (Valenti Franchisee) Reading PA 2,754 69 Lakeview Shopping Centre (Kohl's, Giant Supermarket , M arshalls) Royersford PA 194,451 70 Wendy's Old Fashioned Hamburgers (Valenti Franchisee) Trexlertown PA 3,004 71 Havertys Furniture Bluffton (Hilton Head) SC 35,011 72 CarMax Auto Stores Knoxville TN 35,330 73 Havertys Furniture Amarillo TX 72,227 74 Havertys Furnit ure Aust in (Cedar Park) TX 50,810 75 Off ice Depot , Inc. El Paso TX 25,000 76 Viscount Village (Best Buy, Barnes & Noble, CompUSA & M at tress Firm) El Paso TX 110,179 77 Party City Corporat ion Houston TX 12,000 78 PetSmart , Inc. Houston TX 20,087 79 Guitar Center Stores, Inc. Houston TX 25,005 80 Basset t Furniture Plano TX 26,000 81 Robb & Stucky, Ltd. Plano TX 112,389 82 Vacant Rosenberg TX 8,000 83 Havertys Furnit ure Tyler TX 72,000 84 Havertys Furniture Newport News VA 49,865 85 Havertys Furniture Richmond (Midlothian) VA 38,788 86 Havertys Furniture Virginia Beach VA 58,937 87 Payless Shoesource, Inc. Seat t le WA 3,038 88 Hob-Lob Limited Partnership Onalaska WI 63,919 89 Bucyrus International (2) South Milwaukee WI 927,685 Total Square Footage 5,19 3 ,756 (1) Reflects the approximate square footage of the building and reflects the name by which the property is generally known – does not necessarily reflect the name of our tenant. (2) Joint Venture Property |

