Attached files
| file | filename |
|---|---|
| EX-32.2 - EX-32.2 - ONE LIBERTY PROPERTIES INC | a2234050zex-32_2.htm |
| EX-32.1 - EX-32.1 - ONE LIBERTY PROPERTIES INC | a2234050zex-32_1.htm |
| EX-31.2 - EX-31.2 - ONE LIBERTY PROPERTIES INC | a2234050zex-31_2.htm |
| EX-31.1 - EX-31.1 - ONE LIBERTY PROPERTIES INC | a2234050zex-31_1.htm |
| EX-23.1 - EX-23.1 - ONE LIBERTY PROPERTIES INC | a2234050zex-23_1.htm |
| EX-21.1 - EX-21.1 - ONE LIBERTY PROPERTIES INC | a2234050zex-21_1.htm |
| EX-10.7 - EX-10.7 - ONE LIBERTY PROPERTIES INC | a2234050zex-10_7.htm |
Use these links to rapidly review the document
TABLE OF CONTENTS Form 10-K
PART IV
UNITED STATES
SECURITIES AND EXCHANGE COMMISSION
WASHINGTON, D.C. 20549
FORM 10-K
ý |
ANNUAL REPORT PURSUANT TO SECTION 13 OR 15(d) OF THE SECURITIES EXCHANGE ACT OF 1934 |
|
For the fiscal year ended December 31, 2017 |
||
Or |
||
o |
TRANSITION REPORT PURSUANT TO SECTION 13 OR 15(d) OF THE SECURITIES EXCHANGE ACT OF 1934 |
|
Commission File Number 001-09279
ONE LIBERTY PROPERTIES, INC.
(Exact name of registrant as specified in its charter)
| MARYLAND (State or other jurisdiction of Incorporation or Organization) |
13-3147497 (I.R.S. employer Identification No.) |
|
60 Cutter Mill Road, Great Neck, New York (Address of principal executive offices) |
11021 (Zip Code) |
Registrant's telephone number, including area code: (516) 466-3100
Securities registered pursuant to Section 12(b) of the Act:
| Title of each class | Name of exchange on which registered | |
|---|---|---|
| Common Stock, par value $1.00 per share | New York Stock Exchange |
Securities registered pursuant to Section 12(g) of the Act: NONE
Indicate by check mark if the registrant is a well-known seasoned issuer as defined in Rule 405 of the Securities Act. Yes o No ý
Indicate by check mark if the registrant is not required to file reports pursuant to Section 13 or 15(d) of the Act. Yes o No ý
Indicate by check mark whether the registrant (1) has filed all reports required to be filed by Section 13 or 15(d) of the Securities Exchange Act of 1934 during the preceding 12 months (or for such shorter period that the registrant was required to file such reports), and (2) has been subject to such filing requirements for the past 90 days. Yes ý No o
Indicate by check mark whether the registrant has submitted electronically and posted on its corporate Web site, if any, every Interactive Data File required to be submitted and posted pursuant to Rule 405 of Regulation S-T (§ 232.405 of this chapter) during the preceding 12 months (or for such shorter period that the registrant was required to submit and post such files). Yes ý No o
Indicate by check mark if disclosure of delinquent filers pursuant to Item 405 of Regulation S-K (§229.405 of this chapter) is not contained herein, and will not be contained, to the best of registrant's knowledge, in definitive proxy or information statements incorporated by reference in Part III of this Form 10-K or any amendment to this Form 10-K. o
Indicate by check mark whether the registrant is a large accelerated filer, an accelerated filer, a non-accelerated filer, a small reporting company or an emerging growth company. See definitions of "large accelerated filer," "accelerated filer," "small reporting company" and "emerging growth company" in Rule 12b-2 of the Exchange Act.
| Large accelerated filer o | Accelerated filer ý | Non-accelerated filer o (Do not check if a small reporting company) |
Smaller reporting company o Emerging growth company o |
If an emerging growth company, indicate by check mark if the registrant has elected not to use the extended transition period for complying with any new or revised financial standards provided pursuant to Section 13(a) of the Exchange Act. o
Indicate by check mark whether registrant is a shell company (defined in Rule 12b-2 of the Act). Yes o No ý
As of June 30, 2017 (the last business day of the registrant's most recently completed second quarter), the aggregate market value of all common equity held by non-affiliates of the registrant, computed by reference to the price at which common equity was last sold on said date, was approximately $338 million.
As of March 1, 2018, the registrant had 19,068,336 shares of common stock outstanding.
DOCUMENTS INCORPORATED BY REFERENCE
Portions of the proxy statement for the 2018 annual meeting of stockholders of One Liberty Properties, Inc., to be filed pursuant to Regulation 14A not later than April 30, 2018, are incorporated by reference into Part III of this Annual Report on Form 10-K.
General
We are a self-administered and self-managed real estate investment trust, also known as a REIT. We were incorporated in Maryland on December 20, 1982. We acquire, own and manage a geographically diversified portfolio of industrial, retail (including furniture stores and supermarkets), restaurant, health and fitness and theater properties, many of which are subject to long-term leases. Most of our leases are "net leases" under which the tenant, directly or indirectly, is responsible for paying the real estate taxes, insurance and ordinary maintenance and repairs of the property. As of December 31, 2017, we own 113 properties (excluding a property disposed of in January 2018) and participate in joint ventures that own five properties. These 118 properties are located in 30 states and have an aggregate of approximately 10.7 million square feet (including an aggregate of approximately 1.2 million square feet at properties owned by our joint ventures).
As of December 31, 2017:
- •
- our 2018 contractual rental income (as described below) is $67.7 million.
- •
- the occupancy rate of our properties is 99.6% based on square footage.
- •
- the weighted average remaining term of our mortgage debt is 8.8 years and the weighted average interest rate thereon is 4.22%.
- •
- the weighted average remaining term of the leases generating our 2018 contractual rental income is 8.4 years.
Our 2018 contractual rental income represents, after giving effect to any abatements, concessions or adjustments, the base rent payable to us in 2018 under leases in effect at December 31, 2017. Excluded from 2018 contractual rental income are approximately $483,000 of straight-line rent, amortization of approximately $1.0 million of intangibles, $56,000 of base rent payable through January 31, 2018 with respect to a property we sold in January 2018, and our share of the base rent payable to our joint ventures, which in 2018 is approximately $2.4 million.
2017 Highlights and Recent Developments
In 2017:
- •
- our rental income, net, increased by $4.1 million, or 6.4%, from 2016.
- •
- we acquired four properties for an aggregate purchase price of $43.2 million. The acquired properties account for $3.1 million,
or 4.6%, of our 2018 contractual rental income.
- •
- we sold four properties, three of which were vacant, for a net gain on sale of real estate of $9.8 million. The properties sold
accounted for 0.5% and 2.6% of 2017 and 2016 rental income, net, respectively.
- •
- we obtained proceeds of $21.2 million from mortgage financings, all of which relate to properties acquired in 2017.
- •
- we increased our quarterly dividend by 4.7% to $0.45 per share, commencing with the dividend declared in December 2017 and paid in January
2018.
- •
- we raised net proceeds of approximately $5.6 million from the issuance of 231,000 shares of common stock pursuant to our at-the-market equity offering program.
1
- •
- we re-leased four vacant properties or portions thereof. In 2017, we incurred an aggregate of $739,000 of real estate operating expenses in
carrying such properties. In 2018, we will generate an aggregate of approximately $1.2 million of rental income from such properties and in the future, will not be responsible for the related
operating expenses.
- •
- on January 30, 2018, we sold a multi-tenant retail property located in Fort Bend, Texas, in which we held an 85% interest, for gross proceeds of $9.2 million and paid off the $4.4 million mortgage. In the quarter ending March 31, 2018, we anticipate recognizing a gain on this sale of approximately $2.4 million. The non-controlling interests' share of the gain from the transaction will be approximately $800,000.
In the narrative portion of this Annual Report on Form 10-K, except as otherwise indicated:
- •
- the information with respect to our consolidated joint ventures is generally described as if such ventures are our wholly owned subsidiaries
and information with respect to unconsolidated joint ventures is generally separately described,
- •
- (i) all references to joint ventures refer to unconsolidated joint ventures, (ii) all interest rates with respect to debt give effect to
the related interest rate derivative, if any, (iii) amounts reflected as debt, reflects the gross debt owed, without deducting deferred financing costs, and (iv) square footage and terms
of like import refers to the total square footage of the applicable building, including common areas, if any,
- •
- 2018 contractual rental income derived from multiple properties leased pursuant to a master lease is allocated among such properties based on
management's estimate of the appropriate allocations, and
- •
- the rental, operating, mortgage and statistical information, excludes the Fort Bend, Texas property sold in January 2018, other than with respect to the disclosures under "Item 6. Selected Financial Data" and "Item 7. Management's Discussion and Analysis of Financial Condition—Results of Operations—Comparison of Years Ended December 31, 2017 and 2016 " and "—Results of Operations—Comparison of Years Ended December 31, 2016 and 2015."
Acquisition Strategies
We seek to acquire properties throughout the United States that have locations, demographics and other investment attributes that we believe to be attractive. We believe that long-term leases provide a predictable income stream over the term of the lease, making fluctuations in market rental rates and in real estate values less significant to achieving our overall investment objectives. Our primary goal is to acquire single-tenant properties that are subject to long-term net leases that include periodic contractual rental increases or rent increases based on increases in the consumer price index. Periodic contractual rental increases provide reliable increases in future rent payments and rent increases based on the consumer price index provide protection against inflation. Historically, long-term leases have made it easier for us to obtain longer-term, fixed-rate mortgage financing with principal amortization, thereby moderating the interest rate risk associated with financing or refinancing our property portfolio and reducing the outstanding principal balance over time. We may, however, acquire a property that is subject to a short-term lease when we believe the property represents a favorable opportunity for generating additional income from its re-lease or has significant residual value. Although the acquisition of single-tenant properties subject to net leases is the focus of our investment strategy, we also consider investments in, among other things, (i) properties that can be re-positioned or re-developed, (ii) community shopping centers anchored by national or regional tenants and (iii) properties ground leased to operators of multi-family properties. We pay substantially all the operating expenses at community shopping centers, a significant portion of which is reimbursed by tenants pursuant to their leases.
2
Generally, we hold the properties we acquire for an extended period of time. Our investment criteria are intended to identify properties from which increased asset value and overall return can be realized from an extended period of ownership. Although our investment criteria favor an extended period of ownership, we will dispose of a property if we regard the disposition of the property as an opportunity to realize the overall value of the property sooner or to avoid future risks by achieving a determinable return from the property.
Historically, a significant portion of our portfolio generated rental income from retail properties. We are sensitive to the risks facing the retail industry and have been addressing our exposure thereto by seeking to acquire properties that capitalize on e-commerce activities, such as e-commerce distribution and warehousing facilities, and by being especially selective in acquiring retail properties. As a result of this emphasis, retail properties generated 43.3%, 46.1%, and 49.5% of rental income, net, in 2017, 2016, and 2015, respectively.
We identify properties through the network of contacts of our senior management and our affiliates, which contacts include real estate brokers, private equity firms, banks and law firms. In addition, we attend industry conferences and engage in direct solicitations.
Our charter documents do not limit the number of properties in which we may invest, the amount or percentage of our assets that may be invested in any specific property or property type, or the concentration of investments in any region in the United States. We do not intend to acquire properties located outside of the United States. We will continue to form entities to acquire interests in real properties, either alone or with other investors, and we may acquire interests in joint ventures or other entities that own real property.
It is our policy, and the policy of our affiliated entities, that any investment opportunity presented to us or to any of our affiliated entities that involves the acquisition of a net leased property, a ground lease (other than a ground lease of a multi-family property) or a community shopping center, will first be offered to us and may not be pursued by any of our affiliated entities unless we decline the opportunity. Further, to the extent our affiliates are unable or unwilling to pursue an acquisition of a multi-family property (including a ground lease of a multi-family property), we may pursue such transaction if it meets our investment objectives.
Investment Evaluation
In evaluating potential investments, we consider, among other criteria, the following:
- •
- the current and projected cash flow of the property;
- •
- the estimated return on equity to us;
- •
- an evaluation of the property and improvements, given its location and use;
- •
- local demographics (population and rental trends);
- •
- the terms of tenant leases, including co-tenancy provisions and the relationship between current rents and market rents;
- •
- the ability of a tenant, if a net leased property, or major tenants, if a multi-tenant property, to meet operational needs and lease
obligations;
- •
- an evaluation of the credit quality of the tenant;
- •
- the projected residual value of the property;
- •
- the potential to finance or refinance the property;
- •
- potential for income and capital appreciation;
3
- •
- occupancy of and demand for similar properties in the market area; and
- •
- alternate uses or tenants for the property.
Our Business Objective
Our business objective is to maintain and increase, over time, the cash available for distribution to our stockholders by:
- •
- identifying opportunistic and strategic property acquisitions consistent with our portfolio and our acquisition strategies;
- •
- obtaining mortgage indebtedness (including refinancings) on favorable terms and maintaining access to capital to finance property acquisitions;
and
- •
- monitoring and maintaining our portfolio, including tenant negotiations and lease amendments with tenants that are renewing, expanding or
having financial difficulty; and
- •
- managing our portfolio effectively, including opportunistic and strategic property sales.
Typical Property Attributes
As of December 31, 2017, the properties in our portfolio have the following attributes:
- •
- Net leases. Most of our leases are net leases under which the tenant is
typically responsible for real estate taxes, insurance and ordinary maintenance and repairs. We believe that investments in net leased properties offer reasonably predictable returns.
- •
- Long-term leases. Many of our leases are long-term leases. The weighted
average remaining term of our leases is 8.4 years. Leases representing approximately 27.3% of our 2018 contractual rental income expire between 2023 and 2026 and leases representing
approximately 36.4% of our 2018 contractual rental income expire after 2027.
- •
- Scheduled rent increases. Leases representing approximately 73.6% of our 2018 contractual rental income provide for either periodic contractual rent increases or a rent increase based on the consumer price index.
4
Our Tenants
The following table sets forth information about the diversification of our tenants by industry sector as of December 31, 2017:
Type of Property
|
Number of Tenants |
Number of Properties |
2018 Contractual Rental Income |
Percentage of 2018 Contractual Rental Income |
|||||||||
|---|---|---|---|---|---|---|---|---|---|---|---|---|---|
Industrial |
31 | 28 | $ | 25,119,990 | 37.1 | ||||||||
Retail—General |
57 | 35 | 15,963,958 | 23.6 | |||||||||
Retail—Furniture(1) |
3 | 14 | 6,109,003 | 9.0 | |||||||||
Restaurant |
10 | 16 | 3,185,623 | 4.7 | |||||||||
Health & Fitness |
1 | 3 | 3,080,333 | 4.5 | |||||||||
Retail—Supermarket |
3 | 3 | 2,718,682 | 4.0 | |||||||||
Retail—Office Supply(2) |
1 | 7 | 2,406,728 | 3.6 | |||||||||
Theater |
1 | 2 | 2,293,132 | 3.4 | |||||||||
Other |
5 | 5 | 6,856,708 | 10.1 | |||||||||
| | | | | | | | | | | | | | |
|
112 | 113 | $ | 67,734,157 | 100.0 | ||||||||
| | | | | | | | | | | | | | |
| | | | | | | | | | | | | | |
| | | | | | | | | | | | | | |
- (1)
- Eleven
properties are net leased to Haverty Furniture Companies, Inc., which we refer to as Haverty Furniture, pursuant to a master lease covering all such
properties.
- (2)
- Includes seven properties which are net leased to Office Depot pursuant to seven separate leases. Five of the Office Depot leases contain cross-default provisions.
Many of our tenants (including franchisees of national chains) operate on a national basis including, among others, Advanced Auto, Applebees, Barnes & Noble, Burlington Coat Factory, CarMax, CVS, Famous Footwear, FedEx, Ferguson Enterprises, LA Fitness, Marshalls, Men's Wearhouse, Northern Tool, Office Depot, Party City, PetSmart, Ross Stores, Shutterfly, TGI Friday's, The Toro Company, Urban Outfitters, Walgreens, Wendy's and Whole Foods, and some of our tenants operate on a regional basis, including Haverty Furniture and Giant Food Stores.
Our Leases
Most of our leases are net leases under which the tenant, in addition to its rental obligation, typically is responsible, directly or indirectly for expenses attributable to the operation of the property, such as real estate taxes and assessments, insurance and ordinary maintenance and repairs. The tenant is also generally responsible for maintaining the property and for restoration following a casualty or partial condemnation. The tenant is typically obligated to indemnify us for claims arising from the property and is responsible for maintaining insurance coverage for the property it leases and naming us an additional insured. Under some net leases, we are responsible for structural repairs, including foundation and slab, roof repair or replacement and restoration following a casualty event, and at several properties we are responsible for certain expenses related to the operation and maintenance of the property.
Our typical lease provides for contractual rent increases periodically throughout the term of the lease or for rent increases pursuant to a formula based on the consumer price index. Some of our leases provide for minimum rents supplemented by additional payments based on sales derived from the property subject to the lease (i.e., percentage rent). Percentage rent from four properties contributed $263,000 to 2017 rental income, of which $174,000 was contributed by one tenant. Percentage rent contributed $42,000, and $38,000 to rental income in 2016 and 2015, respectively.
5
Generally, our strategy is to acquire properties that are subject to existing long-term leases or to enter into long-term leases with our tenants. Our leases generally provide the tenant with one or more renewal options.
The following table sets forth scheduled expirations of leases at our properties as of December 31, 2017:
Year of Lease Expiration(1)
|
Number of Expiring Leases |
Approximate Square Footage Subject to Expiring Leases |
2018 Contractual Rental Income Under Expiring Leases |
Percentage of 2018 Contractual Rental Income Represented by Expiring Leases |
|||||||||
|---|---|---|---|---|---|---|---|---|---|---|---|---|---|
2018 |
12 | 206,592 | $ | 1,333,898 | 2.0 | ||||||||
2019 |
12 | 321,507 | 2,952,389 | 4.4 | |||||||||
2020 |
9 | 110,548 | 1,621,506 | 2.4 | |||||||||
2021 |
18 | 578,070 | 4,194,598 | 6.2 | |||||||||
2022 |
25 | 2,144,389 | 14,424,295 | 21.3 | |||||||||
2023 |
13 | 852,141 | 5,689,479 | 8.4 | |||||||||
2024 |
6 | 408,093 | 2,069,484 | 3.1 | |||||||||
2025 |
10 | 387,202 | 5,410,643 | 8.0 | |||||||||
2026 |
11 | 551,229 | 5,266,182 | 7.8 | |||||||||
2027 and thereafter |
33 | 3,827,219 | 24,771,683 | 36.4 | |||||||||
| | | | | | | | | | | | | | |
|
149 | 9,386,990 | $ | 67,734,157 | 100.0 | ||||||||
| | | | | | | | | | | | | | |
| | | | | | | | | | | | | | |
| | | | | | | | | | | | | | |
- (1)
- Lease expirations assume tenants do not exercise existing renewal options.
Financing, Re-Renting and Disposition of Our Properties
Our revolving credit facility provides us with a source of funds that may be used to acquire properties, payoff existing mortgages, and to a more limited extent, invest in joint ventures, implement property improvements and for working capital purposes. Net proceeds received from the sale, financing or refinancing of properties are generally required to be used to repay amounts outstanding under our facility. See "Item 7. Management's Discussion and Analysis of Financial Condition and Results of Operations—Liquidity and Capital Resources—Credit Facility".
We mortgage specific properties on a non-recourse basis, subject to the standard carve-outs described under "Item 2. Properties—Mortgage Debt", to enhance the return on our investment in a specific property. The proceeds of mortgage loans may be used for property acquisitions, investments in joint ventures or other entities that own real property, to reduce bank debt and for working capital purposes.
With respect to properties we acquire on a free and clear basis, we usually seek to obtain long-term fixed-rate mortgage financing, when available at acceptable terms, shortly after the acquisition of such property to avoid the risk of movement of interest rates and fluctuating supply and demand in the mortgage markets. We also will acquire a property that is subject to (and will assume) a fixed-rate mortgage. Substantially all of our mortgages provide for amortization of part of the principal balance during the term, thereby reducing the refinancing risk at maturity. Some of our properties may be financed on a cross-defaulted or cross-collateralized basis, and we may collateralize a single financing with more than one property.
After termination or expiration of any lease relating to any of our properties, we will seek to re-rent or sell such property in a manner that will maximize the return to us, considering, among other factors, the income potential and market value of such property. We acquire properties for long-term
6
investment for income purposes and do not typically engage in the turnover of investments. We will consider the sale of a property if a sale appears advantageous in view of our investment objectives. If there is a substantial tax gain, we may seek to enter into a tax deferred transaction and reinvest the proceeds in another property. Cash realized from the sale of properties, net of required payoffs of the related mortgage debt, if any, required paydowns of our credit facility, and distributions to stockholders, is available for general working capital purposes and the acquisition of additional properties.
Our Joint Ventures
As of December 31, 2017, we participated in five joint ventures that own an aggregate of five properties, with approximately 1.2 million square feet of space. Four of the properties are retail properties and one is an industrial property. We own 50% of the equity interest in all of these joint ventures. At December 31, 2017, our investment in joint ventures was approximately $10.7 million and the occupancy rate at the properties owned by these ventures, based on square footage, was 97.6%.
Based on the leases in effect at December 31, 2017, we anticipate that our share of the base rent payable in 2018 to our joint ventures is approximately $2.4 million. Leases for two properties are expected to contribute 86.5% of the aggregate base rent payable to all of our joint ventures in 2018. Leases with respect to 55.6%, 11.9% and 32.5% of the aggregate base rent payable to all of our joint ventures in 2018, is payable pursuant to leases expiring from 2018 to 2019, from 2020 to 2021, and thereafter, respectively.
See "Item 7. Management's Discussion and Analysis of Financial Condition and Results of Operations—Other Developments" for information regarding properties tenanted by Kmart.
Competition
We face competition for the acquisition of properties from a variety of investors, including domestic and foreign corporations and real estate companies, financial institutions, insurance companies, pension funds, investment funds, other REITs and individuals, many of which have significant advantages over us, including a larger, more diverse group of properties and greater financial (including access to debt on more favorable terms) and other resources than we have.
Our Structure
Nine employees, including Patrick J. Callan, Jr., our president and chief executive officer, Lawrence G. Ricketts, Jr., our executive vice president and chief operating officer, Justin Clair, a vice president, Karen Dunleavy, vice president-financial and five other employees, devote all of their business time to us. Our other executive, administrative, legal, accounting and clerical personnel provide their services to us on a part-time basis pursuant to the compensation and services agreement described below.
We entered into a compensation and services agreement with Majestic Property Management Corp. effective as of January 1, 2007. Majestic Property is wholly-owned by our vice chairman of the board and it provides compensation to certain of our executive officers. Pursuant to this agreement, we pay fees to Majestic Property and Majestic Property provides us with the services of all affiliated executive, administrative, legal, accounting and clerical personnel that we use on a part time basis, as well as property management services, property acquisition, sales and leasing and mortgage brokerage services. The fees we pay Majestic Property are negotiated by us and Majestic Property in consultation with our audit and compensation committees, and are approved by these committees and our independent directors.
7
In 2017, pursuant to the compensation and services agreement, we paid Majestic Property a fee of approximately $2.7 million plus $216,000 for our share of all direct office expenses, including rent, telephone, postage, computer services, supplies and internet usage. Included in the $2.7 million fee is $1,154,000 for property management services—the fee for the property management services is based on 1.5% and 2.0% of the rental payments (including tenant reimbursements) actually received by us from net lease tenants and operating lease tenants, respectively. Property management fees are not paid to Majestic Property with respect to properties managed by third parties. Based on our portfolio of properties at December 31, 2017, we estimate that the property management fee in 2018 will be approximately $1,190,000.
We believe that the compensation and services agreement allows us to benefit from (i) access to, and from the services of, a group of senior executives with significant knowledge and experience in the real estate industry and our company, (ii) other individuals who perform services on our behalf, and (iii) general economies of scale. If not for this agreement, we believe that a company of our size would not have access to the skills and expertise of these executives at the cost that we have incurred and will incur in the future. For a description of the background of our management, please see the information under the heading "Executive Officers" in Part I of this Annual Report. See Note 12 to our consolidated financial statements for information regarding equity awards to individuals performing services on our behalf pursuant to the compensation and services agreement.
Available Information
Our Internet address is www.onelibertyproperties.com. On the Investor Information page of our web site, we post the following filings as soon as reasonably practicable after they are electronically filed with or furnished to the Securities and Exchange Commission (the "SEC"): our annual report on Form 10-K, our quarterly reports on Form 10-Q, our current reports on Form 8-K, and any amendments to those reports filed or furnished pursuant to Section 13(a) or 15(d) of the Securities Exchange Act of 1934, as amended. All such filings on our Investor Information Web page, which also includes Forms 3, 4 and 5 filed pursuant to Section 16(a) of the Securities Exchange Act of 1934, as amended, are available to be viewed free of charge.
On the Corporate Governance page of our web site, we post the following charters and guidelines: Audit Committee Charter, Compensation Committee Charter, Nominating and Corporate Governance Committee Charter, Corporate Governance Guidelines and Code of Business Conduct and Ethics, as amended and restated. All such documents on our Corporate Governance Web page are available to be viewed free of charge.
Information contained on our web site is not part of, and is not incorporated by reference into, this Annual Report on Form 10-K or our other filings with the SEC. A copy of this Annual Report on Form 10-K and those items disclosed on our Investor Information Web page and our Corporate Governance Web page are available without charge upon written request to: One Liberty Properties, Inc., 60 Cutter Mill Road, Suite 303, Great Neck, New York 11021, Attention: Secretary.
Forward-Looking Statements
This Annual Report on Form 10-K, together with other statements and information publicly disseminated by us, contains certain forward-looking statements within the meaning of Section 27A of the Securities Act of 1933, as amended, and Section 21E of the Securities Exchange Act of 1934, as amended. We intend such forward-looking statements to be covered by the safe harbor provision for forward-looking statements contained in the Private Securities Litigation Reform Act of 1995 and include this statement for purposes of complying with these safe harbor provisions. Forward-looking statements, which are based on certain assumptions and describe our future plans, strategies and expectations, are generally identifiable by use of the words "may," "will," "could," "believe," "expect,"
8
"intend," "anticipate," "estimate," "project," or similar expressions or variations thereof. You should not rely on forward-looking statements since they involve known and unknown risks, uncertainties and other factors which are, in some cases, beyond our control and which could materially affect actual results, performance or achievements. Factors which may cause actual results to differ materially from current expectations include, but are not limited to:
- •
- the financial condition of our tenants and the performance of their lease obligations;
- •
- general economic and business conditions, including those currently affecting our nation's economy and real estate markets;
- •
- the availability of and costs associated with sources of liquidity;
- •
- accessibility of debt and equity capital markets;
- •
- general and local real estate conditions, including any changes in the value of our real estate;
- •
- compliance with credit facility covenants;
- •
- increased competition for leasing of vacant space due to current economic conditions;
- •
- changes in governmental laws and regulations relating to real estate and related investments;
- •
- the level and volatility of interest rates;
- •
- competition in our industry; and
- •
- the other risks described under Item 1A. Risk Factors.
Any or all of our forward-looking statements in this report and in any other public statements we make may turn out to be incorrect. Actual results may differ from our forward-looking statements because of inaccurate assumptions we might make or because of the occurrence of known or unknown risks and uncertainties. Many factors mentioned in the discussion below will be important in determining future results. Consequently, no forward-looking statement can be guaranteed and you are cautioned not to place undue reliance on these forward- looking statements. Actual future results may vary materially.
Except as may be required under the United States federal securities laws, we undertake no obligation to publicly update our forward-looking statements, whether as a result of new information, future events or otherwise. You are advised, however, to consult any further disclosures we make in our reports that are filed with or furnished to the SEC.
Set forth below is a discussion of certain risks affecting our business. The categorization of risks set forth below is meant to help you better understand the risks facing our business and is not intended to limit your consideration of the possible effects of these risks to the listed categories. Any adverse effects arising from the realization of any of the risks discussed, including our financial condition and results of operations, may, and likely will, adversely affect many aspects of our business. In addition to the other information contained or incorporated by reference in this Form 10-K, readers should carefully consider the following risk factors:
Risks Related to Our Business
Approximately 40.2% of our 2018 contractual rental income is derived from tenants operating in the retail industry and the failure of those tenants to pay rent would significantly reduce our revenues.
Approximately 40.2% of our 2018 contractual rental income is derived from retail tenants, including 9.0% from tenants engaged in retail furniture (i.e., Haverty Furniture accounts for 7.1% of
9
2018 contractual rental income) and 3.6% from tenants engaged in office supply activities (i.e., Office Depot accounts for 3.6% of 2018 contractual rental income).
Various factors could cause our retail tenants to close their locations, including difficult economic conditions and e-commerce competition. The failure of our retail tenants to meet their lease obligations, including rent payment obligations, due to these and other factors, may make it difficult for us to satisfy our operating and debt service requirements, make capital expenditures and pay dividends.
If we are unable to re-rent properties upon the expiration of our leases or if our tenants default or seek bankruptcy protection, our rental income will be reduced and we would incur additional costs.
Substantially all of our rental income is derived from rent paid by our tenants. From 2018 through 2020, leases with respect to 33 tenants that account for 8.8% of our 2018 contractual rental income, expire. If our tenants, and in particular, our significant tenants, (i) do not renew their leases upon the expiration of same, (ii) default on their obligations or (iii) seek rent relief, lease renegotiation or other accommodations, our revenues could decline and, in certain cases, co-tenancy provisions may be triggered possibly allowing other tenants at the same property to reduce their rental payments or terminate their leases. At the same time, we would remain responsible for the payment of the mortgage obligations with respect to the related properties and would become responsible for the operating expenses related to these properties, including, among other things, real estate taxes, maintenance and insurance. In addition, we may incur expenses in enforcing our rights as landlord. Even if we find replacement tenants or renegotiate leases with current tenants, the terms of the new or renegotiated leases, including the cost of required renovations or concessions to tenants, or the expense of the reconfiguration of a tenant's space, may be less favorable than current lease terms and could reduce the amount of cash available to meet expenses and pay dividends. If tenants facing financial difficulties default on their obligation to pay rent or do not renew their leases at lease expiration, our results of operations and financial condition may be adversely affected. See "Item 7. Management's Discussion and Analysis of Financial Condition or Results of Operations—Other Developments".
Approximately 22.9% of our 2018 contractual rental income is derived from five tenants. The default, financial distress or failure of any of these tenants could significantly reduce our revenues.
Haverty Furniture, LA Fitness, Northern Tool, Office Depot and Ferguson Enterprises account for approximately 7.1%, 4.5%, 4.2%, 3.6% and 3.5%, respectively, of our 2018 contractual rental income. The default, financial distress or bankruptcy of any of these tenants could cause interruptions in the receipt of, or the loss of, a significant amount of rental income and would require us to pay operating expenses (including real estate taxes) currently paid by the tenant. This could also result in the vacancy of the property or properties occupied by the defaulting tenant, which would significantly reduce our rental revenues and net income until the re-rental of the property or properties, and could decrease the ultimate sale value of the property.
Competition that traditional retail tenants face from e-commerce retail sales could adversely affect our business.
Our retail tenants face increasing competition from e-commerce retailers. These retailers may be able to provide customers with better pricing and the ease and comfort of shopping from their home or office. E-commerce sales have been obtaining an increasing percentage of retail sales over the past few years and this trend is expected to continue. The continued growth of e-commerce sales could decrease the need for traditional retail outlets and reduce retailers' space and property requirements. This could adversely impact our ability to rent space at our retail properties and increase competition for retail tenants thereby reducing the rent we would receive at these properties and adversely affect our results of operations and financial condition.
10
If we are unable to refinance our mortgage loans at maturity, we may be forced to sell properties at disadvantageous terms, which would result in the loss of revenues and in a decline in the value of our portfolio.
We had, as of December 31, 2017, $392.5 million in mortgage debt outstanding, all of which is non-recourse (subject to standard carve-outs) and our ratio of mortgage debt to total assets was 53.3%. Our joint ventures had $35.0 million in total mortgage indebtedness (all of which is non-recourse, subject to standard carve-outs). The risks associated with our mortgage debt and the mortgage debt of our joint ventures include the risk that cash flow from properties securing the indebtedness and our available cash and cash equivalents will be insufficient to meet required payments of principal and interest.
Generally, only a portion of the principal of our mortgage indebtedness will be repaid prior to or at maturity and we do not plan to retain sufficient cash to repay such indebtedness at maturity. Accordingly, to meet these obligations if they cannot be refinanced at maturity, we will have to use funds available under our credit facility, if any, and our available cash and cash equivalents to pay our mortgage debt or seek to raise funds through the financing of unencumbered properties, sale of properties or the issuance of additional equity. From 2018 through 2022, approximately $111.4 million of our mortgage debt matures—specifically, $20.4 million in 2018, $14.6 million in 2019, $11.9 million in 2020, $20.7 million in 2021 and $43.8 million in 2022. With respect to our joint ventures, approximately $14.2 million of mortgage debt matures from 2018 through 2022—specifically, $4.3 million in 2018, $877,000 in 2019, $911,000 in 2020, $948,000 in 2021, and $7.2 million in 2022. If we (or our joint ventures) are unsuccessful in refinancing or extending existing mortgage indebtedness or financing unencumbered properties, selling properties on favorable terms or raising additional equity, our cash flow (or the cash flow of a joint venture) will not be sufficient to repay all maturing mortgage debt when payments become due, and we (or a joint venture) may be forced to dispose of properties on disadvantageous terms or convey properties secured by mortgages to the mortgagees, which would lower our revenues and the value of our portfolio.
We may find that the value of a property could be less than the mortgage secured by such property. We may also have to decide whether we should refinance or pay off a mortgage on a property at which the mortgage matures prior to lease expiration and the tenant may not renew the lease. In these types of situations, after evaluating various factors, including among other things, the tenant's competitive position in the applicable submarket, our and our tenant's estimates of its prospects, consideration of alternative uses and opportunities to re-purpose or re-let the property, we may seek to renegotiate the terms of the mortgage, or to the extent that the loan is non-recourse and the terms of the mortgage cannot be satisfactorily renegotiated, forfeit the property by conveying it to the mortgagee and writing off our investment.
Declines in the value of our properties could result in impairment charges.
If we are presented with indications of an impairment in the value of a particular property or group of properties, we will be required to evaluate any such property or properties. If we determine that any of our properties at which indicators of impairment exist have a fair market value below the net book value of such property, we will be required to recognize an impairment charge for the difference between the fair value and the book value during the quarter in which we make such determination; such impairment charges may then increase in subsequent quarters. This evaluation may lead us to write off any straight-line rent receivable and lease intangible balances recorded with respect to such property. In addition, we may incur losses from time to time if we dispose of properties for sales prices that are less than our book value.
11
The concentration of our properties in certain states may make our revenues and the value of our portfolio vulnerable to adverse changes in local economic conditions.
Many of the properties we own are located in the same or a limited number of geographic regions. Approximately 40.7% of our 2018 contractual rental income will be derived from properties located in five states—Texas (11.9%), South Carolina (8.3%), New York (7.9%), Pennsylvania (6.4%) and North Carolina (6.2%). At December 31, 2017, approximately 43.1% of the net book value of our real estate investments was located in five states—Texas (11.3%), South Carolina (9.6%), Pennsylvania (9.3%), Tennessee (7.2%) and Maryland (5.7%). As a result, a decline in the economic conditions in these states or in regions where our properties may be concentrated in the future, may have an adverse effect on the rental and occupancy rates for, and the property values of, these properties, which could lead to a reduction of our rental income and/or impairment charges.
If interest rates increase or credit markets tighten, it may be more difficult for us to secure financing, which may limit our ability to finance or refinance our real estate properties, reduce the number of properties we can acquire, sell certain properties, and decrease our stock price.
An increase in interest rates could reduce the amount investors are willing to pay for our common stock. Because REIT stocks are often perceived as high-yield investments, investors may perceive less relative benefit to owning REIT stocks as interest rates and the yield on government treasuries and other bonds increase.
Increases in interest rates or reduced access to credit markets may make it difficult for us to obtain financing, refinance mortgage debt, limit the mortgage debt available on properties we wish to acquire and limit the properties we can acquire. Even in the event that we are able to secure mortgage debt on, or otherwise finance our real estate properties, due to increased costs associated with securing financing and other factors beyond our control, we may be unable to refinance the entire outstanding loan balance or be subject to unfavorable terms (such as higher loan fees, interest rates and periodic payments) if we do refinance the loan balance. In addition, an increase in interest rates could decrease the amount third parties are willing to pay for our assets, thereby limiting our ability to reposition our portfolio promptly in response to changes in economic or other conditions.
While interest rates have been at historically low levels the past several years, they have recently been increasing and become increasingly volatile. At December 29, 2017 and February 28, 2018, the interest rate on the 10-year treasury note was 2.40% and 2.87%, respectively. If we are required to refinance mortgage debt that matures over the next several years at higher interest rates than such mortgage debt currently bears, the funds available for dividends may be reduced. The following table sets forth, as of December 31, 2017, the principal balance of the mortgage payments due at maturity on our properties and the weighted average interest rate thereon (dollars in thousands):
Year
|
Principal Balances Due at Maturity |
Weighted Average Interest Rate Percentage |
|||||
|---|---|---|---|---|---|---|---|
2018 |
$ | 10,260 | 4.26 | ||||
2019 |
3,485 | 3.88 | |||||
2020 |
— | — | |||||
2021 |
8,463 | 4.13 | |||||
2022 |
31,539 | 3.92 | |||||
2023 and thereafter |
214,048 | 4.20 | |||||
We manage a substantial portion of our exposure to interest rate risk by accessing debt with staggered maturities, obtaining fixed rate mortgage debt and through the use of interest rate swap agreements. However, no amount of hedging activity can fully insulate us from the risks associated with changes in interest rates. Swap agreements involve risk, including that counterparties may fail to honor
12
their obligations under these arrangements, and that these arrangements may cause us to pay higher interest rates on our debt obligations than would otherwise be the case. Failure to hedge effectively against interest rate risk could adversely affect our results of operations and financial condition.
If our borrowings increase, the risk of default on our repayment obligations and our debt service requirements will also increase.
The terms of our revolving credit facility limit our ability to incur indebtedness, including limiting the total indebtedness that we may incur to an amount equal to 70% of the total value (as defined in the credit facility) of our properties. Increased leverage could result in increased risk of default on our payment obligations related to borrowings and in an increase in debt service requirements, which could reduce our net income and the amount of cash available to meet expenses and to pay dividends.
If a significant number of our tenants default or fail to renew expiring leases, or we take impairment charges against our properties, a breach of our revolving credit facility could occur.
Our revolving credit facility includes covenants that require us to maintain certain financial ratios and comply with other requirements. If our tenants default under their leases with us or fail to renew expiring leases, generally accepted accounting principles may require us to recognize impairment charges against our properties, and our financial position could be adversely affected causing us to be in breach of the financial covenants contained in our credit facility.
Failure to meet interest and other payment obligations under our revolving credit facility or a breach by us of the covenants to maintain the financial ratios would place us in default under our credit facility, and, if the banks called a default and required us to repay the full amount outstanding under the credit facility, we might be required to rapidly dispose of our properties, which could have an adverse impact on the amounts we receive on such disposition. If we are unable to dispose of our properties in a timely fashion to the satisfaction of the banks, the banks could foreclose on that portion of our collateral pledged to the banks, which could result in the disposition of our properties at below market values. The disposition of our properties at below our carrying value would adversely affect our net income, reduce our stockholders' equity and adversely affect our ability to pay dividends.
Certain of our net leases and our ground leases require us to pay property related expenses that are not the obligations of our tenants.
Under the terms of substantially all of our net leases, in addition to satisfying their rent obligations, our tenants are responsible for the payment of real estate taxes, insurance and ordinary maintenance and repairs. However, under the provisions of certain net and ground leases, we are required to pay some expenses, such as the costs of environmental liabilities, roof and structural repairs, insurance premiums, certain non-structural repairs and maintenance. If our properties incur significant expenses that must be paid by us under the terms of our leases, our business, financial condition and results of operations will be adversely affected and the amount of cash available to meet expenses and pay dividends may be reduced.
Uninsured and underinsured losses may affect the revenues generated by, the value of, and the return from a property affected by a casualty or other claim.
Most all of our tenants obtain, for our benefit, comprehensive insurance covering our properties in amounts that are intended to be sufficient to provide for the replacement of the improvements at each property. However, the amount of insurance coverage maintained for any property may be insufficient (i) to pay the full replacement cost of the improvements at the property following a casualty event or (ii) if coverage is provided pursuant to a blanket policy and the tenant's other properties are subject to insurance claims. In addition, the rent loss coverage under the policy may not extend for the full period
13
of time that a tenant may be entitled to a rent abatement as a result of, or that may be required to complete restoration following, a casualty event In addition, there are certain types of losses, such as those arising from earthquakes, floods, hurricanes and terrorist attacks, that may be uninsurable or that may not be economically insurable. Changes in zoning, building codes and ordinances, environmental considerations and other factors also may make it impossible or impracticable for us to use insurance proceeds to replace damaged or destroyed improvements at a property. If restoration is not or cannot be completed to the extent, or within the period of time, specified in certain of our leases, the tenant may have the right to terminate the lease. If any of these or similar events occur, it may reduce our revenues, the value of, or our return from, an affected property.
Our revenues and the value of our portfolio are affected by a number of factors that affect investments in real estate generally.
We are subject to the general risks of investing in real estate. These include adverse changes in economic conditions and local conditions such as changing demographics, retailing trends and traffic patterns, declines in the rental rates, changes in the supply and price of quality properties and the market supply and demand of competing properties, the impact of environmental laws, security concerns, prepayment penalties applicable under mortgage financings, changes in tax, zoning, building code, fire safety and other laws and regulations, the type of insurance coverage available in the market, and changes in the type, capacity and sophistication of building systems. Approximately 40.2% and 37.1% of our 2018 contractual rental income is from retail and industrial tenants, respectively, and we are vulnerable to economic declines that negatively impact these sectors of the economy, which could have an adverse effect on our results of operations, liquidity and financial condition.
Our revenues and the value of our portfolio are affected by a number of factors that affect investments in leased real estate generally.
We are subject to the general risks of investing in leased real estate. These include the non-performance of lease obligations by tenants, leasehold improvements that will be costly or difficult to remove should it become necessary to re-rent the leased space for other uses, covenants in certain retail leases that limit the types of tenants to which available space can be rented (which may limit demand or reduce the rents realized on re-renting), rights of termination of leases due to events of casualty or condemnation affecting the leased space or the property or due to interruption of the tenant's quiet enjoyment of the leased premises, and obligations of a landlord to restore the leased premises or the property following events of casualty or condemnation. The occurrence of any of these events could adversely impact our results of operations, liquidity and financial condition.
Real estate investments are relatively illiquid and their values may decline.
Real estate investments are relatively illiquid. Therefore, we will be limited in our ability to reconfigure our real estate portfolio in response to economic changes. We may encounter difficulty in disposing of properties when tenants vacate either at the expiration of the applicable lease or otherwise. If we decide to sell any of our properties, our ability to sell these properties and the prices we receive on their sale may be affected by many factors, including the number of potential buyers, the number of competing properties on the market and other market conditions, as well as whether the property is leased and if it is leased, the terms of the lease. As a result, we may be unable to sell our properties for an extended period of time without incurring a loss, which would adversely affect our results of operations, liquidity and financial condition.
14
We have been, and in the future will be, subject to significant competition and we may not be able to compete successfully for investments.
We have been, and in the future will be, subject to significant competition for attractive investment opportunities from other real estate investors, many of which have greater financial resources than us, including publicly-traded REITs, non-traded REITs, insurance companies, commercial and investment banking firms, private institutional funds, hedge funds, private equity funds and other investors. We may not be able to compete successfully for investments. If we pay higher prices for investments, our returns may be lower and the value of our assets may not increase or may decrease significantly below the amount we paid for such assets. If such events occur, we may experience lower returns on our investments.
We cannot assure you of our ability to pay dividends in the future.
We intend to pay quarterly dividends and to make distributions to our stockholders in amounts such that all or substantially all of our taxable income in each year is distributed. This, along with other factors, will enable us to qualify for the tax benefits accorded to a REIT under the Internal Revenue Code of 1986, as amended, which we refer to as the "Code". We have not established a minimum dividend payment level and our ability to pay dividends may be adversely affected by the risk factors described in this Annual Report on Form 10-K. All distributions will be made at the discretion of our board of directors and will depend on our earnings (including taxable income), our financial condition, maintenance of our REIT status and such other factors as our board of directors may deem relevant from time to time.
If we reduce our dividend, the market value of our common stock may decline.
The level of our common stock dividend is established by our board of directors from time to time based on a variety of factors, including our cash available for distribution, funds from operations, adjusted funds from operations and maintenance of our REIT status. Various factors could cause our board of directors to decrease our dividend level, including insufficient income to cover our dividends, tenant defaults or bankruptcies resulting in a material reduction in our funds from operations or a material loss resulting from an adverse change in the value of one or more of our properties. If our board of directors determines to reduce our common stock dividend, the market value of our common stock could be adversely affected.
Our current and future investments in joint ventures could be adversely affected by the lack of sole decision making authority, reliance on joint venture partners' financial condition or insurance coverage, disputes that may arise between our joint venture partners and us and our reliance on one significant joint venture partner.
A number of properties in which we have an interest are owned through consolidated and unconsolidated joint ventures. We may continue to acquire properties through joint ventures and/or contribute some of our properties to joint ventures. Investments in joint ventures may, under certain circumstances, involve risks not present when a third party is not involved, including the possibility that joint venture partners might file for bankruptcy protection, fail to fund their share of required capital contributions or obtain insurance coverage pursuant to a blanket policy as a result of which claims with respect to other properties covered by such policy and in which we have no interest could reduce or eliminate the coverage available with respect to the joint venture properties. Further, joint venture partners may have conflicting business interests or goals, and as a result there is the potential risk of impasses on decisions, such as a sale and the timing thereof. Any disputes that may arise between joint venture partners and us may result in litigation or arbitration that would increase our expenses and prevent our officers and/or directors from focusing their time and effort on our business. Consequently, actions by or disputes with joint venture partners might result in subjecting properties owned by the joint venture to additional risk. With respect to our (i) consolidated joint ventures, we own, with two
15
joint venture partners and their respective affiliates, five properties that account for 5.1% of 2018 contractual rental income (and we own one property, of which our share of the annual base rent in 2018 is $1.4 million, with one of these joint venture partners through an unconsolidated joint venture), and (ii) unconsolidated joint ventures, we own, with one joint venture partner and its affiliates, three properties which account for our $326,000 share of 2018 base rent payable. We may be adversely affected if we are unable to maintain a satisfactory working relationship with these joint venture partners or if any of these partners becomes financially distressed.
Compliance with environmental regulations and associated costs could adversely affect our results of operations and liquidity.
Under various federal, state and local laws, ordinances and regulations, an owner or operator of real property may be required to investigate and clean up hazardous or toxic substances or petroleum product releases at the property and may be held liable to a governmental entity or to third parties for property damage and for investigation and cleanup costs incurred in connection with contamination. The cost of investigation, remediation or removal of hazardous or toxic substances may be substantial, and the presence of such substances, or the failure to properly remediate a property, may adversely affect our ability to sell or rent the property or to borrow money using the property as collateral. In connection with our ownership, operation and management of real properties, we may be considered an owner or operator of the properties and, therefore, potentially liable for removal or remediation costs, as well as certain other related costs, including governmental fines and liability for injuries to persons and property, not only with respect to properties we own now or may acquire, but also with respect to properties we have owned in the past.
We cannot provide any assurance that existing environmental studies with respect to any of our properties reveal all potential environmental liabilities, that any prior owner of a property did not create any material environmental condition not known to us, or that a material environmental condition does not otherwise exist, or may not exist in the future, as to any one or more of our properties. If a material environmental condition does in fact exist, or exists in the future, the remediation costs could have a material adverse impact upon our results of operations, liquidity and financial condition.
Compliance with the Americans with Disabilities Act could be costly.
Under the Americans with Disabilities Act of 1990, all public accommodations must meet Federal requirements for access and use by disabled persons. A determination that our properties do not comply with the Americans with Disabilities Act could result in liability for both governmental fines and damages. If we are required to make unanticipated major modifications to any of our properties to comply with the Americans with Disabilities Act, which are determined not to be the responsibility of our tenants, we could incur unanticipated expenses that could have an adverse impact upon our results of operations, liquidity and financial condition.
Our senior management and other key personnel are critical to our business and our future success depends on our ability to retain them.
We depend on the services of Matthew J. Gould, chairman of our board of directors, Fredric H. Gould, vice chairman of our board of directors, Patrick J. Callan, Jr., our president and chief executive officer, Lawrence G. Ricketts, Jr., our executive vice president and chief operating officer, David W. Kalish, our senior vice president and chief financial officer and Karen Dunleavy, our vice president—financial, and other members of our senior management to carry out our business and investment strategies. Only three of our senior officers, Messrs. Callan and Ricketts, and Ms. Dunleavy, devote all of their business time to us. The remainder of our senior management provides services to us on a part-time, as-needed basis. The loss of the services of any of our senior management or other key
16
personnel, the inability or failure of the members of senior management providing services to us on a part-time basis to devote sufficient time or attention to our activities or our inability to recruit and retain qualified personnel in the future, could impair our ability to carry out our business and investment strategies.
Our transactions with affiliated entities involve conflicts of interest.
From time to time we have entered into transactions with persons and entities affiliated with us and with certain of our officers and directors. Such transactions involve a potential conflict of interest, and entail a risk that we could have obtained more favorable terms if we had entered into such transaction with an unaffiliated third party. Our policy for transactions with affiliates is to have these transactions approved by our audit committee. We entered into a compensation and services agreement with Majestic Property effective as of January 1, 2007. Majestic Property is wholly-owned by the vice chairman of our board of directors and it provides compensation to certain of our part-time senior executive officers and other individuals performing services on our behalf. Pursuant to the compensation and services agreement, we pay an annual fee to Majestic Property which provides us with the services of all affiliated executive, administrative, legal, accounting and clerical personnel that we use on a part time basis, as well as property management services, property acquisition, sales and leasing and mortgage brokerage services. In 2017, pursuant to the compensation and services agreement, we paid Majestic Property a fee of $2.7 million and an additional $216,000 for our share of all direct office expenses, including rent, telephone, postage, computer services, supplies, and internet usage. We also obtain our property insurance in conjunction with Gould Investors L.P., our affiliate, and in 2017, reimbursed Gould Investors $790,000 for our share of the insurance premiums paid by Gould Investors. Gould Investors beneficially owns approximately 9.5% of our outstanding common stock and certain of our senior executive officers are also executive officers of the managing general partner of Gould Investors. See Note 12 of our consolidated financial statements for information regarding equity awards to individuals performing services on our behalf pursuant to the compensation and services agreement.
The failure of any bank in which we deposit our funds could have an adverse impact on our financial condition.
We have diversified our cash and cash equivalents between several banking institutions in an attempt to minimize exposure to any one of these entities. However, the Federal Deposit Insurance Corporation only insures accounts in amounts up to $250,000 per depositor per insured bank. We currently have cash and cash equivalents deposited in certain financial institutions significantly in excess of federally insured levels. If any of the banking institutions in which we have deposited funds ultimately fails, we may lose our deposits over $250,000. The loss of our deposits may have an adverse effect on our financial condition.
Breaches of information technology systems could materially harm our business and reputation.
We collect and retain on information technology systems, certain financial, personal and other sensitive information provided by third parties, including tenants, vendors and employees. We also rely on information technology systems for the collection and distribution of funds. There can be no assurance that we will be able to prevent unauthorized access to sensitive information or the unauthorized distribution of funds. Any loss of this information or unauthorized distribution of funds as a result of a breach of information technology systems may result in loss of funds to which we are entitled, legal liability and costs (including damages and penalties), as well as damage to our reputation, that could materially and adversely affect our business.
17
We are dependent on third party software for our billing and financial reporting processes.
We are dependent on third party software, and in particular Yardi's property management software, for generating tenant invoices and financial reports. If the software fails (including a failure resulting from such parties unwillingness or inability to maintain or upgrade the functionality of the software), our ability to bill tenants and prepare financial reports could be impaired which would adversely affect our business.
Risks Related to the REIT Industry
Legislative, regulatory or administrative changes could adversely affect us or our stockholders.
The tax laws or regulations governing REITs or the administrative interpretations thereof may be amended at any time. We cannot predict if or when any new or amended law, regulation or administrative interpretation will be adopted, promulgated or become effective, and any such change may apply retroactively. We and our stockholders may be adversely affected by any new or amended law, regulation or administrative interpretation.
On December 22, 2017, the Tax Cuts and Jobs Act, which we refer to as the "Tax Act", was enacted. The Tax Act enacted significant changes to the U.S. federal income tax rules for taxation of individuals and corporations, generally effective for taxable years beginning after December 31, 2017. Most of the changes applicable to individuals are temporary and apply only to taxable years beginning after December 31, 2017 and before January 1, 2026. The Tax Act makes numerous large and small changes to the tax rules that do not affect REITs directly but may affect our stockholders and may indirectly affect us.
While the changes in the Tax Act generally appear to be favorable with respect to REITs, the extensive changes to non-REIT provisions in the Code may have unanticipated effects on us or our stockholders. Investors are urged to consult with their tax advisors with respect to the status of the Tax Act and any other regulatory or administrative developments and proposals and their potential effect on investment in our capital stock.
Failure to qualify as a REIT could result in material adverse tax consequences and could significantly reduce cash available for distributions.
We operate so as to qualify as a REIT under the Code. Qualification as a REIT involves the application of technical and complex legal provisions for which there are limited judicial and administrative interpretations. The determination of various factual matters and circumstances not entirely within our control may affect our ability to qualify as a REIT. In addition, no assurance can be given that legislation, new regulations, administrative interpretations or court decisions will not significantly change the tax laws with respect to qualification as a REIT or the federal income tax consequences of such qualification. If we fail to quality as a REIT, we will be subject to federal, certain additional state and local income tax (including any applicable alternative minimum tax) on our taxable income at regular corporate rates and would not be allowed a deduction in computing our taxable income for amounts distributed to stockholders. In addition, unless entitled to relief under certain statutory provisions, we would be disqualified from treatment as a REIT for the four taxable years following the year during which qualification is lost. The additional tax would reduce significantly our net income and the cash available to pay dividends.
We are subject to certain distribution requirements that may result in our having to borrow funds at unfavorable rates.
To obtain the favorable tax treatment associated with being a REIT, we generally are required, among other things, to distribute to our stockholders at least 90% of our ordinary taxable income
18
(subject to certain adjustments) each year. To the extent that we satisfy these distribution requirements, but distribute less than 100% of our taxable income we will be subject to Federal and state corporate tax on our undistributed taxable income.
As a result of differences in timing between the receipt of income and the payment of expenses, and the inclusion of such income and the deduction of such expenses in arriving at taxable income, and the effect of nondeductible capital expenditures, the creation of reserves and the timing of required debt service (including amortization) payments, we may need to borrow funds in order to make the distributions necessary to retain the tax benefits associated with qualifying as a REIT, even if we believe that then prevailing market conditions are not generally favorable for such borrowings. Such borrowings could reduce our net income and the cash available to pay dividends.
Compliance with REIT requirements may hinder our ability to maximize profits.
In order to qualify as a REIT for Federal income tax purposes, we must continually satisfy tests concerning, among other things, our sources of income, the amounts we distribute to our stockholders and the ownership of our stock. We may also be required to make distributions to stockholders at disadvantageous times or when we do not have funds readily available for distribution. Accordingly, compliance with REIT requirements may hinder our ability to operate solely on the basis of maximizing profits.
In order to qualify as a REIT, we must also ensure that at the end of each calendar quarter, at least 75% of the value of our assets consists of cash, cash items, government securities and real estate assets. Any investment in securities cannot include more than 10% of the outstanding voting securities of any one issuer or more than 10% of the total value of the outstanding securities of any one issuer. In addition, no more than 5% of the value of our assets can consist of the securities of any one issuer, other than a qualified REIT security. If we fail to comply with these requirements, we must dispose of such portion of these securities in excess of these percentages within 30 days after the end of the calendar quarter in order to avoid losing our REIT status and suffering adverse tax consequences. This requirement could cause us to dispose of assets for consideration that is less than their true value and could lead to an adverse impact on our results of operations and financial condition.
Item 1B. Unresolved Staff Comments.
None.
As of December 31, 2017, we own 113 properties with an aggregate net book value of $660.0 million. Our occupancy rate, based on square footage, was 99.6% and 97.3% as of December 31, 2017 and 2016, respectively.
We also participate in joint ventures that own five properties and at December 31, 2017, our investment in these unconsolidated joint ventures is $10.7 million. The occupancy rate of our joint venture properties, based on square footage, was 97.6% and 97.9% as of December 31, 2017 and 2016, respectively.
19
Our Properties
The following table details, as of December 31, 2017, certain information about our properties:
Location
|
Type of Property | Percentage of 2018 Contractual Rental Income |
Approximate Square Footage of Building |
2018 Contractual Rental Income per Square Foot |
||||||||
|---|---|---|---|---|---|---|---|---|---|---|---|---|
Fort Mill, SC |
Industrial | 4.2 | 701,595 | $ | 4.02 | |||||||
Baltimore, MD |
Industrial | 3.5 | 367,000 | 6.39 | ||||||||
Royersford, PA(1) |
Retail | 3.2 | 194,600 | 11.48 | ||||||||
Round Rock, TX |
Assisted Living Facility | 3.0 | 87,560 | 23.27 | ||||||||
Lebanon, TN |
Industrial | 3.0 | 540,200 | 3.73 | ||||||||
Hauppauge, NY |
Industrial | 2.6 | 149,870 | 11.87 | ||||||||
El Paso, TX |
Industrial | 2.6 | 419,821 | 4.21 | ||||||||
Beachwood, OH(2) |
Apartments | 2.4 | 349,999 | 4.68 | ||||||||
Greensboro, NC |
Theater | 2.3 | 61,213 | 25.92 | ||||||||
W. Hartford, CT |
Retail—Supermarket | 2.3 | 47,174 | 32.97 | ||||||||
Littleton, CO(3) |
Retail | 2.1 | 101,596 | 14.45 | ||||||||
St. Louis, MO(4) |
Industrial | 2.1 | 339,094 | 4.17 | ||||||||
Secaucus, NJ |
Health & Fitness | 2.0 | 44,863 | 30.40 | ||||||||
El Paso, TX(5) |
Retail | 1.9 | 110,179 | 12.22 | ||||||||
McCalla, AL |
Industrial | 1.8 | 294,000 | 4.18 | ||||||||
Lincoln, NE |
Retail | 1.8 | 112,260 | 10.75 | ||||||||
Brooklyn, NY |
Office | 1.8 | 66,000 | 18.15 | ||||||||
Wheaton, IL(2) |
Apartments | 1.7 | 300,104 | 3.88 | ||||||||
Knoxville, TN |
Retail | 1.7 | 35,330 | 32.84 | ||||||||
St. Louis Park, MN(4) |
Retail | 1.7 | 131,710 | 8.50 | ||||||||
Fort Mill, SC |
Industrial | 1.7 | 303,188 | 3.69 | ||||||||
Joppa, MD |
Industrial | 1.6 | 258,710 | 4.08 | ||||||||
Ankeny, IA(4) |
Industrial | 1.5 | 208,234 | 4.96 | ||||||||
Tucker, GA |
Health & Fitness | 1.4 | 58,800 | 16.67 | ||||||||
Pittston, PA |
Industrial | 1.4 | 249,600 | 3.73 | ||||||||
Lakemoor, IL(2) |
Apartments | 1.2 | 480,684 | 1.70 | ||||||||
Saco, ME |
Industrial | 1.2 | 131,400 | 6.12 | ||||||||
Cedar Park, TX |
Retail—Furniture | 1.1 | 50,810 | 14.71 | ||||||||
Hamilton, OH |
Health & Fitness | 1.1 | 38,000 | 19.38 | ||||||||
Columbus, OH |
Retail—Furniture | 1.1 | 96,924 | 7.40 | ||||||||
Indianapolis, IN |
Theater | 1.0 | 57,688 | 12.25 | ||||||||
Indianapolis, IN |
Industrial | 1.0 | 125,622 | 5.43 | ||||||||
Lake Charles, LA(6) |
Retail | 1.0 | 54,229 | 12.23 | ||||||||
Greenville, SC(7) |
Industrial | 0.9 | 142,200 | 4.39 | ||||||||
Ft. Myers, FL |
Retail | 0.9 | 29,993 | 20.17 | ||||||||
Ronkonkoma, NY(4) |
Industrial | 0.9 | 90,599 | 6.61 | ||||||||
Huntersville, NC |
Industrial | 0.9 | 78,319 | 7.50 | ||||||||
Kennesaw, GA |
Retail | 0.8 | 32,138 | 17.90 | ||||||||
Memphis, TN |
Industrial | 0.8 | 224,749 | 2.56 | ||||||||
Wichita, KS |
Retail—Furniture | 0.8 | 88,108 | 6.35 | ||||||||
Greenville, SC(7) |
Industrial | 0.8 | 128,000 | 4.35 | ||||||||
Champaign, IL(4) |
Retail | 0.8 | 50,530 | 10.78 | ||||||||
Chicago, IL |
Retail—Office Supply | 0.8 | 23,939 | 22.16 | ||||||||
New Hope, MN |
Industrial | 0.8 | 122,461 | 4.33 | ||||||||
20
Location
|
Type of Property | Percentage of 2018 Contractual Rental Income |
Approximate Square Footage of Building |
2018 Contractual Rental Income per Square Foot |
||||||||
|---|---|---|---|---|---|---|---|---|---|---|---|---|
Clemmons, NC |
Retail | 0.8 | 96,725 | 5.40 | ||||||||
Melville, NY |
Industrial | 0.8 | 51,351 | 10.06 | ||||||||
Tyler, TX |
Retail—Furniture | 0.7 | 72,000 | 6.75 | ||||||||
Athens, GA(8) |
Retail | 0.7 | 41,280 | 11.63 | ||||||||
Fayetteville, GA |
Retail—Furniture | 0.7 | 65,951 | 6.97 | ||||||||
Louisville, KY |
Industrial | 0.7 | 125,370 | 3.60 | ||||||||
Onalaska, WI |
Retail | 0.7 | 63,919 | 7.00 | ||||||||
Cary, NC |
Retail—Office Supply | 0.7 | 33,490 | 13.29 | ||||||||
Highlands Ranch, CO |
Retail | 0.6 | 43,480 | 10.12 | ||||||||
New Hyde Park, NY |
Industrial | 0.6 | 38,000 | 10.99 | ||||||||
Houston, TX |
Retail | 0.6 | 25,005 | 16.70 | ||||||||
Richmond, VA |
Retail—Furniture | 0.6 | 38,788 | 10.53 | ||||||||
Amarillo, TX |
Retail—Furniture | 0.6 | 72,027 | 5.64 | ||||||||
Deptford, NJ |
Retail | 0.6 | 25,358 | 15.90 | ||||||||
Virginia Beach, VA |
Retail—Furniture | 0.6 | 58,937 | 6.82 | ||||||||
Lexington, KY |
Retail—Furniture | 0.6 | 30,173 | 12.48 | ||||||||
Eugene, OR |
Retail—Office Supply | 0.5 | 24,978 | 14.88 | ||||||||
Duluth, GA |
Retail—Furniture | 0.5 | 50,260 | 7.29 | ||||||||
Newark, DE |
Retail | 0.5 | 23,547 | 15.40 | ||||||||
Newport News, VA |
Retail—Furniture | 0.5 | 49,865 | 7.09 | ||||||||
Woodbury, MN |
Retail | 0.5 | 49,406 | 7.00 | ||||||||
El Paso, TX |
Retail—Office Supply | 0.5 | 25,000 | 13.81 | ||||||||
Columbus, OH |
Industrial | 0.5 | 105,191 | 3.25 | ||||||||
Houston, TX |
Retail | 0.5 | 20,087 | 16.00 | ||||||||
Durham, NC |
Industrial | 0.5 | 46,181 | 6.95 | ||||||||
Greensboro, NC |
Retail | 0.4 | 12,950 | 23.00 | ||||||||
Hyannis, MA |
Retail | 0.4 | 9,750 | 30.07 | ||||||||
Selden, NY |
Retail | 0.4 | 14,555 | 20.00 | ||||||||
Gurnee, IL |
Retail—Furniture | 0.4 | 22,768 | 12.21 | ||||||||
Bluffton, SC |
Retail—Furniture | 0.4 | 35,011 | 7.92 | ||||||||
Naples, FL |
Retail—Furniture | 0.4 | 15,912 | 17.00 | ||||||||
Pinellas Park, FL |
Industrial | 0.4 | 53,064 | 5.03 | ||||||||
Carrollton, GA |
Restaurant | 0.4 | 6,012 | 43.87 | ||||||||
Batavia, NY |
Retail—Office Supply | 0.4 | 23,483 | 11.09 | ||||||||
Philadelphia, PA |
Retail—Supermarket | 0.4 | 57,653 | 4.51 | ||||||||
Hauppauge, NY |
Restaurant | 0.4 | 7,000 | 36.65 | ||||||||
Cartersville, GA |
Restaurant | 0.4 | 5,635 | 44.16 | ||||||||
Richmond, VA |
Restaurant | 0.3 | 9,367 | 25.07 | ||||||||
Greensboro, NC |
Restaurant | 0.3 | 6,655 | 35.13 | ||||||||
W. Hartford, CT(9) |
Retail | 0.3 | — | — | ||||||||
Myrtle Beach, SC |
Restaurant | 0.3 | 6,734 | 31.83 | ||||||||
Somerville, MA |
Retail | 0.3 | 12,054 | 17.42 | ||||||||
Kennesaw, GA |
Restaurant | 0.3 | 4,051 | 50.43 | ||||||||
Bolingbrook, IL |
Retail | 0.3 | 33,111 | 6.10 | ||||||||
Concord, NC |
Restaurant | 0.3 | 4,749 | 42.23 | ||||||||
Cape Girardeau, MO |
Retail | 0.3 | 13,502 | 14.71 | ||||||||
Lawrenceville, GA |
Restaurant | 0.3 | 4,025 | 48.64 | ||||||||
Everett, MA |
Retail | 0.3 | 18,572 | 10.39 | ||||||||
21
Location
|
Type of Property | Percentage of 2018 Contractual Rental Income |
Approximate Square Footage of Building |
2018 Contractual Rental Income per Square Foot |
||||||||
|---|---|---|---|---|---|---|---|---|---|---|---|---|
Marston Mills, MA |
Retail | 0.3 | 8,775 | 20.75 | ||||||||
Miamisburg, OH |
Industrial | 0.2 | 35,707 | 4.57 | ||||||||
Monroeville, PA |
Retail | 0.2 | 6,051 | 25.30 | ||||||||
Reading, PA |
Restaurant | 0.2 | 2,754 | 52.00 | ||||||||
Reading, PA |
Restaurant | 0.2 | 2,551 | 54.79 | ||||||||
West Palm Beach, FL |
Industrial | 0.2 | 10,361 | 13.17 | ||||||||
Gettysburg, PA |
Restaurant | 0.2 | 2,944 | 43.42 | ||||||||
Hanover, PA |
Restaurant | 0.2 | 2,702 | 46.74 | ||||||||
Houston, TX |
Retail | 0.2 | 12,000 | 10.50 | ||||||||
Palmyra, PA |
Restaurant | 0.2 | 2,798 | 44.43 | ||||||||
Trexlertown, PA |
Restaurant | 0.2 | 3,004 | 40.55 | ||||||||
Cuyahoga Falls, OH |
Retail | 0.2 | 6,796 | 17.21 | ||||||||
South Euclid, OH |
Retail | 0.2 | 11,672 | 9.94 | ||||||||
Hilliard, OH |
Retail | 0.2 | 6,751 | 15.55 | ||||||||
Lawrence, KS |
Retail | 0.2 | 8,600 | 12.21 | ||||||||
Port Clinton, OH |
Retail | 0.1 | 6,749 | 15.19 | ||||||||
Indianapolis, IN |
Restaurant | 0.1 | 12,820 | 6.43 | ||||||||
Rosenberg, TX |
Retail | 0.1 | 8,000 | 8.79 | ||||||||
Seattle, WA |
Retail | 0.1 | 3,053 | 16.00 | ||||||||
Louisville, KY |
Industrial | 0.1 | 9,642 | 4.02 | ||||||||
Crystal Lake, IL(10) |
Vacant | — | 32,446 | — | ||||||||
| | | | | | | | | | | | | |
|
100.0 | 9,428,251 | ||||||||||
| | | | | | | | | | | | | |
| | | | | | | | | | | | | |
| | | | | | | | | | | | | |
- (1)
- This
property, a community shopping center, is leased to eleven tenants. Contractual rental income per square foot excludes 3,850 vacant square feet. Approximately
27.9% of the square footage is leased to a supermarket.
- (2)
- This
property is ground leased to a multi-unit apartment complex owner/operator. Reflects contingent rent that may be received subject to the satisfaction of
performance requirements. See Notes 4 and 7 of our consolidated financial statements.
- (3)
- This
property, a community shopping center, is leased to 27 tenants. Contractual rental income per square foot excludes 2,570 vacant square feet.
- (4)
- This
property has two tenants.
- (5)
- This
property has four tenants. Contractual rental income per square foot excludes 2,395 vacant square feet.
- (6)
- This
property has three tenants. Approximately 43.4% of the square footage is leased to a retail office supply operator.
- (7)
- This
property has three tenants.
- (8)
- This
property has two tenants. Approximately 48.4% of the square footage is leased to a retail office supply operator.
- (9)
- This property provides additional parking for the W. Hartford, CT, retail supermarket.
22
- (10)
- This property was operated as a hhgregg. The tenant filed for Chapter 11 bankruptcy protection, rejected the lease and in late May 2017, vacated the property. At December 31, 2017, the property is vacant.
Properties Owned by Joint Ventures
The following table sets forth, as of December 31, 2017, information about the properties owned by joint ventures in which we are a venture partner:
Location
|
Type of Property |
Percentage of Base Rent Payable in 2018 Contributed by the Applicable Joint Venture(1) |
Approximate Square Footage of Building |
2018 Base Rent per Square Foot |
||||||||
|---|---|---|---|---|---|---|---|---|---|---|---|---|
Manahawkin, NJ(2) |
Retail | 59.4 | 319,349 | $ | 9.92 | |||||||
Milwaukee, WI |
Industrial | 27.1 | 750,300 | 1.75 | ||||||||
Savannah, GA |
Retail | 7.4 | 45,973 | 7.77 | ||||||||
Savannah, GA |
Retail | 5.1 | 101,550 | 2.44 | ||||||||
Savannah, GA |
Retail | 1.0 | 7,959 | 5.93 | ||||||||
| | | | | | | | | | | | | |
|
100.0 | 1,225,131 | ||||||||||
| | | | | | | | | | | | | |
| | | | | | | | | | | | | |
| | | | | | | | | | | | | |
- (1)
- Represents
the base rent payable in 2018 with respect to such joint venture property, expressed as a percentage of the aggregate base rent payable in 2018 with
respect to all of our joint venture properties.
- (2)
- This property, a community shopping center, is leased to 25 tenants. Base rent per square foot excludes 29,068 vacant square feet.
23
Geographic Concentration
As of December 31, 2017, the 113 properties owned by us are located in 30 states. The following table sets forth information, presented by state, related to our properties as of December 31, 2017:
State
|
Number of Properties |
2018 Contractual Rental Income |
Percentage of 2018 Contractual Rental Income |
Approximate Building Square Feet |
|||||||||
|---|---|---|---|---|---|---|---|---|---|---|---|---|---|
Texas |
11 | $ | 8,043,732 | 11.9 | 902,489 | ||||||||
South Carolina |
6 | 5,610,987 | 8.3 | 1,316,728 | |||||||||
New York |
8 | 5,317,586 | 7.9 | 440,858 | |||||||||
Pennsylvania |
10 | 4,316,651 | 6.4 | 524,657 | |||||||||
North Carolina |
8 | 4,193,700 | 6.2 | 340,282 | |||||||||
Ohio |
9 | 4,037,748 | 6.0 | 657,789 | |||||||||
Georgia |
9 | 3,774,291 | 5.6 | 268,152 | |||||||||
Tennessee |
3 | 3,750,286 | 5.5 | 800,279 | |||||||||
Illinois |
7 | 3,538,228 | 5.2 | 943,582 | |||||||||
Maryland |
2 | 3,402,779 | 5.0 | 625,710 | |||||||||
Minnesota |
3 | 1,994,870 | 2.9 | 303,577 | |||||||||
Colorado |
2 | 1,871,008 | 2.8 | 145,076 | |||||||||
Connecticut |
2 | 1,779,365 | 2.6 | 47,174 | |||||||||
New Jersey |
2 | 1,766,818 | 2.6 | 70,221 | |||||||||
Missouri |
2 | 1,611,325 | 2.4 | 352,596 | |||||||||
Indiana |
3 | 1,471,540 | 2.2 | 196,130 | |||||||||
Virginia |
4 | 1,398,944 | 2.1 | 156,957 | |||||||||
Florida |
4 | 1,278,657 | 1.9 | 109,330 | |||||||||
Alabama |
1 | 1,228,353 | 1.8 | 294,000 | |||||||||
Nebraska |
1 | 1,207,188 | 1.8 | 112,260 | |||||||||
Iowa |
1 | 1,033,122 | 1.5 | 208,234 | |||||||||
Massachusetts |
4 | 878,252 | 1.3 | 49,151 | |||||||||
Kentucky |
3 | 866,722 | 1.3 | 165,185 | |||||||||
Maine |
1 | 803,670 | 1.1 | 131,400 | |||||||||
Kansas |
2 | 664,617 | 1.0 | 96,708 | |||||||||
Louisiana |
1 | 663,125 | 1.0 | 54,229 | |||||||||
Other |
4 | 1,230,593 | 1.7 | 115,497 | |||||||||
| | | | | | | | | | | | | | |
|
113 | $ | 67,734,157 | 100.0 | 9,428,251 | ||||||||
| | | | | | | | | | | | | | |
| | | | | | | | | | | | | | |
| | | | | | | | | | | | | | |
The following table sets forth information, presented by state, related to the properties owned by our joint ventures as of December 31, 2017:
State
|
Number of Properties |
Our Share of the Base Rent Payable in 2018 to these Joint Ventures |
Approximate Building Square Feet |
|||||||
|---|---|---|---|---|---|---|---|---|---|---|
New Jersey |
1 | $ | 1,439,770 | 319,349 | ||||||
Wisconsin |
1 | 657,844 | 750,300 | |||||||
Georgia |
3 | 325,958 | 155,482 | |||||||
| | | | | | | | | | | |
|
5 | $ | 2,423,572 | 1,225,131 | ||||||
| | | | | | | | | | | |
| | | | | | | | | | | |
| | | | | | | | | | | |
24
Mortgage Debt
At December 31, 2017, we had:
- •
- 69 first mortgages secured by 86 of our 113 properties; and
- •
- $392.5 million of mortgage debt outstanding with a weighted average interest rate of 4.22% and a weighted average remaining term to maturity of approximately 8.8 years. Substantially all of such mortgage debt bears fixed interest at rates ranging from 3.02% to 6.59% and contains prepayment penalties.
The following table sets forth scheduled principal mortgage payments due on our properties as of December 31, 2017 (dollars in thousands):
YEAR
|
PRINCIPAL PAYMENTS DUE |
|||
|---|---|---|---|---|
2018 |
$ | 20,448 | ||
2019 |
14,610 | |||
2020 |
11,901 | |||
2021 |
20,742 | |||
2022 |
43,771 | |||
Thereafter |
281,051 | |||
| | | | | |
Total |
$ | 392,523 | ||
| | | | | |
| | | | | |
| | | | | |
At December 31, 2017, our joint ventures had first mortgages on four properties with outstanding balances aggregating approximately $35.0 million, bearing interest at rates ranging from 3.49% to 5.81% with a weighted average interest rate of 4.07% and a weighted average remaining term to maturity of 6.1 years. Substantially all of these mortgages contain prepayment penalties. The following table sets forth the scheduled principal mortgage payments due for properties owned by our joint ventures as of December 31, 2017 (dollars in thousands):
YEAR
|
PRINCIPAL PAYMENTS DUE |
|||
|---|---|---|---|---|
2018 |
$ | 4,272 | ||
2019 |
877 | |||
2020 |
911 | |||
2021 |
948 | |||
2022 |
7,189 | |||
Thereafter |
20,850 | |||
| | | | | |
Total |
$ | 35,047 | ||
| | | | | |
| | | | | |
| | | | | |
The mortgages on our properties are generally non-recourse, subject to standard carve-outs. The term "standard carve-outs" refers to recourse items to an otherwise non-recourse mortgage and are customary to mortgage financing. While carve-outs vary from lender to lender and transaction to transaction, the carve-outs may include, among other things, voluntary bankruptcy filings, environmental liabilities, the sale, financing or encumbrance of the property in violation of loan documents, damage to property as a result of intentional misconduct or gross negligence, failure to pay valid taxes and other claims which could create liens on property and the conversion of security deposits, insurance proceeds or condemnation awards.
Not applicable.
Item 4. Mine Safety Disclosures.
Not applicable.
25
Item 5. Market for the Registrant's Common Equity, Related Stockholder Matters and Issuer Purchases of Equity Securities.
Our common stock is listed on the New York Stock Exchange under the symbol "OLP." The following table sets forth for the periods indicated, the high and low prices for our common stock as reported by the New York Stock Exchange and the per share distributions declared on our common stock.
| |
2017 | 2016 | |||||||||||||||||
|---|---|---|---|---|---|---|---|---|---|---|---|---|---|---|---|---|---|---|---|
Quarter Ended
|
High | Low | Dividend Declared Per Share(1) |
High | Low | Dividend Per Share(1) |
|||||||||||||
March 31 |
$ | 25.45 | $ | 21.96 | $ | .43 | $ | 22.96 | $ | 18.80 | $ | .41 | |||||||
June 30 |
25.24 | 22.21 | .43 | 24.90 | 21.65 | .41 | |||||||||||||
September 30 |
24.81 | 22.67 | .43 | 25.85 | 23.50 | .41 | |||||||||||||
December 31 |
27.70 | 23.61 | .45 | 25.89 | 22.43 | .43 | |||||||||||||
- (1)
- The dividends in the fourth quarter of 2017 and 2016 were distributed on January 5, 2018 and January 5, 2017, respectively.
As of March 7, 2018, there were approximately 294 holders of record of our common stock.
We qualify as a REIT for Federal income tax purposes. In order to maintain that status, we are required to distribute to our stockholders at least 90% of our annual ordinary taxable income. The amount and timing of future distributions will be at the discretion of our board of directors and will depend upon our financial condition, earnings, business plan, cash flow and other factors. We intend to make distributions in an amount at least equal to that necessary for us to maintain our status as a real estate investment trust for Federal income tax purposes.
26
Stock Performance Graph
The following graph compares the five year cumulative return of our common stock with the Standard and Poor's 500 index (the "S&P Index") and the FTSE-NAREIT Equity REITs, a peer group index (the "Peer Group Index"). The graph assumes $100 was invested on December 31, 2012 in our common stock, the S&P Index and the Peer Group Index and assumes the reinvestment of dividends.
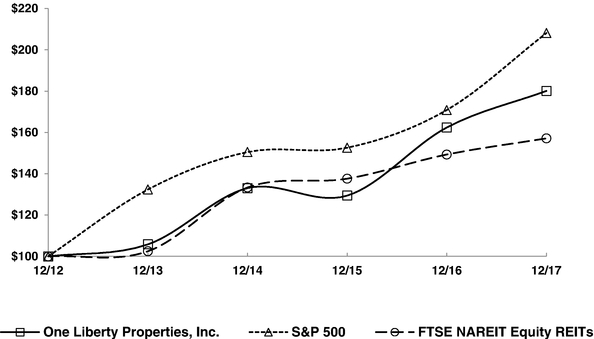
| |
December 31, | ||||||||||||||||||
|---|---|---|---|---|---|---|---|---|---|---|---|---|---|---|---|---|---|---|---|
| |
2012 | 2013 | 2014 | 2015 | 2016 | 2017 | |||||||||||||
OLP |
$ | 100.00 | $ | 105.80 | $ | 133.05 | $ | 129.41 | $ | 162.39 | $ | 180.11 | |||||||
S&P 500 |
100.00 | 132.39 | 150.51 | 152.59 | 170.84 | 208.14 | |||||||||||||
FTSE NAREIT Equity REITs Index |
100.00 | 102.47 | 133.35 | 137.61 | 149.33 | 157.14 | |||||||||||||
Issuer Purchases of Equity Securities
We did not repurchase any shares of our outstanding common stock in 2017.
27
Item 6. Selected Financial Data.
The following table sets forth on a historical basis our selected financial data. This information should be read in conjunction with our consolidated financial statements and "Item 7. Management's Discussion and Analysis of Financial Conditions and Results of Operations" appearing elsewhere in this Annual Report on Form 10-K.
| |
As of and for the Year Ended December 31, (Dollars in thousands, except per share data) |
|||||||||||||||
|---|---|---|---|---|---|---|---|---|---|---|---|---|---|---|---|---|
| |
2017 | 2016 | 2015 | 2014 | 2013 | |||||||||||
OPERATING DATA |
||||||||||||||||
Total revenues |
$ | 75,916 | $ | 70,588 | $ | 65,711 | (1) | $ | 60,477 | (1) | $ | 50,979 | ||||
Gain on sale of real estate, net |
9,837 | 10,087 | 5,392 | 10,180 | 4,705 | |||||||||||
Equity in earnings of unconsolidated joint ventures |
826 | 1,005 | 412 | 533 | 651 | |||||||||||
Income from continuing operations |
24,249 | 24,481 | 21,907 | 22,197 | 17,409 | |||||||||||
Income from discontinued operations |
— | — | — | 13 | 515 | |||||||||||
Net income attributable to One Liberty Properties, Inc. |
24,147 | 24,422 | 20,517 | 22,116 | 17,875 | |||||||||||
Weighted average number of common shares outstanding: |
||||||||||||||||
Basic |
17,944 | 16,768 | 15,971 | 15,563 | 14,948 | |||||||||||
Diluted |
18,047 | 16,882 | 16,079 | 15,663 | 15,048 | |||||||||||
Net income per common share—basic |
$ | 1.29 | $ | 1.40 | $ | 1.23 | $ | 1.37 | $ | 1.15 | ||||||
Net income per common share—diluted |
$ | 1.28 | $ | 1.39 | $ | 1.22 | $ | 1.37 | $ | 1.14 | ||||||
Cash distributions declared per share of common stock |
$ | 1.74 | $ | 1.66 | $ | 1.58 | $ | 1.50 | $ | 1.42 | ||||||
BALANCE SHEET DATA |
||||||||||||||||
Real estate investments, net |
$ | 666,374 | $ | 651,213 | $ | 562,257 | $ | 504,850 | $ | 496,187 | ||||||
Unamortized intangible lease assets, net |
30,525 | 32,645 | 28,978 | 27,387 | 26,035 | |||||||||||
Investment in unconsolidated joint ventures |
10,723 | 10,833 | 11,350 | 4,907 | 4,906 | |||||||||||
Cash and cash equivalents |
13,766 | 17,420 | 12,736 | 20,344 | 16,631 | |||||||||||
Total assets |
742,586 | 733,445 | 646,499 | 587,162 | 568,693 | |||||||||||
Mortgages payable, net of deferred financing costs |
393,157 | 394,898 | 331,055 | 288,868 | 275,319 | |||||||||||
Due under line of credit, net of deferred financing costs |
8,776 | 9,064 | 17,744 | 13,154 | 22,772 | |||||||||||
Unamortized intangible lease liabilities, net |
17,551 | 19,280 | 14,521 | 10,463 | 6,917 | |||||||||||
Total liabilities |
444,084 | 441,518 | 384,073 | 331,258 | 318,603 | |||||||||||
Total equity |
298,502 | 291,927 | 262,426 | 255,904 | 250,090 | |||||||||||
OTHER DATA(2) |
||||||||||||||||
Funds from operations |
$ | 36,193 | $ | 33,256 | $ | 32,717 | $ | 28,248 | $ | 25,740 | ||||||
Funds from operations per common share: |
||||||||||||||||
Basic |
$ | 1.95 | $ | 1.91 | $ | 1.98 | $ | 1.76 | $ | 1.67 | ||||||
Diluted |
$ | 1.94 | $ | 1.90 | $ | 1.97 | $ | 1.75 | $ | 1.66 | ||||||
Adjusted funds from operations |
$ | 39,065 | $ | 34,848 | $ | 31,997 | $ | 29,703 | $ | 27,094 | ||||||
Adjusted funds from operations per common share: |
||||||||||||||||
Basic |
$ | 2.10 | $ | 2.01 | $ | 1.94 | $ | 1.85 | $ | 1.76 | ||||||
Diluted |
$ | 2.09 | $ | 1.99 | $ | 1.92 | $ | 1.84 | $ | 1.75 | ||||||
- (1)
- Includes
lease termination fees of $2.9 million and $1.3 million for 2015 and 2014, respectively.
- (2)
- See "—Funds from Operations and Adjusted Funds from Operations" for a discussion of the limitations on such data and a reconciliation of such data to our financial information presented in accordance with GAAP.
28
Funds from Operations and Adjusted Funds from Operations
We compute funds from operations, or FFO, in accordance with the "White Paper on Funds From Operations" issued by the National Association of Real Estate Investment Trusts ("NAREIT") and NAREIT's related guidance. FFO is defined in the White Paper as net income (computed in accordance with generally accepting accounting principles), excluding gains (or losses) from sales of property, plus real estate depreciation and amortization (including amortization of deferred leasing costs), plus impairment write-downs of depreciable real estate and after adjustments for unconsolidated partnerships and joint ventures. Adjustments for unconsolidated partnerships and joint ventures will be calculated to reflect funds from operations on the same basis. In computing FFO, we do not add back to net income the amortization of costs in connection with our financing activities or depreciation of non-real estate assets. We compute adjusted funds from operations, or AFFO, by adjusting from FFO for our straight-line rent accruals and amortization of lease intangibles, deducting lease termination fees and gain on extinguishment of debt and adding back amortization of restricted stock compensation, amortization of costs in connection with our financing activities (including our share of our unconsolidated joint ventures) and debt prepayment costs. Since the NAREIT White Paper does not provide guidelines for computing AFFO, the computation of AFFO may vary from one REIT to another.
We believe that FFO and AFFO are useful and standard supplemental measures of the operating performance for equity REITs and are used frequently by securities analysts, investors and other interested parties in evaluating equity REITs, many of which present FFO and AFFO when reporting their operating results. FFO and AFFO are intended to exclude GAAP historical cost depreciation and amortization of real estate assets, which assumes that the value of real estate assets diminish predictability over time. In fact, real estate values have historically risen and fallen with market conditions. As a result, we believe that FFO and AFFO provide a performance measure that when compared year over year, should reflect the impact to operations from trends in occupancy rates, rental rates, operating costs, interest costs and other matters without the inclusion of depreciation and amortization, providing a perspective that may not be necessarily apparent from net income. We also consider FFO and AFFO to be useful to us in evaluating potential property acquisitions.
FFO and AFFO do not represent net income or cash flows from operations as defined by GAAP. FFO and AFFO and should not be considered to be an alternative to net income as a reliable measure of our operating performance; nor should FFO and AFFO be considered an alternative to cash flows from operating, investing or financing activities (as defined by GAAP) as measures of liquidity. FFO and AFFO do not measure whether cash flow is sufficient to fund all of our cash needs, including principal amortization, capital improvements and distributions to stockholders.
Management recognizes that there are limitations in the use of FFO and AFFO. In evaluating our performance, management is careful to examine GAAP measures such as net income and cash flows from operating, investing and financing activities.
29
The table below provides a reconciliation of net income in accordance with GAAP to FFO and AFFO for each of the indicated years (dollars in thousands):
| |
2017 | 2016 | 2015 | 2014 | 2013 | |||||||||||
|---|---|---|---|---|---|---|---|---|---|---|---|---|---|---|---|---|
GAAP net income attributable to One Liberty Properties, Inc. |
$ | 24,147 | $ | 24,422 | $ | 20,517 | $ | 22,116 | $ | 17,875 | ||||||
Add: depreciation and amortization of properties |
20,674 | 17,865 | 16,150 | 14,494 | 11,891 | |||||||||||
Add: our share of depreciation and amortization of unconsolidated joint ventures |
872 | 893 | 634 | 374 | 517 | |||||||||||
Add: impairment loss |
153 | — | — | 1,093 | 62 | |||||||||||
Add: amortization of deferred leasing costs |
319 | 299 | 234 | 168 | 152 | |||||||||||
Add: our share of amortization of deferred leasing costs of unconsolidated joint ventures |
— | — | — | — | 8 | |||||||||||
Add: Federal excise tax relating to gain on sale |
— | 6 | 174 | 302 | 45 | |||||||||||
Deduct: gain on sale of real estate |
(9,837 | ) | (10,087 | ) | (5,392 | ) | (10,180 | ) | — | |||||||
Deduct: purchase price fair value adjustment |
— | — | (960 | ) | — | — | ||||||||||
Deduct: net gain on sale of real estate of unconsolidated joint ventures |
— | — | — | — | (4,705 | ) | ||||||||||
Adjustments for non-controlling interests |
(135 | ) | (142 | ) | 1,360 | (119 | ) | (105 | ) | |||||||
| | | | | | | | | | | | | | | | | |
NAREIT funds from operations applicable to common stock |
36,193 | 33,256 | 32,717 | 28,248 | 25,740 | |||||||||||
Deduct: straight-line rent accruals and amortization of lease intangibles |
(1,329 | ) | (2,991 | ) | (1,605 | ) | (1,756 | ) | (1,274 | ) | ||||||
Add (deduct): our share of straight-line rent accruals and amortization of lease intangibles of unconsolidated joint ventures |
36 | 49 | 7 | (1 | ) | 91 | ||||||||||
Deduct: lease termination fee income |
— | — | (2,886 | ) | (1,269 | ) | — | |||||||||
Add: amortization of restricted stock compensation |
3,133 | 2,983 | 2,334 | 1,833 | 1,440 | |||||||||||
Add: prepayment costs on debt |
— | 577 | 568 | 1,581 | 171 | |||||||||||
Add: amortization and write-off of deferred financing costs |
977 | 904 | 1,023 | 1,038 | 891 | |||||||||||
Add: our share of amortization and write-off of deferred financing costs of unconsolidated joint ventures |
25 | 25 | 23 | 17 | 25 | |||||||||||
Adjustments for non-controlling interests |
30 | 45 | (184 | ) | 12 | 10 | ||||||||||
| | | | | | | | | | | | | | | | | |
Adjusted funds from operations applicable to common stock |
$ | 39,065 | $ | 34,848 | $ | 31,997 | $ | 29,703 | $ | 27,094 | ||||||
| | | | | | | | | | | | | | | | | |
| | | | | | | | | | | | | | | | | |
| | | | | | | | | | | | | | | | | |
30
The table below provides a reconciliation of net income per common share (on a diluted basis) in accordance with GAAP to FFO and AFFO:
| |
2017 | 2016 | 2015 | 2014 | 2013 | |||||||||||
|---|---|---|---|---|---|---|---|---|---|---|---|---|---|---|---|---|
GAAP net income attributable to One Liberty Properties, Inc. |
$ | 1.28 | $ | 1.39 | $ | 1.22 | $ | 1.37 | $ | 1.14 | ||||||
Add: depreciation and amortization of properties |
1.12 | 1.02 | .98 | .90 | .78 | |||||||||||
Add: our share of depreciation and amortization of unconsolidated joint ventures |
.05 | .05 | .04 | .02 | .03 | |||||||||||
Add: impairment loss |
.01 | — | — | .07 | .01 | |||||||||||
Add: amortization of deferred leasing costs |
.02 | .02 | .02 | .01 | .01 | |||||||||||
Add: our share of amortization of deferred leasing costs of unconsolidated joint ventures |
— | — | — | — | — | |||||||||||
Add: Federal excise tax relating to gain on sale |
— | — | .01 | .02 | — | |||||||||||
Deduct: gain on sale of real estate |
(.53 | ) | (.57 | ) | (.32 | ) | (.63 | ) | — | |||||||
Deduct: purchase price fair value adjustment |
— | — | (.06 | ) | — | — | ||||||||||
Deduct: net gain on sale of real estate of unconsolidated joint ventures |
— | — | — | — | (.30 | ) | ||||||||||
Adjustments for non-controlling interests |
(.01 | ) | (.01 | ) | .08 | (.01 | ) | (.01 | ) | |||||||
| | | | | | | | | | | | | | | | | |
NAREIT funds from operations per share of common stock |
1.94 | 1.90 | 1.97 | 1.75 | 1.66 | |||||||||||
Deduct: straight-line rent accruals and amortization of lease intangibles |
(.07 | ) | (.16 | ) | (.10 | ) | (.10 | ) | (.07 | ) | ||||||
Add: our share of straight-line rent accruals and amortization of lease intangibles of unconsolidated joint ventures |
— | — | — | — | — | |||||||||||
Deduct: lease termination fee income |
— | — | (.17 | ) | (.08 | ) | — | |||||||||
Add: amortization of restricted stock compensation |
.17 | .17 | .14 | .11 | .09 | |||||||||||
Add: prepayment costs on debt |
— | .03 | .03 | .10 | .01 | |||||||||||
Add: amortization and write-off of deferred financing costs |
.05 | .05 | .06 | .06 | .06 | |||||||||||
Add: our share of amortization and write-off of deferred financing costs of unconsolidated joint ventures |
— | — | — | — | — | |||||||||||
Adjustments for non-controlling interests |
— | — | (.01 | ) | — | — | ||||||||||
| | | | | | | | | | | | | | | | | |
Adjusted funds from operations per share of common stock |
$ | 2.09 | $ | 1.99 | $ | 1.92 | $ | 1.84 | $ | 1.75 | ||||||
| | | | | | | | | | | | | | | | | |
| | | | | | | | | | | | | | | | | |
| | | | | | | | | | | | | | | | | |
31
Item 7. Management's Discussion and Analysis of Financial Condition and Results of Operations.
Overview
We are a self-administered and self-managed real estate investment trust. We are focused on acquiring, owning and managing a geographically diversified portfolio of industrial, retail (including furniture stores and supermarkets), restaurant, health and fitness and theater properties, many of which are subject to long-term leases. Most of our leases are "net leases" under which the tenant, directly or indirectly, is responsible for paying the real estate taxes, insurance and ordinary maintenance and repairs of the property. As of December 31, 2017, we own 113 properties and our joint ventures own five properties. These 118 properties are located in 30 states.
We face a variety of risks and challenges in our business. As more fully described under "Item 1A. Risk Factors", we, among other things, face the possibility we will not be able to acquire accretive properties on acceptable terms, lease our properties on terms favorable to us or at all, our tenants may not be able to pay their rental and other obligations and we may not be able to renew or relet, on acceptable terms, leases that are expiring or otherwise terminating.
We seek to manage the risk of our real property portfolio and the related financing arrangements by diversifying among types of properties, industries, locations, tenants, scheduled lease expirations, mortgage maturities and lenders, and by seeking to minimize our exposure to interest rate fluctuations. As a result, as of December 31, 2017:
- •
- our 2018 contractual rental income is derived from the following property types: 40.2% from retail, 37.1% from industrial, 4.7% from
restaurant, 4.5% from health and fitness, 3.4% from theater and 10.1% from other properties,
- •
- properties in only one state (i.e., Texas, 11.9%) account for 10% or more of 2018 contractual
rental income,
- •
- no tenant accounts for more than 7.1% of our 2018 contractual rental income,
- •
- through 2026, there is only one year in which the percentage of our contractual rental income represented by expiring leases exceeds 10% of our
2018 contractual rental income (i.e., 21.3% in 2022)—approximately 36.4% of our 2018 contractual rental income is represented by leases
expiring in 2027 and thereafter,
- •
- after giving effect to interest rate swap agreements, substantially all of our mortgage debt bears interest at fixed rates,
- •
- until 2022, not more than 6% of our total scheduled principal mortgage payments is due in any year,
- •
- there are seven different counterparties to our portfolio of interest rate swaps: three counterparties, rated A- or better by a national rating
agency, account for 72.3%, or $103.7 million, of the notional value of our swaps; and two counterparties, rated BB or better by a national rating agency, account for 21.7%, or
$31.1 million, of the notional value of such swaps, and
- •
- we have 18 different mortgage lenders (including with respect to the mortgage debt of our unconsolidated joint ventures): four different lenders account for 30.0%, 15.9%, 14.8% and 10.3% of such debt.
We monitor the risk of tenant non-payments through a variety of approaches tailored to the applicable situation. Generally, based on our assessment of the credit risk posed by our tenants, we monitor a tenant's financial condition through one or more of the following actions: reviewing tenant financial statements or other financial information, obtaining other tenant related information, regular
32
contact with tenant's representatives, tenant credit checks and regular management reviews of our tenants. We may sell a property if the tenant's financial condition is unsatisfactory.
In acquiring properties, we balance an evaluation of the terms of the leases and the credit of the existing tenants with a fundamental analysis of the real estate to be acquired, which analysis takes into account, among other things, the estimated value of the property, local demographics and the ability to re-rent or dispose of the property on favorable terms upon lease expiration or early termination.
We are sensitive to the risks facing the retail industry as a result of the growth of e-commerce. We are addressing our exposure to the retail industry by seeking to acquire industrial properties that we believe capitalize on e-commerce activities, such as e-commerce distribution and warehousing facilities, and by being especially selective in acquiring retail properties. As a result, retail properties generated 43.3%, 46.1% and 49.5%, of rental income, net, in 2017, 2016 and 2015 respectively, and industrial properties generated 34.1%, 30.8% and 27.3% of rental income, net, in 2017, 2016, 2015, respectively .
2017 Highlights
In 2017:
- •
- our rental income, net, increased by $4.1 million, or 6.4%, from 2016.
- •
- we acquired four properties for an aggregate purchase price of $43.2 million. The acquired properties account for $3.1 million or
4.6%, of our 2018 contractual rental income.
- •
- we sold four properties, three of which were vacant (i.e. properties formerly tenanted
by hhgregg—Niles, Illinois, Sports Authority and Joe's Crab Shack) for a net gain on sale of real estate of $9.8 million. The properties sold accounted for 0.5% and 2.6% of 2017 and
2016 rental income net, respectively.
- •
- we obtained proceeds of $21.2 million from mortgage financings, all of which relate to properties acquired in 2017.
- •
- we increased our quarterly dividend by 4.7% to $0.45 per share, commencing with the dividend declared in December 2017 and paid in January
2018.
- •
- we raised net proceeds of approximately $5.6 million from the issuance of 231,000 shares of common stock pursuant to our at-the-market
equity offering program.
- •
- we re-leased four vacant properties or portions thereof (i.e., properties formerly tenanted by Pathmark, Philadelphia, PA; Quality Bakery, Columbus, OH; Payless Shoe Source, Seattle, WA; and a portion of a property located in Ronkonkoma, NY) . In 2017, we incurred an aggregate of approximately $739,000 of real estate operating expenses in carrying such properties. In 2018, we will generate an aggregate of $1.2 million of rental income from such properties and in the future, will not be responsible for the related operating expenses.
Challenges Facing Certain Retail Tenants
Four tenants at four retail properties have ceased operations (or have advised they intend to cease operations prior to the expiration of their lease) and continue to pay rent. At December 31, 2017, the unbilled rent receivable balance, tenant origination costs and unamortized intangible lease liabilities associated with these properties were $195,000, $972,000, and $4.5 million, respectively. These properties account for $2.3 million, or 3.4%, of our contractual rental income and the weighted average remaining lease term for these tenants at these properties is 3.1 years.
We own interests in three properties tenanted by Kmart Holdings Corp. and its subsidiaries. Kmart and its parent, Sears Holding Corporation, have experienced financial difficulties for several years. During 2017, Kmart closed two stores owned by our unconsolidated joint ventures at properties located
33
in Savannah, Georgia and Manahawkin, New Jersey. Our share of the aggregate annual base rent at those two properties is $510,000 and the leases expire in November 2018 and July 2019. The 2018 contractual rental income associated with our third Kmart property is $522,000, and the lease at this property, which Kmart recently extended, expires in 2023.
In light of the difficulties these retail tenants are experiencing, it is possible that they may cease paying rent and/or we may not be able to re-lease the property on a timely basis. Though a tenant may close a store prior to lease expiration, such closure, without a bankruptcy or similar filing, does not relieve it of its obligation to pay rent. If these tenants stop paying rent, and we are unable to re-lease these properties on an as favorable and a timely basis, we may be adversely effected.
New Accounting Standards
We (i) have determined that the adoption of the New Revenue Recognition Standards, as such term is used in Note 2 of our consolidated financial statements, will not have a material impact on our consolidated financial statements and (ii) are evaluating the impact on our consolidated financial statements, if any, resulting from the guidance issued by the Financial Accounting Standards Board in February 2016 with the respect to the treatment of leases. See Note 2 of our consolidated financial statements.
Transaction Subsequent to December 31, 2017
On January 30, 2018, we sold a multi-tenant retail property located in Fort Bend, Texas, in which we held an 85% interest, with an aggregate of 42,446 square feet for gross proceeds of $9.2 million and paid off the $4.4 million mortgage. In the quarter ending March 31, 2018, we anticipate recognizing a gain on this sale of approximately $2.4 million. The non-controlling interest's share of the gain from the transaction will be approximately $800,000. In 2017, this property accounted for $732,000 of rental income and an aggregate of $448,000 of real estate operating expenses (net of tenant reimbursements), depreciation and amortization and interest expense.
Changes to Federal Tax Laws
On December 22, 2017, the Tax Act was enacted. The Tax Act makes significant changes to the U.S. federal income tax rules for taxation of individuals and corporations, generally effective for taxable years beginning after December 31, 2017. While the changes in the Tax Act generally appear to be favorable with respect to REITs, the extensive changes to non-REIT provisions in the Code may have unanticipated effects on us or our stockholders.
Results of Operations
Comparison of Years Ended December 31, 2017 and 2016
Revenues
The following table compares total revenues for the periods indicated:
| |
Year Ended December 31, |
|
|
||||||||||
|---|---|---|---|---|---|---|---|---|---|---|---|---|---|
| |
Increase (Decrease) |
|
|||||||||||
| (Dollars in thousands) |
2017 | 2016 | % Change | ||||||||||
Rental income, net |
$ | 68,244 | $ | 64,164 | $ | 4,080 | 6.4 | ||||||
Tenant reimbursements |
7,672 | 6,424 | 1,248 | 19.4 | |||||||||
| | | | | | | | | | | | | | |
Total revenues |
$ | 75,916 | $ | 70,588 | $ | 5,328 | 7.5 | ||||||
| | | | | | | | | | | | | | |
| | | | | | | | | | | | | | |
| | | | | | | | | | | | | | |
34
Rental income, net. The increase is due to:
- •
- $5.2 million from properties acquired in 2016,
- •
- $1.6 million from properties acquired in 2017,
- •
- $267,000 of rental income from a tenant whose lease commenced April 1, 2016 at our Joppa, Maryland property, and
- •
- $201,000 of annual percentage rent income received from three tenants.
Offsetting the increases are decreases of:
- •
- $1.2 million representing the 2016 rental income from properties sold during 2016,
- •
- $1.3 million representing the 2016 rental income from properties sold during 2017,
- •
- $496,000 representing the 2016 rental income from a property formerly tenanted by Quality Bakery, which lease expired November 2016, and is now
re-tenanted, and
- •
- $277,000 relating to a property formerly tenanted by hhgregg (that is vacant) and a property formerly tenanted by Payless ShoeSource (that has re-leased).
Tenant reimbursements. Real estate tax and operating expense reimbursements increased due primarily to reimbursements of approximately $855,000 and $377,000 from properties acquired in 2016 and 2017, respectively. Tenant reimbursements generally relate to real estate expenses incurred in the same period.
Operating Expenses
The following table compares operating expenses for the periods indicated:
| |
Year Ended December 31, |
|
|
||||||||||
|---|---|---|---|---|---|---|---|---|---|---|---|---|---|
| |
Increase (Decrease) |
|
|||||||||||
| (Dollars in thousands) |
2017 | 2016 | % Change | ||||||||||
Operating expenses: |
|||||||||||||
Depreciation and amortization |
$ | 20,993 | $ | 18,164 | $ | 2,829 | 15.6 | ||||||
General and administrative |
11,279 | 10,693 | 586 | 5.5 | |||||||||
Real estate expenses |
10,736 | 8,931 | 1,805 | 20.2 | |||||||||
Real estate acquisition costs |
— | 596 | (596 | ) | (100.0 | ) | |||||||
Federal excise and state taxes |
481 | 203 | 278 | 136.9 | |||||||||
Leasehold rent |
308 | 308 | — | — | |||||||||
Impairment loss |
153 | — | 153 | n/a | |||||||||
| | | | | | | | | | | | | | |
Total operating expenses |
43,950 | 38,895 | 5,055 | 13.0 | |||||||||
| | | | | | | | | | | | | | |
Operating income |
$ | 31,966 | $ | 31,693 | $ | 273 | 0.9 | ||||||
| | | | | | | | | | | | | | |
| | | | | | | | | | | | | | |
| | | | | | | | | | | | | | |
Depreciation and amortization. The increase is due primarily to increases of: (i) $1.6 million and $761,000 of depreciation and amortization expense on the properties acquired in 2016 and 2017, respectively, and (ii) an aggregate $884,000 of write-offs of tenant origination costs related to the hhgregg and Joe's Crab Shack properties. The increase was offset by $433,000 due to the sales of properties in 2016 and 2017. We estimate that depreciation and amortization in 2018 related to the properties acquired in 2017 will be approximately $1.5 million.
General and administrative. The increase is due primarily to increases of: (i) $278,000 in compensation expense primarily due to higher compensation levels; (ii) $166,000 in non-cash
35
compensation expense related to the accelerated vesting of restricted stock due to the retirement of a non-management director; and (iii) $142,000 for other miscellaneous expenses.
Real estate expenses. The increase is due primarily to an increase of $1.3 million from properties acquired in 2016 and 2017; substantially all these expenses are rebilled to tenants and are included in Tenant reimbursements. Also contributing to the increase are: (i) $435,000 related to properties formerly tenanted by Quality Bakery and hhgregg-Crystal Lake, Illinois; and (ii) $245,000 related to the hhgregg-Niles, Illinois property that we sold. The increase was offset by a decrease of $197,000 of expenses related to the vacant property formerly tenanted by Sports Authority, which was sold in May 2017.
Real estate acquisition costs. The expense in 2016 primarily relates to properties purchased that year. As a result of the adoption of ASU 2017-01 in January 2017, asset acquisition costs of $387,000 in 2017 were capitalized to the related real estate assets.
Federal excise and state taxes. The increase primarily relates to an annual state franchise tax resulting from the 2016 and 2017 purchase of two properties located in Tennessee.
Impairment loss. In 2017, we recorded an impairment loss of $153,000 with respect to our property formerly tenanted by Joe's Crab Shack, which was sold in November 2017. There was no similar loss in the prior year.
Other Income and Expenses
The following table compares other income and expenses for the periods indicated:
| |
Year Ended December 31, |
|
|
||||||||||
|---|---|---|---|---|---|---|---|---|---|---|---|---|---|
| |
Increase (Decrease) |
|
|||||||||||
| (Dollars in thousands) |
2017 | 2016 | % Change | ||||||||||
Other income and expenses: |
|||||||||||||
Equity in earnings of unconsolidated joint ventures |
$ | 826 | $ | 1,005 | $ | (179 | ) | (17.8 | ) | ||||
Prepayment costs on debt |
— | (577 | ) | (577 | ) | (100.0 | ) | ||||||
Other income |
407 | 435 | (28 | ) | (6.4 | ) | |||||||
Interest: |
|||||||||||||
Expense |
(17,810 | ) | (17,258 | ) | 552 | 3.2 | |||||||
Amortization and write-off of deferred financing costs |
(977 | ) | (904 | ) | 73 | 8.1 | |||||||
Income before gain on sale of real estate, net |
14,412 | 14,394 | 18 | 0.1 | |||||||||
Equity in earnings of unconsolidated joint ventures. The 2016 income includes our 50% share, or $146,000, of income obtained for permanent utility easements granted at two properties. There was no such income during 2017.
Prepayment costs on debt. These costs were incurred in connection with the property sales and the payoff, prior to the stated maturity, of the related mortgage debt in 2016, primarily relating to the sales of several properties.
Other income. Other income in 2017 includes $243,000 paid to us by a former tenant in connection with the resolution of a dispute, and $74,000 that we received for easements on a property sold in 2017. Other income in 2016 includes $356,000 that we received for such easements.
36
Interest expense. The following table summarizes interest expense for the periods indicated:
| |
Year Ended December 31, |
|
|
||||||||||
|---|---|---|---|---|---|---|---|---|---|---|---|---|---|
| |
Increase (Decrease) |
|
|||||||||||
| (Dollars in thousands) |
2017 | 2016 | % Change | ||||||||||
Interest expense: |
|||||||||||||
Credit facility interest |
$ | 478 | $ | 590 | $ | (112 | ) | (19.0 | ) | ||||
Mortgage interest |
17,332 | 16,668 | 664 | 4.0 | |||||||||
| | | | | | | | | | | | | | |
Total |
$ | 17,810 | $ | 17,258 | $ | 552 | 3.2 | ||||||
| | | | | | | | | | | | | | |
| | | | | | | | | | | | | | |
| | | | | | | | | | | | | | |
Credit facility interest
The decrease in 2017 is due to the $11.2 million decrease in the weighted average balance outstanding under our line of credit. The decrease was offset by an increase of 64 basis points in the average interest rate due to the increase in the one month LIBOR rate and an increase of $81,000 in the unused facility fee primarily resulting from the $25.0 million increase in our borrowing capacity under the facility.
Mortgage interest
The following table reflects the average interest rate on the average principal amount of outstanding mortgage debt during the applicable year:
| |
Year Ended December 31, |
|
|
||||||||||
|---|---|---|---|---|---|---|---|---|---|---|---|---|---|
| |
Increase (Decrease) |
|
|||||||||||
| (Dollars in thousands) |
2017 | 2016 | % Change | ||||||||||
Average interest rate on mortgage debt |
4.31 | % | 4.61 | % | (.30 | )% | (6.5 | ) | |||||
Average principal amount of mortgage debt |
$ | 399,086 | $ | 361,645 | $ | 37,441 | 10.4 | ||||||
The increase is due primarily to the increase in the average principal amount of mortgage debt outstanding, offset by a decrease in the average interest rate on outstanding mortgage debt. The increase in the average balance outstanding is due substantially to mortgage debt of $72.9 million incurred in connection with properties acquired in 2016 and 2017 and the financing or refinancing of $51.5 million of mortgage debt, net of refinanced amounts, in connection with properties acquired prior to 2016. The decrease in the average interest rate is due to the financing (including financings effectuated in connection with acquisitions) or refinancing in 2017 and 2016 of $158.8 million of gross mortgage debt (including $34.4 million of refinanced amounts) with an average interest rate of approximately 3.7%.
We estimate that in 2018, the mortgage interest expense associated with the properties acquired in 2017 will be approximately $973,000. Interest expense for these properties in 2017 was $374,000.
Gain on sale of real estate, net.
The following table compares gain on sale of real estate, net:
| |
Year Ended December 31, |
|
|
||||||||||
|---|---|---|---|---|---|---|---|---|---|---|---|---|---|
| |
Increase (Decrease) |
|
|||||||||||
| (Dollars in thousands) |
2017 | 2016 | % Change | ||||||||||
Gain on sale of real estate, net |
$ | 9,837 | $ | 10,087 | $ | (250 | ) | (2.5 | ) | ||||
The gain in 2017 was realized from the sales of the Greenwood Village, Colorado property, the Kohl's property in Kansas City, Missouri, and the former hhgregg property in Niles, Illinois. See "—Comparison of Years Ended December 31, 2016 and 2015—Other Income and Expenses" for information regarding the gain on sale in 2016.
37
Comparison of Years Ended December 31, 2016 and 2015
Revenues
The following table compares total revenues for the periods indicated:
| |
Year Ended December 31, |
|
|
||||||||||
|---|---|---|---|---|---|---|---|---|---|---|---|---|---|
| |
Increase (Decrease) |
|
|||||||||||
| (Dollars in thousands) |
2016 | 2015 | % Change | ||||||||||
Rental income, net |
$ | 64,164 | $ | 58,973 | $ | 5,191 | 8.8 | ||||||
Tenant reimbursements |
6,424 | 3,852 | 2,572 | 66.8 | |||||||||
Lease termination fees |
— | 2,886 | (2,886 | ) | (100.0 | ) | |||||||
| | | | | | | | | | | | | | |
Total revenues |
$ | 70,588 | $ | 65,711 | $ | 4,877 | 7.4 | ||||||
| | | | | | | | | | | | | | |
| | | | | | | | | | | | | | |
| | | | | | | | | | | | | | |
Rental income, net. The increase is due primarily to (i) $4.4 million earned from 11 properties acquired in 2016 and $2.7 million from seven properties acquired in 2015; (ii) the $530,000 write-off against rental income in 2015 of the entire balance of unbilled rent receivable and the intangible lease asset related to the 2015 lease termination fees described below; and (iii) $383,000 from three replacement tenants that leased vacant space at one of our El Paso, Texas properties.
Offsetting the increase are decreases of (i) $2.1 million due to the 2016 sale of 12 properties (the "2016 Sold Properties"), including a portfolio of eight convenience stores (the "Pantry Portfolio"); and (ii) $909,000 from three vacant properties which were leased to Pathmark, Sports Authority and Quality Bakery (the "Vacant Properties"). During 2016, Pathmark did not generate rental income and Sports Authority and Quality Bakery generated an aggregate of $751,000 of rental income.
Tenant reimbursements. Real estate tax and operating expense reimbursements in 2016 increased by (i) $781,000 and $644,000 from the properties acquired in 2016 and 2015, respectively, and (ii) $1.1 million from other properties in our portfolio. We recognized an equivalent amount of real estate expense for these tenant reimbursements.
Lease termination fees. In 2015, we received lease termination fees of $2.9 million in lease buy-out transactions and re-leased substantially all of such premises simultaneously with the lease terminations. There were no such fees in 2016.
Operating Expenses
The following table compares operating expenses for the periods indicated:
| |
Year Ended December 31, |
|
|
||||||||||
|---|---|---|---|---|---|---|---|---|---|---|---|---|---|
| |
Increase (Decrease) |
|
|||||||||||
| (Dollars in thousands) |
2016 | 2015 | % Change | ||||||||||
Operating expenses: |
|||||||||||||
Depreciation and amortization |
$ | 18,164 | $ | 16,384 | $ | 1,780 | 10.9 | ||||||
General and administrative |
10,693 | 9,527 | 1,166 | 12.2 | |||||||||
Real estate expenses |
8,931 | 6,047 | 2,884 | 47.7 | |||||||||
Real estate acquisition costs |
596 | 449 | 147 | 32.7 | |||||||||
Federal excise and state taxes |
203 | 343 | (140 | ) | (40.8 | ) | |||||||
Leasehold rent |
308 | 308 | — | — | |||||||||
| | | | | | | | | | | | | | |
Total operating expenses |
38,895 | 33,058 | 5,837 | 17.7 | |||||||||
| | | | | | | | | | | | | | |
Operating income |
$ | 31,693 | $ | 32,653 | $ | (960 | ) | (2.9 | ) | ||||
| | | | | | | | | | | | | | |
| | | | | | | | | | | | | | |
| | | | | | | | | | | | | | |
38
Depreciation and amortization. Approximately $1.5 million and $932,000 of the increase is due to depreciation expense on the properties acquired in 2016 and 2015, respectively, approximately $365,000 of the increase is due to depreciation on property improvements and approximately $94,000 is due to amortization of leasing commissions. Offsetting these increases are decreases in 2016 of (i) $440,000 of expenses related to the 2016 Sold Properties and (ii) $657,000 of amortization and write-offs of intangibles and lease commissions. The $657,000 includes a $380,000 write-off of tenant origination costs in 2015 related to the Pathmark property and the balance relates primarily to the write-off of intangibles and lease commissions with respect to leases that expired or terminated in 2015 and 2016.
General and administrative. Contributing to the increase were increases of: (i) $649,000 in non-cash compensation expense primarily related to the increase in the number of shares of restricted stock granted in 2016 and the higher fair value of the awards granted in 2016 in comparison to the awards granted in 2011 that vested in 2016; (ii) $286,000 for third party audit and audit related services; and (iii) $97,000 in compensation expense payable to our full and part time personnel, primarily due to higher levels of compensation.
Real estate expenses. The increase in 2016 is due primarily to increases of $1.4 million from properties acquired in 2015 and 2016 and $719,000 from other properties in our portfolio. Most of these increases are rebilled to tenants and are included in Tenant reimbursement revenues. Also contributing to the increase in 2016 are $587,000 of expenses related to taxes and maintenance of the Vacant Properties and $165,000 due to the change in which property management fees are determined pursuant to the Compensation and Services Agreement.
Real estate acquisition costs. The increase is due to increased acquisition activity in 2016.
Federal excise and state taxes. We incurred Federal excise tax of $174,000 in 2015 and $6,000 in 2016 because profitable property sales resulted in calendar year distributions to stockholders being less than the amount required to be distributed during such year. In 2016, we deferred a $6.8 million taxable gain on a property sale through an IRC Section 1031 exchange.
Other Income and Expenses
The following table compares other income and expenses for the periods indicated:
| |
Year Ended December 31, |
|
|
||||||||||
|---|---|---|---|---|---|---|---|---|---|---|---|---|---|
| |
Increase (Decrease) |
|
|||||||||||
| (Dollars in thousands) |
2016 | 2015 | % Change | ||||||||||
Other income and expenses: |
|||||||||||||
Equity in earnings of unconsolidated joint ventures |
$ | 1,005 | $ | 412 | $ | 593 | 143.9 | ||||||
Purchase price fair value adjustment |
— | 960 | (960 | ) | (100.0 | ) | |||||||
Prepayment costs on debt |
(577 | ) | (568 | ) | 9 | 1.6 | |||||||
Other income |
435 | 108 | 327 | 302.8 | |||||||||
Interest: |
|||||||||||||
Expense |
(17,258 | ) | (16,027 | ) | 1,231 | 7.7 | |||||||
Amortization and write-off of deferred financing costs |
(904 | ) | (1,023 | ) | (119 | ) | (11.6 | ) | |||||
Income before gain on sale of real estate, net |
14,394 | 16,515 | (2,121 | ) | (12.8 | ) | |||||||
Equity in earnings of unconsolidated joint ventures. The increase in 2016 is due primarily to an increase of $633,000 in our share of income from the Manahawkin, New Jersey retail center which was acquired in June 2015. The year ended December 31, 2015 included our $400,000 share of acquisition expenses associated with the purchase of this center.
Purchase price fair value adjustment. In connection with the acquisition of our joint venture partner's 50% interest in a property located in Lincoln, Nebraska, we recorded this adjustment,
39
representing the difference between the book value of the preexisting equity investment on the purchase date of March 31, 2015 and the fair value of the investment.
Prepayment costs on debt. These costs were incurred primarily in connection with property sales and the payoff, prior to the stated maturity, of the related mortgage debt. In 2016, these costs related primarily to the sales of the Tomlinson, Pennsylvania property and the Pantry Portfolio. In 2015, these costs related primarily to the sale of the Cherry Hill, New Jersey property.
Other income. As a result of a partial condemnation of land and easements obtained by the Colorado Department of Transportation ("CDOT") at our Greenwood Village, Colorado property, we received $509,000 from CDOT, of which $356,000 is attributable to easements and is included in Other income in 2016. See "—Gain on sale of real estate, net" below for the gain resulting from the balance.
Interest expense. The following table summarizes interest expense for the periods indicated:
| |
Year Ended December 31, |
|
|
||||||||||
|---|---|---|---|---|---|---|---|---|---|---|---|---|---|
| |
Increase (Decrease) |
|
|||||||||||
| (Dollars in thousands) |
2016 | 2015 | % Change | ||||||||||
Interest expense: |
|||||||||||||
Credit facility interest |
$ | 590 | $ | 594 | $ | (4 | ) | (.7 | ) | ||||
Mortgage interest |
16,668 | 15,433 | 1,235 | 8.0 | |||||||||
| | | | | | | | | | | | | | |
Total |
$ | 17,258 | $ | 16,027 | $ | 1,231 | 7.7 | ||||||
| | | | | | | | | | | | | | |
| | | | | | | | | | | | | | |
| | | | | | | | | | | | | | |
Credit facility interest
The decrease in 2016 is due to the $3.8 million decrease in the weighted average balance outstanding under our line of credit, offset by an increase of 28 basis points in the average interest rate from 1.95% to 2.23%, as well as an increase in the unused fee resulting from a $25.0 million increase in our borrowing capacity in connection with the November 2016 amendment and restatement of the credit facility.
Mortgage interest
The following table reflects the average interest rate on the average principal amount of outstanding mortgage debt during the applicable year:
| |
Year Ended December 31, |
|
|
||||||||||
|---|---|---|---|---|---|---|---|---|---|---|---|---|---|
| |
Increase (Decrease) |
|
|||||||||||
| (Dollars in thousands) |
2016 | 2015 | % Change | ||||||||||
Interest rate on mortgage debt |
4.61 | % | 4.96 | % | (.35 | )% | (7.1 | ) | |||||
Principal amount of mortgage debt |
$ | 361,645 | $ | 310,991 | $ | 50,654 | 16.3 | ||||||
The increase in mortgage interest expense is due to the increase in the average principal amount of mortgage debt outstanding, offset by a decrease in the average interest rate on outstanding mortgage debt. The increase in the average balance outstanding is substantially due to the incurrence of mortgage debt of $89.5 million in connection with properties acquired in 2015 and 2016 and the financing or refinancing of $85.2 million of mortgage debt, net of refinanced amounts, in connection with properties acquired prior to 2015. The decrease in the average interest rate is due to the financing (including financings effectuated in connection with acquisitions) or refinancing in 2016 and 2015 of $217.2 million of gross mortgage debt (including $42.6 million of refinanced amounts) with an average interest rate of approximately 3.8%.
40
Amortization and write-off of deferred financing costs. The decrease in 2016 is primarily due to the write-off in 2015 of $249,000 relating to the sale of the Cherry Hill, New Jersey property. This decrease was offset by the write-off and increased amortization in 2016 of $66,000 relating to the new line of credit and other write-offs of $57,000 relating to property sales.
Gain on sale of real estate, net.
The following table compares gain on sale of real estate, net,:
| |
Year Ended December 31, |
|
|
||||||||||
|---|---|---|---|---|---|---|---|---|---|---|---|---|---|
| |
Increase (Decrease) |
|
|||||||||||
| (Dollars in thousands) |
2016 | 2015 | % Change | ||||||||||
Gain on sale of real estate, net |
$ | 10,087 | $ | 5,392 | $ | 4,695 | 87.1 | ||||||
The gain for 2016 was realized from (i) the sales of 12 properties, including the Pantry Portfolio and (ii) a $116,000 gain on the partial condemnation of land at our former Sports Authority property in Greenwood Village, Colorado. The 2015 gain was realized from the January 2015 sale of the Cherry Hill, New Jersey property. The minority partner's share of the gain on the Cherry Hill, New Jersey property was $1.3 million, which is the primary reason for the decrease in net income attributable to non-controlling interests for 2016 as compared to 2015.
Liquidity and Capital Resources
Our sources of liquidity and capital include cash flow from operations, cash and cash equivalents, borrowings under our revolving credit facility, refinancing existing mortgage loans, obtaining mortgage loans secured by our unencumbered properties, issuance of our equity securities and property sales. In 2017, we obtained $21.2 million of proceeds from mortgage financings, $5.6 million of net proceeds from the sale of our common stock pursuant to our at-the-market equity offering program and $5.9 million from a fixed rent payment, which is deferred over the lease term, received from a ground lease tenant in connection with its obtaining supplemental mortgage financing. See Note 7 to our consolidated financial statements. Our available liquidity at March 5, 2018 was approximately $102.8 million, including approximately $6.7 million of cash and cash equivalents (net of the credit facility's required $3.0 million deposit maintenance balance) and, subject to borrowing base requirements, up to $96.1 million available under our revolving credit facility.
Liquidity and Financing
We expect to meet our (i) operating cash requirements (including debt service and dividends) principally from cash flow from operations and (ii) capital requirements of $4.2 million of building expansion and improvements at our property tenanted by L-3 located in Hauppauge, NY, from cash flow from operations, our available cash and cash equivalents, proceeds from the sale of our common stock and, to the extent permitted, our credit facility. We and our joint venture partner are also contemplating a significant redevelopment of our multi-tenant shopping center in Manahawkin, New Jersey—we anticipate that the capital expenditures that may be incurred if such property is redeveloped will be funded by the foregoing sources as well as equity contributions from us and our joint venture partner.
41
The following table sets forth, as of December 31, 2017, information with respect to our mortgage debt that is payable from January 2018 through December 31, 2020 (excluding our unconsolidated joint ventures):
| (Dollars in thousands) |
2018 | 2019 | 2020 | Total | |||||||||
|---|---|---|---|---|---|---|---|---|---|---|---|---|---|
Amortization payments |
$ | 10,188 | $ | 11,125 | $ | 11,901 | $ | 33,214 | |||||
Principal due at maturity |
10,260 | 3,485 | — | 13,745 | |||||||||
| | | | | | | | | | | | | | |
Total |
$ | 20,448 | $ | 14,610 | $ | 11,901 | $ | 46,959 | |||||
| | | | | | | | | | | | | | |
| | | | | | | | | | | | | | |
| | | | | | | | | | | | | | |
At December 31, 2017, our unconsolidated joint ventures had first mortgages on four properties with outstanding balances aggregating approximately $35.0 million, bearing interest at rates ranging from 3.49% to 5.81% (i.e., a 4.07% weighted average interest rate) and maturing between 2018 and 2025 (i.e., a weighted average remaining term to maturity of 6.1 years).
We intend to make debt amortization payments from operating cash flow and, though no assurance can be given that we will be successful in this regard, generally intend to refinance, extend or payoff the mortgage loans which mature in 2018 through 2020. We intend to repay the amounts not refinanced or extended from our existing funds and sources of funds, including our available cash, proceeds from the sale of our common stock and our credit facility (to the extent available).
We continually seek to refinance existing mortgage loans on terms we deem acceptable to generate additional liquidity. Additionally, in the normal course of our business, we sell properties when we determine that it is in our best interests, which also generates additional liquidity. Further, since each of our encumbered properties is subject to a non-recourse mortgage (with standard carve-outs), if our in-house evaluation of the market value of such property is less than the principal balance outstanding on the mortgage loan, we may determine to convey, in certain circumstances, such property to the mortgagee in order to terminate our mortgage obligations, including payment of interest, principal and real estate taxes, with respect to such property.
Typically, we utilize funds from our credit facility to acquire a property and, thereafter secure long-term, fixed rate mortgage debt on such property. We apply the proceeds from the mortgage loan to repay borrowings under the credit facility, thus providing us with the ability to re-borrow under the credit facility for the acquisition of additional properties.
Credit Facility
Subject to borrowing base requirements, we can borrow up to $100.0 million pursuant to our revolving credit facility which is available to us for the acquisition of commercial real estate, repayment of mortgage debt, property improvements and general working capital purposes; provided, that if used for property improvements and working capital purposes, the amount outstanding for such purposes will not exceed the lesser of $15.0 million and 15% of the borrowing base and if used for working capital purposes, will not exceed $10.0 million. The facility matures December 31, 2019 and bears interest equal to the one month LIBOR rate plus the applicable margin. The applicable margin ranges from 175 basis points if our ratio of total debt to total value (as calculated pursuant to the facility) is equal to or less than 50%, increasing to a maximum of 300 basis points if such ratio is greater than 65%. The applicable margin was 175 basis points for 2016 and 2017. There is an unused facility fee of 0.25% per annum on the difference between the outstanding loan balance and $100.0 million. The credit facility requires the maintenance of $3.0 million in average deposit balances. For 2017, the average interest rate on the facility was approximately 2.87% and as of March 6, 2018, the rate on the facility was 3.33%.
The terms of our revolving credit facility include certain restrictions and covenants which limit, among other things, the incurrence of liens, and which require compliance with financial ratios relating
42
to, among other things, the minimum amount of tangible net worth, the minimum amount of debt service coverage, the minimum amount of fixed charge coverage, the maximum amount of debt to value, the minimum level of net income, certain investment limitations and the minimum value of unencumbered properties and the number of such properties. Net proceeds received from the sale, financing or refinancing of properties are generally required to be used to repay amounts outstanding under our credit facility. At December 31, 2017, we were in compliance in all material respects with the covenants under this facility.
Contractual Obligations
The following sets forth our contractual obligations as of December 31, 2017:
| |
Payment due by period | |||||||||||||||
|---|---|---|---|---|---|---|---|---|---|---|---|---|---|---|---|---|
| (Dollars in thousands) |
Less than 1 Year |
1 - 3 Years | 4 - 5 Years | More than 5 Years |
Total | |||||||||||
Contractual Obligations |
||||||||||||||||
Mortgages payable—interest and amortization |
$ | 26,833 | $ | 53,376 | $ | 52,190 | $ | 110,928 | $ | 243,327 | ||||||
Mortgages payable—balances due at maturity |
10,260 | 3,485 | 40,002 | 214,048 | 267,795 | |||||||||||
Credit facility(1) |
— | 9,400 | — | — | 9,400 | |||||||||||
Purchase obligations(2) |
7,520 | 6,425 | 5,895 | — | 19,840 | |||||||||||
| | | | | | | | | | | | | | | | | |
Total |
$ | 44,613 | $ | 72,686 | $ | 98,087 | $ | 324,976 | $ | 540,362 | ||||||
| | | | | | | | | | | | | | | | | |
| | | | | | | | | | | | | | | | | |
| | | | | | | | | | | | | | | | | |
- (1)
- Represents
the amount outstanding at December 31, 2017. We may borrow up to $100.0 million under such facility.
- (2)
- Assumes that (i) $2.9 million will be payable annually during the next five years pursuant to the compensation and services agreement and (ii) $4.2 million will be spent in contractually required building expansion and tenant improvements at the L-3, Hauppauge, New York property in 2018. Excludes $3.0 million for tenant improvements at our Greensboro, North Carolina property, which obligation was satisfied in January 2018.
As of December 31, 2017, we had $392.5 million of mortgage debt outstanding (excluding mortgage indebtedness of our unconsolidated joint ventures), all of which is non-recourse (subject to standard carve-outs). We expect that mortgage interest and amortization payments (excluding repayments of principal at maturity) of approximately $80.2 million due through 2020 will be paid primarily from cash generated from our operations. We anticipate that principal balances due at maturity through 2020 of $13.7 million will be paid primarily from cash and cash equivalents and mortgage financings and refinancings. If we are unsuccessful in refinancing our existing indebtedness or financing our unencumbered properties, our cash flow, funds available under our credit facility and available cash, if any, may not be sufficient to repay all debt obligations when payments become due, and we may need to issue additional equity, obtain long or short-term debt, or dispose of properties on unfavorable terms.
43
Statement of Cash Flows
The following discussion of our cash flows is based on the consolidated statements of cash flows and is not meant to be a comprehensive discussion of the changes in our cash flows for the years presented.
| |
For the Years ended December 31, | |||||||||
|---|---|---|---|---|---|---|---|---|---|---|
| (Dollars in thousands) |
2017 | 2016 | 2015 | |||||||
Cash flow provided by operating activities |
$ | 44,557 | $ | 31,405 | $ | 34,484 | ||||
Cash flow used in investing activities |
(23,444 | ) | (80,911 | ) | (73,498 | ) | ||||
Cash flow (used in) provided by financing activities |
(24,767 | ) | 54,190 | 31,406 | ||||||
| | | | | | | | | | | |
Net (decrease) increase in cash and cash equivalents |
(3,654 | ) | 4,684 | (7,608 | ) | |||||
Cash and cash equivalents at beginning of year |
17,420 | 12,736 | 20,344 | |||||||
| | | | | | | | | | | |
Cash and cash equivalents at end of year |
$ | 13,766 | $ | 17,420 | $ | 12,736 | ||||
| | | | | | | | | | | |
| | | | | | | | | | | |
| | | | | | | | | | | |
Our principal source of operating cash flow is the net funds generated from the operation of our properties. Our properties provide a relatively consistent stream of cash flow that provides us with resources to pay operating expenses, debt service and fund quarterly dividend requirements.
The decrease in cash used in investing activities during 2017 compared to 2016 is due primarily to the decrease in purchases of real estate in 2017, offset by the decrease in net proceeds from sales of real estate in 2017.
The increase in cash flow used in financing activities during 2017 compared to 2016 is due primarily to the net decrease of $65.6 million in financings/repayments of mortgages payable and to a lesser extent, the net increase of $7.7 million in repayments (net of proceeds from drawdowns) on the credit facility in 2017. The increase in cash flow used in financing activities also resulted from a $20.2 million decrease in net proceeds from the sale of our common stock in 2017.
Cash Distribution Policy
We have elected to be taxed as a REIT under the Internal Revenue Code of 1986, as amended. Accordingly, to qualify as a REIT, we must, among other things, meet a number of organizational and operational requirements, including a requirement that we distribute currently at least 90% of our ordinary taxable income to our stockholders. It is our current intention to comply with these requirements and maintain our REIT status. As a REIT, we generally will not be subject to corporate federal, state or local income taxes on taxable income we distribute currently (in accordance with the Internal Revenue Code and applicable regulations) to our stockholders. If we fail to qualify as a REIT in any taxable year, we will be subject to federal, state and local income taxes at regular corporate rates and may not be able to qualify as a REIT for four subsequent tax years. Even if we qualify for federal taxation as a REIT, we may be subject to certain state and local taxes on our income and to federal income taxes on our undistributed taxable income (i.e., taxable income not distributed in the amounts and in the time frames prescribed by the Internal Revenue Code and applicable regulations thereunder) and are subject to Federal excise taxes on our undistributed taxable income.
It is our intention to pay to our stockholders within the time periods prescribed by the Internal Revenue Code no less than 90%, and, if possible, 100% of our annual taxable income, including taxable gains from the sale of real estate. It will continue to be our policy to make sufficient distributions to stockholders in order for us to maintain our REIT status under the Internal Revenue Code.
Our board of directors reviews the dividend policy regularly to determine if any changes to our dividend should be made.
44
Off-Balance Sheet Arrangements
We are not a party to any off-balance sheet arrangements other than with respect to land parcels owned by us and located in Lakemoor, Illinois, Wheaton, Illinois and Beachwood, Ohio. These parcels are improved by multi-family complexes and we ground leased the parcels to the owner/operators of such complexes. These ground leases generated $3.7 million of rental income, net, during 2017. At December 31, 2017, our maximum exposure to loss with respect to these properties is $34.0 million, representing the carrying value of the land; our leasehold positions are subordinate to an aggregate of $158.2 million of mortgage debt incurred by our tenants, the owner/operators of the multi-family complexes. These owner/operators are affiliated with one another. We do not believe that this type of off-balance sheet arrangement has been or will be material to our liquidity and capital resource positions. See Notes 4 and 7 to our consolidated financial statements for additional information regarding these arrangements.
Critical Accounting Policies
Our significant accounting policies are more fully described in Note 2 to our consolidated financial statements included in this Annual Report on Form 10-K. Certain of our accounting policies are particularly important to an understanding of our financial position and results of operations and require the application of significant judgment by our management; as a result they are subject to a degree of uncertainty. These critical accounting policies include the following, discussed below.
Purchase Accounting for Acquisition of Real Estate
The fair value of real estate acquired is allocated to acquired tangible assets, consisting of land and building, and identified intangible assets and liabilities, consisting of the value of above-market and below-market leases and other value of in-place leases based in each case on their fair values. The fair value of the tangible assets of an acquired property (which includes land, building and building improvements) is determined by valuing the property as if it were vacant, and the "as-if-vacant" value is then allocated to land, building and building improvements based on our determination of relative fair values of these assets. We assess fair value of the lease intangibles based on estimated cash flow projections that utilize appropriate discount rates and available market information. The fair values associated with below-market rental renewal options are determined based on our experience and the relevant facts and circumstances that existed at the time of the acquisitions. The portion of the values of the leases associated with below-market renewal options that we deem likely to be exercised are amortized to rental income over the respective renewal periods. The allocation made by us may have a positive or negative effect on net income and may have an effect on the assets and liabilities on the balance sheet.
Revenues
Our revenues, which are substantially derived from rental income, include rental income that our tenants pay in accordance with the terms of their respective leases reported on a straight-line basis over the non-cancellable term of each lease. Since many of our leases provide for rental increases at specified intervals, straight-line basis accounting requires us to record as an asset and include in revenues, unbilled rent receivables which we will only receive if the tenant makes all rent payments required through the expiration of the term of the lease. Accordingly, our management must determine, in its judgment, that the unbilled rent receivable applicable to each specific tenant is collectible. We review unbilled rent receivables on a quarterly basis and take into consideration the tenant's payment history and the financial condition of the tenant. In the event that the collectability of an unbilled rent receivable is in doubt, we are required to take a reserve against the receivable or a direct write-off of the receivable, which has an adverse effect on net income for the year in which the reserve or direct write-off is taken, and will decrease total assets and stockholders' equity.
45
Carrying Value of Real Estate Portfolio
We review our real estate portfolio on a quarterly basis to ascertain if there are any indicators of impairment to the value of any of our real estate assets, including deferred costs and intangibles, to determine if there is any need for an impairment charge. In reviewing the portfolio, we examine the type of asset, the current financial statements or other available financial information of the tenant, the economic situation in the area in which the asset is located, the economic situation in the industry in which the tenant is involved and the timeliness of the payments made by the tenant under its lease, as well as any current correspondence that may have been had with the tenant, including property inspection reports. For each real estate asset owned for which indicators of impairment exist, we perform a recoverability test by comparing the sum of the estimated undiscounted future cash flows attributable to the asset to its carrying amount. If the undiscounted cash flows are less than the asset's carrying amount, an impairment loss is recorded to the extent that the estimated fair value is less than the asset's carrying amount. The estimated fair value is determined using a discounted cash flow model of the expected future cash flows through the useful life of the property. Real estate assets that are expected to be disposed of are valued at the lower of carrying amount or fair value less costs to sell on an individual asset basis. We generally do not obtain any independent appraisals in determining value but rely on our own analysis and valuations. Any impairment charge taken with respect to any part of our real estate portfolio will reduce our net income and reduce assets and stockholders' equity to the extent of the amount of any impairment charge, but it will not affect our cash flow or our distributions until such time as we dispose of the property.
Item 7A. Quantitative and Qualitative Disclosures About Market Risk.
Our primary market risk exposure is the effect of changes in interest rates on the interest cost of draws on our revolving variable rate credit facility and the effect of changes in the fair value of our interest rate swap agreements. Interest rates are highly sensitive to many factors, including governmental monetary and tax policies, domestic and international economic and political considerations and other factors beyond our control.
We use interest rate swaps to limit interest rate risk on variable rate mortgages. These swaps are used for hedging purposes-not for speculation. We do not enter into interest rate swaps for trading purposes. At December 31, 2017, our aggregate liability in the event of the early termination of our swaps was $1.6 million.
At December 31, 2017, we had 30 interest rate swap agreements outstanding (including two held by three of our unconsolidated joint ventures). The fair market value of the interest rate swaps is dependent upon existing market interest rates and swap spreads, which change over time. As of December 31, 2017, if there had been an increase of 100 basis points in forward interest rates, the fair market value of the interest rate swaps would have increased by approximately $7.5 million and the net unrealized gain on derivative instruments would have increased by $7.5 million. If there were a decrease of 100 basis points in forward interest rates, the fair market value of the interest rate swaps would have decreased by approximately $8.1 million and the net unrealized gain on derivative instruments would have decreased by $8.1 million. These changes would not have any impact on our net income or cash.
Our mortgage debt, after giving effect to the interest rate swap agreements, bears interest at fixed rates and accordingly, the effect of changes in interest rates would not impact the amount of interest expense that we incur under these mortgages.
Our variable rate credit facility is sensitive to interest rate changes. At December 31, 2017, a 100 basis point increase of the interest rate on this facility would increase our related interest costs by approximately $94,000 per year and a 100 basis point decrease of the interest rate would decrease our related interest costs by approximately $94,000 per year.
46
The fair market value of our long-term debt is estimated based on discounting future cash flows at interest rates that our management believes reflect the risks associated with long term debt of similar risk and duration.
The following table sets forth our debt obligations by scheduled principal cash flow payments and maturity date, weighted average interest rates and estimated fair market value at December 31, 2017:
| |
For the Year Ended December 31, | ||||||||||||||||||||||||
|---|---|---|---|---|---|---|---|---|---|---|---|---|---|---|---|---|---|---|---|---|---|---|---|---|---|
| (Dollars in thousands) |
2018 | 2019 | 2020 | 2021 | 2022 | Thereafter | Total | Fair Market Value |
|||||||||||||||||
Fixed rate: |
|||||||||||||||||||||||||
Long-term debt |
$ | 20,448 | $ | 14,610 | $ | 11,901 | $ | 20,742 | $ | 43,771 | $ | 281,051 | $ | 392,523 | $ | 397,103 | |||||||||
Weighted average interest rate |
4.32 | % | 4.24 | % | 4.35 | % | 4.27 | % | 4.05 | % | 4.23 | % | 4.22 | % | 4.25 | % | |||||||||
Variable rate: |
|||||||||||||||||||||||||
Long-term debt(1) |
— | $ | 9,400 | — | — | — | — | $ | 9,400 | — | |||||||||||||||
- (1)
- Our credit facility matures on December 31, 2019 and bears interest at the 30 day LIBOR rate plus the applicable margin. The applicable margin varies based on the ratio of total debt to total value. See "Item 7. Management's Discussion and Analysis of Financial Conditions and Results of Operations—Liquidity and Capital Resources—Credit Facility."
Item 8. Financial Statements and Supplementary Data.
This information appears in Item 15(a) of this Annual Report on Form 10-K, and is incorporated into this Item 8 by reference thereto.
Item 9. Changes in and Disagreements with Accountants on Accounting and Financial Disclosure.
Not applicable.
Item 9A. Controls and Procedures.
Evaluation of Disclosure Controls and Procedures
A review and evaluation was performed by our management, including our Chief Executive Officer and Chief Financial Officer, of the effectiveness of the design and operation of our disclosure controls and procedures (as such term is defined in Rules 13a-15(e) and 15d-15(e) under the Securities Exchange Act of 1934, as amended (the "Exchange Act") as of the end of the period covered by this Annual Report on Form 10-K. Based on that review and evaluation, the CEO and CFO have concluded that our disclosure controls and procedures, as designed and implemented as of December 31, 2017, were effective.
Changes in Internal Controls over Financial Reporting
There have been no changes in our internal controls over financial reporting, as defined in in Rules 13a-15(f) and 15d-15(f) promulgated under the Exchange Act, that occurred during the three months ended December 31, 2017 that materially affected, or is reasonably likely to materially affect, our internal controls over financial reporting.
Management's Report on Internal Control Over Financial Reporting
Our management is responsible for establishing and maintaining adequate internal control over financial reporting. Internal control over financial reporting is defined in Rules 13a-15(f) and 15d-15(f) promulgated under the Exchange Act as a process designed by, or under the supervision of, a company's principal executive and principal financial officers and effected by a company's board,
47
management and other personnel to provide reasonable assurance regarding the reliability of financial reporting and the preparation of financial statements for external purposes in accordance with GAAP and includes those policies and procedures that:
- •
- pertain to the maintenance of records that in reasonable detail accurately and fairly reflect the transactions and dispositions of the assets
of a company;
- •
- provide reasonable assurance that transactions are recorded as necessary to permit preparation of financial statements in accordance with GAAP,
and that receipts and expenditures of a company are being made only in accordance with authorizations of management and directors of a company; and
- •
- provide reasonable assurance regarding prevention or timely detection of unauthorized acquisition, use or disposition of a company's assets that could have a material effect on the financial transactions.
Because of its inherent limitations, internal control over financial reporting may not prevent or detect misstatements. Projections of any evaluation of effectiveness to future periods are subject to the risks that controls may become inadequate because of changes in conditions or that the degree of compliance with the policies or procedures may deteriorate.
Our management, with the participation of our Chief Executive Officer and Chief Financial Officer, assessed the effectiveness of our internal control over financial reporting as of December 31, 2017. In making this assessment, our management used criteria set forth by the Committee of Sponsoring Organizations of the Treadway Commission in Internal Control—Integrated Framework (2013).
Based on its assessment, our management concluded that, as of December 31, 2017, our internal control over financial reporting was effective based on those criteria.
Our independent registered public accounting firm, Ernst & Young LLP, have issued a report on management's assessment of the effectiveness of internal control over financial reporting. This report appears on page F-2 of this Annual Report on Form 10-K.
The following discussion supplements and updates the discussion (the "Prior Discussion") contained in our prospectus dated May 10, 2017 under the heading "Federal Income Tax Considerations" and supersedes the Prior Discussion to the extent the discussion below is inconsistent with the Prior Discussion. The Prior Discussion and the discussion below (collectively referred to as the "Tax Discussion") are subject to the qualifications set forth therein and below. The tax treatment of security holders will vary depending upon the holder's particular situation, and the Tax Discussion addresses only holders that hold securities as a capital asset and does not deal with all aspects of taxation that may be relevant to particular holders in light of their personal investment or tax circumstances. The Tax Discussion also does not deal with all aspects of taxation that may be relevant to certain types of holders, to which special provisions of the federal income tax laws apply, including:
- •
- dealers in securities or currencies;
- •
- traders in securities that elect to use a mark-to-market method of accounting for their securities holdings;
- •
- banks and other financial institutions;
- •
- tax-exempt organizations;
- •
- certain insurance companies;
48
- •
- persons liable for the alternative minimum tax;
- •
- persons that hold securities as a hedge against interest rate or currency risks or as part of a straddle or conversion transaction;
- •
- non-U.S. individuals and foreign corporations; and
- •
- holders whose functional currency is not the U.S. dollar.
The statements in the Tax Discussion are based on the Code, its legislative history, current and proposed regulations under the Code, published rulings and court decisions. This summary describes the provisions of these sources of law only as they are currently in effect. All of these sources of law may change at any time, and any change in the law may apply retroactively. We cannot assure you that new laws, interpretations of law or court decisions, any of which may take effect retroactively, will not cause any statement in this discussion to be inaccurate.
As supplemented and updated by this summary, and by the discussion in any applicable prospectus supplement, investors should review the discussion in the prospectus under the heading "Federal Income Tax Considerations" for a more detailed summary of the federal income tax consequences of the purchase, ownership, and disposition of our securities and our election to be subject to federal income tax as a REIT.
PROSPECTIVE INVESTORS SHOULD CONSULT THEIR TAX ADVISORS REGARDING THE U.S. FEDERAL, STATE, LOCAL, FOREIGN AND OTHER TAX CONSEQUENCES OF THE ACQUISITION, OWNERSHIP, AND DISPOSITION OF OUR SECURITIES.
Enactment of Tax Act
On December 22, 2017, the Tax Cuts and Jobs Act, which we refer to as the "Tax Act", was enacted. The Tax Act makes major changes to the Code, including a number of provisions of the Code that may affect the taxation of REITs and the holders of their securities. The most significant of these provisions are described below. The individual and collective impact of these changes on REITs and their security holders is uncertain and may not become evident for some period of time. Prospective investors should consult their tax advisors regarding the implications of the Tax Act on their investment.
Revised Individual Tax Rates and Deductions
The Tax Act adjusted the tax brackets and reduced the top federal income tax rate for individuals from 39.6% to 37%. In addition, numerous deductions were eliminated or limited, including the deduction for state and local taxes being limited to $10,000 per year. These individual income tax changes are generally effective beginning in 2018, but without further legislation, they will sunset after 2025.
Pass-Through Business Income Tax Rate Lowered through Deduction
Under the Tax Act, individuals, trusts, and estates generally may deduct 20% of "qualified business income" (generally, domestic trade or business income other than certain investment items) of a partnership, S corporation, or sole proprietorship. In addition, "qualified REIT dividends" (i.e., REIT dividends other than capital gain dividends and portions of REIT dividends designated as qualified dividend income eligible for capital gain tax rates) and certain other income items are eligible for the deduction. The deduction, however, is subject to complex limitations to its availability. As with the other individual income tax changes, the provisions related to the deduction are effective beginning in 2018, but without further legislation, they will sunset after 2025.
49
Graduated Corporate Tax Rates Replaced With Single Rate; Elimination of Corporate Alternative Minimum Tax
The Tax Act eliminated graduated corporate income tax rates with a maximum rate of 35% and replaced them with a single corporate income tax rate of 21%, and reduced the dividends received deduction for certain corporate subsidiaries. The 21% rate may also apply to (i) our net income for any taxable period in which we fail to qualify as a REIT, or (ii) our net income from nonqualifying assets during a period in which we fail to satisfy the REIT asset test but otherwise qualify as a REIT. The Tax Act also permanently eliminated the corporate alternative minimum tax. These provisions are effective beginning in 2018.
Net Operating Loss Modifications
The Tax Act limited the net operating loss ("NOL") deduction to 80% of taxable income (before the deduction). The Tax Act also generally eliminated NOL carrybacks for individuals and non-REIT corporations (NOL carrybacks did not apply to REITs under prior law) but allows indefinite NOL carryforwards. The new NOL rules apply beginning in 2018.
Limitations on Interest Deductibility
The Tax Act limits the net interest expense deduction of a business to 30% of the sum of adjusted taxable income, business interest, and certain other amounts. The Tax Act allows a real property trade or business to elect out of such limitation so long as it uses the alternative depreciation system which lengthens the depreciation recovery period with respect to certain property. The limitation with respect to the net interest expense deduction applies beginning in 2018.
Withholding Rate Reduced
The Tax Act reduced the highest rate of withholding with respect to distributions to non-U.S. holders that are treated as attributable to gains from the sale or exchange of U.S. real property interests from 35% to 21%. These provisions are effective beginning in 2018.
50
Item 10. Directors, Executive Officers and Corporate Governance.
Apart from certain information concerning our executive officers which is set forth in Part I of this Annual Report, additional information required by this Item 10 shall be included in our proxy statement for our 2018 annual meeting of stockholders, to be filed with the SEC not later than April 30, 2018, and is incorporated herein by reference.
Set forth below is a list of our executive officers whose terms expire at our 2018 annual board of directors' meeting. The business history of our officers, who are also directors, will be provided in our proxy statement to be filed pursuant to Regulation 14A not later than April 30, 2018.
NAME
|
AGE | POSITION WITH THE COMPANY | |||
|---|---|---|---|---|---|
| Matthew J. Gould* | 58 | Chairman of the Board | |||
| Fredric H. Gould* | 82 | Vice Chairman of the Board | |||
| Patrick J. Callan, Jr. | 55 | President, Chief Executive Officer and Director | |||
| Lawrence G. Ricketts, Jr. | 41 | Executive Vice President and Chief Operating Officer | |||
| Jeffrey A. Gould* | 52 | Senior Vice President and Director | |||
| David W. Kalish** | 70 | Senior Vice President and Chief Financial Officer | |||
| Mark H. Lundy | 55 | Senior Vice President and Secretary | |||
| Israel Rosenzweig | 70 | Senior Vice President | |||
| Karen Dunleavy | 59 | Vice President, Financial | |||
| Alysa Block | 57 | Treasurer | |||
| Richard M. Figueroa | 50 | Vice President and Assistant Secretary | |||
| Isaac Kalish** | 42 | Vice President and Assistant Treasurer | |||
| Justin Clair | 35 | Vice President | |||
- *
- Matthew
J. Gould and Jeffrey A. Gould are Fredric H. Gould's sons.
- **
- Isaac Kalish is David W. Kalish's son.
Lawrence G. Ricketts, Jr. Mr. Ricketts has been our Chief Operating Officer since 2008, Vice President from 1999 through 2006 and Executive Vice President since 2006.
David W. Kalish. Mr. Kalish has served as our Senior Vice President and Chief Financial Officer since 1990 and as Senior Vice President, Finance of BRT Apartments Corp. since 1998. Since 1990, he has served as Vice President and Chief Financial Officer of the managing general partner of Gould Investors L.P., a master limited partnership involved primarily in the ownership and operation of a diversified portfolio of real estate assets. Mr. Kalish is a certified public accountant.
Mark H. Lundy. Mr. Lundy has served as our Secretary since 1993, as our Vice President since 2000 and as our Senior Vice President since 2006. Mr. Lundy has been a Vice President of BRT Apartments Corp. from 1993 to 2006, its Senior Vice President since 2006, a Vice President of the managing general partner of Gould Investors from 1990 through 2012 and its President and Chief Operating Officer since 2013. He is an attorney admitted to practice in New York and the District of Columbia.
Israel Rosenzweig. Mr. Rosenzweig has served as our Senior Vice President since 1997, as Chairman of the Board of Directors of BRT Apartments Corp. since 2013, as Vice Chairman of its Board of Directors from 2012 through 2013, and as its Senior Vice President from 1998 through 2012. He has been a Vice President of the managing general partner of Gould Investors since 1997.
51
Karen Dunleavy. Ms. Dunleavy has been our Vice President, Financial since 1994. She served as Treasurer of the managing general partner of Gould Investors from 1986 through 2013. Ms. Dunleavy is a certified public accountant.
Alysa Block. Ms. Block has been our Treasurer since 2007, and served as Assistant Treasurer from 1997 to 2007. Ms. Block has also served as the Treasurer of BRT Apartments Corp. from 2008 through 2013, and served as its Assistant Treasurer from 1997 to 2008.
Richard M. Figueroa. Mr. Figueroa has served as our Vice President and Assistant Secretary since 2001, as Vice President and Assistant Secretary of BRT Apartments Corp. since 2002 and as Vice President of the managing general partner of Gould Investors since 1999. Mr. Figueroa is an attorney admitted to practice in New York.
Isaac Kalish. Mr. Kalish has served as our Vice President since 2013, Assistant Treasurer since 2007, as Assistant Treasurer of the managing general partner of Gould Investors from 2012 through 2013, as Treasurer from 2013, as Vice President and Treasurer of BRT Apartments Corp. since 2013, and as its Assistant Treasurer from 2009 through 2013. Mr. Kalish is a certified public accountant.
Justin Clair. Mr. Clair has been employed by us since 2006, served as Assistant Vice President from 2010 through 2014 and as Vice President since 2014.
Item 11. Executive Compensation.
The information concerning our executive compensation required by this Item 11 shall be included in our proxy statement for our 2018 annual meeting of stockholders, to be filed with the SEC not later than April 30, 2018, and is incorporated herein by reference.
Item 12. Security Ownership of Certain Beneficial Owners and Management and Related Stockholder Matters.
The information concerning our beneficial owners and management required by this Item 12 shall be included in our proxy statement for our 2018 annual meeting of stockholders, to be filed with the SEC not later than April 30, 2018 and is incorporated herein by reference.
Equity Compensation Plan Information
As of December 31, 2017, the only equity compensation plan under which equity compensation may be awarded is our 2016 Incentive Plan, which was approved by our stockholders in June 2016. This plan permits us to grant stock options, restricted stock, restricted stock units and performance based awards to our employees, officers, directors, consultants and other eligible participants. The following
52
table provides information as of December 31, 2017 about shares of our common stock that may be issued upon the exercise of options, warrants and rights under our 2016 Incentive Plan:
Plan Category
|
Number of securities to be issued upon exercise of outstanding options, warrants and rights(1) |
Weighted-average exercise price of outstanding options, warrants and rights |
Number of securities remaining available for future issuance under equity compensation plans (excluding securities reflected in column(a))(2) |
|||||||
|---|---|---|---|---|---|---|---|---|---|---|
| |
(a) |
(b) |
(c) |
|||||||
Equity compensation plans approved by security holders |
76,250 | — | 533,750 | |||||||
Equity compensation plans not approved by security holders |
— | — | — | |||||||
| | | | | | | | | | | |
Total |
76,250 | — | 533,750 | |||||||
| | | | | | | | | | | |
| | | | | | | | | | | |
| | | | | | | | | | | |
- (1)
- Represents
an aggregate of up to 76,250 shares of common stock issuable pursuant to restricted stock units. Assuming a continuing relationship with us, the shares
underlying these units vest on June 30, 2020 if and to the extent specified performance (i.e., average annual return on capital) and/or
market (i.e., average annual total stockholder return) conditions are satisfied by June 30, 2020.
- (2)
- Does not give effect to 144,750 restricted stock awards granted January 18, 2018 pursuant to our 2016 Incentive Plan.
Item 13. Certain Relationships and Related Transactions, and Director Independence.
The information concerning certain relationships, related transactions and director independence required by this Item 13 shall be included in our proxy statement for our 2018 annual meeting of stockholders, to be filed with the SEC not later than April 30, 2018 and is incorporated herein by reference.
Item 14. Principal Accountant Fees and Services.
The information concerning our principal accounting fees required by this Item 14 shall be included in our proxy statement for our 2018 annual meeting of stockholders, to be filed with the SEC not later than April 30, 2018 and is incorporated herein by reference.
53
Item 15. Exhibits and Financial Statement Schedules.
- (a)
- Documents
filed as part of this Report:
- (1)
- The following financial statements of the Company are included in this Annual Report on Form 10-K:
- (2)
- Financial Statement Schedules:
All other schedules are omitted because they are not applicable or the required information is shown in the consolidated financial statements or the notes thereto.
- (b)
- Exhibits:
54
55
| 101.LAB | XBRL Taxonomy Extension Definition Label Linkbase Document | ||
| 101.PRE | XBRL Taxonomy Extension Presentation Linkbase Document |
- *
- Indicates a management contract or compensatory plan or arrangement.
The file number for all the exhibits incorporated by reference is 001- 09279 other than exhibit 4.4 whose file number is 333-86850.
Not applicable.
56
Pursuant to the requirements of Section 13 or 15(d) of the Exchange, the Registrant has duly caused this report to be signed on its behalf of the undersigned, thereunto duly authorized.
| March 14, 2018 | ONE LIBERTY PROPERTIES, INC. | |||
By: |
/s/ PATRICK J. CALLAN, JR. Patrick J. Callan, Jr. President and Chief Executive Officer |
|||
Pursuant to the requirements of the Exchange Act, this report has been signed below by the following persons on behalf of the Registrant in the capacities indicated on the dates indicated.
Signature
|
Title
|
Date
|
||
|---|---|---|---|---|
| /s/ MATTHEW J. GOULD Matthew J. Gould |
Chairman of the Board of Directors | March 14, 2018 | ||
/s/ FREDRIC H. GOULD Fredric H. Gould |
Vice Chairman of the Board of Directors |
March 14, 2018 |
||
/s/ PATRICK J. CALLAN, JR. Patrick J. Callan, Jr. |
President, Chief Executive Officer and Director |
March 14, 2018 |
||
/s/ CHARLES BIEDERMAN Charles Biederman |
Director |
March 14, 2018 |
||
/s/ JOSEPH A. DELUCA Joseph A. DeLuca |
Director |
March 14, 2018 |
||
/s/ JEFFREY A. GOULD Jeffrey A. Gould |
Director |
March 14, 2018 |
||
/s/ LOUIS P. KAROL Louis P. Karol |
Director |
March 14, 2018 |
||
/s/ J. ROBERT LOVEJOY J. Robert Lovejoy |
Director |
March 14, 2018 |
57
Signature
|
Title
|
Date
|
||
|---|---|---|---|---|
| /s/ LEOR SIRI Leor Siri |
Director | March 14, 2018 | ||
/s/ EUGENE I. ZURIFF Eugene I. Zuriff |
Director |
March 14, 2018 |
||
/s/ DAVID W. KALISH David W. Kalish |
Senior Vice President and Chief Financial Officer (Principal Financial Officer) |
March 14, 2018 |
||
/s/ KAREN DUNLEAVY Karen Dunleavy |
Vice President, Financial (Principal Accounting Officer) |
March 14, 2018 |
58
Report of Independent Registered Public Accounting Firm
To the Stockholders and the Board of Directors of One Liberty Properties, Inc.
Opinion on the Financial Statements
We have audited the accompanying consolidated balance sheets of One Liberty Properties, Inc. and subsidiaries (the Company) as of December 31, 2017 and 2016, the related consolidated statements of income, comprehensive income, changes in equity and cash flows for each of the three years in the period ended December 31, 2017, and the related notes and financial statement schedule listed in the Index at Item 15(a)(2) (collectively referred to as the "consolidated financial statements"). In our opinion, the consolidated financial statements present fairly, in all material respects, the financial position of the Company at December 31, 2017 and 2016, and the results of its operations and its cash flows for each of the three years in the period ended December 31, 2017, in conformity with U.S. generally accepted accounting principles.
We also have audited, in accordance with the standards of the Public Company Accounting Oversight Board (United States) (PCAOB), the Company's internal control over financial reporting as of December 31, 2017, based on criteria established in Internal Control—Integrated Framework issued by the Committee of Sponsoring Organizations of the Treadway Commission (2013 framework) and our report dated March 14, 2018 expressed an unqualified opinion thereon.
Basis for Opinion
These financial statements are the responsibility of the Company's management. Our responsibility is to express an opinion on the Company's financial statements based on our audits. We are a public accounting firm registered with the PCAOB and are required to be independent with respect to the Company in accordance with the U.S. federal securities laws and the applicable rules and regulations of the Securities and Exchange Commission and the PCAOB.
We conducted our audits in accordance with the standards of the PCAOB. Those standards require that we plan and perform the audit to obtain reasonable assurance about whether the financial statements are free of material misstatement, whether due to error or fraud. Our audits included performing procedures to assess the risks of material misstatement of the financial statements, whether due to error or fraud, and performing procedures that respond to those risks. Such procedures included examining, on a test basis, evidence regarding the amounts and disclosures in the financial statements. Our audits also included evaluating the accounting principles used and significant estimates made by management, as well as evaluating the overall presentation of the financial statements. We believe that our audits provide a reasonable basis for our opinion.
/s/ Ernst & Young LLP
We have served as the Company's auditor since 1989.
New
York, New York
March 14, 2018
F-1
Report of Independent Registered Public Accounting Firm
To the Stockholders and the Board of Directors of One Liberty Properties, Inc.
Opinion on Internal Control over Financial Reporting
We have audited One Liberty Properties, Inc. and subsidiaries' internal control over financial reporting as of December 31, 2017, based on criteria established in Internal Control—Integrated Framework issued by the Committee of Sponsoring Organizations of the Treadway Commission (2013 framework) (the COSO criteria). In our opinion, One Liberty Properties, Inc. and subsidiaries (the Company) maintained, in all material respects, effective internal control over financial reporting as of December 31, 2017, based on the COSO criteria.
We also have audited, in accordance with the standards of the Public Company Accounting Oversight Board (United States) (PCAOB), the 2017 consolidated financial statements of the Company and our report dated March 14, 2018 expressed an unqualified opinion thereon.
Basis for Opinion
The Company's management is responsible for maintaining effective internal control over financial reporting and for its assessment of the effectiveness of internal control over financial reporting included in the accompanying Management's Report on Internal Control Over Financial Reporting. Our responsibility is to express an opinion on the Company's internal control over financial reporting based on our audit. We are a public accounting firm registered with the PCAOB and are required to be independent with respect to the Company in accordance with the U.S. federal securities laws and the applicable rules and regulations of the Securities and Exchange Commission and the PCAOB.
We conducted our audit in accordance with the standards of the PCAOB. Those standards require that we plan and perform the audit to obtain reasonable assurance about whether effective internal control over financial reporting was maintained in all material respects.
Our audit included obtaining an understanding of internal control over financial reporting, assessing the risk that a material weakness exists, testing and evaluating the design and operating effectiveness of internal control based on the assessed risk, and performing such other procedures as we considered necessary in the circumstances. We believe that our audit provides a reasonable basis for our opinion.
Definition and Limitations of Internal Control Over Financial Reporting
A company's internal control over financial reporting is a process designed to provide reasonable assurance regarding the reliability of financial reporting and the preparation of financial statements for external purposes in accordance with generally accepted accounting principles. A company's internal control over financial reporting includes those policies and procedures that (1) pertain to the maintenance of records that, in reasonable detail, accurately and fairly reflect the transactions and dispositions of the assets of the company; (2) provide reasonable assurance that transactions are recorded as necessary to permit preparation of financial statements in accordance with generally accepted accounting principles, and that receipts and expenditures of the company are being made only in accordance with authorizations of management and directors of the company; and (3) provide reasonable assurance regarding prevention or timely detection of unauthorized acquisition, use, or disposition of the company's assets that could have a material effect on the financial statements.
F-2
Because of its inherent limitations, internal control over financial reporting may not prevent or detect misstatements. Also, projections of any evaluation of effectiveness to future periods are subject to the risk that controls may become inadequate because of changes in conditions, or that the degree of compliance with the policies or procedures may deteriorate.
/s/ Ernst & Young LLP
New
York, New York
March 14, 2018
F-3
ONE LIBERTY PROPERTIES, INC. AND SUBSIDIARIES
Consolidated Balance Sheets
(Amounts in Thousands, Except Par Value)
| |
December 31, | ||||||
|---|---|---|---|---|---|---|---|
| |
2017 | 2016 | |||||
ASSETS |
|||||||
Real estate investments, at cost |
|||||||
Land |
$ | 209,320 | $ | 211,432 | |||
Buildings and improvements |
566,007 | 536,633 | |||||
| | | | | | | | |
Total real estate investments, at cost |
775,327 | 748,065 | |||||
Less accumulated depreciation |
108,953 | 96,852 | |||||
| | | | | | | | |
Real estate investments, net |
666,374 | 651,213 | |||||
Investment in unconsolidated joint ventures |
10,723 |
10,833 |
|||||
Cash and cash equivalents |
13,766 | 17,420 | |||||
Restricted cash |
443 | 643 | |||||
Unbilled rent receivable |
14,125 | 13,797 | |||||
Unamortized intangible lease assets, net |
30,525 | 32,645 | |||||
Escrow, deposits and other assets and receivables |
6,630 | 6,894 | |||||
| | | | | | | | |
Total assets(1) |
$ | 742,586 | $ | 733,445 | |||
| | | | | | | | |
| | | | | | | | |
| | | | | | | | |
LIABILITIES AND EQUITY |
|||||||
Liabilities: |
|||||||
Mortgages payable, net of $3,789 and $4,294 of deferred financing costs, respectively |
$ | 393,157 | $ | 394,898 | |||
Line of credit, net of $624 and $936 of deferred financing costs, respectively |
8,776 | 9,064 | |||||
Dividends payable |
8,493 | 7,806 | |||||
Accrued expenses and other liabilities |
16,107 | 10,470 | |||||
Unamortized intangible lease liabilities, net |
17,551 | 19,280 | |||||
| | | | | | | | |
Total liabilities(1) |
444,084 | 441,518 | |||||
| | | | | | | | |
Commitments and contingencies |
|||||||
Equity: |
|||||||
One Liberty Properties, Inc. stockholders' equity: |
|||||||
Preferred stock, $1 par value; 12,500 shares authorized; none issued |
— | — | |||||
Common stock, $1 par value; 25,000 shares authorized; 18,261 and 17,600 shares issued and outstanding |
18,261 | 17,600 | |||||
Paid-in capital |
275,087 | 262,511 | |||||
Accumulated other comprehensive income (loss) |
155 | (1,479 | ) | ||||
Accumulated undistributed net income |
3,257 | 11,501 | |||||
| | | | | | | | |
Total One Liberty Properties, Inc. stockholders' equity |
296,760 | 290,133 | |||||
Non-controlling interests in consolidated joint ventures(1) |
1,742 | 1,794 | |||||
| | | | | | | | |
Total equity |
298,502 | 291,927 | |||||
| | | | | | | | |
Total liabilities and equity |
$ | 742,586 | $ | 733,445 | |||
| | | | | | | | |
| | | | | | | | |
| | | | | | | | |
- (1)
- The Company's consolidated balance sheets include assets and liabilities of consolidated variable interest entities ("VIEs"). See Note 7. The consolidated balance sheets include the following amounts related to the Company's consolidated VIEs: $17,844 and $17,844 of land, $31,789 and $32,535 of building and improvements, net of $3,811 and $2,732 of accumulated depreciation, $4,345 and $5,521 of other assets included in other line items, $32,252 and $33,121 of real estate debt, net, $2,885 and $3,093 of other liabilities included in other line items, and $1,742 and $1,794 of non-controlling interests as of December 31, 2017 and 2016, respectively.
See accompanying notes.
F-4
ONE LIBERTY PROPERTIES, INC. AND SUBSIDIARIES
Consolidated Statements of Income
(Amounts in Thousands, Except Per Share Data)
| |
Year Ended December 31, | |||||||||
|---|---|---|---|---|---|---|---|---|---|---|
| |
2017 | 2016 | 2015 | |||||||
Revenues: |
||||||||||
Rental income, net |
$ | 68,244 | $ | 64,164 | $ | 58,973 | ||||
Tenant reimbursements |
7,672 | 6,424 | 3,852 | |||||||
Lease termination fees |
— | — | 2,886 | |||||||
| | | | | | | | | | | |
Total revenues |
75,916 | 70,588 | 65,711 | |||||||
| | | | | | | | | | | |
Operating expenses: |
||||||||||
Depreciation and amortization |
20,993 | 18,164 | 16,384 | |||||||
General and administrative (see Note 12 for related party information) |
11,279 | 10,693 | 9,527 | |||||||
Real estate expenses (see Note 12 for related party information) |
10,736 | 8,931 | 6,047 | |||||||
Real estate acquisition costs (see Note 12 for related party information) |
— | 596 | 449 | |||||||
Federal excise and state taxes |
481 | 203 | 343 | |||||||
Leasehold rent |
308 | 308 | 308 | |||||||
Impairment loss |
153 | — | — | |||||||
| | | | | | | | | | | |
Total operating expenses |
43,950 | 38,895 | 33,058 | |||||||
| | | | | | | | | | | |
Operating income |
31,966 | 31,693 | 32,653 | |||||||
Other income and expenses: |
||||||||||
Equity in earnings of unconsolidated joint ventures (see Note 12 for related party information) |
826 | 1,005 | 412 | |||||||
Purchase price fair value adjustment |
— | — | 960 | |||||||
Prepayment costs on debt |
— | (577 | ) | (568 | ) | |||||
Other income |
407 | 435 | 108 | |||||||
Interest: |
||||||||||
Expense |
(17,810 | ) | (17,258 | ) | (16,027 | ) | ||||
Amortization and write-off of deferred financing costs |
(977 | ) | (904 | ) | (1,023 | ) | ||||
| | | | | | | | | | | |
Income before gain on sale of real estate, net |
14,412 | 14,394 | 16,515 | |||||||
Gain on sale of real estate, net |
9,837 | 10,087 | 5,392 | |||||||
| | | | | | | | | | | |
Net income |
24,249 | 24,481 | 21,907 | |||||||
Net income attributable to non-controlling interests |
(102 | ) | (59 | ) | (1,390 | ) | ||||
| | | | | | | | | | | |
Net income attributable to One Liberty Properties, Inc. |
$ | 24,147 | $ | 24,422 | $ | 20,517 | ||||
| | | | | | | | | | | |
| | | | | | | | | | | |
| | | | | | | | | | | |
Weighted average number of common shares outstanding: |
||||||||||
Basic |
17,944 | 16,768 | 15,971 | |||||||
| | | | | | | | | | | |
| | | | | | | | | | | |
| | | | | | | | | | | |
Diluted |
18,047 | 16,882 | 16,079 | |||||||
| | | | | | | | | | | |
| | | | | | | | | | | |
| | | | | | | | | | | |
Per common share attributable to common stockholders: |
||||||||||
Basic |
$ | 1.29 | $ | 1.40 | $ | 1.23 | ||||
| | | | | | | | | | | |
| | | | | | | | | | | |
| | | | | | | | | | | |
Diluted |
$ | 1.28 | $ | 1.39 | $ | 1.22 | ||||
| | | | | | | | | | | |
| | | | | | | | | | | |
| | | | | | | | | | | |
See accompanying notes.
F-5
ONE LIBERTY PROPERTIES, INC. AND SUBSIDIARIES
Consolidated Statements of Comprehensive Income
(Amounts in Thousands)
| |
Year Ended December 31, | |||||||||
|---|---|---|---|---|---|---|---|---|---|---|
| |
2017 | 2016 | 2015 | |||||||
Net income |
$ | 24,249 | $ | 24,481 | $ | 21,907 | ||||
| | | | | | | | | | | |
Other comprehensive gain (loss) |
||||||||||
Net unrealized gain on available-for-sale securities |
— | — | 3 | |||||||
Reclassification of gain on available-for-sale securities included in net income |
— | (27 | ) | — | ||||||
Net unrealized gain (loss) on derivative instruments |
1,565 | 2,879 | (1,168 | ) | ||||||
One Liberty Properties, Inc.'s share of joint ventures' net unrealized gain (loss) on derivative instruments |
76 | 64 | (1 | ) | ||||||
| | | | | | | | | | | |
Other comprehensive gain (loss) |
1,641 | 2,916 | (1,166 | ) | ||||||
| | | | | | | | | | | |
Comprehensive income |
25,890 |
27,397 |
20,741 |
|||||||
Net income attributable to non-controlling interests |
(102 | ) | (59 | ) | (1,390 | ) | ||||
Adjustment for derivative instruments attributable to non-controlling interests |
(7 | ) | (5 | ) | 29 | |||||
| | | | | | | | | | | |
Comprehensive income attributable to One Liberty Properties, Inc. |
$ | 25,781 | $ | 27,333 | $ | 19,380 | ||||
| | | | | | | | | | | |
| | | | | | | | | | | |
| | | | | | | | | | | |
See accompanying notes.
F-6
ONE LIBERTY PROPERTIES, INC. AND SUBSIDIARIES
Consolidated Statements of Changes in Equity
For the Three Years Ended December 31, 2017
(Amounts in Thousands, Except Per Share Data)
| |
Common Stock |
Paid-in Capital |
Accumulated Other Comprehensive Income (Loss) |
Accumulated Undistributed Net Income |
Non- Controlling Interests in Consolidated Joint Ventures |
Total | |||||||||||||
|---|---|---|---|---|---|---|---|---|---|---|---|---|---|---|---|---|---|---|---|
Balances, December 31, 2014 |
$ | 15,728 | $ | 219,867 | $ | (3,195 | ) | $ | 21,876 | $ | 1,628 | $ | 255,904 | ||||||
Distributions—common stock |
|||||||||||||||||||
Cash—$1.58 per share |
— | — | — | (26,178 | ) | — | (26,178 | ) | |||||||||||
Shares issued through equity offering program—net |
295 | 6,162 | — | — | — | 6,457 | |||||||||||||
Restricted stock vesting |
72 | (72 | ) | — | — | — | — | ||||||||||||
Shares issued through dividend reinvestment plan |
197 | 4,087 | — | — | — | 4,284 | |||||||||||||
Contributions from non-controlling interests |
— | — | — | — | 713 | 713 | |||||||||||||
Distributions to non-controlling interests |
— | — | — | — | (1,829 | ) | (1,829 | ) | |||||||||||
Compensation expense—restricted stock |
— | 2,334 | — | — | — | 2,334 | |||||||||||||
Net income |
— | — | — | 20,517 | 1,390 | 21,907 | |||||||||||||
Other comprehensive (loss) income |
— | — | (1,195 | ) | — | 29 | (1,166 | ) | |||||||||||
| | | | | | | | | | | | | | | | | | | | |
Balances, December 31, 2015 |
16,292 | 232,378 | (4,390 | ) | 16,215 | 1,931 | 262,426 | ||||||||||||
Distributions—common stock |
|||||||||||||||||||
Cash—$1.66 per share |
— | — | — | (29,136 | ) | — | (29,136 | ) | |||||||||||
Shares issued through equity offering program—net |
1,080 | 24,707 | — | — | — | 25,787 | |||||||||||||
Restricted stock vesting |
86 | (86 | ) | — | — | — | — | ||||||||||||
Shares issued through dividend reinvestment plan |
142 | 2,965 | — | — | — | 3,107 | |||||||||||||
Contribution from non-controlling interests |
— | — | — | — | 80 | 80 | |||||||||||||
Distributions to non-controlling interests |
— | — | — | — | (271 | ) | (271 | ) | |||||||||||
Purchase of non-controlling interest |
— | (436 | ) | — | — | (10 | ) | (446 | ) | ||||||||||
Compensation expense—restricted stock |
— | 2,983 | — | — | — | 2,983 | |||||||||||||
Net income |
— | — | — | 24,422 | 59 | 24,481 | |||||||||||||
Other comprehensive income |
— | — | 2,911 | — | 5 | 2,916 | |||||||||||||
| | | | | | | | | | | | | | | | | | | | |
Balances, December 31, 2016 |
17,600 | 262,511 | (1,479 | ) | 11,501 | 1,794 | 291,927 | ||||||||||||
Distributions—common stock |
|||||||||||||||||||
Cash—$1.74 per share |
— | — | — | (32,391 | ) | — | (32,391 | ) | |||||||||||
Shares issued through equity offering program—net |
231 | 5,339 | — | — | — | 5,570 | |||||||||||||
Restricted stock vesting |
232 | (232 | ) | — | — | — | — | ||||||||||||
Shares issued through dividend reinvestment plan |
198 | 4,336 | — | — | — | 4,534 | |||||||||||||
Contribution from non-controlling interest |
— | — | — | — | 20 | 20 | |||||||||||||
Distributions to non-controlling interests |
— | — | — | — | (181 | ) | (181 | ) | |||||||||||
Compensation expense—restricted stock |
— | 3,133 | — | — | — | 3,133 | |||||||||||||
Net income |
— | — | — | 24,147 | 102 | 24,249 | |||||||||||||
Other comprehensive income |
— | — | 1,634 | — | 7 | 1,641 | |||||||||||||
| | | | | | | | | | | | | | | | | | | | |
Balances, December 31, 2017 |
$ | 18,261 | $ | 275,087 | $ | 155 | $ | 3,257 | $ | 1,742 | $ | 298,502 | |||||||
| | | | | | | | | | | | | | | | | | | | |
| | | | | | | | | | | | | | | | | | | | |
| | | | | | | | | | | | | | | | | | | | |
See accompanying notes.
F-7
ONE LIBERTY PROPERTIES, INC. AND SUBSIDIARIES
Consolidated Statements of Cash Flows
(Amounts in Thousands)
| |
Year Ended December 31, | |||||||||
|---|---|---|---|---|---|---|---|---|---|---|
| |
2017 | 2016 | 2015 | |||||||
Cash flows from operating activities: |
||||||||||
Net income |
$ | 24,249 | $ | 24,481 | $ | 21,907 | ||||
Adjustments to reconcile net income to net cash provided by operating activities: |
||||||||||
Gain on sale of real estate, net |
(9,837 | ) | (10,087 | ) | (5,392 | ) | ||||
Purchase price fair value adjustment |
— | — | (960 | ) | ||||||
Gain on sale of available-for-sale securities |
— | (27 | ) | — | ||||||
Impairment loss |
153 | — | — | |||||||
Prepayment costs on debt |
— | 577 | 568 | |||||||
Increase in unbilled rent receivable |
(794 | ) | (2,286 | ) | (1,448 | ) | ||||
Write-off of unbilled rent receivable |
362 | 7 | 566 | |||||||
Bad debt expense |
291 | 98 | — | |||||||
Amortization and write-off of intangibles relating to leases, net |
(897 | ) | (712 | ) | (723 | ) | ||||
Amortization of restricted stock expense |
3,133 | 2,983 | 2,334 | |||||||
Equity in earnings of unconsolidated joint ventures |
(826 | ) | (1,005 | ) | (412 | ) | ||||
Distributions of earnings from unconsolidated joint ventures |
656 | 939 | 540 | |||||||
Depreciation and amortization |
20,993 | 18,164 | 16,384 | |||||||
Amortization and write-off of deferred financing costs |
977 | 904 | 1,023 | |||||||
Payment of leasing commissions |
(168 | ) | (1,050 | ) | (716 | ) | ||||
Decrease (increase) in escrow, deposits, other assets and receivables |
179 | (731 | ) | 197 | ||||||
Increase (decrease) in accrued expenses and other liabilities |
6,086 | (850 | ) | 616 | ||||||
| | | | | | | | | | | |
Net cash provided by operating activities |
44,557 | 31,405 | 34,484 | |||||||
| | | | | | | | | | | |
Cash flows from investing activities: |
||||||||||
Purchase of real estate |
(43,537 | ) | (118,589 | ) | (67,445 | ) | ||||
Improvements to real estate |
(6,565 | ) | (4,868 | ) | (3,868 | ) | ||||
Net proceeds from sale of real estate |
26,301 | 42,312 | 16,025 | |||||||
Purchase of partner's interest in consolidated joint venture |
— | (446 | ) | — | ||||||
Purchase of partner's interest in unconsolidated joint venture |
— | — | (6,300 | ) | ||||||
Investment in unconsolidated joint ventures |
— | — | (12,686 | ) | ||||||
Distributions of capital from unconsolidated joint ventures |
357 | 647 | 776 | |||||||
Net proceeds from sale of available-for-sale securities |
— | 33 | — | |||||||
| | | | | | | | | | | |
Net cash used in investing activities |
(23,444 | ) | (80,911 | ) | (73,498 | ) | ||||
| | | | | | | | | | | |
Cash flows from financing activities: |
||||||||||
Scheduled amortization payments of mortgages payable |
(10,520 | ) | (9,138 | ) | (7,793 | ) | ||||
Repayment of mortgages payable |
(12,936 | ) | (63,726 | ) | (27,967 | ) | ||||
Proceeds from mortgage financings |
21,210 | 137,628 | 79,605 | |||||||
Proceeds from sale of common stock, net |
5,570 | 25,787 | 6,457 | |||||||
Proceeds from bank line of credit |
47,000 | 86,000 | 45,400 | |||||||
Repayment on bank line of credit |
(47,600 | ) | (94,250 | ) | (40,400 | ) | ||||
Issuance of shares through dividend reinvestment plan |
4,534 | 3,107 | 4,284 | |||||||
Payment of financing costs |
(160 | ) | (2,220 | ) | (897 | ) | ||||
Prepayment costs on debt |
— | (577 | ) | (568 | ) | |||||
Capital contributions from non-controlling interests |
20 | 80 | 713 | |||||||
Distributions to non-controlling interests |
(181 | ) | (271 | ) | (1,829 | ) | ||||
Cash distributions to common stockholders |
(31,704 | ) | (28,230 | ) | (25,599 | ) | ||||
| | | | | | | | | | | |
Net cash (used in) provided by financing activities |
(24,767 | ) | 54,190 | 31,406 | ||||||
| | | | | | | | | | | |
Net (decrease) increase in cash and cash equivalents |
(3,654 | ) | 4,684 | (7,608 | ) | |||||
Cash and cash equivalents at beginning of year |
17,420 | 12,736 | 20,344 | |||||||
| | | | | | | | | | | |
Cash and cash equivalents at end of year |
$ | 13,766 | $ | 17,420 | $ | 12,736 | ||||
| | | | | | | | | | | |
| | | | | | | | | | | |
| | | | | | | | | | | |
See accompanying notes.
F-8
ONE LIBERTY PROPERTIES, INC. AND SUBSIDIARIES
Consolidated Statements of Cash Flows (Continued)
(Amounts in Thousands)
| |
Year Ended December 31, | |||||||||
|---|---|---|---|---|---|---|---|---|---|---|
| |
2017 | 2016 | 2015 | |||||||
Supplemental disclosures of cash flow information: |
||||||||||
Cash paid during the year for interest expense |
$ | 17,777 | $ | 17,310 | $ | 15,986 | ||||
Cash paid during the year for Federal excise tax, net |
— | 190 | 300 | |||||||
Supplemental schedule of non-cash investing and financing activities: |
||||||||||
Mortgage debt extinguished upon conveyance of the Company's Morrow, Georgia property to mortgagee by deed-in-lieu of foreclosure |
$ | — | $ | — | $ | 1,466 | ||||
Consolidation of real estate investment |
— | — | 2,633 | |||||||
Purchase accounting allocation—intangible lease assets |
4,009 | 8,194 | 5,776 | |||||||
Purchase accounting allocation—intangible lease liabilities |
(158 | ) | (6,288 | ) | (5,365 | ) | ||||
See accompanying notes.
F-9
ONE LIBERTY PROPERTIES, INC. AND SUBSIDIARIES
Notes to Consolidated Financial Statements
December 31, 2017
NOTE 1—ORGANIZATION AND BACKGROUND
One Liberty Properties, Inc. ("OLP") was incorporated in 1982 in Maryland. OLP is a self-administered and self-managed real estate investment trust ("REIT"). OLP acquires, owns and manages a geographically diversified portfolio of industrial, retail (including furniture stores and supermarkets), restaurant, health and fitness, and theater properties, many of which are subject to long-term net leases. As of December 31, 2017, OLP owns 119 properties, including six properties owned by consolidated joint ventures and five properties owned by unconsolidated joint ventures. The 119 properties are located in 30 states.
NOTE 2—SIGNIFICANT ACCOUNTING POLICIES
Principles of Consolidation
The consolidated financial statements include the accounts and operations of OLP, its wholly-owned subsidiaries, its joint ventures in which the Company, as defined, has a controlling interest, and variable interest entities ("VIEs") of which the Company is the primary beneficiary. OLP and its consolidated subsidiaries are hereinafter referred to as the "Company". Material intercompany items and transactions have been eliminated in consolidation.
Investment in Joint Ventures and Variable Interest Entities
The Financial Accounting Standards Board, or FASB, provides guidance for determining whether an entity is a VIE. VIEs are defined as entities in which equity investors do not have the characteristics of a controlling financial interest or do not have sufficient equity at risk for the entity to finance its activities without additional subordinated financial support. A VIE is required to be consolidated by its primary beneficiary, which is the party that (i) has the power to control the activities that most significantly impact the VIE's economic performance and (ii) has the obligation to absorb losses, or the right to receive benefits, of the VIE that could potentially be significant to the VIE.
The Company assesses the accounting treatment for each of its investments, including a review of each venture or limited liability company or partnership agreement, to determine the rights of each party and whether those rights are protective or participating. The agreements typically contain certain protective rights, such as the requirement of partner approval to sell, finance or refinance the property and to pay capital expenditures and operating expenditures outside of the approved budget or operating plan. In situations where, among other things, the Company and its partners jointly (i) approve the annual budget, (ii) approve certain expenditures, (iii) prepare or review and approve the joint venture's tax return before filing, and (iv) approve each lease at a property, the Company does not consolidate as the Company considers these to be substantive participation rights that result in shared, joint power over the activities that most significantly impact the performance of the joint venture or property. Additionally, the Company assesses the accounting treatment for any interests pursuant to which the Company may have a variable interest as a lessor. Leases may contain certain protective rights, such as the right of sale and the receipt of certain escrow deposits.
The Company accounts for its investments in unconsolidated joint ventures under the equity method of accounting. All investments in unconsolidated joint ventures have sufficient equity at risk to permit the entity to finance its activities without additional subordinated financial support and, as a group, the holders of the equity at risk have power through voting rights to direct the activities of these
F-10
ONE LIBERTY PROPERTIES, INC. AND SUBSIDIARIES
Notes to Consolidated Financial Statements (Continued)
December 31, 2017
NOTE 2—SIGNIFICANT ACCOUNTING POLICIES (Continued)
ventures. As a result, none of these joint ventures are VIEs. In addition, the Company shares power with its co-managing members over these entities, and therefore the entities are not consolidated. These investments are recorded initially at cost, as investments in unconsolidated joint ventures, and subsequently adjusted for their share of equity in earnings, cash contributions and distributions. None of the joint venture debt is recourse to the Company, subject to standard carve-outs.
The Company periodically reviews its investments in unconsolidated joint ventures for other-than-temporary losses in investment value. Any decline that is not expected to be recovered based on the underlying assets of the investment is considered other than temporary and an impairment charge is recorded as a reduction in the carrying value of the investment. During the three years ended December 31, 2017, there were no impairment charges related to the Company's investments in unconsolidated joint ventures.
The Company has elected to follow the cumulative earnings approach when assessing, for the consolidated statement of cash flows, whether the distribution from the investee is a return of the investor's investment as compared to a return on its investment. The source of the cash generated by the investee to fund the distribution is not a factor in the analysis (that is, it does not matter whether the cash was generated through investee refinancing, sale of assets or operating results). Consequently, the investor only considers the relationship between the cash received from the investee to its equity in the undistributed earnings of the investee, on a cumulative basis, in assessing whether the distribution from the investee is a return on or return of its investment. Cash received from the unconsolidated entity is presumed to be a return on the investment to the extent that, on a cumulative basis, distributions received by the investor are less than its share of the equity in the undistributed earnings of the entity.
Use of Estimates
The preparation of the consolidated financial statements in conformity with U.S. generally accepted accounting principles ("GAAP") requires management to make estimates and assumptions that affect the amounts reported in the consolidated financial statements and accompanying notes. Actual results could differ from those estimates.
Management believes that the estimates and assumptions that are most important to the portrayal of the Company's consolidated financial condition and results of operations, in that they require management's most difficult, subjective or complex judgments, form the basis of the accounting policies deemed to be most significant to the Company. These significant accounting policies relate to revenues and the value of the Company's real estate portfolio, including investments in unconsolidated joint ventures. Management believes its estimates and assumptions related to these significant accounting policies are appropriate under the circumstances; however, should future events or occurrences result in unanticipated consequences, there could be a material impact on the Company's future consolidated financial condition or results of operations.
Revenue Recognition
Rental income includes the base rent that each tenant is required to pay in accordance with the terms of their respective leases reported on a straight-line basis over the non-cancelable term of the
F-11
ONE LIBERTY PROPERTIES, INC. AND SUBSIDIARIES
Notes to Consolidated Financial Statements (Continued)
December 31, 2017
NOTE 2—SIGNIFICANT ACCOUNTING POLICIES (Continued)
lease. In determining, in its judgment, that the unbilled rent receivable applicable to each specific property is collectible, management reviews unbilled rent receivables on a quarterly basis and takes into consideration the tenant's payment history and financial condition. Some of the leases provide for increases based on the Consumer Price Index and for additional contingent rental revenue in the form of percentage rents. The percentage rents are based upon the level of sales achieved by the lessee and are recognized once the required sales levels are reached. Certain ground leases provide for rent which can be deferred and paid based on the operating performance of the property; therefore, this rent is recognized as rental income when the operating performance is achieved and the rent is received.
Many of the Company's properties are subject to long-term net leases under which the tenant is typically responsible to pay directly to the vendor the real estate taxes, insurance, utilities and ordinary maintenance and repairs related to the property, and the Company is not the primary obligor with respect to such items. As a result, the revenue and expenses relating to these properties are recorded on a net basis. For certain properties, in addition to contractual base rent, the tenants pay their pro rata share of real estate taxes and operating expenses to the Company. The income and expenses associated with these properties are generally recorded on a gross basis when the Company is the primary obligor. During 2017, 2016 and 2015, the Company recorded reimbursements of expenses of $7,672,000, $6,424,000 and $3,852,000, respectively, which are reported as Tenant reimbursements in the accompanying consolidated statements of income.
Gains and losses on the sale of real estate investments are recorded when the criteria under GAAP have been met.
Fair Value Measurements
The Company measures the fair value of financial instruments based on the assumptions that market participants would use in pricing the asset or liability. Fair value is defined as the price that would be received to sell an asset or paid to transfer a liability in an orderly transaction between market participants at the measurement date (exit price). As a basis for considering market participant assumptions in fair value measurements, a fair value hierarchy distinguishes between market participant assumptions based on market data obtained from sources independent of the reporting entity and the reporting entity's own assumptions about market participant assumptions. In accordance with the fair value hierarchy, Level 1 assets/liabilities are valued based on quoted prices for identical instruments in active markets, Level 2 assets/liabilities are valued based on quoted prices in active markets for similar instruments, on quoted prices in less active or inactive markets, or on other "observable" market inputs and Level 3 assets/liabilities are valued based on significant "unobservable" market inputs.
Purchase Accounting for Acquisition of Real Estate
In January 2017, the Company adopted ASU No. 2017-01, Business Combinations (Topic 805): Clarifying the Definition of a Business, which requires an entity to evaluate whether substantially all of the fair value of the gross assets acquired is concentrated in a single identifiable asset or a group of similar identifiable assets, and if that requirement is met, the asset group is accounted for as an asset acquisition and not a business combination. Transaction costs incurred with such asset acquisitions are capitalized to real estate assets and depreciated over the respectful useful lives. The Company analyzed the real estate acquisitions made during 2017 and determined the gross assets acquired are
F-12
ONE LIBERTY PROPERTIES, INC. AND SUBSIDIARIES
Notes to Consolidated Financial Statements (Continued)
December 31, 2017
NOTE 2—SIGNIFICANT ACCOUNTING POLICIES (Continued)
concentrated in a single identifiable asset. Prior to January 1, 2017, the Company recorded acquired real estate investments as business combinations when the real estate was occupied, at least in part, at acquisition. Costs directly related to the acquisition of such investments were expensed as incurred.
The Company allocates the purchase price of real estate among land, building, improvements and intangibles, such as the value of above, below and at-market leases, and origination costs associated with in-place leases at the acquisition date. The Company assesses the fair value of the tangible assets of an acquired property by valuing the property as if it were vacant. The value, as determined, is allocated to land, building and improvements based on management's determination of the relative fair values of these assets.
The Company assesses the fair value of the lease intangibles based on estimated cash flow projections that utilize appropriate discount rates and available market information. Such inputs are Level 3 in the fair value hierarchy. In valuing an acquired property's intangibles, factors considered by management include an estimate of carrying costs during the expected lease-up periods, such as real estate taxes, insurance, other operating expenses, and estimates of lost rental revenue during the expected lease-up periods based on its evaluation of current market demand. Management also estimates costs to execute similar leases, including leasing commissions and tenant improvements.
The values of acquired above-market and below-market leases are recorded based on the present values (using discount rates which reflect the risks associated with the leases acquired) of the difference between the contractual amounts to be received and management's estimate of market lease rates, measured over the terms of the respective leases that management deemed appropriate at the time of the acquisitions. Such valuations include a consideration of the non-cancellable terms of the respective leases, as well as any applicable renewal period(s). The fair values associated with below-market rental renewal options are determined based on the Company's experience and the relevant facts and circumstances at the time of the acquisitions. The values of above-market leases are amortized as a reduction to rental income over the terms of the respective non-cancellable lease periods. The portion of the values of below-market leases are amortized as an increase to rental income over the terms of the respective non-cancellable lease periods. The portion of the values of the leases associated with below-market renewal options that management deemed are likely to be exercised by the tenant are amortized to rental income over such renewal periods. The value of other intangible assets (i.e., origination costs) is recorded to amortization expense over the remaining terms of the respective leases. If a lease were to be terminated prior to its contractual expiration date or not renewed, all unamortized amounts relating to that lease would be recognized in operations at that time. The estimated useful lives of intangible assets or liabilities generally range from one to 38 years.
Accounting for Long-Lived Assets and Impairment of Real Estate Owned
The Company reviews its real estate portfolio on a quarterly basis to ascertain if there are any indicators of impairment to the value of any of its real estate assets, including deferred costs and intangibles, to determine if there is any need for an impairment charge. In reviewing the portfolio, the Company examines one or more of the following: the type of asset, the current financial statements or other available financial information of the tenant, the economic situation in the area in which the asset is located, the economic situation in the industry in which the tenant is involved, the timeliness of the payments made by the tenant under its lease, and any current communication with the tenant,
F-13
ONE LIBERTY PROPERTIES, INC. AND SUBSIDIARIES
Notes to Consolidated Financial Statements (Continued)
December 31, 2017
NOTE 2—SIGNIFICANT ACCOUNTING POLICIES (Continued)
including property inspection reports. For each real estate asset owned for which indicators of impairment exist, management performs a recoverability test by comparing the sum of the estimated undiscounted future cash flows attributable to the asset to its carrying amount. If the aggregate undiscounted cash flows are less than the asset's carrying amount, an impairment loss is recorded to the extent that the estimated fair value is less than the asset's carrying amount. The estimated fair value is determined using a discounted cash flow model of the expected future cash flows through the useful life of the property. The analysis includes an estimate of the future cash flows that are expected to result from the real estate investment's use and eventual disposition. These cash flows consider factors such as expected future operating income, trends and prospects, the effects of leasing demand, competition and other factors.
Properties Held-for-Sale
Real estate investments are classified as properties held-for-sale when management determines that the investment meets the applicable criteria. Real estate assets that are classified as held-for-sale are: (i) valued at the lower of carrying amount or the estimated fair value less costs to sell on an individual asset basis; and (ii) not depreciated.
Cash and Cash Equivalents
All highly liquid investments with original maturities of three months or less when purchased are considered to be cash equivalents.
Escrows
Real estate taxes, insurance and other escrows aggregating $460,000 and $387,000 at December 31, 2017 and 2016, respectively, are included in Escrow, deposits and other assets and receivables.
Depreciation and Amortization
Depreciation of buildings is computed on the straight-line method over an estimated useful life of 40 years. Depreciation of building improvements is computed on the straight-line method over the estimated useful life of the improvements. If the Company determines it is the owner of tenant improvements, the amounts funded to construct the tenant improvements are treated as a capital asset and depreciated over the lesser of the remaining lease term or the estimated useful life of the improvements on the straight-line method. Leasehold interest and the related ground lease payments are amortized over the initial lease term of the leasehold position. Depreciation expense (including amortization of a leasehold position, lease origination costs, and capitalized leasing commissions) was $20,993,000, $18,164,000 and $16,384,000 during 2017, 2016 and 2015, respectively.
Deferred Financing Costs
Mortgage and credit line costs are deferred and amortized on a straight-line basis over the terms of the respective debt obligations, which approximates the effective interest method. At December 31, 2017 and 2016, accumulated amortization of such costs was $2,804,000 and $2,090,000, respectively. The
F-14
ONE LIBERTY PROPERTIES, INC. AND SUBSIDIARIES
Notes to Consolidated Financial Statements (Continued)
December 31, 2017
NOTE 2—SIGNIFICANT ACCOUNTING POLICIES (Continued)
Company presents unamortized deferred financing costs as a direct deduction from the carrying amount of the associated debt liability.
Income Taxes
The Company is qualified as a real estate investment trust under the applicable provisions of the Internal Revenue Code. Under these provisions, the Company will not be subject to Federal, and generally, state and local income taxes, on amounts distributed to stockholders, provided it distributes at least 90% of its taxable income and meets certain other conditions.
The Company follows a two-step approach for evaluating uncertain tax positions. Recognition (step one) occurs when an enterprise concludes that a tax position, based solely on its technical merits, is more-likely-than-not to be sustained upon examination. Measurement (step two) determines the amount of benefit that more-likely-than-not will be realized upon settlement. Derecognition of a tax position that was previously recognized would occur when a company subsequently determines that a tax position no longer meets the more-likely-than-not threshold of being sustained. The use of a valuation allowance as a substitute for derecognition of tax positions is prohibited. The Company has not identified any uncertain tax positions requiring accrual.
Concentration of Credit Risk
The Company maintains cash accounts at various financial institutions. While the Company attempts to limit any financial exposure, substantially all of its deposit balances exceed federally insured limits. The Company has not experienced any losses on such accounts.
The Company's properties are located in 30 states. During 2017, 2016 and 2015, 13.2%, 12.9% and 13.0% of total revenues, respectively, were attributable to real estate investments located in Texas which is the only state in which real estate investments contributed more than 10% to the Company's total revenues.
No tenant contributed over 10% to the Company's total revenues during 2017, 2016 and 2015.
Segment Reporting
Substantially all of the Company's real estate assets, at acquisition, are comprised of real estate owned that is leased to tenants on a long-term basis. Therefore, the Company aggregates real estate assets for reporting purposes and operates in one reportable segment.
Stock Based Compensation
The fair value of restricted stock grants and restricted stock units, determined as of the date of grant, is amortized into general and administrative expense over the respective vesting period. The deferred compensation to be recognized as expense is net of certain forfeiture and performance assumptions which are re-evaluated quarterly. The Company recognizes the effect of forfeitures when they occur and previously recognized compensation expense shall be reversed in the period the grant or unit is forfeited. For share-based awards with a performance or market measure, we recognize compensation expense over the requisite service period. The requisite service period begins on the date the compensation committee of the Company's Board of Directors authorizes the award, adopts any relevant performance measures and communicates the award.
F-15
ONE LIBERTY PROPERTIES, INC. AND SUBSIDIARIES
Notes to Consolidated Financial Statements (Continued)
December 31, 2017
NOTE 2—SIGNIFICANT ACCOUNTING POLICIES (Continued)
Derivatives and Hedging Activities
The Company's objective in using interest rate swaps is to add stability to interest expense. The Company does not use derivatives for trading or speculative purposes.
The Company records all derivatives on the consolidated balance sheets at fair value using widely accepted valuation techniques including discounted cash flow analysis on the expected cash flows of the derivatives. In addition, the Company incorporates credit valuation adjustments to appropriately reflect both its own nonperformance risk and the respective counterparty's nonperformance risk in the fair value measurements. These counterparties are generally large financial institutions engaged in providing a variety of financial services. These institutions generally face similar risks regarding adverse changes in market and economic conditions including, but not limited to, fluctuations in interest rates, exchange rates, equity and commodity prices and credit spreads.
The accounting for changes in the fair value of derivatives depends on the intended use of the derivative, whether the Company has elected to designate a derivative in a hedging relationship and apply hedge accounting and whether the hedging relationship has satisfied the criteria necessary to apply hedge accounting. Derivatives designated and qualifying as a hedge of the exposure to variability in expected future cash flows are considered cash flow hedges. For derivatives designated as cash flow hedges, the effective portion of changes in the fair value of the derivative is initially reported in accumulated other comprehensive income (outside of earnings) and subsequently reclassified to earnings in the period in which the hedged transaction becomes ineffective. For derivatives not designated as cash flow hedges, changes in the fair value of the derivative are recognized directly in earnings in the period in which the change occurs; however, the Company's policy is to not enter into such transactions.
Allowance for Doubtful Accounts
The Company maintains an allowance for doubtful accounts for estimated losses resulting from the inability of a tenant to make required rent and other payments. If the financial condition of a specific tenant were to deteriorate, adversely impacting its ability to make payments, additional allowances may be required.
Reclassifications
Certain amounts previously reported in the consolidated financial statements have been reclassified in the accompanying consolidated financial statements to conform to the current year's presentation. Such reclassifications primarily relate to change the presentation of Gain on sale of real estate, net on the consolidated statement of operations for the years ended December 31, 2016 and 2015. The Company has included a caption for Income before gain on sale of real estate, net, to present gains and losses on sales of properties in accordance with the Securities and Exchange Commission Rule 3-15(a) of Regulation S-X. The change was made for the years ended December 31, 2016 and 2015 because, as prescribed by ASC 360-10-45-5, such gains from sale of real estate were not included as a component of Operating income. Such change was determined to be immaterial to the consolidated financial statements.
F-16
ONE LIBERTY PROPERTIES, INC. AND SUBSIDIARIES
Notes to Consolidated Financial Statements (Continued)
December 31, 2017
NOTE 2—SIGNIFICANT ACCOUNTING POLICIES (Continued)
New Accounting Pronouncements
In August 2017, the FASB issued ASU No. 2017-12, Derivatives and Hedging (Topic 815): Targeted Improvements to Accounting for Hedging Activities, which amends the presentation and disclosure requirements for hedge accounting and changes how companies assess hedge effectiveness. This ASU is intended to more closely align hedge accounting with companies' risk management strategies, simplify the application of hedge accounting, and increase transparency as to the scope and results of hedging programs. The effective date of the standard will be fiscal years, and interim periods within those fiscal years, beginning after December 15, 2018, and early adoption is permitted. The Company is evaluating the new guidance to determine if, and to the extent, it will impact the consolidated financial statements.
In February 2017, the FASB issued ASU No. 2017-05, Other Income—Gains and Losses from the Derecognition of Nonfinancial Assets (Subtopic 610-20): Clarifying the Scope of Asset Derecognition Guidance and Accounting for Partial Sales of Nonfinancial Assets, which clarifies the scope and application on the sale or transfer of nonfinancial assets and in substance nonfinancial assets to noncustomers, including partial sales. The effective date of the standard will be fiscal years, and interim periods within those fiscal years, beginning after December 15, 2017, and early adoption is permitted. The Company has evaluated the new guidance and determined there will be no impact on the consolidated financial statements as the Company will be electing the practical expedient which is forward-looking to future sales. In addition, none of the Company's prior sales were partial sales and all were under closed contracts.
In November 2016, the FASB issued ASU No. 2016-18, Statement of Cash Flows (Topic 230): Restricted Cash (a consensus of the Emerging Issues Task Force), which requires that a statement of cash flows explain the change during the period in the total of cash, cash equivalents, and amount generally described as restricted cash or restricted cash equivalents. Therefore, amounts generally described as restricted cash and restricted cash equivalents should be included with cash and cash equivalents when reconciling the beginning-of-period and end-of-period total amounts shown on the statement of cash flows. The effective date of the standard will be fiscal years, and interim periods within those fiscal years, beginning after December 15, 2017, and early adoption is permitted. The Company is evaluating the new guidance to determine if, and to the extent, it will impact the consolidated financial statements.
In June 2016, the FASB issued ASU No. 2016-13, Financial Instruments—Credit Losses (Topic 326): Measurement of Credit Losses on Financial Instruments, which changes how entities will measure credit losses for most financial assets and certain other instruments that are not measured at fair value through net income. The guidance replaces the current "incurred loss" model with an "expected loss" approach. The guidance is effective for fiscal years beginning after December 15, 2019, including interim periods within those fiscal years. Early adoption is permitted after December 2018. The Company is evaluating the new guidance to determine if, and to the extent, it will impact the consolidated financial statements.
In February 2016, the FASB issued ASU No. 2016-02, Leases, which amends the existing accounting standards for lease accounting, including requiring lessees to recognize most leases on their balance sheets and making targeted changes to lessor accounting. The effective date of the standard
F-17
ONE LIBERTY PROPERTIES, INC. AND SUBSIDIARIES
Notes to Consolidated Financial Statements (Continued)
December 31, 2017
NOTE 2—SIGNIFICANT ACCOUNTING POLICIES (Continued)
will be fiscal years, and interim periods within those fiscal years, beginning after December 15, 2018, and early adoption is permitted. The new leases standard requires a modified retrospective transition approach for all leases existing at, or entered into after, the date of initial application, with an option to use certain transition relief. The Company is currently evaluating this new standard. The Company anticipates adopting this guidance effective as of January 1, 2019 and will apply the modified retrospective approach.
In May 2014, the FASB issued ASU 2014-09, Revenue from Contracts with Customers (Topic 606), which outlines a new, single comprehensive model for entities to use in accounting for revenue arising from contracts with customers and supersedes most current revenue recognition guidance, including industry-specific guidance. The new model will require revenue recognition to depict the transfer of promised goods or services to customers in an amount that reflects the consideration a company expects to receive in exchange for those goods or services. The standard can be applied either retrospectively to each period presented or as a cumulative-effect adjustment as of the date of adoption. In July 2015, the FASB issued ASU 2015-14, Revenue from Contracts with Customers (Topic 606): Deferral of the Effective Date, which delays the effective date of ASU 2014-09 by one year. In March 2016, the FASB issued ASU 2016-08, Revenue from Contracts with Customers (Topic 606): Principal versus Agent Considerations (Reporting Revenue Gross versus Net), which is intended to improve the operability and understandability of the implementation guidance on principal versus agent considerations. ASU 2014-09, ASU 2015-14 and ASU 2016-08 are herein collectively referred to as the "New Revenue Recognition Standards".
The New Revenue Recognition Standards are effective for fiscal years, and interim periods within those fiscal years, beginning after December 15, 2017. Early adoption is permitted but not before annual periods beginning after December 15, 2016. The Company anticipates adopting the New Revenue Recognition Standards effective as of January 1, 2018, and applying the cumulative-effect adoption method. The Company has evaluated its revenue streams, and as they are primarily related to leasing activities which are scoped out of the New Revenue Recognition Standards, it has determined that the adoption of such standards will not have a material impact on the consolidated financial statements and there will be no cumulative translation adjustments upon adoption.
F-18
ONE LIBERTY PROPERTIES, INC. AND SUBSIDIARIES
Notes to Consolidated Financial Statements (Continued)
December 31, 2017
NOTE 3—EARNINGS PER COMMON SHARE
Basic earnings per share was determined by dividing net income allocable to common stockholders for each year by the weighted average number of shares of common stock outstanding during the applicable year. Net income is also allocated to the unvested restricted stock outstanding during each year, as the restricted stock is entitled to receive dividends and is therefore considered a participating security. Unvested restricted stock is not allocated net losses; such amounts are allocated entirely to the common stockholders, other than the holders of unvested restricted stock. As of December 31, 2017, the shares of common stock underlying the restricted stock units awarded under the 2016 Incentive Plan are excluded from the basic earnings per share calculation, as these units are not participating securities. The restricted stock units issued pursuant to the 2009 and 2016 Incentive Plans are referred to as "RSUs".
Diluted earnings per share reflects the potential dilution that could occur if securities or other rights exercisable for, or convertible into, common stock were exercised or converted or otherwise resulted in the issuance of common stock that shared in the earnings of the Company.
See Note 13 for information regarding the Company's equity incentive plans.
The diluted weighted average number of shares of common stock includes common stock underlying the RSUs awarded under the plans identified in the table below:
| |
|
Year Ended December 31, | |||||||||||
|---|---|---|---|---|---|---|---|---|---|---|---|---|---|
| |
Number of underlying shares |
||||||||||||
| |
2017 | 2016 | 2015 | ||||||||||
2009 Incentive Plan |
200,000 | — | (a) | 114,000 | 108,000 | ||||||||
2016 Incentive Plan |
76,250 | 71,478 | (b) | — | — | ||||||||
- (a)
- RSUs
with respect to 113,584 shares vested on June 30, 2017 and such shares were issued in August 2017.
- (b)
- Includes 33,353 shares that would be issued pursuant to a return on capital performance metric and 38,125 shares that would be issued pursuant to a stockholder return metric, assuming the end of the quarterly period was the June 30, 2020 vesting date. The remaining 4,772 shares awarded pursuant to the capital performance metric (of a total of 38,125 that were awarded on September 26, 2017) are not included.
There were no options outstanding to purchase shares of common stock or other rights exercisable for, or convertible into, common stock in 2017, 2016 and 2015.
F-19
ONE LIBERTY PROPERTIES, INC. AND SUBSIDIARIES
Notes to Consolidated Financial Statements (Continued)
December 31, 2017
NOTE 3—EARNINGS PER COMMON SHARE (Continued)
The following table provides a reconciliation of the numerator and denominator of earnings per share calculations (amounts in thousands, except per share amounts):
| |
Year Ended December 31, | |||||||||
|---|---|---|---|---|---|---|---|---|---|---|
| |
2017 | 2016 | 2015 | |||||||
Numerator for basic and diluted earnings per share: |
||||||||||
Net income |
$ | 24,249 | $ | 24,481 | $ | 21,907 | ||||
Less net income attributable to non-controlling interests |
(102 | ) | (59 | ) | (1,390 | ) | ||||
Less earnings allocated to unvested restricted stock(a) |
(1,072 | ) | (999 | ) | (852 | ) | ||||
| | | | | | | | | | | |
Net income available for common stockholders: basic and diluted |
$ | 23,075 | $ | 23,423 | $ | 19,665 | ||||
| | | | | | | | | | | |
| | | | | | | | | | | |
| | | | | | | | | | | |
Denominator for basic earnings per share: |
||||||||||
Weighted average number of common shares |
17,944 | 16,768 | 15,971 | |||||||
Effect of diluted securities: |
||||||||||
RSUs |
103 | 114 | 108 | |||||||
| | | | | | | | | | | |
Denominator for diluted earnings per share: |
||||||||||
Weighted average number of shares |
18,047 | 16,882 | 16,079 | |||||||
| | | | | | | | | | | |
| | | | | | | | | | | |
| | | | | | | | | | | |
Earnings per common share, basic |
$ | 1.29 | $ | 1.40 | $ | 1.23 | ||||
| | | | | | | | | | | |
| | | | | | | | | | | |
| | | | | | | | | | | |
Earnings per common share, diluted |
$ | 1.28 | $ | 1.39 | $ | 1.22 | ||||
| | | | | | | | | | | |
| | | | | | | | | | | |
| | | | | | | | | | | |
Net income attributable to One Liberty Properties, Inc. common stockholders, net of non-controlling interests |
$ | 24,147 | $ | 24,422 | $ | 20,517 | ||||
| | | | | | | | | | | |
| | | | | | | | | | | |
| | | | | | | | | | | |
- (a)
- Represents an allocation of distributed earnings to unvested restricted stock which, as participating securities, are entitled to receive dividends.
NOTE 4—REAL ESTATE INVESTMENTS AND MINIMUM FUTURE RENTALS
Real Estate Acquisitions
The following charts detail the Company's acquisitions of real estate during 2017 and 2016 (amounts in thousands):
Description of Property
|
Date Acquired |
Contract Purchase Price |
Terms of Payment |
Third Party Real Estate Acquisition Costs(a) |
|||||||
|---|---|---|---|---|---|---|---|---|---|---|---|
Forbo industrial facility, |
May 25, 2017 | $ | 8,700 | Cash and $5,190 mortgage(b) | $ | 72 | |||||
Saddle Creek Logistics industrial facility, |
June 9, 2017 | 11,750 | All cash(c) | 199 | |||||||
Corporate Woods industrial facility, |
June 20, 2017 | 14,700 | All cash(d) | 29 | |||||||
Dufresne Spencer Group industrial facility, |
October 10, 2017 | 8,000 | All cash | 87 | |||||||
| | | | | | | | | | | | |
Totals for 2017 |
$ | 43,150 | $ | 387 | |||||||
| | | | | | | | | | | | |
| | | | | | | | | | | | |
| | | | | | | | | | | | |
F-20
ONE LIBERTY PROPERTIES, INC. AND SUBSIDIARIES
Notes to Consolidated Financial Statements (Continued)
December 31, 2017
NOTE 4—REAL ESTATE INVESTMENTS AND MINIMUM FUTURE RENTALS (Continued)
Description of Property
|
Date Acquired |
Contract Purchase Price |
Terms of Payment |
Third Party Real Estate Acquisition Costs(e) |
|||||||
|---|---|---|---|---|---|---|---|---|---|---|---|
Multi-tenant industrial facility, |
March 30, 2016 | $ | 8,100 | All cash | $ | 80 | |||||
Multi-tenant industrial facility, |
March 30, 2016 | 8,950 | All cash | 81 | |||||||
Toro distribution facility, |
June 3, 2016 | 23,695 | All cash | 72 | |||||||
4 Advanced Auto retail stores, |
June 16, 2016 | 6,523 | Cash and $4,300 mortgage(b) | 80 | |||||||
Land—The Briarbrook Village Apartments, |
August 2, 2016 | 10,530 | All cash | — | (f) | ||||||
Burlington Coat and Micro Center retail stores, |
August 12, 2016 | 14,150 | All cash | 74 | |||||||
Land—The Vue Apartments, |
August 16, 2016 | 13,896 | All cash | — | (g) | ||||||
Famous Footwear distribution facility, |
September 1, 2016 | 32,734 | Cash and $21,288 mortgage(b) | 195 | |||||||
Other costs(h) |
— | 14 | |||||||||
| | | | | | | | | | | | |
Totals for 2016 |
$ | 118,578 | $ | 596 | |||||||
| | | | | | | | | | | | |
| | | | | | | | | | | | |
| | | | | | | | | | | | |
- (a)
- Transaction
costs incurred with these asset acquisitions were capitalized.
- (b)
- The
new mortgage debt was obtained simultaneously with the acquisition of the property.
- (c)
- In
August 2017, the Company obtained new mortgage debt of $7,200.
- (d)
- In
July 2017, the Company obtained new mortgage debt of $8,820.
- (e)
- Included
as an expense in Real estate acquisition costs in the accompanying consolidated statement of income.
- (f)
- Transaction
costs aggregating $6 incurred with this asset acquisition were capitalized.
- (g)
- Transaction
costs aggregating $5 incurred with this asset acquisition were capitalized.
- (h)
- Costs incurred for properties purchased in the previous year.
F-21
ONE LIBERTY PROPERTIES, INC. AND SUBSIDIARIES
Notes to Consolidated Financial Statements (Continued)
December 31, 2017
NOTE 4—REAL ESTATE INVESTMENTS AND MINIMUM FUTURE RENTALS (Continued)
The following charts detail the allocation of the purchase price for the Company's acquisitions of real estate during 2017 and 2016 (amounts in thousands):
| |
|
|
|
Intangible Lease | |
||||||||||||||
|---|---|---|---|---|---|---|---|---|---|---|---|---|---|---|---|---|---|---|---|
| |
|
|
Building Improvements |
|
|||||||||||||||
Description of Property
|
Land | Building | Asset | Liability | Total | ||||||||||||||
Forbo industrial facility, |
|||||||||||||||||||
Huntersville, North Carolina |
$ | 1,046 | $ | 6,452 | $ | 222 | $ | 1,052 | $ | — | $ | 8,772 | |||||||
Saddle Creek Logistics industrial facility, |
|||||||||||||||||||
Pittston, Pennsylvania |
999 | 9,675 | 247 | 1,028 | — | 11,949 | |||||||||||||
Corporate Woods industrial facility, |
|||||||||||||||||||
Ankeny, Iowa |
1,351 | 11,420 | 187 | 1,929 | (158 | ) | 14,729 | ||||||||||||
Dufresne Spencer Group industrial facility, |
|||||||||||||||||||
Memphis, Tennessee |
135 | 7,750 | 202 | — | — | 8,087 | |||||||||||||
| | | | | | | | | | | | | | | | | | | | |
Totals for 2017 |
$ | 3,531 | $ | 35,297 | $ | 858 | $ | 4,009 | $ | (158 | ) | $ | 43,537 | ||||||
| | | | | | | | | | | | | | | | | | | | |
| | | | | | | | | | | | | | | | | | | | |
| | | | | | | | | | | | | | | | | | | | |
Multi-tenant industrial facility, |
|||||||||||||||||||
Greenville, South Carolina |
$ | 693 | $ | 6,718 | $ | 175 | $ | 514 | $ | — | $ | 8,100 | |||||||
Multi-tenant industrial facility, |
|||||||||||||||||||
Greenville, South Carolina |
528 | 7,893 | 181 | 441 | (93 | ) | 8,950 | ||||||||||||
Toro distribution facility, |
|||||||||||||||||||
El Paso, Texas |
3,691 | 17,525 | 379 | 2,100 | — | 23,695 | |||||||||||||
4 Advanced Auto retail stores, |
|||||||||||||||||||
Ohio |
653 | 5,012 | 189 | 912 | (243 | ) | 6,523 | ||||||||||||
Land—The Briarbrook Village Apartments, |
|||||||||||||||||||
Wheaton, Illinois |
10,536 | — | — | — | — | 10,536 | |||||||||||||
Burlington Coat and Micro Center retail stores, |
|||||||||||||||||||
St. Louis Park, Minnesota |
3,388 | 12,632 | 456 | 651 | (2,977 | ) | 14,150 | ||||||||||||
Land—The Vue Apartments, |
|||||||||||||||||||
Beachwood, Ohio |
13,901 | — | — | — | — | 13,901 | |||||||||||||
Famous Footwear distribution facility, |
|||||||||||||||||||
Lebanon, Tennessee |
2,094 | 29,436 | 603 | 3,576 | (2,975 | ) | 32,734 | ||||||||||||
| | | | | | | | | | | | | | | | | | | | |
Totals for 2016 |
$ | 35,484 | $ | 79,216 | $ | 1,983 | $ | 8,194 | $ | (6,288 | ) | $ | 118,589 | ||||||
| | | | | | | | | | | | | | | | | | | | |
| | | | | | | | | | | | | | | | | | | | |
| | | | | | | | | | | | | | | | | | | | |
As of December 31, 2017, the weighted average amortization period for the 2017 acquisitions is 6.8 years and 12.2 years for the intangible lease assets and intangible lease liabilities, respectively. As of December 31, 2016, the weighted average amortization period for the 2016 acquisitions is 9.3 years and 13.0 years for the intangible lease assets and intangible lease liabilities, respectively. The Company assessed the fair value of the lease intangibles based on estimated cash flow projections that utilize appropriate discount rates and available market information. Such inputs are Level 3 (as defined in Note 2) in the fair value hierarchy.
At December 31, 2017 and 2016, accumulated amortization of intangible lease assets was $17,542,000 and $16,074,000, respectively, and accumulated amortization of intangible lease liabilities was $7,849,000 and $6,386,000, respectively.
F-22
ONE LIBERTY PROPERTIES, INC. AND SUBSIDIARIES
Notes to Consolidated Financial Statements (Continued)
December 31, 2017
NOTE 4—REAL ESTATE INVESTMENTS AND MINIMUM FUTURE RENTALS (Continued)
During 2017, 2016 and 2015, the Company recognized net rental income of $897,000, $712,000 and $723,000, respectively, for the amortization of the above/below market leases. During 2017, 2016 and 2015, the Company recognized amortization expense of $4,984,000, $3,612,000 and $3,467,000, respectively, relating to the amortization of the origination costs associated with in-place leases, which is included in Depreciation and amortization expense.
The unamortized balance of intangible lease assets as a result of acquired above market leases at December 31, 2017 will be deducted from rental income through 2032 as follows (amounts in thousands):
2018 |
$ | 748 | ||
2019 |
646 | |||
2020 |
620 | |||
2021 |
614 | |||
2022 |
448 | |||
Thereafter |
1,217 | |||
| | | | | |
Total |
$ | 4,293 | ||
| | | | | |
| | | | | |
| | | | | |
The unamortized balance of intangible lease liabilities as a result of acquired below market leases at December 31, 2017 will be added to rental income through 2055 as follows (amounts in thousands):
2018 |
$ | 1,794 | ||
2019 |
1,781 | |||
2020 |
1,629 | |||
2021 |
1,593 | |||
2022 |
1,468 | |||
Thereafter |
9,286 | |||
| | | | | |
Total |
$ | 17,551 | ||
| | | | | |
| | | | | |
| | | | | |
The unamortized balance of origination costs associated with in-place leases at December 31, 2017 will be charged to amortization expense through 2055 as follows (amounts in thousands):
2018 |
$ | 4,056 | ||
2019 |
3,669 | |||
2020 |
3,435 | |||
2021 |
3,168 | |||
2022 |
2,672 | |||
Thereafter |
9,232 | |||
| | | | | |
Total |
$ | 26,232 | ||
| | | | | |
| | | | | |
| | | | | |
F-23
ONE LIBERTY PROPERTIES, INC. AND SUBSIDIARIES
Notes to Consolidated Financial Statements (Continued)
December 31, 2017
NOTE 4—REAL ESTATE INVESTMENTS AND MINIMUM FUTURE RENTALS (Continued)
Minimum Future Rents
The rental properties owned at December 31, 2017 are leased under operating leases with current expirations ranging from 2018 to 2037, with certain tenant renewal rights.
The minimum future contractual rents do not include (i) straight-line rent or amortization of intangibles and (ii) rental income which can be deferred under the Company's ground leases on the basis of the respective property's operating performance. Such rents were $3,623,000, $2,379,000 and $1,458,000 during 2017, 2016 and 2015, respectively.
The minimum future contractual rents to be received over the next five years and thereafter on non-cancellable operating leases in effect at December 31, 2017 are as follows (amounts in thousands):
2018 |
$ | 64,412 | ||
2019 |
62,360 | |||
2020 |
60,035 | |||
2021 |
56,965 | |||
2022 |
47,434 | |||
Thereafter |
176,838 | |||
| | | | | |
Total |
$ | 468,044 | ||
| | | | | |
| | | | | |
| | | | | |
Unbilled Rent Receivable
At December 31, 2017 and 2016, the Company's unbilled rent receivables aggregating $14,125,000 and $13,797,000, respectively, represent rent reported on a straight-line basis in excess of rental payments required under the respective leases. The unbilled rent receivable is to be billed and received pursuant to the lease terms during the next 24 years.
During 2017 and 2016, the Company wrote off $105,000 and $2,060,000, respectively, of unbilled straight-line rent receivable related to the properties sold during such years, which reduced the gain on sale reported on the consolidated statements of income.
During 2017, 2016 and 2015, the Company also wrote off $362,000, $7,000 and $89,000, respectively, of unbilled straight-line rent receivable related to properties at which the tenant filed for Chapter 11 bankruptcy.
During 2015, the Company wrote off unbilled straight-line rent receivables of $477,000 related to lease terminations effected prior to lease expirations (see below).
F-24
ONE LIBERTY PROPERTIES, INC. AND SUBSIDIARIES
Notes to Consolidated Financial Statements (Continued)
December 31, 2017
NOTE 4—REAL ESTATE INVESTMENTS AND MINIMUM FUTURE RENTALS (Continued)
Lease Termination Fees
In 2015, the Company received lease termination fees of $2,886,000 from tenants in lease buy-out transactions. In connection with the receipt of these fees, the Company wrote off an aggregate of $530,000 as offsets to rental income, representing the entire balance of the unbilled rent receivables and the intangible lease assets related to these tenants as of December 31, 2015. The Company re-leased substantially all of such spaces simultaneously with the termination of the leases.
Purchase of Partner's 50% Interest
In March 2015, the Company purchased for $6,300,000, its partner's 50% interest in an unconsolidated joint venture that owned a property in Lincoln, Nebraska, and as a result, the Company obtained a controlling financial interest. The payment was comprised of (i) $2,636,000 paid directly to the partner and (ii) $3,664,000, substantially all of which was used to pay off the partner's 50% share of the underlying joint venture mortgage. In consolidating the investment, the Company recorded a purchase price fair value adjustment of $960,000 on the consolidated statement of income, representing the difference between the book value of its preexisting equity investment on the March 31, 2015 purchase date and the fair value of the net assets acquired.
F-25
ONE LIBERTY PROPERTIES, INC. AND SUBSIDIARIES
Notes to Consolidated Financial Statements (Continued)
December 31, 2017
NOTE 5—SALES OF PROPERTIES AND IMPAIRMENT LOSS
Sales of Properties
The following chart details the Company's sales of real estate during 2017 and 2016 (amounts in thousands):
Description of Property
|
Date Sold | Gross Sales Price |
Gain on Sale of Real Estate, Net |
||||||
|---|---|---|---|---|---|---|---|---|---|
Retail property, |
|||||||||
Greenwood Village, Colorado |
May 8, 2017 | $ | 9,500 | $ | 6,568 | ||||
Retail property, |
|||||||||
Kansas City, Missouri(a) |
July 14, 2017 | 10,250 | 2,180 | ||||||
Retail property, |
|||||||||
Niles, Illinois |
August 31, 2017 | 5,000 | 1,089 | ||||||
Restaurant property, |
|||||||||
Ann Arbor, Michigan(a)(b) |
November 14, 2017 | 2,300 | — | ||||||
| | | | | | | | | | |
Totals for 2017 |
$ | 27,050 | $ | 9,837 | |||||
| | | | | | | | | | |
| | | | | | | | | | |
| | | | | | | | | | |
Portfolio of eight retail properties, |
|||||||||
Louisiana and Mississippi |
February 1, 2016 | $ | 13,750 | $ | 787 | ||||
Retail property, |
|||||||||
Killeen, Texas |
May 19, 2016 | 3,100 | 980 | ||||||
Land, |
|||||||||
Sandy Springs, Georgia |
June 15, 2016 | 8,858 | 2,331 | ||||||
Industrial property, |
|||||||||
Tomlinson, Pennsylvania |
June 30, 2016 | 14,800 | 5,660 | ||||||
Retail property, |
|||||||||
Island Park, NY |
December 22, 2016 | 2,702 | 213 | ||||||
| | | | | | | | | | |
|
43,210 | 9,971 | |||||||
Partial condemnation of land, |
|||||||||
Greenwood Village, Colorado(c) |
July 5, 2016 | 153 | 116 | ||||||
| | | | | | | | | | |
Totals for 2016 |
$ | 43,363 | $ | 10,087 | |||||
| | | | | | | | | | |
| | | | | | | | | | |
| | | | | | | | | | |
- (a)
- See
Note 11 for information on the payoff of the mortgage on this property and the early termination of the interest rate swap derivative.
- (b)
- See
"—Impairment Loss" for additional information.
- (c)
- Represents amount received from the Colorado Department of Transportation ("CDOT"), as a result of a partial condemnation of land and easements obtained by CDOT.
F-26
ONE LIBERTY PROPERTIES, INC. AND SUBSIDIARIES
Notes to Consolidated Financial Statements (Continued)
December 31, 2017
NOTE 5—SALES OF PROPERTIES AND IMPAIRMENT LOSS (Continued)
In January 2015, a consolidated joint venture of the Company sold a property located in Cherry Hill, New Jersey for $16,025,000, net of closing costs. The sale resulted in a gain of $5,392,000, recorded as Gain on sale of real estate, net, for the year ended December 31, 2015. In connection with the sale, the Company paid off the $7,376,000 mortgage balance on this property and incurred a $472,000 swap termination fee (included in Prepayment costs on debt). The non-controlling interest's share of income from the transaction was $1,320,000 and is included in net income attributable to non-controlling interests.
Sale of Property Subsequent to December 31, 2017
On January 30, 2018, the Company sold a property located in Fort Bend, Texas and owned by a consolidated joint venture in which the Company held an 85% interest, for approximately $9,000,000, net of closing costs, and paid off the $4,400,000 mortgage. This property accounted for less than 1.2% of the Company's rental income, net, during 2017, 2016 and 2015. The Company anticipates recognizing a gain of approximately $2,400,000 during the three months ending March 31, 2018. The non-controlling interest's share of the gain from the transaction will be approximately $800,000.
Impairment Loss
In November 2017, the Company sold its property formerly tenanted by Joe's Crab Shack, located in Ann Arbor, Michigan. As the sales price was less than the net book value, the Company determined that the property was impaired and recorded an impairment loss of $153,000, representing the difference, at September 30, 2017, between the net sales price and the net book value. The impairment loss is included in the accompanying consolidated statement of income for the year ended December 31, 2017.
NOTE 6—ALLOWANCE FOR DOUBTFUL ACCOUNTS
At December 31, 2017 and 2016, there was no balance in the allowance for doubtful accounts.
The Company records bad debt expense as a reduction of rental income and/or tenant reimbursements. The Company recorded bad debt expense of $291,000, $105,000 and $89,000 during 2017, 2016 and 2015, respectively. Such bad debt expense related to rental income and tenant reimbursements due from five tenants at properties that filed for Chapter 11 bankruptcy protection during such years. In relation to these tenants, the Company wrote off (i) $362,000, $7,000 and $89,000 of unbilled straight-line rent receivable as a reduction to rental income, (ii) $67,000, $0 and $124,000 of unamortized intangible lease assets and liabilities as an adjustment to rental income and (iii) $884,000, $0 and $380,000 of tenant origination costs as an increase to depreciation expense during 2017, 2016 and 2015, respectively. In 2017, the Company sold three of these properties, located in Greenwood Village, Colorado, Niles, Illinois and Ann Arbor, Michigan (see Note 5) and re-tenanted one property in Philadelphia, Pennsylvania. The Company has determined that no impairment charge is required with respect to the remaining property, which at December 31, 2017, had a net book value of $2,118,000.
F-27
ONE LIBERTY PROPERTIES, INC. AND SUBSIDIARIES
Notes to Consolidated Financial Statements (Continued)
December 31, 2017
NOTE 7—VARIABLE INTEREST ENTITIES, CONTINGENT LIABILITIES AND CONSOLIDATED JOINT VENTURES
Variable Interest Entities—Ground Leases
The Company determined that with respect to the properties identified in the table below, it has a variable interest through its ground leases and the three owner/operators (which are affiliated with one another) are VIEs because their equity investment at risk is insufficient to finance its activities without additional subordinated financial support. The Company further determined that it is not the primary beneficiary of any of these VIEs because the Company has shared power over certain activities that most significantly impact the owner/operator's economic performance (i.e., shared rights on the sale of the property) and therefore, does not consolidate these VIEs for financial statement purposes. Accordingly, the Company accounts for these investments as land and the revenues from the ground leases as Rental income, net. Such rental income amounted to $3,702,000, $2,361,000 and $1,280,000 during 2017, 2016 and 2015, respectively. Included in these amounts is rental income for a similarly structured transaction for a property located in Sandy Springs, Georgia, amounting to $308,000 and $419,000 during 2016 and 2015, respectively, which the Company sold in June 2016 (see Note 5).
The following chart details the Company's VIEs through its ground leases and the aggregate carrying amount and maximum exposure to loss as of December 31, 2017 (dollars in thousands):
Description of Property(a)
|
Date Acquired | Land Contract Purchase Price |
# Units in Apartment Complex |
Owner/ Operator Mortgage from Third Party(b) |
Type of Exposure |
Carrying Amount and Maximum Exposure to Loss |
|||||||||||
|---|---|---|---|---|---|---|---|---|---|---|---|---|---|---|---|---|---|
The Meadows Apartments, |
|||||||||||||||||
Lakemoor, Illinois |
March 24, 2015 | $ | 9,300 | 496 | $ | 51,380 | (c) | Land | $ | 9,592 | |||||||
The Briarbrook Village Apartments, |
|||||||||||||||||
Wheaton, Illinois |
August 2, 2016 | 10,530 | 342 | 39,411 | Land | 10,536 | |||||||||||
The Vue Apartments, |
|||||||||||||||||
Beachwood, Ohio |
August 16, 2016 | 13,896 | 348 | 67,444 | Land | 13,901 | |||||||||||
| | | | | | | | | | | | | | | | | | |
Totals |
$ | 33,726 | 1,186 | $ | 158,235 | $ | 34,029 | ||||||||||
| | | | | | | | | | | | | | | | | | |
| | | | | | | | | | | | | | | | | | |
| | | | | | | | | | | | | | | | | | |
- (a)
- Simultaneously
with each purchase, the Company entered into a triple net ground lease with affiliates of Strategic Properties of North America, the owner/operators
of these properties.
- (b)
- Simultaneously
with the closing of each acquisition, the owner/operator obtained a mortgage from a third party which, together with the Company's purchase of the
land, provided substantially all of the funds to acquire the complex. The Company provided its land as collateral for the respective owner/operator's mortgage loans; accordingly, each land position is
subordinated to the applicable mortgage. No other financial support has been provided by the Company to the owner/operator.
- (c)
- In November 2017, the owner/operator closed on a $7,556 supplemental mortgage (the original mortgage was for $43,824). In connection therewith, the Company agreed to subordinate its fee interest to this second mortgage in exchange for a payment by the owner/operator to the Company of $5,906 as a fixed rent payment which was recorded as deferred income and will be included in rental income over the term of the lease.
F-28
ONE LIBERTY PROPERTIES, INC. AND SUBSIDIARIES
Notes to Consolidated Financial Statements (Continued)
December 31, 2017
NOTE 7—VARIABLE INTEREST ENTITIES, CONTINGENT LIABILITIES AND CONSOLIDATED JOINT VENTURES (Continued)
Pursuant to the terms of the ground lease for the Wheaton, Illinois property, the owner/operator is obligated to make certain unit renovations as and when units become vacant. Cash reserves to cover such renovation work, received by the Company in conjunction with the purchase of the property, are disbursed when the unit renovations are completed. The related cash reserve balance for this property was $443,000 and $643,000 at December 31, 2017 and 2016, respectively, and is classified as Restricted cash on the consolidated balance sheets.
Variable Interest Entities—Consolidated Joint Ventures
With respect to the six consolidated joint ventures in which the Company holds between an 85% to 95% interest, the Company has determined that such ventures are VIEs because the non-controlling interests do not hold substantive kick-out or participating rights.
In each of these six joint ventures, the Company has determined it is the primary beneficiary of the VIE as it has the power to direct the activities that most significantly impact each joint venture's performance including management, approval of expenditures, and the obligation to absorb the losses or rights to receive benefits. Accordingly, the Company has consolidated the operations of these joint ventures for financial statement purposes. The joint ventures' creditors do not have recourse to the assets of the Company other than those held by these joint ventures.
The following is a summary of the consolidated VIEs' carrying amounts and classification in the Company's consolidated balance sheets, none of which are restricted (amounts in thousands):
| |
December 31, | ||||||
|---|---|---|---|---|---|---|---|
| |
2017 | 2016 | |||||
Land |
$ | 17,844 | $ | 17,844 | |||
Buildings and improvements, net of accumulated depreciation of $3,811 and $2,732, respectively |
31,789 | 32,535 | |||||
Cash |
1,145 | 1,796 | |||||
Unbilled rent receivable |
1,011 | 775 | |||||
Unamortized intangible lease assets, net |
1,241 | 1,595 | |||||
Escrow, deposits and other assets and receivables |
948 | 1,355 | |||||
Mortgages payable, net of unamortized deferred financing costs of $442 and $539, respectively |
32,252 | 33,121 | |||||
Accrued expenses and other liabilities |
870 | 893 | |||||
Unamortized intangible lease liabilities, net |
2,015 | 2,200 | |||||
Accumulated other comprehensive loss |
(1 | ) | (70 | ) | |||
Non-controlling interests in consolidated joint ventures |
1,742 | 1,794 | |||||
At December 31, 2017 and 2016, MCB Real Estate, LLC and its affiliates ("MCB") are the Company's joint venture partner in four consolidated joint ventures in which the Company has aggregate equity investments of approximately $9,705,000 and $10,522,000, respectively. The Company's equity investment in its two other consolidated joint ventures is approximately $7,395,000 and $7,440,000 at December 31, 2017 and 2016, respectively.
F-29
ONE LIBERTY PROPERTIES, INC. AND SUBSIDIARIES
Notes to Consolidated Financial Statements (Continued)
December 31, 2017
NOTE 7—VARIABLE INTEREST ENTITIES, CONTINGENT LIABILITIES AND CONSOLIDATED JOINT VENTURES (Continued)
In October 2016, the Company purchased MCB's 5% interest in a consolidated joint venture that owns a property in Deptford, New Jersey and obtained 100% ownership. The $436,000 difference between the purchase price paid of $446,000 and the non-controlling interest's share of the net assets of the property was accounted for as a reduction to paid-in capital.
Distributions to each joint venture partner are determined pursuant to the applicable operating agreement and may not be pro rata to the equity interest each partner has in the applicable venture.
NOTE 8—INVESTMENT IN UNCONSOLIDATED JOINT VENTURES
At December 31, 2017 and 2016, the Company's five unconsolidated joint ventures each owned and operated one property. The Company's equity investment in such unconsolidated joint ventures at such dates totaled $10,723,000 and $10,833,000, respectively. The Company recorded equity in earnings of $826,000, $1,005,000 and $412,000 during 2017, 2016 and 2015, respectively.
At December 31, 2017, MCB is the Company's joint venture partner in one of these unconsolidated joint ventures in which the Company has an equity investment of $8,245,000.
NOTE 9—OTHER INCOME
The year ended December 31, 2017 includes $243,000 paid to the Company by a former tenant in connection with the resolution of a dispute, and $74,000 that the Company received for easements on a sold property. The year ended December 31, 2016 includes $356,000 that the Company received for such easements.
NOTE 10—DEBT OBLIGATIONS
Mortgages Payable
The following table details the Mortgages payable, net, balances per the consolidated balance sheets (amounts in thousands):
| |
December 31, | ||||||
|---|---|---|---|---|---|---|---|
| |
2017 | 2016 | |||||
Mortgages payable, gross |
$ | 396,946 | $ | 399,192 | |||
Unamortized deferred financing costs |
(3,789 | ) | (4,294 | ) | |||
| | | | | | | | |
Mortgages payable, net |
$ | 393,157 | $ | 394,898 | |||
| | | | | | | | |
| | | | | | | | |
| | | | | | | | |
At December 31, 2017, there were 70 outstanding mortgages payable, all of which are secured by first liens on individual real estate investments with an aggregate gross carrying value of $624,361,000 before accumulated depreciation of $83,015,000. After giving effect to the interest rate swap agreements (see Note 11), the mortgage payments bear interest at fixed rates ranging from 3.02% to 6.59%, and mature between 2018 and 2042. The weighted average interest rate on all mortgage debt was 4.22% and 4.27% at December 31, 2017 and 2016, respectively.
F-30
ONE LIBERTY PROPERTIES, INC. AND SUBSIDIARIES
Notes to Consolidated Financial Statements (Continued)
December 31, 2017
NOTE 10—DEBT OBLIGATIONS (Continued)
Scheduled principal repayments during the next five years and thereafter are as follows (amounts in thousands):
Year Ending December 31,
|
|
|||
|---|---|---|---|---|
2018(a) |
$ | 24,871 | ||
2019 |
14,610 | |||
2020 |
11,901 | |||
2021 |
20,742 | |||
2022 |
43,771 | |||
Thereafter |
281,051 | |||
| | | | | |
Total |
$ | 396,946 | ||
| | | | | |
| | | | | |
| | | | | |
- (a)
- Includes $4,423 related to a mortgage loan that was paid off on a property sold in January 2018.
Line of Credit
The Company has a credit facility with Manufacturers & Traders Trust Company, People's United Bank, VNB New York, LLC, and Bank Leumi USA, pursuant to which the Company may borrow up to $100,000,000, subject to borrowing base requirements. The facility, which matures December 31, 2019, provides that the Company pay an interest rate equal to the one month LIBOR rate plus an applicable margin ranging from 175 basis points to 300 basis points depending on the ratio of the Company's total debt to total value, as determined pursuant to the facility. The applicable margin was 175 basis points at December 31, 2017 and 2016. An unused facility fee of .25% per annum applies to the facility. The average interest rate on the facility was approximately 2.87%, 2.23% and 1.95% during 2017, 2016 and 2015, respectively.
The credit facility includes certain restrictions and covenants which may limit, among other things, the incurrence of liens, and which require compliance with financial ratios relating to, among other things, the minimum amount of tangible net worth, the minimum amount of debt service coverage, the minimum amount of fixed charge coverage, the maximum amount of debt to value, the minimum level of net income, certain investment limitations and the minimum value of unencumbered properties and the number of such properties. The Company was in compliance with all covenants at December 31, 2017.
The facility is guaranteed by subsidiaries of the Company that own unencumbered properties and the Company pledged to the lenders the equity interests in the Company's subsidiaries. The facility is available for the acquisition of commercial real estate, repayment of mortgage debt, property improvements and general working capital purposes; provided, that if used for property improvements and working capital purposes, the amount outstanding for such purposes will not exceed the lesser of $15,000,000 and 15% of the borrowing base and if used for working capital purposes, will not exceed $10,000,000. Net proceeds received from the sale, financing or refinancing of properties are generally required to be used to repay amounts outstanding under the credit facility.
F-31
ONE LIBERTY PROPERTIES, INC. AND SUBSIDIARIES
Notes to Consolidated Financial Statements (Continued)
December 31, 2017
NOTE 10—DEBT OBLIGATIONS (Continued)
The following table details the Line of credit, net, balances per the consolidated balance sheets (amounts in thousands):
| |
December 31, | ||||||
|---|---|---|---|---|---|---|---|
| |
2017 | 2016 | |||||
Line of credit, gross |
$ | 9,400 | $ | 10,000 | |||
Unamortized deferred financing costs |
(624 | ) | (936 | ) | |||
| | | | | | | | |
Line of credit, net |
$ | 8,776 | $ | 9,064 | |||
| | | | | | | | |
| | | | | | | | |
| | | | | | | | |
At March 5, 2018, there was an outstanding balance of $3,900,000 (before unamortized deferred financing costs) under the facility.
NOTE 11—FAIR VALUE MEASUREMENTS
The carrying amounts of cash and cash equivalents, restricted cash, escrow, deposits and other assets and receivables (excluding interest rate swaps), dividends payable, and accrued expenses and other liabilities (excluding interest rate swaps), are not measured at fair value on a recurring basis, but are considered to be recorded at amounts that approximate fair value.
At December 31, 2017, the $397,103,000 estimated fair value of the Company's mortgages payable is more than their $396,946,000 carrying value (before unamortized deferred financing costs) by approximately $157,000, assuming a blended market interest rate of 4.25% based on the 8.7 year weighted average remaining term to maturity of the mortgages. At December 31, 2016, the $413,916,000 estimated fair value of the Company's mortgages payable is greater than their $399,192,000 carrying value (before unamortized deferred financing costs) by approximately $14,724,000, assuming a blended market interest rate of 3.74% based on the 9.3 year weighted average remaining term to maturity of the mortgages.
At December 31, 2017 and 2016, the carrying amount of the Company's line of credit (before unamortized deferred financing costs) of $9,400,000 and $10,000,000, respectively, approximates its fair value.
The fair value of the Company's mortgages payable and line of credit are estimated using unobservable inputs such as available market information and discounted cash flow analysis based on borrowing rates the Company believes it could obtain with similar terms and maturities. These fair value measurements fall within Level 3 of the fair value hierarchy.
Considerable judgment is necessary to interpret market data and develop estimated fair value. The use of different market assumptions and/or estimation methodologies may have a material effect on the estimated fair value amounts.
F-32
ONE LIBERTY PROPERTIES, INC. AND SUBSIDIARIES
Notes to Consolidated Financial Statements (Continued)
December 31, 2017
NOTE 11—FAIR VALUE MEASUREMENTS (Continued)
Fair Value on a Recurring Basis
The fair value of the Company's derivative financial instruments, using Level 2 inputs, was determined to be the following (amounts in thousands):
| |
As of December 31, |
Carrying and Fair Value |
|||||
|---|---|---|---|---|---|---|---|
Financial assets: |
|||||||
Interest rate swaps |
2017 | $ | 1,615 | ||||
|
2016 | 1,257 | |||||
Financial liabilities: |
|||||||
Interest rate swaps |
2017 | $ | 1,492 | ||||
|
2016 | 2,695 | |||||
The Company does not currently own any financial instruments that are measured on a recurring basis and that are classified as Level 1 or 3.
The Company's objective in using interest rate swaps is to add stability to interest expense. The Company does not use derivatives for trading or speculative purposes.
Fair values are approximated using widely accepted valuation techniques including discounted cash flow analysis on the expected cash flows of the derivatives. This analysis reflects the contractual terms of the derivatives, including the period to maturity, and uses observable market-based inputs, including interest rate curves and implied volatilities.
Although the Company has determined the majority of the inputs used to value its derivatives fall within Level 2 of the fair value hierarchy, the credit valuation adjustments associated with it use Level 3 inputs, such as estimates of current credit spreads, to evaluate the likelihood of default by the Company and its counterparty. As of December 31, 2017, the Company has assessed and determined the impact of the credit valuation adjustments on the overall valuation of its derivative positions is not significant. As a result, the Company determined its derivative valuation is classified in Level 2 of the fair value hierarchy.
As of December 31, 2017, the Company had entered into 28 interest rate derivatives, all of which were interest rate swaps, related to 28 outstanding mortgage loans with an aggregate $132,965,000 notional amount and mature between 2018 and 2028 (weighted average remaining term to maturity of 7.0 years). Such interest rate swaps, all of which were designated as cash flow hedges, converted LIBOR based variable rate mortgages to fixed annual rate mortgages (with interest rates ranging from 3.02% to 5.38% and a weighted average interest rate of 4.11% at December 31, 2017). The fair value of the Company's derivatives in asset and liability positions are reflected as other assets or other liabilities on the consolidated balance sheets. During the year ended December 31, 2017, the Company discontinued hedge accounting on two of its interest rate swaps (see discussion following the table below).
Three of the Company's unconsolidated joint ventures, in which wholly-owned subsidiaries of the Company are 50% partners, had two interest rate derivatives outstanding at December 31, 2017 with an
F-33
ONE LIBERTY PROPERTIES, INC. AND SUBSIDIARIES
Notes to Consolidated Financial Statements (Continued)
December 31, 2017
NOTE 11—FAIR VALUE MEASUREMENTS (Continued)
aggregate $10,491,000 notional amount. These interest rate swaps, which were designated as cash flow hedges, have interest rates of 3.49% and 5.81% and mature in 2022 and 2018, respectively.
The following table presents the effect of the Company's derivative financial instruments on the consolidated statements of income for the periods presented (amounts in thousands):
| |
Year Ended December 31, | |||||||||
|---|---|---|---|---|---|---|---|---|---|---|
| |
2017 | 2016 | 2015 | |||||||
One Liberty Properties Inc. and Consolidated Subsidiaries |
||||||||||
Amount of (loss) gain recognized on derivatives in Other comprehensive income (loss) |
$ | (221 | ) | $ | 255 | $ | (3,722 | ) | ||
Amount of (loss) reclassification from Accumulated other comprehensive income (loss) into Interest expense |
(1,786 | ) | (2,624 | ) | (2,554 | ) | ||||
Unconsolidated Joint Ventures (Company's share) |
||||||||||
Amount of gain (loss) recognized on derivatives in Other comprehensive income (loss) |
$ | 15 | $ | (31 | ) | $ | (109 | ) | ||
Amount of (loss) reclassification from Accumulated other comprehensive income (loss) into Equity in earnings of unconsolidated joint ventures |
(61 | ) | (95 | ) | (108 | ) | ||||
During 2017, in connection with the sale of two properties located in Kansas City, Missouri and Ann Arbor, Michigan, the Company paid off the mortgages and terminated the related interest rate swaps. As the Company discontinued hedge accounting on these interest rate swaps as the hedged forecasted transactions became probable not to occur, the Company accelerated the reclassification of $201,000 from Accumulated other comprehensive income to Interest expense for the year ended December 31, 2017. No gain or loss was recognized with respect to hedge ineffectiveness or to amounts excluded from effectiveness testing on the Company's cash flow hedges for the three years ended December 31, 2017.
During the twelve months ending December 31, 2018, the Company estimates an additional $565,000 will be reclassified from Accumulated other comprehensive income as an increase to Interest expense and $7,000 will be reclassified from Accumulated other comprehensive income as a decrease to Equity in earnings of unconsolidated joint ventures.
The derivative agreements in effect at December 31, 2017 provide that if the wholly-owned subsidiary of the Company which is a party to the agreement defaults or is capable of being declared in default on any of its indebtedness, then a default can be declared on such subsidiary's derivative obligation. In addition, the Company is a party to the derivative agreements and if there is a default by the subsidiary on the loan subject to the derivative agreement to which the Company is a party and if there are swap breakage losses on account of the derivative being terminated early, then the Company could be held liable for such swap breakage losses, if any. During the year ended December 31, 2016, the Company terminated three interest rate swaps in connection with the early payoff of the related mortgages, and during the year ended December 31, 2015, the Company terminated one interest rate swap in connection with the sale of its Cherry Hill, New Jersey property. The Company accelerated the
F-34
ONE LIBERTY PROPERTIES, INC. AND SUBSIDIARIES
Notes to Consolidated Financial Statements (Continued)
December 31, 2017
NOTE 11—FAIR VALUE MEASUREMENTS (Continued)
reclassification of amounts in accumulated other comprehensive income to earnings as a result of these hedged forecasted transactions being terminated. The accelerated amounts were losses of $178,000 and $472,000 during 2016 and 2015, respectively, which are included in Prepayment costs on debt on the consolidated statements of income.
As of December 31, 2017 and 2016, the fair value of the derivatives in a liability position, including accrued interest of $53,000 and $113,000, respectively, but excluding any adjustments for nonperformance risk, was approximately $1,638,000 and $2,951,000, respectively. In the event the Company breaches any of the contractual provisions of the derivative contracts, it would be required to settle its obligations thereunder at their termination liability value of $1,638,000 and $2,951,000 as of December 31, 2017 and 2016, respectively. This termination liability value, net of adjustments for nonperformance risk of $93,000 and $143,000, is included in Accrued expenses and other liabilities on the consolidated balance sheet at December 31, 2017 and 2016, respectively.
Available-for-sale securities
During 2016, the Company sold its available-for-sale securities for $33,000 which had a cost of $5,300. The Company realized a gain on sale of $27,000, which was reclassified from Accumulated other comprehensive loss on the consolidated balance sheet into Other income on the consolidated statement of income.
NOTE 12—RELATED PARTY TRANSACTIONS
Compensation and Services Agreement
Pursuant to the compensation and services agreement with Majestic Property Management Corp. ("Majestic"), the Company pays fees to Majestic and Majestic provides to the Company the services of all affiliated executive, administrative, legal, accounting, clerical and property management personnel, as well as property acquisition, sale and lease consulting and brokerage services, consulting services with respect to mortgage financings and construction supervisory services. Majestic is wholly-owned by the Company's vice-chairman and certain of the Company's executive officers are officers of, and are compensated by, Majestic. The fee the Company pays Majestic is negotiated each year by Majestic and the Compensation and Audit Committees of the Company's Board of Directors, and is approved by such committees and the independent directors.
In consideration for the services described above, the Company paid Majestic $2,673,000 in 2017, $2,504,000 in 2016 and $2,339,000 in 2015. Included in these fees are $1,154,000 in 2017, $1,057,000 in 2016 and $892,500 in 2015, of property management costs. The property management fee portion of the compensation and services agreement is paid based on 1.5% and 2.0% of the rental payments (including tenant reimbursements) actually received by the Company from net lease tenants and operating lease tenants, respectively. The Company does not pay Majestic property management fees with respect to properties managed by third parties. Majestic credits against the fees due to it under the compensation and services agreement any management or other fees received by it from any joint venture in which the Company is a joint venture partner. The compensation and services agreement also provides for an additional payment to Majestic of $216,000 in 2017, $196,000 in each of 2016 and 2015 for the Company's share of all direct office expenses, including rent, telephone, postage, computer
F-35
ONE LIBERTY PROPERTIES, INC. AND SUBSIDIARIES
Notes to Consolidated Financial Statements (Continued)
December 31, 2017
NOTE 12—RELATED PARTY TRANSACTIONS (Continued)
services, internet usage and supplies. The Company does not pay any fees or expenses to Majestic for such services except for the fees described in this paragraph. In 2018, the fees paid to Majestic will remain the same as the 2017 fees (exclusive of the property management costs, which are calculated as described above).
Executive officers and others providing services to the Company under the compensation and services agreement were awarded shares of restricted stock and RSUs under the Company's stock incentive plans (described in Note 13). The related expense charged to the Company's operations was $1,539,000, $1,480,000 and $1,245,000 in 2017, 2016 and 2015, respectively.
The fees paid under the compensation and services agreement (except for the property management fees which are included in Real estate expenses) and the costs of the stock incentive plans are included in General and administrative expense on the consolidated statements of income for 2017, 2016 and 2015.
Joint Venture Partners and Affiliates
During 2017, 2016 and 2015, the Company paid an aggregate of $143,000, $185,000 and $198,000, respectively, to its joint venture partners or their affiliates (none of whom are officers, directors, or employees of the Company) of its consolidated joint ventures for property management and acquisition fees, which are included in Real estate expenses and Real estate acquisition costs on the consolidated statements of income.
The Company's unconsolidated joint ventures paid management fees of $175,000, $176,000 and $409,000 to the other partner of the venture, which reduced Equity in earnings of unconsolidated joint ventures on the consolidated statements of income by $88,000, $88,000 and $205,000 during 2017, 2016 and 2015, respectively. In 2015, the Company received a $131,000 fee for obtaining the mortgage debt for the unconsolidated joint venture that acquired the Manahawkin, New Jersey property. Fifty percent of this income is included in Other income on the consolidated statement of income and the balance is recorded as a reduction to the investment.
See Note 7 for information regarding the Company's purchase in October 2016, of MCB's 5% interest in a consolidated joint venture that owned a property in Deptford, New Jersey.
Other
During 2017, 2016 and 2015, the Company paid fees of (i) $276,000, $262,500 and $262,500, respectively, to the Company's chairman and (ii) $110,000, $105,000 and $105,000, respectively, to the Company's vice-chairman. There is no increase in the amounts to be paid to the Company's chairman and vice-chairman in 2018. These fees are included in General and administrative expense on the consolidated statements of income.
At December 31, 2017 and 2016, Gould Investors L.P. ("Gould Investors"), owned 1,785,976 shares of the outstanding common stock of the Company, or approximately 9.5% and 9.8%, respectively. During 2015, Gould Investors purchased 81,211 shares of the Company's stock through the Company's dividend reinvestment plan, and did not purchase any such shares during 2017 and 2016.
F-36
ONE LIBERTY PROPERTIES, INC. AND SUBSIDIARIES
Notes to Consolidated Financial Statements (Continued)
December 31, 2017
NOTE 12—RELATED PARTY TRANSACTIONS (Continued)
The Company obtains its property insurance in conjunction with Gould Investors and reimburses Gould Investors annually for the Company's insurance cost relating to its properties. Amounts reimbursed to Gould Investors were $790,000, $699,000 and $520,000 during 2017, 2016 and 2015, respectively. Included in Real estate expenses on the consolidated statements of income is insurance expense of $757,000, $645,000 and $339,000 during 2017, 2016 and 2015, respectively. The balance of the amounts reimbursed to Gould Investors represents prepaid insurance and is included in Other assets on the consolidated balance sheets.
NOTE 13—STOCKHOLDERS' EQUITY
Stock Based Compensation
The Company's 2016 Incentive Plan ("Plan"), approved by the Company's stockholders in June 2016, permits the Company to grant, among other things, stock options, restricted stock, RSUs, performance share awards and dividend equivalent rights and any one or more of the foregoing to its employees, officers, directors and consultants. A maximum of 750,000 shares of the Company's common stock is authorized for issuance pursuant to this Plan. As of December 31, 2017, (i) restricted stock awards with respect to 140,100 shares had been issued, of which 100 shares were forfeited and 3,000 shares had vested, and (ii) as further described below, RSUs with respect to 76,250 shares had been issued and are outstanding. On January 18, 2018, 144,750 restricted shares were issued pursuant to this Plan, having an aggregate value of approximately $3,664,000 and are scheduled to vest in January 2023.
Under the Company's 2012 equity incentive plan, as of December 31, 2017, 500,700 shares had been issued, of which 3,350 shares were forfeited and 21,450 shares had vested. No additional awards may be granted under this plan.
For accounting purposes, the restricted stock is not included in the shares shown as outstanding on the balance sheet until they vest; however, dividends are paid on the unvested shares. The restricted stock grants are charged to General and administrative expense over the respective vesting periods based on the market value of the common stock on the grant date. Unless earlier forfeited because the participant's relationship with the Company terminated, unvested restricted stock awards vest on the fifth anniversary of the grant date, and under certain circumstances may vest earlier.
F-37
ONE LIBERTY PROPERTIES, INC. AND SUBSIDIARIES
Notes to Consolidated Financial Statements (Continued)
December 31, 2017
NOTE 13—STOCKHOLDERS' EQUITY (Continued)
During 2017, the Company granted RSUs exchangeable for up to 76,250 shares of common stock upon satisfaction, through June 30, 2020, of specified conditions. Specifically, up to 50% of these RSUs vest upon achievement of metrics related to average annual total stockholder return (the "TSR Awards"), which metrics meet the definition of a market condition, and up to 50% vest upon achievement of metrics related to average annual return on capital (the "ROC Awards"), which metrics meet the definition of a performance condition. The holders of the RSUs are not entitled to dividends or to vote the underlying shares until such RSUs vest and shares are issued. Accordingly, the shares underlying these RSUs are not included in the shares shown as outstanding on the balance sheet. For the TSR awards, a third party appraiser prepared a Monte Carlo simulation pricing model to determine the fair value, which is recognized ratably over the service period. The Monte Carlo valuation consisted of computing the grant date fair value of the awards using the Company's simulated stock price. The per unit or share fair value was estimated using the following assumptions: an expected life of three years, a dividend rate of 7.16%, a risk-free interest rate of 1.14% - 1.64% and an expected price volatility of 16.57% - 19.16%. The expected price volatility was calculated based on the historical volatility and implied volatility. For the ROC awards, the fair value is based on the market value on the date of grant and the performance assumptions are re-evaluated quarterly. Expense is not recognized on the RSUs which the Company does not expect to vest as a result of service conditions or the Company's performance expectations.
The total amount recorded as deferred compensation is $1,004,000, based on performance and market assumptions and will be charged to General and administrative expense through June 30, 2020. None of these RSUs were forfeited or vested during the year ended December 31, 2017.
In 2010, RSUs exchangeable for up to 200,000 shares of common stock were awarded pursuant to the Company's 2009 equity incentive plan. The holders of RSUs were not entitled to dividends or to vote the underlying shares until the RSUs vested and the underlying shares were issued. Accordingly, for financial statement purposes, the shares underlying these RSUs were not included in the shares shown as outstanding on the balance sheet as of December 31, 2016. During 2017, 113,584 shares of common stock underlying the RSUs were deemed to have vested and were issued. RSUs with respect to the balance of 86,416 shares were forfeited.
F-38
ONE LIBERTY PROPERTIES, INC. AND SUBSIDIARIES
Notes to Consolidated Financial Statements (Continued)
December 31, 2017
NOTE 13—STOCKHOLDERS' EQUITY (Continued)
The following is a summary of the activity of the equity incentive plans:
| |
Years Ended December 31, | |||||||||
|---|---|---|---|---|---|---|---|---|---|---|
| |
2017 | 2016 | 2015 | |||||||
Restricted stock: |
||||||||||
Number of shares |
140,100 | 139,225 | 129,975 | |||||||
Average per share grant price |
$ | 24.75 | $ | 21.74 | $ | 24.60 | ||||
Deferred compensation to be recognized over vesting period |
$ | 3,467,000 | $ | 3,027,000 | $ | 3,197,000 | ||||
Number of non-vested shares: |
||||||||||
Non-vested beginning of year |
591,750 | 538,755 | 480,995 | |||||||
Grants |
140,100 | 139,225 | 129,975 | |||||||
Vested during year |
(118,450 | ) | (85,730 | ) | (72,215 | ) | ||||
Forfeitures |
(500 | ) | (500 | ) | — | |||||
| | | | | | | | | | | |
Non-vested end of year |
612,900 | 591,750 | 538,755 | |||||||
| | | | | | | | | | | |
| | | | | | | | | | | |
| | | | | | | | | | | |
RSU grants: |
||||||||||
Number of underlying shares |
76,250 | — | — | |||||||
Average per share grant price |
$ | 24.03 | — | — | ||||||
Deferred compensation to be recognized over vesting period |
$ | 1,004,000 | — | — | ||||||
Number of non-vested shares: |
||||||||||
Non-vested beginning of year |
200,000 | 200,000 | 200,000 | |||||||
Grants |
76,250 | — | — | |||||||
Vested during year |
(113,584 | ) | — | — | ||||||
Forfeitures |
(86,416 | ) | — | — | ||||||
| | | | | | | | | | | |
Non-vested end of year |
76,250 | 200,000 | 200,000 | |||||||
| | | | | | | | | | | |
| | | | | | | | | | | |
| | | | | | | | | | | |
Restricted stock and RSU grants: |
||||||||||
Weighted average per share value of non-vested shares (based on grant price) |
$ | 22.89 | $ | 17.95 | $ | 17.12 | ||||
| | | | | | | | | | | |
| | | | | | | | | | | |
| | | | | | | | | | | |
Value of stock vested during the year (based on grant price) |
$ | 3,008,000 | $ | 1,451,500 | $ | 612,000 | ||||
| | | | | | | | | | | |
| | | | | | | | | | | |
| | | | | | | | | | | |
Weighted average per share value of shares forfeited during the year (based on grant price) |
$ | 8.37 | $ | 21.05 | $ | — | ||||
| | | | | | | | | | | |
| | | | | | | | | | | |
| | | | | | | | | | | |
Total charge to operations: |
||||||||||
Outstanding restricted stock grants |
$ | 2,966,000 | $ | 2,692,000 | $ | 2,204,000 | ||||
Outstanding RSUs |
167,000 | 291,000 | 130,000 | |||||||
| | | | | | | | | | | |
Total charge to operations |
$ | 3,133,000 | $ | 2,983,000 | $ | 2,334,000 | ||||
| | | | | | | | | | | |
| | | | | | | | | | | |
| | | | | | | | | | | |
As of December 31, 2017, total compensation of $7,098,000 related to non-vested restricted stock awards and RSUs have not yet been recognized. These compensation costs will be charged to General and administrative expense over the remaining respective vesting periods. The weighted average vesting period is 2.2 years for the restricted stock and 2.5 years for the RSUs.
F-39
ONE LIBERTY PROPERTIES, INC. AND SUBSIDIARIES
Notes to Consolidated Financial Statements (Continued)
December 31, 2017
NOTE 13—STOCKHOLDERS' EQUITY (Continued)
Common Stock Dividend Distributions
In 2017, 2016 and 2015, the Board of Directors declared an aggregate $1.74, $1.66, and $1.58 per share in cash distributions, respectively.
On March 12, 2018, the Board of Directors declared a quarterly cash dividend of $.45 per share on the Company's common stock, totaling $8,581,000. The quarterly dividend is payable on April 6, 2018 to stockholders of record on March 27, 2018.
Dividend Reinvestment Plan
The Company's Dividend Reinvestment Plan (the "DRP") provides stockholders with the opportunity to reinvest all, or a portion of, their cash dividends paid on the Company's common stock in additional shares of its common stock, at a discount of up to 5% from the market price. The discount is determined in the Company's sole discretion. The Company is currently offering up to a 5% discount from market. The Company issued 198,000, 142,000, and 197,000 common shares under the DRP during 2017, 2016 and 2015, respectively.
Shares Issued Through Equity Offering Program
During 2017, the Company sold 231,000 shares for proceeds of $5,758,000, net of commissions of $58,000, and incurred offering costs of $188,000 for professional fees. During 2016, the Company sold 1,079,862 shares for proceeds of $25,947,000, net of commissions of $262,000, and incurred offering costs of $160,000 for professional fees. There were no sales subsequent to December 31, 2017.
NOTE 14—COMMITMENTS AND CONTINGENCIES
The Company maintains a non-contributory defined contribution pension plan covering eligible employees. Contributions by the Company are made through a money purchase plan, based upon a percent of the qualified employees' total salary (subject to the maximum amount allowed by law). Pension expense approximated $275,000, $273,000, and $266,000 for 2017, 2016 and 2015, respectively, and is included in General and administrative expense in the consolidated statements of income.
The Company is contractually required (i) to expend approximately $7,800,000 through 2018 for building expansion and improvements at its property tenanted by L-3 Communications, located in Hauppauge, New York, of which $3,584,000 has been spent through December 31, 2017 and (ii) to reimburse Regal Cinemas, a tenant in Greensboro, North Carolina, $3,000,000 when the tenant completes specified improvements to the property. On January 26, 2018, the Company reimbursed this amount to the tenant.
The Company pays, with respect to one of its real estate properties, annual fixed leasehold rent of $371,094 through July 2019 and $463,867 through March 3, 2020. The Company has the right to extend the lease for up to five 5-year renewal options and one seven month renewal option.
As discussed in Note 7, the Company provided its land in Lakemoor and Wheaton, Illinois, and Beachwood, Ohio as collateral for the respective owner/operator's mortgage loans and accordingly, each land position is subordinated to the applicable mortgage.
F-40
ONE LIBERTY PROPERTIES, INC. AND SUBSIDIARIES
Notes to Consolidated Financial Statements (Continued)
December 31, 2017
NOTE 14—COMMITMENTS AND CONTINGENCIES (Continued)
In the ordinary course of business, the Company is party to various legal actions which management believes are routine in nature and incidental to the operation of the Company's business. Management believes that the outcome of the proceedings will not have a material adverse effect upon the Company's consolidated financial statements taken as a whole.
NOTE 15—INCOME TAXES
The Company elected to be taxed as a REIT under the Internal Revenue Code, commencing with its taxable year ended December 31, 1983. To qualify as a REIT, the Company must meet a number of organizational and operational requirements, including a requirement that it currently distribute at least 90% of its adjusted taxable income to its stockholders. As a REIT, the Company generally will not be subject to corporate level federal, state and local income tax on taxable income it distributes currently to its stockholders. If the Company fails to qualify as a REIT in any taxable year, it will be subject to federal, state and local income taxes at regular corporate rates (including any applicable alternative minimum tax) and may not be able to qualify as a REIT for four subsequent taxable years. It is management's current intention to adhere to these requirements and maintain the Company's REIT status.
Even though the Company qualifies for taxation as a REIT, the Company is subject to certain state and local taxes on its income and property, and to federal income and excise taxes on its undistributed taxable income. As of December 31, 2017, tax returns for the calendar years 2014 through 2017 remain subject to examination by the Internal Revenue Service and various state and local tax jurisdictions.
During 2017, 2016 and 2015, the Company recorded federal excise tax expense of $0, $6,000 and $174,000, respectively, which is based on taxable income generated but not yet distributed. During 2017, 2016 and 2015, the Company did not incur any federal income tax expense. The Company does not have any deferred tax assets or liabilities at December 31, 2017 and 2016.
During 2017, 2016 and 2015, 17%, 27% and 67%, respectively, of the distributions were treated as capital gain distributions, with the balance treated as ordinary income.
The Company treats depreciation expense, straight-line rent adjustments and certain other items differently for tax purposes than for financial reporting purposes. Therefore, its dividends paid deduction differs from its financial statement income.
F-41
ONE LIBERTY PROPERTIES, INC. AND SUBSIDIARIES
Notes to Consolidated Financial Statements (Continued)
December 31, 2017
NOTE 15—INCOME TAXES (Continued)
The following table reconciles cash dividends paid with the dividends paid deduction for the years indicated (amounts in thousands):
| |
2017 Estimate |
2016 Actual |
2015 Actual |
|||||||
|---|---|---|---|---|---|---|---|---|---|---|
Dividends paid |
$ | 32,393 | $ | 29,135 | $ | 26,179 | ||||
Dividend reinvestment plan(a) |
252 | 181 | 228 | |||||||
| | | | | | | | | | | |
|
32,645 | 29,316 | 26,407 | |||||||
Less: Spillover dividends designated to previous year |
(11,916 | ) | (15,209 | ) | (18,177 | ) | ||||
Plus: Dividends designated from following year |
10,263 | 11,916 | 15,209 | |||||||
| | | | | | | | | | | |
Dividends paid deduction |
$ | 30,992 | $ | 26,023 | $ | 23,439 | ||||
| | | | | | | | | | | |
| | | | | | | | | | | |
| | | | | | | | | | | |
- (a)
- Reflects the up to 5% discount on common stock purchased through the dividend reinvestment plan.
NOTE 16—SUBSEQUENT EVENTS
Subsequent events have been evaluated and, except as previously disclosed, there were no other events relative to the consolidated financial statements that require additional disclosure.
NOTE 17—QUARTERLY FINANCIAL DATA (Unaudited):
(In Thousands, Except Per Share Data)
| |
Quarter Ended | |
||||||||||||||
|---|---|---|---|---|---|---|---|---|---|---|---|---|---|---|---|---|
| |
Total For Year |
|||||||||||||||
2017
|
March 31 | June 30 | Sept. 30 | Dec. 31 | ||||||||||||
Total revenues |
$ | 18,472 | $ | 18,413 | $ | 19,137 | $ | 19,894 | $ | 75,916 | ||||||
| | | | | | | | | | | | | | | | | |
| | | | | | | | | | | | | | | | | |
| | | | | | | | | | | | | | | | | |
Gain on sale of real estate, net |
$ | — | $ | 6,568 | $ | 3,269 | $ | — | $ | 9,837 | ||||||
| | | | | | | | | | | | | | | | | |
| | | | | | | | | | | | | | | | | |
| | | | | | | | | | | | | | | | | |
Net income |
$ | 2,886 | $ | 9,993 | $ | 7,128 | $ | 4,242 | $ | 24,249 | ||||||
| | | | | | | | | | | | | | | | | |
| | | | | | | | | | | | | | | | | |
| | | | | | | | | | | | | | | | | |
Net income attributable to One Liberty Properties, Inc. |
$ | 2,865 | $ | 9,972 | $ | 7,105 | $ | 4,205 | $ | 24,147 | ||||||
| | | | | | | | | | | | | | | | | |
| | | | | | | | | | | | | | | | | |
| | | | | | | | | | | | | | | | | |
Weighted average number of common shares outstanding: |
||||||||||||||||
Basic |
17,751 | 17,824 | 18,000 | 18,198 | 17,944 | |||||||||||
| | | | | | | | | | | | | | | | | |
| | | | | | | | | | | | | | | | | |
| | | | | | | | | | | | | | | | | |
Diluted |
17,865 | 17,938 | 18,079 | 18,269 | 18,047 | |||||||||||
| | | | | | | | | | | | | | | | | |
| | | | | | | | | | | | | | | | | |
| | | | | | | | | | | | | | | | | |
Net income per common share attributable to common stockholders: |
||||||||||||||||
Basic |
$ | .15 | $ | .54 | $ | .38 | $ | .22 | $ | 1.29 | (a) | |||||
| | | | | | | | | | | | | | | | | |
| | | | | | | | | | | | | | | | | |
| | | | | | | | | | | | | | | | | |
Diluted |
$ | .15 | $ | .54 | $ | .38 | $ | .22 | $ | 1.28 | (a) | |||||
| | | | | | | | | | | | | | | | | |
| | | | | | | | | | | | | | | | | |
| | | | | | | | | | | | | | | | | |
F-42
ONE LIBERTY PROPERTIES, INC. AND SUBSIDIARIES
Notes to Consolidated Financial Statements (Continued)
December 31, 2017
NOTE 17—QUARTERLY FINANCIAL DATA (Unaudited): (Continued)
| |
Quarter Ended | |
||||||||||||||
|---|---|---|---|---|---|---|---|---|---|---|---|---|---|---|---|---|
| |
Total For Year |
|||||||||||||||
2016
|
March 31 | June 30 | Sept. 30 | Dec. 31 | ||||||||||||
Total revenues |
$ | 16,344 | $ | 17,233 | $ | 18,021 | $ | 18,990 | $ | 70,588 | ||||||
| | | | | | | | | | | | | | | | | |
| | | | | | | | | | | | | | | | | |
| | | | | | | | | | | | | | | | | |
Gain on sale of real estate, net |
$ | 787 | $ | 8,918 | $ | 119 | $ | 263 | $ | 10,087 | ||||||
| | | | | | | | | | | | | | | | | |
| | | | | | | | | | | | | | | | | |
| | | | | | | | | | | | | | | | | |
Net income |
$ | 3,285 | $ | 12,459 | $ | 4,323 | $ | 4,414 | $ | 24,481 | ||||||
| | | | | | | | | | | | | | | | | |
| | | | | | | | | | | | | | | | | |
| | | | | | | | | | | | | | | | | |
Net income attributable to One Liberty Properties, Inc. |
$ | 3,287 | $ | 12,441 | $ | 4,299 | $ | 4,395 | $ | 24,422 | ||||||
| | | | | | | | | | | | | | | | | |
| | | | | | | | | | | | | | | | | |
| | | | | | | | | | | | | | | | | |
Weighted average number of common shares outstanding: |
||||||||||||||||
Basic |
16,388 | 16,579 | 16,845 | 17,255 | 16,768 | |||||||||||
| | | | | | | | | | | | | | | | | |
| | | | | | | | | | | | | | | | | |
| | | | | | | | | | | | | | | | | |
Diluted |
16,495 | 16,686 | 16,962 | 17,369 | 16,882 | |||||||||||
| | | | | | | | | | | | | | | | | |
| | | | | | | | | | | | | | | | | |
| | | | | | | | | | | | | | | | | |
Net income per common share attributable to common stockholders: |
||||||||||||||||
Basic |
$ | .19 | $ | .72 | $ | .24 | $ | .24 | $ | 1.40 | (a) | |||||
| | | | | | | | | | | | | | | | | |
| | | | | | | | | | | | | | | | | |
| | | | | | | | | | | | | | | | | |
Diluted |
$ | .18 | $ | .72 | $ | .24 | $ | .24 | $ | 1.39 | (a) | |||||
| | | | | | | | | | | | | | | | | |
| | | | | | | | | | | | | | | | | |
| | | | | | | | | | | | | | | | | |
- (a)
- Calculated on weighted average shares outstanding for the year.
F-43
ONE LIBERTY PROPERTIES, INC. AND SUBSIDIARIES
Schedule III—Consolidated Real Estate and Accumulated Depreciation
December 31, 2017
(Amounts in Thousands)
| |
|
|
|
|
Cost Capitalized Subsequent to Acquisition |
Gross Amount at Which Carried at December 31, 2017 |
|
|
|
||||||||||||||||||||||||
|---|---|---|---|---|---|---|---|---|---|---|---|---|---|---|---|---|---|---|---|---|---|---|---|---|---|---|---|---|---|---|---|---|---|
| |
|
|
Initial Cost to Company | |
|
|
|||||||||||||||||||||||||||
| |
|
|
|
Building and Improvements |
|
Building & Improvements |
|
Accumulated Depreciation(1) |
Date of Construction |
Date Acquired |
|||||||||||||||||||||||
Type
|
Location | Encumbrances | Land | Improvements | Land | Total | |||||||||||||||||||||||||||
Health & Fitness |
Tucker, GA | $ | — | $ | 807 | $ | 3,027 | $ | 3,126 | $ | 807 | $ | 6,153 | $ | 6,960 | $ | 2,290 | 1988 | 2002 | ||||||||||||||
Health & Fitness |
Hamilton, OH | 4,814 | 1,483 | 5,953 | — | 1,483 | 5,953 | 7,436 | 1,096 | 2008 | 2011 | ||||||||||||||||||||||
Health & Fitness |
Secaucus, NJ | 8,865 | 5,449 | 9,873 | — | 5,449 | 9,873 | 15,322 | 1,253 | 1986 | 2012 | ||||||||||||||||||||||
Industrial |
Ronkonkoma, NY | — | 1,042 | 4,171 | 2,517 | 1,042 | 6,688 | 7,730 | 2,181 | 1986 | 2000 | ||||||||||||||||||||||
Industrial |
Hauppauge, NY | 11,969 | 1,951 | 10,954 | 5,382 | 1,951 | 16,336 | 18,287 | 5,255 | 1982 | 2000 | ||||||||||||||||||||||
Industrial |
Fort Mill, SC | 8,290 | 1,840 | 12,687 | 23 | 1,840 | 12,710 | 14,550 | 1,568 | 1992 | 2013 | ||||||||||||||||||||||
Industrial |
Columbus, OH | — | 435 | 1,703 | 27 | 435 | 1,730 | 2,165 | 734 | 1979 | 1995 | ||||||||||||||||||||||
Industrial |
West Palm Beach, FL | — | 181 | 724 | — | 181 | 724 | 905 | 348 | 1973 | 1998 | ||||||||||||||||||||||
Industrial |
New Hyde Park, NY | 2,563 | 182 | 728 | 281 | 182 | 1,009 | 1,191 | 380 | 1960 | 1999 | ||||||||||||||||||||||
Industrial |
Melville, NY | 2,749 | 774 | 3,029 | 975 | 774 | 4,004 | 4,778 | 1,324 | 1982 | 2003 | ||||||||||||||||||||||
Industrial |
Saco, ME | — | 1,027 | 3,623 | 2,050 | 1,027 | 5,673 | 6,700 | 1,063 | 2001 | 2006 | ||||||||||||||||||||||
Industrial |
Baltimore, MD(2) | 20,527 | 6,474 | 25,282 | — | 6,474 | 25,282 | 31,756 | 6,979 | 1960 | 2006 | ||||||||||||||||||||||
Industrial |
Durham, NC | 2,788 | 1,043 | 2,404 | — | 1,043 | 2,404 | 3,447 | 466 | 1991 | 2011 | ||||||||||||||||||||||
Industrial |
Pinellas Park, FL | 2,384 | 1,231 | 1,669 | — | 1,231 | 1,669 | 2,900 | 271 | 1995 | 2012 | ||||||||||||||||||||||
Industrial |
Miamisburg, OH | 735 | 165 | 1,348 | 11 | 165 | 1,359 | 1,524 | 199 | 1987 | 2012 | ||||||||||||||||||||||
Industrial |
Indianapolis, IN | 5,933 | 1,224 | 6,935 | — | 1,224 | 6,935 | 8,159 | 996 | 1997 | 2013 | ||||||||||||||||||||||
Industrial |
Fort Mill, SC | 24,994 | 1,804 | 33,650 | — | 1,804 | 33,650 | 35,454 | 5,123 | 1997 | 2013 | ||||||||||||||||||||||
Industrial |
New Hope, MN | 4,227 | 881 | 6,064 | 81 | 881 | 6,145 | 7,026 | 481 | 1967 | 2014 | ||||||||||||||||||||||
Industrial |
Louisville, KY | 2,389 | 578 | 3,727 | 4 | 578 | 3,731 | 4,309 | 274 | 1974 | 2015 | ||||||||||||||||||||||
Industrial |
Louisville, KY | — | 51 | 230 | — | 51 | 230 | 281 | 16 | 1974 | 2015 | ||||||||||||||||||||||
Industrial |
McCalla, AL | 10,325 | 1,588 | 14,682 | — | 1,588 | 14,682 | 16,270 | 921 | 2003 | 2015 | ||||||||||||||||||||||
Industrial |
St. Louis, MO | 11,707 | 3,728 | 13,006 | 695 | 3,728 | 13,701 | 17,429 | 809 | 1969 | 2015 | ||||||||||||||||||||||
Industrial |
Greenville, SC | 5,086 | 693 | 6,893 | 11 | 693 | 6,904 | 7,597 | 322 | 1997 | 2016 | ||||||||||||||||||||||
Industrial |
Greenville, SC | 5,651 | 528 | 8,074 | 6 | 528 | 8,080 | 8,608 | 375 | 2000 | 2016 | ||||||||||||||||||||||
Industrial |
El Paso, TX | 14,487 | 3,691 | 17,904 | 324 | 3,691 | 18,228 | 21,919 | 737 | 1997 | 2016 | ||||||||||||||||||||||
Industrial |
Lebanon, TN | 21,288 | 2,094 | 30,039 | 14 | 2,094 | 30,053 | 32,147 | 1,004 | 1996 | 2016 | ||||||||||||||||||||||
Industrial |
Huntersville, NC | 5,116 | 1,046 | 6,674 | — | 1,046 | 6,674 | 7,720 | 111 | 2014 | 2017 | ||||||||||||||||||||||
Industrial |
Pittston, PA | 7,142 | 999 | 9,922 | 250 | 999 | 10,172 | 11,171 | 146 | 1990 | 2017 | ||||||||||||||||||||||
Industrial |
Ankeny, IA | 8,729 | 1,351 | 11,607 | — | 1,351 | 11,607 | 12,958 | 162 | 2016 | 2017 | ||||||||||||||||||||||
Industrial |
Memphis, TN | — | 135 | 7,952 | — | 135 | 7,952 | 8,087 | 43 | 1979 | 2017 | ||||||||||||||||||||||
Industrial |
Joppa, MD | 9,600 | 3,815 | 8,142 | 1,473 | 3,815 | 9,615 | 13,430 | 836 | 1994 | 2014 | ||||||||||||||||||||||
Office |
Brooklyn, NY | 3,532 | 1,381 | 5,447 | 2,870 | 1,381 | 8,317 | 9,698 | 3,641 | 1973 | 1998 | ||||||||||||||||||||||
Other |
Round Rock, TX | 13,892 | 1,678 | 16,670 | — | 1,678 | 16,670 | 18,348 | 1,840 | 2012 | 2013 | ||||||||||||||||||||||
Other |
Lakemoor, IL | — | 9,592 | — | — | 9,592 | — | 9,592 | — | N/A | 2015 | ||||||||||||||||||||||
Other |
Wheaton, IL | — | 10,536 | — | — | 10,536 | — | 10,536 | — | N/A | 2016 | ||||||||||||||||||||||
Other |
Beachwood, OH | — | 13,901 | — | — | 13,901 | — | 13,901 | — | N/A | 2016 | ||||||||||||||||||||||
Restaurant |
Hauppauge, NY | 1,736 | 725 | 2,963 | — | 725 | 2,963 | 3,688 | 898 | 1992 | 2005 | ||||||||||||||||||||||
Restaurant |
Palmyra, PA | 735 | 650 | 650 | — | 650 | 650 | 1,300 | 121 | 1981 | 2010 | ||||||||||||||||||||||
F-44
| |
|
|
|
|
Cost Capitalized Subsequent to Acquisition |
Gross Amount at Which Carried at December 31, 2017 |
|
|
|
||||||||||||||||||||||||
|---|---|---|---|---|---|---|---|---|---|---|---|---|---|---|---|---|---|---|---|---|---|---|---|---|---|---|---|---|---|---|---|---|---|
| |
|
|
Initial Cost to Company | |
|
|
|||||||||||||||||||||||||||
| |
|
|
|
Building and Improvements |
|
Building & Improvements |
|
Accumulated Depreciation(1) |
Date of Construction |
Date Acquired |
|||||||||||||||||||||||
Type
|
Location | Encumbrances | Land | Improvements | Land | Total | |||||||||||||||||||||||||||
Restaurant |
Reading, PA | 726 | 655 | 625 | — | 655 | 625 | 1,280 | 116 | 1981 | 2010 | ||||||||||||||||||||||
Restaurant |
Reading, PA | 714 | 618 | 643 | — | 618 | 643 | 1,261 | 121 | 1983 | 2010 | ||||||||||||||||||||||
Restaurant |
Hanover, PA | 803 | 736 | 686 | — | 736 | 686 | 1,422 | 126 | 1992 | 2010 | ||||||||||||||||||||||
Restaurant |
Gettysburg, PA | 823 | 754 | 704 | — | 754 | 704 | 1,458 | 130 | 1991 | 2010 | ||||||||||||||||||||||
Restaurant |
Trexlertown, PA | 700 | 800 | 439 | — | 800 | 439 | 1,239 | 81 | 1994 | 2010 | ||||||||||||||||||||||
Restaurant |
Carrollton, GA | 1,569 | 796 | 1,458 | — | 796 | 1,458 | 2,254 | 250 | 1996 | 2012 | ||||||||||||||||||||||
Restaurant |
Cartersville, GA | 1,484 | 786 | 1,346 | — | 786 | 1,346 | 2,132 | 245 | 1995 | 2012 | ||||||||||||||||||||||
Restaurant |
Kennesaw, GA | 1,216 | 702 | 916 | — | 702 | 916 | 1,618 | 161 | 1989 | 2012 | ||||||||||||||||||||||
Restaurant |
Lawrenceville, GA | 1,167 | 866 | 899 | — | 866 | 899 | 1,765 | 204 | 1988 | 2012 | ||||||||||||||||||||||
Restaurant |
Concord, NC | 1,529 | 999 | 1,076 | — | 999 | 1,076 | 2,075 | 143 | 2000 | 2013 | ||||||||||||||||||||||
Restaurant |
Myrtle Beach, SC | 1,529 | 1,102 | 1,161 | — | 1,102 | 1,161 | 2,263 | 161 | 1978 | 2013 | ||||||||||||||||||||||
Restaurant |
Greensboro, NC | 3,253 | 1,770 | 1,237 | — | 1,770 | 1,237 | 3,007 | 156 | 1983 | 2013 | ||||||||||||||||||||||
Restaurant |
Richmond, VA | — | 1,680 | 1,341 | — | 1,680 | 1,341 | 3,021 | 162 | 1983 | 2013 | ||||||||||||||||||||||
Restaurant |
Indianapolis, IN | 928 | 853 | 1,465 | — | 853 | 1,465 | 2,318 | 169 | 1982 | 2014 | ||||||||||||||||||||||
Retail |
Seattle, WA | — | 201 | 189 | — | 201 | 189 | 390 | 143 | 1986 | 1987 | ||||||||||||||||||||||
Retail |
Rosenberg, TX | — | 216 | 863 | 66 | 216 | 929 | 1,145 | 500 | 1994 | 1995 | ||||||||||||||||||||||
Retail |
Ft. Myers, FL | — | 1,013 | 4,054 | — | 1,013 | 4,054 | 5,067 | 2,141 | 1995 | 1996 | ||||||||||||||||||||||
Retail |
Houston, TX | — | 396 | 1,583 | 30 | 396 | 1,613 | 2,009 | 800 | 1997 | 1998 | ||||||||||||||||||||||
Retail |
Selden, NY | 2,889 | 572 | 2,287 | 150 | 572 | 2,437 | 3,009 | 1,132 | 1997 | 1999 | ||||||||||||||||||||||
Retail |
Champaign, IL | 1,580 | 791 | 3,165 | 308 | 791 | 3,473 | 4,264 | 1,553 | 1985 | 1999 | ||||||||||||||||||||||
Retail |
El Paso, TX | 11,086 | 2,821 | 11,123 | 2,544 | 2,821 | 13,667 | 16,488 | 5,567 | 1974 | 2000 | ||||||||||||||||||||||
Retail |
Somerville, MA | 1,774 | 510 | 1,993 | 24 | 510 | 2,017 | 2,527 | 749 | 1993 | 2003 | ||||||||||||||||||||||
Retail |
Newark, DE | 1,716 | 935 | 3,643 | 43 | 935 | 3,686 | 4,621 | 1,318 | 1996 | 2003 | ||||||||||||||||||||||
Retail |
Knoxville, TN | 9,112 | 2,290 | 8,855 | — | 2,290 | 8,855 | 11,145 | 3,053 | 2003 | 2004 | ||||||||||||||||||||||
Retail |
Onalaska, WI | 3,539 | 753 | 3,099 | — | 753 | 3,099 | 3,852 | 1,017 | 1994 | 2004 | ||||||||||||||||||||||
Retail |
Hyannis, MA | 131 | 802 | 2,324 | — | 802 | 2,324 | 3,126 | 579 | 1998 | 2008 | ||||||||||||||||||||||
Retail |
Marston Mills, MA | — | 461 | 2,313 | — | 461 | 2,313 | 2,774 | 571 | 1998 | 2008 | ||||||||||||||||||||||
Retail |
Everett, MA | 1,178 | 1,935 | — | — | 1,935 | — | 1,935 | — | N/A | 2008 | ||||||||||||||||||||||
Retail |
Kennesaw, GA | 5,373 | 1,501 | 4,349 | 1,138 | 1,501 | 5,487 | 6,988 | 1,148 | 1995 | 2008 | ||||||||||||||||||||||
Retail |
Royersford, PA | 19,750 | 19,538 | 3,150 | 424 | 19,538 | 3,574 | 23,112 | 707 | 2001 | 2010 | ||||||||||||||||||||||
Retail |
Monroeville, PA | — | 450 | 863 | — | 450 | 863 | 1,313 | 164 | 1994 | 2010 | ||||||||||||||||||||||
Retail |
Houston, TX | — | 1,962 | 1,540 | — | 1,962 | 1,540 | 3,502 | 315 | 2006 | 2010 | ||||||||||||||||||||||
Retail |
Houston, TX | — | 2,002 | 1,800 | — | 2,002 | 1,800 | 3,802 | 362 | 2009 | 2010 | ||||||||||||||||||||||
Retail |
Bolingbrook, IL | — | 834 | 1,887 | 101 | 834 | 1,988 | 2,822 | 368 | 2001 | 2011 | ||||||||||||||||||||||
Retail |
Crystal Lake, IL | 1,696 | 615 | 1,899 | — | 615 | 1,899 | 2,514 | 396 | 1997 | 2011 | ||||||||||||||||||||||
Retail |
Lawrence, KS | — | 134 | 938 | 22 | 134 | 960 | 1,094 | 138 | 1915 | 2012 | ||||||||||||||||||||||
Retail |
Greensboro, NC | 1,365 | 1,046 | 1,552 | 29 | 1,046 | 1,581 | 2,627 | 182 | 2002 | 2014 | ||||||||||||||||||||||
Retail |
Highlands Ranch, CO | — | 2,361 | 2,924 | — | 2,361 | 2,924 | 5,285 | 307 | 1995 | 2014 | ||||||||||||||||||||||
Retail |
Woodbury, MN | 2,957 | 1,190 | 4,003 | — | 1,190 | 4,003 | 5,193 | 413 | 2006 | 2014 | ||||||||||||||||||||||
Retail |
Lincoln, NE | — | 3,768 | 11,832 | 30 | 3,768 | 11,862 | 15,630 | 888 | 2001 | 2015 | ||||||||||||||||||||||
Retail |
Cuyahoga Falls, OH | 1,114 | 71 | 1,371 | — | 71 | 1,371 | 1,442 | 55 | 2004 | 2016 | ||||||||||||||||||||||
Retail |
Hilliard, OH | 987 | 300 | 1,077 | — | 300 | 1,077 | 1,377 | 45 | 2007 | 2016 | ||||||||||||||||||||||
Retail |
Port Clinton, OH | 955 | 52 | 1,187 | — | 52 | 1,187 | 1,239 | 49 | 2005 | 2016 | ||||||||||||||||||||||
Retail |
South Euclid, OH | 1,083 | 230 | 1,566 | — | 230 | 1,566 | 1,796 | 63 | 1975 | 2016 | ||||||||||||||||||||||
Retail |
St Louis Park, MN | — | 3,388 | 13,088 | 141 | 3,388 | 13,229 | 16,617 | 483 | 1962 | 2016 | ||||||||||||||||||||||
F-45
| |
|
|
|
|
Cost Capitalized Subsequent to Acquisition |
Gross Amount at Which Carried at December 31, 2017 |
|
|
|
||||||||||||||||||||||||
|---|---|---|---|---|---|---|---|---|---|---|---|---|---|---|---|---|---|---|---|---|---|---|---|---|---|---|---|---|---|---|---|---|---|
| |
|
|
Initial Cost to Company | |
|
|
|||||||||||||||||||||||||||
| |
|
|
|
Building and Improvements |
|
Building & Improvements |
|
Accumulated Depreciation(1) |
Date of Construction |
Date Acquired |
|||||||||||||||||||||||
Type
|
Location | Encumbrances | Land | Improvements | Land | Total | |||||||||||||||||||||||||||
Retail |
Deptford, NJ | 2,718 | 572 | 1,779 | 705 | 572 | 2,484 | 3,056 | 556 | 1981 | 2012 | ||||||||||||||||||||||
Retail |
Cape Girardeau, MO | 1,199 | 545 | 1,547 | — | 545 | 1,547 | 2,092 | 229 | 1994 | 2012 | ||||||||||||||||||||||
Retail |
Clemmons, NC | 2,119 | 2,564 | 3,293 | — | 2,564 | 3,293 | 5,857 | 561 | 1993 | 2013 | ||||||||||||||||||||||
Retail |
Houston, TX | 4,423 | 3,121 | 3,767 | 179 | 3,121 | 3,946 | 7,067 | 700 | 2001 | 2012 | ||||||||||||||||||||||
Retail |
Littleton, CO | 11,077 | 6,005 | 11,272 | 206 | 6,005 | 11,478 | 17,483 | 975 | 1985 | 2015 | ||||||||||||||||||||||
Retail—Supermarket |
Philadelphia, PA | 4,276 | 1,793 | 5,640 | 80 | 1,793 | 5,720 | 7,513 | 511 | 1992 | 2014 | ||||||||||||||||||||||
Retail—Supermarket |
West Hartford, CT | 17,211 | 9,296 | 4,813 | 261 | 9,296 | 5,074 | 14,370 | 1,055 | 2005 | 2010 | ||||||||||||||||||||||
Retail—Supermarket |
West Hartford, CT | — | 2,881 | 94 | 326 | 2,881 | 420 | 3,301 | 148 | N/A | 2010 | ||||||||||||||||||||||
Retail—Furniture |
Columbus, OH | — | 1,445 | 5,431 | 413 | 1,445 | 5,844 | 7,289 | 2,914 | 1996 | 1997 | ||||||||||||||||||||||
Retail—Furniture |
Duluth, GA(3) | 1,558 | 778 | 3,436 | — | 778 | 3,436 | 4,214 | 1,006 | 1987 | 2006 | ||||||||||||||||||||||
Retail—Furniture |
Fayetteville, GA(3) | 1,956 | 976 | 4,308 | — | 976 | 4,308 | 5,284 | 1,262 | 1987 | 2006 | ||||||||||||||||||||||
Retail—Furniture |
Wichita, KS(3) | 2,382 | 1,189 | 5,248 | — | 1,189 | 5,248 | 6,437 | 1,537 | 1996 | 2006 | ||||||||||||||||||||||
Retail—Furniture |
Lexington, KY(3) | 1,602 | 800 | 3,532 | — | 800 | 3,532 | 4,332 | 1,034 | 1999 | 2006 | ||||||||||||||||||||||
Retail—Furniture |
Bluffton, SC(3) | 1,180 | 589 | 2,600 | — | 589 | 2,600 | 3,189 | 761 | 1994 | 2006 | ||||||||||||||||||||||
Retail—Furniture |
Amarillo, TX(3) | 1,723 | 860 | 3,810 | — | 860 | 3,810 | 4,670 | 1,112 | 1996 | 2006 | ||||||||||||||||||||||
Retail—Furniture |
Austin, TX(3) | 3,179 | 1,587 | 7,010 | — | 1,587 | 7,010 | 8,597 | 2,052 | 2001 | 2006 | ||||||||||||||||||||||
Retail—Furniture |
Tyler, TX(3) | 2,066 | 1,031 | 4,554 | — | 1,031 | 4,554 | 5,585 | 1,333 | 2001 | 2006 | ||||||||||||||||||||||
Retail—Furniture |
Newport News, VA(3) | 1,505 | 751 | 3,316 | — | 751 | 3,316 | 4,067 | 971 | 1995 | 2006 | ||||||||||||||||||||||
Retail—Furniture |
Richmond, VA(3) | 1,736 | 867 | 3,829 | — | 867 | 3,829 | 4,696 | 1,121 | 1979 | 2006 | ||||||||||||||||||||||
Retail—Furniture |
Virginia Beach, VA(3) | 1,711 | 854 | 3,770 | — | 854 | 3,770 | 4,624 | 1,104 | 1995 | 2006 | ||||||||||||||||||||||
Retail—Furniture |
Gurnee, IL | — | 834 | 3,635 | — | 834 | 3,635 | 4,469 | 1,026 | 1994 | 2006 | ||||||||||||||||||||||
Retail—Furniture |
Naples, FL | 2,069 | 3,070 | 2,846 | 189 | 3,070 | 3,035 | 6,105 | 700 | 1992 | 2008 | ||||||||||||||||||||||
Retail—Office Supply |
Batavia, NY(4) | — | 515 | 2,061 | — | 515 | 2,061 | 2,576 | 972 | 1998 | 1999 | ||||||||||||||||||||||
Retail—Office Supply |
Lake Charles, LA(4) | 5,146 | 1,167 | 4,669 | 599 | 1,167 | 5,268 | 6,435 | 2,014 | 1998 | 2002 | ||||||||||||||||||||||
Retail—Office Supply |
Athens, GA(4) | 2,772 | 1,130 | 4,340 | — | 1,130 | 4,340 | 5,470 | 1,478 | 2003 | 2004 | ||||||||||||||||||||||
Retail—Office Supply |
Chicago, IL(4) | 3,735 | 3,877 | 2,256 | — | 3,877 | 2,256 | 6,133 | 524 | 1994 | 2008 | ||||||||||||||||||||||
Retail—Office Supply |
Cary, NC(4) | 3,151 | 1,129 | 3,736 | — | 1,129 | 3,736 | 4,865 | 868 | 1995 | 2008 | ||||||||||||||||||||||
Retail—Office Supply |
Eugene, OR(4) | 2,805 | 1,952 | 2,096 | — | 1,952 | 2,096 | 4,048 | 487 | 1994 | 2008 | ||||||||||||||||||||||
Retail—Office Supply |
El Paso, TX(4) | 2,451 | 1,035 | 2,700 | — | 1,035 | 2,700 | 3,735 | 627 | 1993 | 2008 | ||||||||||||||||||||||
Theater |
Greensboro, NC | — | — | 8,328 | — | — | 8,328 | 8,328 | 7,170 | 1999 | 2004 | ||||||||||||||||||||||
Theater |
Indianapolis, IN | 4,217 | 3,099 | 5,225 | 19 | 3,099 | 5,244 | 8,343 | 451 | 1997 | 2014 | ||||||||||||||||||||||
| | | | | | | | | | | | | | | | | | | | | | | | | | | | | | | | | | |
|
$ | 396,946 | $ | 209,320 | $ | 537,860 | $ | 28,147 | $ | 209,320 | $ | 566,007 | $ | 775,327 | $ | 108,953 | |||||||||||||||||
| | | | | | | | | | | | | | | | | | | | | | | | | | | | | | | | | | |
| | | | | | | | | | | | | | | | | | | | | | | | | | | | | | | | | | |
| | | | | | | | | | | | | | | | | | | | | | | | | | | | | | | | | | |
Note 1—Depreciation is provided over the estimated useful lives of the buildings and improvements, which range from 3 to 40 years.
Note 2—Upon purchase of the property in December 2006, a $416,000 rental income reserve was posted by the seller for the Company's benefit, since the property was not producing sufficient rent at the time of acquisition. The Company recorded the receipt of this rental reserve as a reduction to land and building.
Note 3—These 11 properties are retail furniture stores covered by one master lease and one loan that is secured by cross - collateralized mortgages. They are located in six states (Georgia, Kansas, Kentucky, South Carolina, Texas and Virginia).
Note 4—These seven properties are retail office supply stores net leased to the same tenant, pursuant to separate leases. Five of these leases contain cross default provisions. They are located in seven states (Illinois, Louisiana, North Carolina, Texas, Georgia, Oregon, and New York).
F-46
ONE LIBERTY PROPERTIES, INC. AND SUBSIDIARIES
Notes to Schedule III
Consolidated Real Estate and Accumulated Depreciation
- (a)
- Reconciliation of "Real Estate and Accumulated Depreciation"
(Amounts in Thousands)
| |
Year Ended December 31, | |||||||||
|---|---|---|---|---|---|---|---|---|---|---|
| |
2017 | 2016 | 2015 | |||||||
Investment in real estate (b): |
||||||||||
Balance, beginning of year |
$ |
748,065 |
$ |
662,182 |
$ |
592,668 |
||||
Addition: Land, buildings and improvements |
47,207 | 121,564 | 83,643 | |||||||
Deduction: Properties sold/conveyed |
(19,792 | ) | (35,681 | ) | (14,129 | ) | ||||
Deduction: Impairment loss |
(153 | ) | — | — | ||||||
| | | | | | | | | | | |
Balance, end of year |
$ | 775,327 | $ | 748,065 | $ | 662,182 | ||||
| | | | | | | | | | | |
| | | | | | | | | | | |
| | | | | | | | | | | |
|
(c) | |||||||||
Accumulated depreciation (b): |
||||||||||
Balance, beginning of year |
$ |
96,852 |
$ |
87,801 |
$ |
77,643 |
||||
Addition: Depreciation |
15,689 | 14,247 | 12,680 | |||||||
Deduction: Accumulated depreciation related to properties sold/conveyed |
(3,588 | ) | (5,196 | ) | (2,522 | ) | ||||
| | | | | | | | | | | |
Balance, end of year |
$ | 108,953 | $ | 96,852 | $ | 87,801 | ||||
| | | | | | | | | | | |
| | | | | | | | | | | |
| | | | | | | | | | | |
- (b)
- Includes
properties held-for-sale in 2015.
- (c)
- The aggregate cost of the properties is approximately $13,260 higher for federal income tax purposes at December 31, 2017.
F-47