Attached files
Table of Contents
UNITED STATES
SECURITIES AND EXCHANGE COMMISSION
Washington, DC 20549
FORM 10-K
(Mark One)
| x | ANNUAL REPORT PURSUANT TO SECTION 13 OR 15(d) OF THE SECURITIES EXCHANGE ACT OF 1934 |
For the fiscal year ended March 31, 2011
or
| ¨ | TRANSITION REPORT PURSUANT TO SECTION 13 OR 15(d) OF THE SECURITIES EXCHANGE ACT OF 1934 |
Commission File Number 0-22982
NAVARRE CORPORATION
(Exact name of registrant as specified in its charter)
| Minnesota | 41-1704319 | |
| (State or other jurisdiction of incorporation or organization) |
(IRS Employer Identification No.) |
7400 49th Avenue North, Minneapolis, MN 55428
(Address of principal executive offices)
(763) 535-8333
(Registrant’s telephone number, including area code)
Securities registered pursuant to Section 12(b) of the Act:
| Title of each class |
Name of each exchange on which registered | |
| Common Stock, No par value | The NASDAQ Global Market |
Securities registered pursuant to Section 12(g) of the Act:
None
Indicate by check mark if the registrant is a well-known seasoned issuer, as defined in Rule 405 of the Securities Act. Yes ¨ No x
Indicate by check mark if the registrant is not required to file reports pursuant to Section 13 or Section 15(d) of the Act. Yes ¨ No x
Indicate by check mark whether the registrant (1) has filed all reports required to be filed by Section 13 or 15(d) of the Securities Exchange Act of 1934 during the preceding 12 months (or for such shorter period that the registrant was required to file such reports), and (2) has been subject to such filing requirements for the past 90 days. Yes x No ¨
Indicate by check mark whether the registrant has submitted electronically and posted on its corporate Web site, if any, every Interactive Data File required to be submitted and posted pursuant to Rule 405 of Regulation S-T (§ 229.405 of this chapter) during the preceding 12 months (or for such shorter period that the registrant was required to submit and post such files). Yes ¨ No ¨
Indicate by check mark if disclosure of delinquent filers pursuant to Item 405 of Regulation S-K is not contained herein, and will not be contained, to the best of registrant’s knowledge, in definitive proxy or information statements incorporated by reference in Part III of this Form 10-K or any amendment to this Form 10-K. x
Indicate by check mark whether the registrant is a large accelerated filer, an accelerated filer, a non-accelerated filer, or a smaller reporting company. See the definitions of “large accelerated filer,” “accelerated filer” and “smaller reporting company” in Rule 12b-2 of the Exchange Act. (Check one):
| Large accelerated filer | ¨ | Accelerated filer | x | |||
| Non-accelerated filer | ¨ (Do not check if a smaller reporting company) | Smaller reporting company | ¨ | |||
Indicate by check mark whether the registrant is a shell company (as defined in Rule 12b-2 of the Act). Yes ¨ No x
The aggregate market value of the registrant’s Common Stock, no par value per share, held by non-affiliates of the registrant as of September 30, 2010 was approximately $87,610,300 (based on the closing price of such stock as quoted on The NASDAQ Global Market of $2.60 on such date).
The number of shares outstanding of the registrant’s Common Stock, no par value per share, was 36,582,605 as of June 8, 2011.
DOCUMENTS INCORPORATED BY REFERENCE
Part III incorporates information by reference to portions of the registrant’s Proxy Statement for the 2011 Annual Meeting of Shareholders, which the Company expects to file with the Securities and Exchange Commission (“SEC”) within 120 days after the fiscal year end.
Table of Contents
FORM 10-K
TABLE OF CONTENTS
2
Table of Contents
PART I
Overview
Navarre Corporation (the “Company” or “Navarre”) is a distributor and provider of complete logistics solutions to traditional and internet-based retailers. Our solutions support both direct-to-consumer (“DTC”) and business-to-business (“B2B”) sales channels. Additionally, we are a publisher of computer software.
Since our founding in 1983, we have established distribution relationships with major retailers including Best Buy, Wal-Mart/Sam’s Club, Costco Wholesale Corporation, Staples, Office Depot, OfficeMax, Target, Apple and Amazon, and we distribute to nearly 17,000 retail and distribution center locations throughout the United States and Canada. We believe our established relationships throughout the supply chain permit us to offer products to our internet-based and retail customers and to provide our vendors access to broad retail channels. We are expanding the business services we offer in order to participate in the growing revenue streams resulting from e-commerce and fulfillment services.
Information About Our Segments
Our business operates through two business segments — distribution and publishing.
Distribution. Through our distribution business, we distribute computer software, consumer electronics and accessories, video games and home videos, and provide fee-based logistical services. The distribution business focuses on providing a range of value-added services, including vendor-managed inventory, electronic and internet-based ordering and gift card fulfillment. Our vendors include Symantec Corporation, Kaspersky Lab, Inc., Roxio (a division of Sonic Solutions), Webroot Software, Inc., Nuance Communications, Inc., McAfee, Inc., and our own publishing business.
Publishing. Through our publishing business we own or license various computer software brands. Our publishing business packages, brands, markets and sells directly to consumers, retailers, third party distributors and our distribution business. Our publishing business currently consists of Encore Software, Inc. (“Encore”).
Encore, which we acquired in July 2002, publishes a variety of software products for the PC and Mac platforms. These products fall mainly into the print, personal productivity, education, family entertainment, and home and landscape architectural design software categories. Titles include The Print Shop, Print Master, Advantage, Mavis Beacon Teaches Typing, Punch Home Design, H&R Block, Bicycle and Hoyle PC Gaming. In addition to retail publishing, Encore also sells directly to consumers through its e-commerce websites.
On May 17, 2010, Encore completed the acquisition of substantially all of the assets of Punch!, a leading provider of home and landscape architectural design software in the United States. The acquisition of Punch! expanded our content ownership and our strategy to enhance gross margins.
We sold FUNimation Productions, Ltd. (“FUNimation”), a leading anime content provider, on March 31, 2011. All results of operations, assets and liabilities of FUNimation are classified as discontinued operations for all periods presented, and the consolidated financial statements, including the notes, have been reclassified to reflect such segregation for all periods presented (see further disclosure in Note 3 to our consolidated financial statements).
In fiscal 2009, a former component of our publishing business, BCI Eclipse Company, LLC (“BCI”), began winding down its licensing operations related to budget home video, and the wind-down was completed during the fourth quarter of fiscal 2010.
Distribution Markets
Computer Software
According to The NPD Group, the leading North American provider of consumer and retail market research information for manufacturers and retailers, the computer software industry achieved $3.1 billion in sales for the calendar year ended December 31, 2010 compared to $2.9 billion in 2009. During fiscal 2011, we distributed approximately $390.3 million of software product. Despite the increase in the software industry, we experienced a sales decrease during this time period due to decreased retail demand for the software products we currently distribute.
3
Table of Contents
We presently have relationships with computer software publishers such as Symantec Corporation, Kaspersky Lab, Inc., Nuance Communications, Inc., Roxio (a division of Sonic Solutions) and Webroot Software, Inc. These relationships are important to our distribution business and during the fiscal year ended March 31, 2011, each of these publishers accounted for more than $30.0 million of software revenues. In the case of Symantec, net sales accounted for approximately $85.8 million, $102.9 million and $104.0 million in the fiscal years ended March 31, 2011, 2010 and 2009, respectively.
We have agreements in place with each of the vendors whose products we distribute, but, in most instances, such agreements are short-term in nature and may be cancelled without cause and upon short notice, typically 30 days. The agreements typically cover the right to distribute in the United States and Canada, but do not restrict the vendors from distributing their products through other distributors or directly to retailers and do not guarantee product availability to us for distribution. These agreements allow us to purchase the vendors’ products at a wholesale price and to provide various distribution and fulfillment services in connection with the vendors’ products. We believe these arrangements are standard for such vendors and are essentially operational requirements.
Video Games
According to The NPD Group, sales in the video game industry were $17.5 billion for the calendar year ended December 31, 2010 compared to $19.3 billion in 2009. During fiscal 2011, we distributed approximately $27.5 million of video game product. According to industry sources, the installed base of video game consoles in North America is expected to grow to approximately 335.4 million users by 2015 compared to 201.4 million users in December 2010.
Retailers concentrated on a few major releases, most of which were distributed direct to retail by major studios during fiscal year 2011.
Our relationships with video game vendors such as City Interactive USA, Inc., LucasArts Entertainment Company, LLC, Yoostar Entertainment Group, Inc. and Popcap Games, Inc. are important to this category of our distribution business.
Home Video
According to The Digital Entertainment Group, U.S. home video industry sales totaled $18.8 billion for the calendar year ended December 31, 2010 compared to $19.4 billion in 2009. During fiscal 2011, we distributed approximately $41.9 million of home video product. As the home video category shifts away from physical rentals and purchases to downloadable or digital copies of home video, we anticipate we will see a decline in this category of our distribution business.
Our relationships with Digital1Stop, Music Box Films, Magnolia Pictures and Oscilloscope Laboratories are important to our home video distribution business.
Consumer Electronics and Accessories
During fiscal 2011, we distributed approximately $31.1 million of consumer electronics and accessories product. Our sales increase in the consumer electronics and accessories category during fiscal 2011, primarily in the fashion and technology lines, represent our focus on products involved in serving the growing mobile electronics and tablet computing markets.
Customers
Since our founding in 1983, we have established relationships with retailers across mass merchant, specialty and wholesale club channels, including Best Buy, Wal-Mart/Sam’s Club, Costco Wholesale Corporation, Staples, Office Depot, OfficeMax, Target, Apple and Amazon. We annually sell and distribute products to nearly 17,000 retail and distribution center locations throughout the United States and Canada. While a significant portion of our revenue is generated from these major retailers, we also supply products to smaller independent retailers and through our B2B site located at www.navarre.com. See further disclosure in Part I, Item 1. – Business – Navarre’s Distribution Business Model: E-Commerce. Through these sales channels, we seek to ensure a broad reach of product throughout North America in a cost-efficient manner. References to our website are not intended to and do not incorporate information on the website into this Annual Report.
In each of the past several years, we have had a small number of customers that each accounted for 10% or more of our net sales. During the fiscal years ended March 31, 2011, 2010 and 2009, sales to two customers, Best Buy and Wal-Mart/Sam’s Club, accounted for approximately 33% and 17%, 34% and 19%, and 35% and 16%, respectively, of our total net sales. Substantially all of the
4
Table of Contents
products we distribute to these customers are supplied on a non-exclusive basis under arrangements that may be cancelled without cause and upon short notice. These arrangements do not include such material terms as purchase price of the goods purchased but rather principally address operational requirements of the transactions. None of our retail customers are required to make minimum purchases, including our largest customers — Best Buy and Wal-Mart/Sam’s Club. Generally, our customers have full right of return of our products.
Navarre’s Distribution Business Model
Vendor Relationships
We view our vendors as customers and work to manage retail relationships to make their business easier and more productive. By doing so, we believe our reputation as a service-oriented organization has helped us expand and retain our vendor relationships with such companies as: Symantec Corporation, Kaspersky Lab, Inc., Roxio (a division of Sonic Solutions), Webroot Software, Inc., Nuance Communications, Inc., and McAfee, Inc.
Furthermore, our dedication to smaller, second-tier vendors has helped to complement our vendor roster. We provide these vendors the opportunity to access shelf space and assist in the solicitation, logistics, promotion and management of products that they otherwise may be unable to obtain. We also conduct one-on-one meetings with smaller vendors to give them the opportunity to establish crucial business relationships with our retail customers.
Retail Services
Along with the value-added sales functions we provide to vendors, we also have the ability to customize shipments to individual customers. With respect to certain customers, we provide products on a consignment basis, which allows the vendors of these products to receive placement at retail while minimizing inventory costs to our customers, and in some cases to Navarre. In the case of the warehouse club channel, we may “pre-sticker” products, based on the vendor/customer preference. We assemble creative marketing programs, which include pallet programs, product bundles and specialized packaging. Our marketing and creative services department designs and produces a variety of advertising vehicles including in-store flyers, direct mail pieces and magazine/newspaper ads, as well as free standing displayers for retail locations.
We are committed to offering first-rate information flow for all vendors. We understand the importance of sharing sell-through, inventory, sales forecasts, promotional forecasts, inventory item status and data with the respective vendor. We provide the aforementioned information via a secure online portal for vendors. We also accommodate specialized reporting requests for our vendors, to assist in the management of their business.
E-Commerce
We continue to expand our focus on e-commerce by providing fee-based logistical and distribution services for the internet-based retail channel. Additionally, we have a B2B website, located within www.navarre.com, which offers another means of fulfilling our customers’ orders. References to our website are not intended to and do not incorporate information on the website into this Annual Report.
Warehouse Systems
A primary focus of our distribution business is logistics and supply chain management. As customer demands become more sophisticated, we have continued to update our technology. With our returns processing system, we process returns and issue both credit and vendor deductions efficiently and timely. We believe our inventory system offers adequate in-stock levels of product, on-time arrivals of product to the customer, inventory management and acceptable return processing rates, thereby strengthening our customer relationships.
Navarre’s Publishing Business Model
Encore
In July 2002, we acquired Encore, a publisher of computer software. Encore focuses on retail and DTC sales by marketing its licensed and owned content. The benefit to our licensed vendors is that they can focus on their core competencies of content and brand development. Encore publishes leading titles in the desktop publishing, family entertainment, education, home and landscape architectural design and value software categories, including: The Print Shop, Print Master, Advantage, Mavis Beacon Teaches Typing, Punch Home Design, H&R Block, Bicycle and Hoyle PC Gaming products. Encore has a North American licensing agreement with Riverdeep, Inc. (“Riverdeep”) for the sales and marketing of Riverdeep’s interactive products in the print and productivity
5
Table of Contents
markets, which includes all products published under the Broderbund brand. Encore also has exclusive licensing agreements with H&R Block in Canada and The United States Playing Card Company, Inc.
On May 17, 2010, Encore completed the acquisition of substantially all of the assets of Punch!, a leading provider of home and landscape architectural design software in the United States. The acquisition of Punch! expanded our content ownership and our strategy to enhance gross margins.
FUNimation
We sold FUNimation Productions, Ltd. (“FUNimation”), a leading anime content provider, on March 31, 2011. All results of operations, assets and liabilities of FUNimation are classified as discontinued operations for all periods presented, and the consolidated financial statements, including the notes, have been reclassified to reflect such segregation for all periods presented (see further disclosure in Note 3 to our consolidated financial statements).
BCI
In November 2003, we acquired BCI, a provider of niche home video and audio products. In fiscal 2009, BCI began winding down its licensing operations related to budget home video and the wind-down was completed during the fourth quarter of fiscal 2010.
Competition
All aspects of our business are highly competitive. Our competitors include other national and regional businesses, as well as some suppliers that sell directly to retailers. Certain of these competitors have substantially greater financial and other resources than we do. Our ability to effectively compete in the future depends upon a number of factors, including our ability to: obtain national distribution contracts; obtain publishing rights with various rights holders and brand owners; maintain our margins and volume; expand our sales through a varied range of products and personalized services; anticipate changes in the marketplace including technological developments and consumer interest in our products; and maintain operating expenses at an appropriate level.
We face competition from a number of distributors including Ingram Micro, Inc., Ingram Entertainment, SPA, Inc., Tech Data Corporation, D&H Distribution and Activision, as well as from manufacturers and publishers that sell directly to retailers. Encore’s competitors include: Topics Entertainment, Nova/Avanquest, Valusoft, and Phantom EFX.
We believe competition in all of our businesses will remain intense and that the keys to our growth and profitability include: (i) superior customer service, (ii) continued focus on improvements and operating efficiencies, (iii) the ability to license and develop products, and (iv) the ability to attract desirable content and additional suppliers, studios and software publishers.
Backlog
Because a substantial portion of our products are shipped in response to orders, we do not maintain any significant backlog.
Environmental Matters
We do not anticipate any material effect on our capital expenditures, earnings or competitive position due to compliance with government regulations involving environmental matters.
Employees
As of March 31, 2011, we had 413 employees, including 114 in administration, finance, merchandising and licensing, 69 in sales and marketing and 230 in production and distribution. These employees are not subject to collective bargaining agreements and are not represented by unions. We believe we have good relations with our employees.
6
Table of Contents
Capital Resources — Financing
See further disclosure in Part II, Item 7. Management’s Discussion and Analysis of Financial Condition and Results of Operations — Liquidity and Capital Resources.
Available Information
We also make available, free of charge, in the “Investors — SEC Filings” section of our website, www.navarre.com, annual, quarterly and current reports (and amendments thereto) that we may file or furnish to the SEC pursuant to Sections 13(a) or 15(d) of Securities Act of 1934 as soon as reasonably practicable after our electronic filing. In addition, the SEC maintains a website containing these reports that can be located at http://www.sec.gov. These reports may also be read and copied at the SEC’s Public Reference Room at 100 Fifth Street, NE, Washington, D.C. 20549. Information on the operation of the Public Reference Room may be obtained by calling the SEC at 1-800-SEC-0300. References to our website are not intended to and do not incorporate information on the website into this Annual Report.
Executive Officers of the Company
The following table sets forth our executive officers and certain management as of June 9, 2011:
| Name |
Age |
Position | ||
| J. Reid Porter |
62 | Interim President, Interim Chief Executive Officer and Chief Financial Officer | ||
| Ward Thomas |
39 | President of Business Services and Development | ||
| Joyce Fleck |
58 | President of Navarre Distribution | ||
| Calvin Morrell |
55 | President of Encore | ||
| Ryan F. Urness |
39 | General Counsel and Secretary |
J. Reid Porter has been Interim President, Interim Chief Executive Officer and Chief Financial Officer since April 6, 2011. Mr. Porter previously served as Executive Vice President and Chief Financial Officer since joining the Company in December 2005. From October 2001 to October 2004, Mr. Porter, served as Executive Vice President and Chief Financial Officer of IMC Global Inc., a leading producer and marketer of concentrated phosphate and potash for the agricultural industry. From 1998 to October 2001, Mr. Porter served as Vice President and partner of Hidden Creek Industries and Chief Financial Officer of Heavy Duty Holdings, partnerships in the automotive-related and heavy-duty commercial vehicle industries, respectively. Previously, he held executive positions at Andersen Windows, Onan Corporation and McGraw-Edison Company, Inc.
Ward Thomas has been President of Business Services and Development since August 2010. For three years prior, he served as Senior Director of North America Consumer Sales at Trend Micro Incorporated, a Tokyo-based leader in network antivirus and internet content security software and services. From 2005 to 2007, Mr. Thomas was Senior Vice President of Sales and Operations at FUNimation Entertainment. Previous to that time, he spent eight years as an executive in Navarre’s distribution business.
Joyce Fleck has been President of Navarre Distribution since March 2008. She previously served as the Vice President of Sales and Marketing since July 2005. Prior to this, Ms. Fleck served as Vice President of Marketing since January 2000. She joined the Company in May 1999 as Director of Marketing. Prior to joining Navarre she held divisional marketing and merchandising positions and senior buying positions at The Musicland Group and Grow Biz International.
Calvin Morrell has been the President of Encore since joining the Company in April 2008. Prior to joining Navarre, Mr. Morrell was responsible for sales, marketing, business development and operations at Macrovision and TryMedia. Mr. Morrell’s previous experience also includes Vice President of Marketing at Interplay. Mr. Morrell began his career at IBM where he worked for 18 years holding a number of positions, including Director of IBM Multimedia Studios.
Ryan F. Urness has been General Counsel of Navarre since July 2004 and Secretary of Navarre since May 2004. He previously served as Assistant Secretary of Navarre since February 2004 and as Corporate Counsel since January 2003. Prior to joining Navarre, a significant portion of Mr. Urness’ efforts were engaged in various matters for the Company as outside legal counsel at Winthrop & Weinstine, P.A. Mr. Urness is a graduate of the University of St. Thomas and William Mitchell College of Law.
7
Table of Contents
FORWARD-LOOKING STATEMENTS / RISK FACTORS
We make written and oral statements from time to time regarding our business and prospects, such as projections of future performance, statements of management’s plans and objectives, forecasts of market trends, and other matters that are forward-looking statements within the meaning of Section 27A of the Securities Act of 1933 and Section 21E of the Securities Exchange Act of 1934. Statements containing the words or phrases “will likely result,” “are expected to,” “will continue,” “is anticipated,” “estimates,” “projects,” “believes,” “expects,” “anticipates,” “intends,” “target,” “goal,” “plans,” “objective,” “should” or similar expressions identify forward-looking statements, which may appear in documents, reports, filings with the SEC, including this Annual Report, news releases, written or oral presentations made by officers or other representatives made by us to analysts, shareholders, investors, news organizations and others and discussions with management and other representatives of us. For such statements, we claim the protection of the safe harbor for forward-looking statements contained in the Private Securities Litigation Reform Act of 1995.
Our future results, including results related to forward-looking statements, involve a number of risks and uncertainties. No assurance can be given that the results reflected in any forward-looking statements will be achieved. Any forward-looking statement made by or on behalf of us speaks only as of the date on which such statement is made. Our forward-looking statements are based on assumptions that are sometimes based upon estimates, data, communications and other information from suppliers, government agencies and other sources that may be subject to revision. Except as required by law, we do not undertake any obligation to update or keep current either (i) any forward-looking statement to reflect events or circumstances arising after the date of such statement, or (ii) the important factors that could cause our future results to differ materially from historical results or trends, results anticipated or planned by us, or which are reflected from time to time in any forward-looking statement which may be made by or on behalf of us.
In addition to other matters identified or described by us from time to time in filings with the SEC, there are several important factors that could cause our future results to differ materially from historical results or trends, results anticipated or planned by us, or results that are reflected from time to time in any forward-looking statement that may be made by or on behalf of us. Some of these important factors, but not necessarily all important factors, include the following:
Risks Relating to Our Business and Industry
We derive a substantial portion of our total net sales from two customers. A reduction in sales to either of these customers, or another significant customer, could have a material adverse effect on our net sales and profitability.
For the fiscal year ended March 31, 2011, net sales to Best Buy and Wal-Mart/Sam’s Club, represented approximately 33% and 17%, respectively, of our total net sales, and, in the aggregate, approximately 50% of our total net sales. For the fiscal year ended March 31, 2010, net sales to Best Buy and Wal-Mart/Sam’s Club accounted for approximately 34% and 19%, respectively, of our total net sales, and, in the aggregate, approximately 53% of our total net sales. For the fiscal year ended March 31, 2009, net sales to Best Buy and Wal-Mart/Sam’s Club accounted for approximately 35% and 16%, respectively, of our total net sales, and, in the aggregate, approximately 51% of our total net sales. Substantially all of the products we distribute to these customers are supplied on a non-exclusive basis under arrangements that may be cancelled without cause and upon short notice. These arrangements do not include such material terms as purchase price of the goods purchased but rather principally address operational requirements of the transactions. None of our retail customers are required to make minimum purchases, including our largest customers — Best Buy and Wal-Mart/Sam’s Club. If we are unable to continue to sell our products to either of these customers, are unable to maintain our sales to these customers at current levels and cannot find other customers to replace these sales, or we receive a significant amount of returns from these customers, there would be an adverse impact on our net sales and profitability. We believe sales to these customers will continue to represent a significant percentage of our total net sales and there can be no assurance that we will continue to receive a significant amount of revenue from sales to any specific customer.
The loss of a significant vendor or manufacturer or a decline in the popularity of its products could negatively affect our product offerings and reduce our net sales and profitability.
A significant portion of net sales in recent years has been due to sales of computer software provided by software publishers such as Symantec Corporation and Kaspersky Lab, Inc. Symantec products accounted for approximately $85.8 million, $102.9 million and $104.0 million in net sales in the fiscal years ended March 31, 2011, 2010 and 2009, respectively. We have agreements in place with each of the vendors whose products we distribute, but, in most instances, such agreements are short-term in nature and may be cancelled without cause and upon short notice, typically 30 days. The agreements typically cover the right to distribute in the United States and Canada, but do not restrict the vendors from distributing their products through other distributors or directly to retailers and
8
Table of Contents
do not guarantee product availability to us for distribution. These agreements allow us to purchase the vendors’ products at a wholesale price and to provide various distribution and fulfillment services in connection with the vendors’ products. We believe these arrangements are standard for such vendors and are essentially operational requirements. If we were to lose our right to distribute products of any of the above computer software publishers or the popularity of such product were to decrease, our net sales and profitability would be adversely impacted.
Our future growth and success depends partly upon our ability to procure and renew popular product distribution agreements and to sell the underlying products. There can be no assurance that we will enter into new distribution agreements or that we will be able to sell products under existing distribution agreements. Further, our current distribution agreements may be terminated on short notice. The loss of a significant vendor could negatively affect our product offerings and, accordingly, our net sales. Similarly, a decrease in customer demand for such products could negatively affect our net sales.
Technology developments, particularly software as a service application, electronic transfer and downloading, could adversely affect our net sales, margins and results of operations.
The majority of our products have traditionally been marketed and delivered on a physical delivery basis. If these products continue to be heavily marketed and delivered through software as a service applications (SaaS), on-demand offerings or technology transfers, such as electronic downloading through the internet or otherwise, then our retail and wholesale distribution business could be negatively impacted. As electronic transfer, on-demand and manufacturer software service applications grow, competition will continue to intensify and could negatively impact our net sales and margins. Furthermore, we may be required to spend significant capital to enter or participate in these delivery channels, or it may not be feasible for us to participate in these delivery channels if they are developed without the utilization of traditional distribution and retail structures. If we are unable to develop necessary vendor and customer relationships to facilitate entry into these markets or delivery methods or if the terms of these arrangements are not as favorable as those related to our physical product sales, our business may be materially harmed.
Our market is subject to rapid technological change and to compete we must continually enhance our systems to comply with evolving standards.
To remain competitive, we must continue to enhance and improve the responsiveness, functionality and features of our services and the underlying infrastructure. If we are unable to adapt to changing market conditions, client requirements or emerging industry standards, our business could be adversely affected. The internet and e-commerce environments are characterized by rapid technological change, changes in user requirements and preferences, frequent new product and service introductions embodying new technologies and the emergence of new industry standards and practices that could render our technology and systems obsolete. Our success will depend, in part, on our ability to both internally develop and license leading technologies to enhance our existing services and to develop new services. We must continue to address the increasingly sophisticated and varied needs of our clients and respond to technological advances and emerging industry standards and practices on a cost-effective and timely basis. The development of proprietary technology involves significant technical and business risks. We may fail to develop new technologies effectively or to adapt our proprietary technology and systems to client requirements or emerging industry standards.
Our revenues are dependent on consumer preferences and demand, which can change at any time.
Our business and operating results depend upon the appeal of product concepts and programming to consumers, including the trends in the toy, game and entertainment businesses. A decline in the popularity of existing products or the failure of product concepts to achieve and sustain market acceptance could result in reduced overall revenues, which could have a material adverse effect on our financial condition and results of operations. Consumer preferences with respect to entertainment are continuously changing, are difficult to predict and can vary over time. There can be no assurance that:
| • | any of the current product concepts will continue to be popular for any significant period of time; |
| • | any new product concepts will achieve commercial acceptance; or |
| • | any product’s life cycle will be sufficient to permit adequate profitability to recover license advances, guarantees, royalties, development, marketing and other costs. |
Our failure to successfully anticipate, identify and react to consumer preferences could have a material adverse effect on revenues, profitability and results of operations. In addition, changes in consumer preferences may cause our revenues and net income to vary significantly between comparable periods.
A continued deterioration in the businesses or markets of significant customers, could harm our business.
During weak economic times there is an increased risk that certain of our customers will, among other things, reduce orders, delay payment for product purchased, or increase product returns. Our revenues could negatively be affected by a number of factors, including the following:
| • | the credit available to our customers; |
| • | the opening and closing of retail stores; |
| • | product marketing and promotional activities; and |
| • | general economic changes affecting the buying pattern of consumers, particularly those changes affecting consumer demand for our products. |
In addition, if a customer files for bankruptcy, we may be required to forego collection of pre-petition amounts owed and to repay amounts remitted to us during the 90-day preference period preceding the filing. The bankruptcy laws, as well as specific circumstances of each bankruptcy, may limit our ability to collect pre-petition amounts. Although we believe that we have sufficient reserves to cover our exposure resulting from anticipated customer difficulties, bankruptcies or defaults, we can provide no assurance that such reserves will be adequate. If they are not adequate, our business, operating results and financial condition could be adversely affected.
Our business is seasonal and variable in nature and, as a result, the level of sales and profitability during our peak season could adversely affect our results of operations and liquidity.
Traditionally, our third quarter (October 1-December 31) has accounted for our largest quarterly revenue figures and a substantial portion of our earnings. Our third quarter accounted for 30.0%, 25.4% and 27.6% of our net sales for the fiscal years ended March 31,
9
Table of Contents
2011, 2010 and 2009, respectively. As a distributor of products ultimately sold to consumers, our business is affected by the pattern of seasonality common to other suppliers of retailers, particularly during the holiday season. Because of this seasonality, if we or our customers experience a weak holiday season or poor weather conditions, or if we provide price protection for sales during the holiday season or decide to increase our inventory levels to meet anticipated customer demand, our financial results and liquidity could be negatively affected. Our borrowing levels and inventory levels typically increase substantially during the holiday season.
Growth of our non-U.S. sales and operations could subject us to additional risks that could harm our business.
Recently we have generated increasing amounts of sales outside of the Unites States, mainly in connection with our Canadian operations. Although increasing in number, we have a limited number of customers in Canada. The majority of the sales and purchasing activity related to these customers results in receivables and accounts payables denominated in Canadian dollars. These transactions expose us to foreign currency exchange risks because gain or loss on these activities is a function of the foreign exchange rate, over which we have no control. In addition, our non-U.S. operations are subject to a variety of risks, which could cause fluctuations in our results. These additional risks include, but are not limited to:
| • | compliance with foreign regulatory and market requirements; |
| • | variability of foreign economic, political and labor conditions; |
| • | changing restrictions imposed by regulatory requirements, tariffs or other trade barriers or by U.S. import and export laws; |
| • | longer accounts receivable payment cycles; |
| • | potentially adverse tax consequences; |
| • | difficulties in protecting intellectual property; |
| • | burdens of complying with foreign laws; and |
| • | as we generate cash flow in non-U.S. jurisdictions, we may experience difficulty transferring such funds to the U.S. in a tax efficient manner. |
Any one or more of these factors could have an adverse effect on our business, financial condition and operating results.
Pending SEC investigation or litigation may subject us to significant costs, judgments or penalties and could divert management’s attention.
Since 2006, we have been the subject of a non-public investigation by the SEC. The SEC has not provided us with notice asserting that any violations of the securities laws have occurred, but there can be no assurance as to the outcome of this investigation. We are also involved in a number of litigation matters and there is no assurance that the outcome in any proceeding will be favorable to us. Irrespective of the validity of the assertions made in these suits, or the positions asserted in these proceedings or any final resolution in these matters, we could incur substantial costs and management’s attention could be diverted, either of which could adversely affect our business, financial condition or operating results.
We rely on insurance to mitigate some risks facing our business, and to the extent our insurance does not mitigate the risks facing our business or our insurers are unable to meet their obligations, our operating results may be negatively impacted.
We contract for insurance to cover certain potential risks and liabilities. It is possible that we may not be able to get enough insurance to meet our needs, may have to pay very high prices for the coverage we do get, have very high deductibles or may not be able to, or may choose not to, acquire any insurance for certain types of business risk. This could leave us exposed to potential claims. If we were found liable for a significant claim in the future, our operating results could be negatively impacted. Also, to the extent the cost of maintaining insurance increases, our operating results could be negatively affected. Additionally, we are subject to the risk that one or more of our insurers may become insolvent and would be unable to pay a claim that may be made in the future. There can be no assurance that our insurance will be adequate to protect us from pending and future claims. In addition, we are required to maintain insurance coverage under some of our agreements with our clients. If we are not able to or do not maintain the required insurance coverage, we could breach those agreements.
10
Table of Contents
Increased counterfeiting or piracy may negatively affect the demand for our home entertainment products.
Certain product categories that we sell can be adversely affected by counterfeiting, piracy and parallel imports, and also by websites and technologies that allow consumers to illegally download and access this content. Increased proliferation of these alternative access methods to these products could impair our ability to generate net sales and could cause our business to suffer.
We may not be able to successfully protect our intellectual property rights.
We rely on a combination of copyright, trademark and other proprietary rights laws to protect the intellectual property we license. Third parties may try to challenge the ownership of such intellectual property by us or our licensors. In addition, our business is subject to the risk of third parties infringing on our intellectual property rights or those of our licensors and producing counterfeit products. If we need to resort to litigation in the future to protect our intellectual property rights or those of our licensors, such litigation could result in substantial costs and diversion of resources and could have a material adverse effect on our business and competitive position.
Our failure to diversify our business could harm us.
We are continuing our efforts to diversify our business. This has placed, and will continue to place, demands on our personnel, as well as on our operational and financial infrastructure. To effectively manage our strategic initiatives, we will need to continue to expand, improve and adapt our personnel, operations, infrastructure and our financial and information management systems and continue to implement adequate controls. These enhancements and improvements are likely to be complex and could require significant operating expenses, capital expenditures and allocation of valuable management resources. We may also have to expand our management team by recruiting and employing additional experienced executives and employees. If we are unable to adapt our systems and business, put adequate controls in place and adapt our management team in a timely manner to accommodate our diversification, our business may be adversely affected.
11
Table of Contents
The loss of key personnel could affect the depth, quality and effectiveness of our management team. In addition, if we fail to attract and retain qualified personnel, the depth, quality and effectiveness of our management team and employees could be negatively affected.
We depend on the services of our key senior executives and other key personnel because of their experience in the distribution, publishing and licensing areas. The loss of the services of one or several of our key employees could result in the loss of customers or vendor relationships, or otherwise inhibit our ability to operate and grow our business successfully.
Our ability to enhance and develop markets for our current products and to introduce new products to the marketplace also depends on our ability to attract and retain qualified management personnel. We compete for such personnel with other companies and organizations, many of which have substantially greater capital resources and name recognition than we do. If we are not successful in recruiting or retaining such personnel, it could have a material adverse effect on our business.
If we fail to meet our significant working capital requirements or if our working capital requirements increase substantially, our business and prospects could be adversely affected.
As a distributor and publisher, we purchase and license products directly from manufacturers and content developers for resale to retailers. As a result, we have significant working capital requirements, principally to acquire inventory, procure licenses and finance accounts receivable. Our working capital needs will increase as our inventory, licensing activities and accounts receivable increase in response to growth and/or seasonality. In addition, license advances, prepayments to enhance margins, investments and inventory increases to meet customer requirements could increase our working capital needs. The failure to obtain additional financing or maintain working capital credit facilities on reasonable terms in the future could adversely affect our business. In addition, if the cost of financing is too expensive or not available, it could require a reduction in our distribution or publishing activities.
We rely upon bank borrowings and vendor credit and payment terms to fund our general working capital needs and it may be necessary for us to secure additional financing in the future depending upon the growth of our business and the possible financing of additional acquisitions. If we were unable to borrow under our credit facility, obtain acceptable vendor terms or were otherwise unable to secure sufficient financing on acceptable terms or at all, our future growth and profitability could be adversely affected.
Product returns or inventory obsolescence could reduce our sales and profitability or negatively impact our liquidity.
We maintain a significant investment in product inventory. Like other companies operating in our industry, product returns from our retail customers are significant when expressed as a percentage of revenues. Adverse financial or other developments with respect to a particular supplier or product could cause a significant decline in the value and marketability of our products, possibly making it difficult for us to return products to a supplier or recover our initial product acquisition costs. Under such circumstances, our sales and profitability, including our liquidity, could be adversely affected. We maintain a sales return reserve based on historical product line experience rates. There can be no assurance that our reserves will be adequate to cover potential returns.
We are subject to the risk that our inventory values may decline due to, among other things, changes in demand and that protective terms under our supplier agreements may not adequately cover the decline in values, which could result in lower gross margins or inventory write-downs.
The demand for products that we sell and distribute is subject to rapid technological change, new and enhanced product specification requirements, consumer preferences and evolving industry standards. These changes may cause our inventory to decline substantially in value or to become obsolete which may occur in a short period of time. We offer no assurance that price protection or inventory returnability terms may not change or be eliminated in the future, that unforeseen new product developments will not materially adversely affect our revenues or profitability or that we will successfully manage our existing and future inventories.
In our distribution business, we generally are entitled to receive a credit from certain suppliers for products returned to us based upon the terms and conditions with those suppliers, including maintaining a minimum level of inventory of their products and limitations on the amount of product that can be returned and/or restocking fees. If major suppliers decrease or eliminate the availability of price protection or inventory returnability to us, such a change in policy could lower our gross margins or cause us to record inventory write-downs. We are also exposed to inventory risk to the extent that supplier protections are not available on all products or quantities and are subject to time restrictions. In addition, suppliers may become insolvent and unable to fulfill their protection obligations to us. As a result, these policies do not protect us in all cases from declines in inventory value or product demand.
12
Table of Contents
In our publishing business, prices could decline due to decreased demand and, therefore, there may be greater risk of declines in our owned inventory value. To the extent that our publishing business has not properly reserved for inventory exposure or price reductions needed to sell remaining inventory, our profitability may suffer.
Further impairment in the carrying value of our assets could negatively affect our consolidated results of operations and net worth.
We recorded significant impairment charges to goodwill and other assets during the fiscal year ended March 31, 2009. We evaluate assets on the balance sheet whenever events or a change in circumstance indicates that their carrying value may not be recoverable. Materially different assumptions regarding the future performance of our businesses could result in additional other asset impairment charges which could negatively affect our operating results and potentially result in future operating losses.
We have significant credit exposure and negative product demand trends or other factors could cause us significant credit loss.
We provide credit to our customers for a significant portion of our net sales. We are subject to the risk that our customers will not pay for the products they have purchased. This risk may be increased with respect to goods provided under our consignment programs due to our lack of physical control over the inventory. This risk may increase if our customers experience decreases in demand for their products and services or become less financially stable due to adverse economic conditions or otherwise. If there is a substantial deterioration in the collectability of our receivables, our earnings and cash flows could be adversely affected.
In addition, from time to time, we may make royalty advances, or invest in, other businesses. These business or investment opportunities may not be successful, which could result in the loss of our invested capital.
We may not be able to adequately adjust our cost structure in a timely fashion in response to a decrease in net sales, which may cause our profitability to suffer.
A significant portion of our selling, general and administrative expense is comprised of personnel, facilities and costs of invested capital. If we were to experience additional declines in our net sales, we may not be able to exit facilities, reduce personnel, improve business processes, reduce inventory or make other significant changes to our cost structure without significant disruption to our operations or without significant termination and exit costs. Additionally, if management is not able to implement such actions in a timely manner, or at all, to offset a shortfall in net sales and gross profit, our profitability could suffer.
Our distribution and publishing businesses operate in highly competitive industries and compete with large national firms. Further competition, among other things, could reduce our sales volume and margins.
The distribution business is highly competitive. Our competitors in the distribution business include other national and regional distributors as well as suppliers that sell directly to retailers. These competitors include the distribution affiliates of Ingram Micro, Inc., Ingram Entertainment, SPA, Inc., Tech Data Corporation, D&H Distribution and Activision.
Our competitors in the publishing business include both independent national publishers as well as large international firms. These competitors include Topics Entertainment, Nova/Avanquest, Valusoft, and Phantom EFX. Certain of our competitors have substantially greater financial and other resources than we have. Our ability to compete effectively in the future depends upon a number of factors, including our ability to: obtain national distribution contracts and licenses with manufacturers/vendors; obtain publishing rights with various rights holders and brand owners; maintain our margins and volume; expand our sales through a varied range of products and personalized services; anticipate changes in the marketplace including technological developments and consumer interest in our products; and maintain operating expenses at an appropriate level. Our failure to perform adequately one or more of the foregoing may materially harm our business.
Competition in the home entertainment and multimedia products industries is intense and is often based on price. Distributors generally experience low gross profit margins and operating margins. Consequently, our distribution profitability is highly dependent upon achieving effective cost and management controls and maintaining sales volumes. A material decrease in our gross profit margins or sales volumes would harm our financial results.
13
Table of Contents
We depend on third party shipping and fulfillment companies for the delivery of our products.
We rely almost entirely on arrangements with third party shipping and fulfillment companies, principally UPS and Federal Express, for the delivery of our products. The termination of our arrangements with one or more of these third party shipping companies, or the failure or inability of one or more of these third party shipping companies to deliver products on a timely or cost efficient basis from suppliers to us, or products from us to our reseller customers or their end-user customers, would significantly disrupt our business and harm our reputation and net sales. Furthermore, an increase in amounts charged or the implementation of surcharges by these shipping companies could negatively affect our gross margins and earnings.
We subcontract a portion of our client services to third parties, and we are subject to various risks and liabilities if such subcontractors do not provide the subcontracted services or provide them in a manner that does not meet required service levels.
We currently, and may in the future, subcontract to one or more third parties a business services offering. Under the terms of our contracts with our business service clients we are liable to provide such subcontracted services and may be liable for the actions and omissions of such subcontractors. In the event our subcontractor fails to provide the subcontracted services in compliance with required services levels, or otherwise breaches its obligations, or discontinues its business, whether as the result of bankruptcy, insolvency or otherwise, we may be required to provide such services at a higher cost to us and may otherwise be liable for various costs and expenses related to such event. In addition, any such failure may damage our reputation and otherwise result in a material adverse affect upon our business and financial condition.
Developing software is complex, costly and uncertain and operational errors or defects in such products could result in liabilities and/or impair such products’ marketability.
We have expanded our software development activities. The process of developing new software and/or enhancing existing products is complex, costly and uncertain. Any failure by us to anticipate customers’ changing needs and emerging trends accurately could harm the value of our investment in software development activities. In connection with these activities, we must make long-term investments, develop or obtain appropriate intellectual property and commit resources before knowing whether our predictions will accurately reflect customer demand for our products. Failure to successfully develop and/or sell these products could result in the loss/impairment of our investment, which could negatively impact our results of operations.
In addition, existing and future products may develop operational problems or contain undetected defects or errors. If we do not discover such defects, errors, or other operational problems until after a product has been released and used by the customer, we may incur significant costs to correct such defects, errors, or other operational problems, including product liability claims or other contract liabilities to customers. Moreover, defects or errors in our products may result in claims for damages and questions regarding the integrity of the products, which could cause adverse publicity and impair their market acceptance.
We depend on a variety of systems for our operations, and a failure of these systems could disrupt our business and harm our reputation and net sales and negatively impact our results of operations.
We depend on a variety of systems for our operations. These systems support our operating functions, including inventory management, order processing, shipping, receiving and accounting. Certain of these systems are operated by third parties and their performance may be outside of our control. Any failures or significant downtime in our systems could prevent us from taking customer orders, printing product pick-lists, and/or shipping product. It could also prevent customers from accessing our price and product availability information.
From time to time we may acquire other businesses having information systems and records, which may be converted and integrated into our information systems. This can be a lengthy and expensive process that results in a material diversion of resources from other operations. As our needs for technology evolve, we may experience difficulty or significant cost in upgrading or significantly replacing our systems.
We also rely on the internet for a portion of our orders and information exchanges with our customers. The internet and individual websites can experience disruptions and slowdowns. In addition, some websites have experienced security breakdowns. Our website could experience material breakdowns, disruptions or breaches in security. If we were to experience a security breakdown, disruption or breach that compromised sensitive information, this could harm our relationship with our customers or suppliers or result in claims. Disruption of our website or the internet in general could impair our order processing or more generally prevent our customers and suppliers from accessing information, which could cause us to lose business.
14
Table of Contents
We believe customer information systems and product ordering and delivery systems, including internet-based systems, are becoming increasingly important in the distribution of our products and services. Although we seek to enhance our customer information systems by adding new features, we offer no assurance that competitors will not develop superior customer information systems or that we will be able to meet evolving market requirements by upgrading our current systems at a reasonable cost, or at all. Our inability to develop competitive customer information systems or upgrade our current systems could cause our business and market share to suffer.
Any future acquisitions or divestitures could result in disruptions to our business by, among other things, distracting management time and diverting financial resources. Further, if we are unsuccessful in integrating acquired companies into our business, it could materially and adversely affect our financial condition and operating results.
If we make acquisitions or divestitures, a significant amount of management’s time and financial resources may be required to complete the acquisition or divestiture and integrate the acquired business into our existing operations or divest a business from our operations. Even with this investment of management time and financial resources, an acquisition may not produce the revenue, earnings or business synergies anticipated. Acquisitions involve numerous other risks, including assumption of unanticipated operating problems or legal liabilities, problems integrating the purchased operations, technologies or products, diversion of management’s attention from our core businesses, adverse effects on existing business relationships with suppliers and customers, incorrect estimates made in the accounting for acquisitions and amortization of acquired intangible assets that would reduce future reported earnings (goodwill impairments), ensuring acquired companies’ compliance with the requirements of the Sarbanes-Oxley Act of 2002 and potential loss of customers or key employees of acquired businesses. We cannot assure you that if we make any future acquisitions, investments, strategic alliances, joint ventures or divest a component of our business, that such transactions will be completed in a timely manner or achieve anticipated synergies, that they will be structured or financed in a way that will enhance our business or creditworthiness or that they will meet our strategic objectives or otherwise be successful. In addition, we may not be able to secure the financing necessary to consummate future acquisitions, and future acquisitions and investments could involve the issuance of additional equity securities or the incurrence of additional debt, which could harm our financial condition or creditworthiness or result in dilution. Moreover, we may be unable to locate a suitable candidate with whom to accomplish an acquisition or divestiture, or may be unable to do so on terms favorable to us, which failure could negatively impact our profitability.
Interruption of our business or catastrophic loss at any of our facilities could lead to a curtailment or shutdown of our business.
We receive, manage, distribute and process returns of our inventory from a centralized warehouse and distribution facility that is located adjacent to our corporate headquarters. An interruption in the operation of or in the service capabilities at this facility as a result of equipment failure or other reasons could result in our inability to distribute products, which would reduce our net sales and earnings for the affected period. In the event of a stoppage at such facilities, even if only temporary, or if we experience delays as a result of events that are beyond our control, delivery times to our customers and our relationship with such customers could be severely affected. Any significant delay in deliveries to our customers could lead to increased returns or cancellations and cause us to lose future sales. Our facilities are also subject to the risk of catastrophic loss due to unanticipated events such as fires, explosions, violent weather conditions or other natural disasters. We may experience a shutdown of our facilities or periods of reduced production as a result of equipment failure, delays in deliveries or catastrophic loss, which could have a material adverse effect on our business, results of operations or financial condition.
Future terrorist or military actions could result in disruption to our operations or loss of assets.
Future terrorist or military actions, in the U.S. or abroad, could result in destruction or seizure of assets or suspension or disruption of our operations. Additionally, such actions could affect the operations of our suppliers or customers, resulting in loss of access to products, potential losses on supplier programs, loss of business, higher losses on receivables or inventory, or other disruptions in our business, which could negatively affect our operating results. We do not carry insurance covering such terrorist or military actions, and even if we were to seek such coverage and such coverage was available, the cost likely would not be commercially reasonable.
15
Table of Contents
If one or more jurisdictions successfully assert that we should collect or should have collected sales or other taxes on the sale of our merchandise over the internet, our business could be harmed.
The application of sales tax or other similar taxes to interstate and international sales over the internet is complex and evolving. One or more local, state or foreign jurisdictions may seek to impose past and future sales tax obligations on us or other out-of-state companies that engage in e-commerce. If one or more states or any foreign country successfully asserts that we should collect sales or other taxes on the sale of merchandise for which we are not currently collecting taxes, it could result in potentially material tax liability for past sales, decrease future sales and otherwise harm our business.
Our ability to use net operating loss carryforwards to reduce future tax payments may be limited.
As of March 31, 2011, we had estimated available net operating loss carry-forwards (“NOLs”) of $77.8 million for federal income tax purposes that begin to expire in 2029. Our ability to use these NOLs will be dependent on our ability to generate future taxable income and may expire before we generate sufficient taxable income.
Section 382 of the Internal Revenue Code (“Section 382”) imposes limitations on a corporation’s ability to utilize NOLs if it experiences an “ownership change.” In general terms, an ownership change may result from transactions increasing the ownership of certain shareholders in the stock of a corporation by more than 50 percentage points over a three-year period. In the event of an ownership change, utilization of our NOLs would be subject to an annual limitation under Section 382. Any unused NOLs in excess of the annual limitation may be carried over to later years.
We may be unable to refinance our debt facility.
We have the ability, subject to borrowing base requirements, to borrow up to $65.0 million under the revolving Credit Facility. We will need to refinance all or a portion of our indebtedness on or before the maturity date of our revolving Credit Facility (November 2012). Our ability to refinance our indebtedness or obtain additional financing will depend on, among other things:
| • | our financial condition at the time; |
| • | the amount of financing outstanding and lender requirements at the time; |
| • | restrictions in our credit agreement or other outstanding indebtedness; and |
| • | other factors, including the condition of the financial markets or the distribution and publishing markets. |
As a result, we may not be able to refinance any of our indebtedness on commercially reasonable terms, or at all. If we do not generate sufficient cash flow from operations, and additional borrowings or refinancings or proceeds of asset sales are not available to us, we may not have sufficient cash to enable us to meet all of our obligations.
Our credit agreement contains significant restrictions that limit our operating and financial flexibility.
Our credit agreement requires us to maintain specified financial ratios and includes other restrictive covenants. We may be unable to meet such ratios and covenants. Any of these restrictions may limit our ability to execute our business strategy. Moreover, if operating results fall below current levels, we may be unable to comply with these covenants. If that occurs, our lenders could accelerate our indebtedness, in which case we may not be able to repay all of our indebtedness.
We may be able to incur additional indebtedness, which could further exacerbate the risks associated with our current indebtedness level.
The level of our indebtedness could have important consequences. We and our subsidiary may be able to incur substantial additional indebtedness in the future. If we and our subsidiary incur additional indebtedness or other obligations, the related risks that we face could be magnified.
16
Table of Contents
Risks Relating to Our Common Stock
Our common stock price has been volatile. Fluctuations in our stock price could impair our ability to raise capital and make an investment in our securities undesirable.
The market price of our common stock has fluctuated significantly. During the period from April 1, 2010 to March 31, 2011, the last reported price of our common stock as quoted on The NASDAQ Global Market ranged from a low of $1.83 to a high of $2.65. We believe factors such as the market’s acceptance of our business and products, and the performance of our business relative to market expectations, as well as general volatility in the securities markets, could cause the market price of our common stock to fluctuate substantially. In addition, the stock markets have experienced price and volume fluctuations, resulting in changes in the market prices of the stock of many companies, which may not have been directly related to the operating performance of those companies. Fluctuations in our stock price could impair our ability to raise capital and could make an investment in our securities undesirable.
The exercise of outstanding warrants and options may adversely affect our stock price.
As of March 31, 2011, options and warrants to purchase 5,970,170 shares of our common stock were outstanding, of which 2,255,677 options and 1,596,001 warrants were exercisable as of that date. Our outstanding options and warrants are likely to be exercised at a time when the market price for our common stock is higher than the exercise prices of the options and warrants. If holders of these outstanding options and warrants sell the common stock received upon exercise, it may have a negative effect on the market price of our common stock.
Our anti-takeover provisions, our ability to issue preferred stock and our staggered board may discourage takeover attempts that could be beneficial for our shareholders.
We are subject to Sections 302A.671 (Control Share Acquisitions) and 302A.673 (Business Combinations) of the Minnesota Business Corporation Act, which may have the effect of limiting third parties from acquiring significant amounts of our common stock without our approval. These laws, among others, may have the effect of delaying, deferring or preventing a third party from acquiring us or may serve as a barrier to shareholders seeking to amend our articles of incorporation or bylaws. Our articles of incorporation also permit us to issue preferred stock, which could allow us to delay or block a third party from acquiring us. The holders of preferred stock could also have voting and conversion rights that could adversely affect the voting power of the holders of the common stock. Finally, our articles of incorporation and bylaws divide our board of directors into three classes that serve staggered, three-year terms. Each of these factors could make it difficult for a third party to effect a change in control of us. As a result, our shareholders may lose opportunities to dispose of their shares at the higher prices typically available in takeover attempts or that may be available under a merger or other proposal.
In addition, these measures may have the effect of permitting our current directors to retain their positions and place them in a better position to resist changes that our shareholders may wish to make if they are dissatisfied with the conduct of our business.
We currently do not intend to pay dividends on our common stock and, consequently, there will be no opportunity for our shareholders to achieve a return on their investment through dividend payments.
We currently do not plan to declare dividends on shares of our common stock in the foreseeable future. Further, the payment of dividends by us is restricted by our credit facility and loan agreements. Consequently, shareholders should not expect an opportunity to achieve a return on their investment through dividend payments.
Our directors may not be held personally liable for certain actions, which could discourage shareholder suits against them.
Minnesota law and our articles of incorporation and bylaws provide that our directors shall not be personally liable to us or our shareholders for monetary damages for breach of fiduciary duty as a director, with certain exceptions. These provisions may discourage shareholders from bringing suit against a director for breach of fiduciary duty and may reduce the likelihood of derivative litigation brought by shareholders on behalf of us against a director. In addition, our bylaws provide for mandatory indemnification of directors and officers to the fullest extent permitted by Minnesota law.
17
Table of Contents
Other Risks
Our business operates in a continually changing environment that involves numerous risks and uncertainties. It is not reasonable for us to itemize all of the factors that could affect us and/or the products and services or the distribution industry or the publishing industry as a whole. Future events that may not have been anticipated or discussed here could adversely affect our business, financial condition, results of operations or cash flows.
Thus, the foregoing is not a complete description of all risks relevant to our future performance, and the foregoing risk factors should be read and understood together with and in the context of similar discussions which may be contained in the documents that we file with the SEC in the future.
Item 1B. Unresolved Staff Comments
Not applicable.
Distribution
Located in the Minneapolis suburb of New Hope, Minnesota, our corporate headquarters consists of approximately 322,000 square feet of combined office and warehouse space situated on three contiguous properties. The leases for two of the properties expire on June 30, 2019 and the lease for the third property expires on February 29, 2016. These leased properties include approximately 44,000 square feet of office space; approximately 73,000 square feet of space utilized in the manufacturing and assembly of new products; and approximately 205,000 square feet of space devoted to warehousing, product picking and shipping.
In March, 2010, we began operations for a satellite distribution center in Toronto, Ontario which occupies 30,000 square feet of leased warehouse space. The lease for this space expires on February 28, 2015. Additionally, we operate a satellite sales office in Bentonville, Arkansas which occupies 2,000 square feet of leased office space. The lease for this space expires on February 28, 2013.
The present aggregate base monthly rent for all of our distribution and office facilities is approximately $167,000.
Publishing
Encore currently operates its offices out of approximately 13,000 square feet of leased office space located in Los Angeles, California. This lease currently provides for base monthly payments to be made in the amount of $27,000 and expires April 30, 2013. Encore also operates a call center in Cedar Rapids, Iowa which occupies 3,000 square feet of leased office space. The lease for this space expires on March 31, 2013 and currently provides for base monthly payments to be made in the amount of $3,000.
We believe our facilities are adequate for our present operations as well as for the incorporation of growth. We continually explore alternatives to certain of these facilities that could expand our capacities and enhance efficiencies, and we believe we can renew or obtain replacement or additional space, if required, on commercially reasonable terms.
See Note 16 to the consolidated financial statements.
Item 4. (Removed and Reserved)
18
Table of Contents
PART II
Item 5. Market for Registrant’s Common Equity, Related Shareholder Matters and Issuer Purchases of Equity Securities
Common Stock
Our common stock, no par value, is traded on The NASDAQ Global Market under the symbol “NAVR”. The following table presents the range of high and low closing sale prices for our stock for each period indicated as reported on The NASDAQ Global Market. Such prices reflect inter-dealer prices, do not include adjustments for retail mark-ups, markdowns or commissions and may not necessarily represent actual transactions.
| Quarter |
High | Low | ||||||||
| Fiscal 2011 |
Fourth |
$ | 2.23 | $ | 1.88 | |||||
| Third |
2.65 | 2.10 | ||||||||
| Second |
2.63 | 2.16 | ||||||||
| First |
2.25 | 1.83 | ||||||||
| Fiscal 2010 |
Fourth |
1.65 | 0.40 | |||||||
| Third |
2.28 | 1.53 | ||||||||
| Second |
2.96 | 2.03 | ||||||||
| First |
2.17 | 1.90 | ||||||||
Holders
At June 9, 2011, we had 586 common shareholders of record and an estimated 6,500 beneficial owners whose shares were held by nominees or broker dealers.
Dividend Policy
We have never declared or paid cash dividends on our common stock. We currently intend to retain all earnings for use in our business and do not intend to pay any dividends on our common stock in the foreseeable future.
Comparative Stock Performance
The following Performance Graph compares performance of our common stock on The NASDAQ Global Market of The NASDAQ Stock Market LLC (US companies), the NASDAQ Composite Index and the two Peer Group Indices described below. The graph compares the cumulative total return from March 31, 2006 to March 31, 2011 on $100 invested on March 31, 2006, assumes reinvestment of all dividends, and has been adjusted to reflect stock splits.
The New Peer Group Index below includes the stock performance of the following companies: Scholastic, Bluelinx Holdings, Beacon Roofing Supply, GSI Commerce, Take Two Interactive Software Inc., THQ, Inc., GTSI Corp, SED International, Ascent Media, Leapfrog Enterprises, CKX, Inc., Rosetta Stone and INX Inc. The Old Peer Group Index below includes the stock performance of the following companies: Handleman Company, Ingram Micro Inc., Tech Data Corp., and Take Two Interactive Software Inc. Our Peer Group Index was changed during fiscal 2011 to more closely align our Peer Group with our current operations.
19
Table of Contents
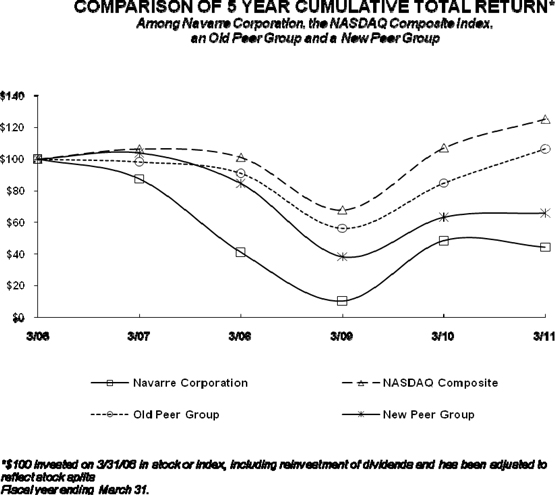
| 3/06 | 3/07 | 3/08 | 3/09 | 3/10 | 3/11 | |||||||||||||||||||
| Navarre Corporation |
$ | 100.00 | $ | 87.41 | $ | 41.03 | $ | 10.26 | $ | 48.48 | $ | 44.29 | ||||||||||||
| NASDAQ Composite |
$ | 100.00 | $ | 106.44 | $ | 101.14 | $ | 67.88 | $ | 107.06 | $ | 125.30 | ||||||||||||
| New Peer Group |
$ | 100.00 | $ | 103.97 | $ | 84.72 | $ | 38.44 | $ | 63.43 | $ | 66.00 | ||||||||||||
| Old Peer Group |
$ | 100.00 | $ | 98.29 | $ | 91.12 | $ | 56.40 | $ | 84.93 | $ | 106.57 | ||||||||||||
Source: Research Data Group, Inc.
Purchases of Equity Securities
We did not purchase any shares of our common stock during the fourth quarter of fiscal 2011.
Equity Compensation Plan Information
During fiscal 2011 we granted 910,000 options and awarded 383,500 restricted shares.
20
Table of Contents
The following table below presents certain information regarding our Equity Compensation Plans:
| Plan Category |
Number of securities to be issued upon exercise of outstanding options, warrants and rights (a) |
Weighted-average exercise price of outstanding options, warrants and rights (b) |
Number of
securities remaining available for future issuance under equity compensation plans (excluding securities reflected in column (a)) (c) |
|||||||||
| Equity compensation plans approved by security holders |
5,970,170 | $ | 3.59 | 2,588,490 | ||||||||
| Equity compensation plans not approved by security holders |
— | — | — | |||||||||
| Total |
5,970,170 | $ | 3.59 | 2,588,490 | ||||||||
Item 6. Selected Financial Data
The following selected financial data should be read in conjunction with Item 8, Financial Statements and Supplementary Data and related notes and Item 7, Management’s Discussion and Analysis of Financial Condition and Results of Operations, and other financial information appearing elsewhere in this Annual Report on Form 10-K. We derived the following historical financial information from our consolidated financial statements for the fiscal years ended March 31, 2011, 2010, 2009, 2008 and 2007 which have been audited by Grant Thornton LLP (in thousands, except per share data):
| Fiscal Years ended March 31, | ||||||||||||||||||||
| 2011 | 2010 | 2009 | 2008 | 2007 | ||||||||||||||||
| Statement of operations data (1) (2): |
||||||||||||||||||||
| Net sales |
$ | 490,897 | $ | 495,770 | $ | 599,059 | $ | 619,214 | $ | 607,493 | ||||||||||
| Gross profit, exclusive of depreciation and amortization |
65,168 | 68,044 | 49,601 | 75,197 | 82,422 | |||||||||||||||
| Income (loss) from operations |
5,954 | 11,538 | (28,024 | ) | 7,400 | 12,162 | ||||||||||||||
| Interest (expense) income, net |
(1,754 | ) | (2,240 | ) | (3,222 | ) | (3,591 | ) | (6,257 | ) | ||||||||||
| Other income (expense) |
(153 | ) | 788 | (1,194 | ) | 523 | (218 | ) | ||||||||||||
| Income (loss) from continuing operations |
4,047 | 10,086 | (32,440 | ) | 4,332 | 5,687 | ||||||||||||||
| Income tax benefit (expense) |
8,446 | 8,602 | (10,943 | ) | (2,133 | ) | (2,372 | ) | ||||||||||||
| Net income (loss) from continuing operations |
12,493 | 18,688 | (43,383 | ) | 2,199 | 3,315 | ||||||||||||||
| (Loss) gain on sale of discontinued operations, net |
(5,198 | ) | — | — | 4,892 | — | ||||||||||||||
| Income (loss) from discontinued operations, net |
3,888 | 4,184 | (45,051 | ) | 2,567 | 744 | ||||||||||||||
| Net income (loss) |
$ | 11,183 | $ | 22,872 | $ | (88,434 | ) | $ | 9,658 | $ | 4,059 | |||||||||
| Basic earnings (loss) per common share: |
||||||||||||||||||||
| Continuing operations |
$ | 0.34 | $ | 0.51 | $ | (1.20 | ) | $ | 0.06 | $ | 0.09 | |||||||||
| Discontinued operations |
(0.03 | ) | 0.12 | (1.24 | ) | 0.21 | 0.02 | |||||||||||||
| Net income (loss) |
$ | 0.31 | $ | 0.63 | $ | (2.44 | ) | $ | 0.27 | $ | 0.11 | |||||||||
| Diluted earnings (loss) per common share: |
||||||||||||||||||||
| Continuing operations |
$ | 0.34 | $ | 0.51 | $ | (1.20 | ) | $ | 0.06 | $ | 0.09 | |||||||||
| Discontinued operations |
(0.04 | ) | 0.11 | (1.24 | ) | 0.21 | 0.02 | |||||||||||||
| Net income (loss) |
$ | 0.30 | $ | 0.62 | $ | (2.44 | ) | $ | 0.27 | $ | 0.11 | |||||||||
| Weighted average shares outstanding: |
||||||||||||||||||||
| Basic |
36,446 | 36,285 | 36,207 | 36,105 | 35,786 | |||||||||||||||
| Diluted |
36,952 | 36,643 | 36,207 | 36,269 | 36,228 | |||||||||||||||
| Balance sheet data: |
||||||||||||||||||||
| Total assets |
$ | 173,866 | $ | 171,278 | $ | 183,122 | $ | 283,446 | $ | 288,225 | ||||||||||
| Short-term debt |
1,002 | 6,634 | 24,133 | 31,523 | 39,208 | |||||||||||||||
| Long-term debt |
— | — | — | 9,654 | 14,970 | |||||||||||||||
| Shareholders’ equity |
73,186 | 60,761 | 37,007 | 124,411 | 113,451 | |||||||||||||||
| (1) | Fiscal years 2008 and 2007 have been restated for discontinued operations related to the divestiture of NEM. |
| (2) | All periods have been restated for discontinued operations related to the sale of FUNimation. |
21
Table of Contents
Item 7. Management’s Discussion and Analysis of Financial Condition and Results of Operations
Overview
We are a distributor and provider of complete logistics solutions to traditional and internet-based retailers. Our solutions support both direct-to-consumer (“DTC”) and business-to-business (“B2B”) sales channels. Additionally, we are a publisher of computer software.
Since our founding in 1983, we have established distribution relationships with major retailers including Best Buy, Wal-Mart/Sam’s Club, Costco Wholesale Corporation, Staples, Office Depot, OfficeMax, Target, Apple and Amazon, and we distribute to nearly 17,000 retail and distribution center locations throughout the United States and Canada. We believe our established relationships throughout the supply chain permit us to offer products to our internet-based and retail customers and to provide our vendors access to broad retail channels. In order to participate in the growing revenue streams resulting from e-commerce and fulfillment services, we are expanding the business services we offer.
Our business is divided into two segments — Distribution and Publishing.
Distribution. Through our distribution business, we distribute computer software, consumer electronics and accessories, video games, and home videos, and provide fee-based logistical services. Our distribution business focuses on providing a range of value-added services including: vendor-managed inventory, electronic and internet-based ordering and gift card fulfillment. Our vendors include Symantec Corporation, Kaspersky Lab, Inc., Roxio (a division of Sonic Solutions), Webroot Software, Inc., Nuance Communications, Inc., and McAfee, Inc. and our own publishing business.
Publishing. Through our publishing business we own or license various computer software brands. Our publishing business packages, brands, markets and sells directly to consumers, retailers, third party distributors and our distribution business. Our publishing business currently consists of Encore Software, Inc. (“Encore”).
Encore, which we acquired in July 2002, publishes a variety of software products for the PC and Mac platforms. These products fall mainly into the print, personal productivity, education, family entertainment, and home and landscape architectural design software categories. Titles include The Print Shop, Print Master, Advantage, Mavis Beacon Teaches Typing, Punch Home Design, H&R Block, Bicycle and Hoyle PC Gaming. In addition to retail publishing, Encore also sells directly to consumers through its e-commerce websites.
On May 17, 2010, Encore completed the acquisition of substantially all of the assets of Punch!, a leading provider of home and landscape architectural design software in the United States. The acquisition of Punch! expanded our content ownership and our strategy to enhance gross margins.
We sold FUNimation Productions, Ltd. (“FUNimation”), a leading anime content provider, on March 31, 2011. All results of operations, assets and liabilities of FUNimation are classified as discontinued operations for all periods presented, and the consolidated financial statements, including the notes, have been reclassified to reflect such segregation for all periods presented (see further disclosure in Note 3 to our consolidated financial statements).
In fiscal 2009, a former component of our publishing business, BCI Eclipse Company, LLC (“BCI”), began winding down its licensing operations related to budget home video, and the wind-down was completed during the fourth quarter of fiscal 2010.
Overall Summary of Fiscal 2011 Financial Results
Continuing Operations
We reduced our debt balance to zero at March 31, 2011, from $6.6 million at March 31, 2010. Working capital management, earnings and lack of cash federal tax payments contributed to the debt balance reduction.
Consolidated net sales from continuing operations decreased 1.0% during fiscal 2011 to $490.9 million compared to $495.8 million in fiscal 2010. This $4.9 million decrease in net sales, primarily in the software category, was due to a reduction in shelf space for our products at retail, the proliferation of digital software downloads and the departure of two vendors (which accounted for an additional $25.1 million of sales in fiscal 2010), partially offset by increased sales of new products within consumer electronics and accessories, increased sales made directly to consumers, $13.5 million additional sales into Canada and $6.3 million additional sales generated from Punch! architectural design products.
22
Table of Contents
Our gross profit from continuing operations decreased to $65.2 million or 13.3% of net sales for fiscal 2011 compared to $68.0 million or 13.7% of net sales for fiscal 2010. Both the $2.8 million decrease in gross profit and 0.4% decrease in gross profit margin were due to the decrease in sales, particularly within our distribution business. However, sales of new higher margin architectural design products and higher margin DTC sales during fiscal 2011 partially offset the negative impact of decreased sales and product mix.
Total operating expenses from continuing operations for fiscal 2011 were $59.2 million or 12.1% of net sales, compared with $56.5 million or 11.4% of net sales for fiscal 2010. The $2.7 million increase was primarily a result of additional resources needed to support the new Canadian distribution facility of $1.0 million, professional fees and additional personnel and advertising costs related to Punch! of $1.5 million, DTC advertising and support expense of $802,000, a $1.7 million increase in legal disputes accrual and an additional $1.1 million in freight expense related to freight surcharges and higher costs associated with consumer electronics and accessories sales. These expense increases are partially offset by $4.0 million in performance-based compensation expense recorded during fiscal 2010 compared to zero in fiscal 2011.
Net income from continuing operations for fiscal 2011 was $12.5 million or $0.34 per diluted share compared to $18.7 million or $0.51 per diluted share last year.
Discontinued Operations
On March 31, 2011, we sold our wholly-owned subsidiary, FUNimation. Accordingly, all results of operations, assets and liabilities of FUNimation for all periods presented are classified as discontinued operations, and our consolidated financial statements, including the notes, have been reclassified to reflect such segregation for all periods presented.
Net sales from discontinued operations for fiscal 2011 and 2010 were $35.4 million and $32.6 million, respectively. FUNimation benefitted from increased sales of the Dragonball titles as well as additional media streaming revenue, both during fiscal 2011.
We recorded a loss on the sale of discontinued operations, net of tax, for fiscal 2011 of $5.2 million and net income from discontinued operations for fiscal 2011 of $3.9 million, net of tax, for a combined loss from discontinued operations of $1.3 million, or $0.04 per diluted share. Net income from discontinued operations was $4.2 million or $0.11 per diluted share in fiscal 2010.
Working Capital and Debt
Our business is working capital intensive and requires significant levels of working capital primarily to finance accounts receivable and inventories. We finance our operations through cash and cash equivalents, funds generated through operations, accounts payable and our revolving credit facility. The timing of cash collections and payments to vendors requires usage of our revolving credit facility in order to fund our working capital needs. We have a cash sweep arrangement with our lender, whereby, daily, all cash receipts from our customers reduce borrowings outstanding under the credit facility. Additionally, all payments to our vendors that are presented by the vendor to our bank for payment increase borrowings outstanding under the credit facility. “Checks written in excess of cash balances” may occur from time to time, including period ends, and represent payments made to vendors that have not yet been presented by the vendor to our bank, and therefore a corresponding advance on our revolving line of credit has not yet occurred. On a terms basis, we extend varying levels of credit to our customers and receive varying levels of credit from our vendors. During the last twelve months, we have not had any significant changes in the terms extended to customers or provided by vendors which would have a material impact to the reported financial statements.
In March 2007, we amended and restated our $65.0 million revolving credit facility with General Electric Corporation (“GE”) (the “GE Facility”) and amended the GE Facility again on February 5, 2009. The GE Facility called for monthly interest payments at the index rate plus 5.75%, or LIBOR plus 4.75% and was subject to certain borrowing base requirements. The GE Facility was available for working capital and general corporate needs and was secured by a first priority security interest in all of our assets, as well as the capital stock of our subsidiaries. The GE Facility was paid off on November 12, 2009 in connection with the new credit facility, as described below.
On November 12, 2009, we entered into a three year, $65.0 million revolving credit facility (the “Credit Facility”) with Wells Fargo Foothill, LLC as agent and lender, and Capital One Leverage Financing Corp. as a participating lender. The Credit Facility is secured by a first priority security interest in all of our assets, as well as the capital stock of our subsidiary companies. Additionally, the Credit Facility calls for monthly interest payments at the bank’s base rate, as defined in the Credit Facility, plus 4.0% or LIBOR plus 4.0%, at our discretion. The entire outstanding balance of principal and interest is due in full on November 12, 2012.
23
Table of Contents
At March 31, 2011 and 2010, we had zero and $6.6 million, respectively, outstanding on the Credit Facility. Amounts available under the Credit Facility are subject to a borrowing base formula. Changes in the assets within the borrowing base formula can impact the amount of availability. Based on that facility’s borrowing base and other requirements at such dates, we had excess availability of $33.3 million and $38.4 million at March 31, 2011 and 2010, respectively. At March 31, 2011, we were in compliance with all covenants under the Credit Facility and currently believe we will be in compliance with all covenants over the next twelve months.
In association with, and per the terms of the Credit Facility, we also pay and have paid certain facility and agent fees. Weighted average interest on the Credit Facility was 7.5% at both March 31, 2011 and 2010. Such interest amounts have been, and continue to be, payable monthly.
Critical Accounting Policies and Estimates
The discussion and analysis of our financial condition and results of operations are based upon our consolidated financial statements, which have been prepared in conformity with accounting principles generally accepted in the United States of America. The preparation of these consolidated financial statements requires us to make estimates and assumptions that affect the reported amounts of assets, liabilities, revenues and expenses, and related disclosure of contingent assets and liabilities. On an on-going basis, we review and evaluate our estimates, including those related to customer programs and incentives, product returns, bad debt, inventories, long-lived assets including intangible assets, goodwill, share-based compensation, income taxes, contingencies and litigation. We base our estimates on historical experience and various other assumptions that are believed to be reasonable under the circumstances, the results of which form the basis for making judgments about the carrying values of assets and liabilities that are not readily apparent from other sources. Actual results could differ from these estimates under different assumptions or conditions.
We believe the following critical accounting policies are affected by our judgment, estimates and/or assumptions used in the preparation of our consolidated financial statements.
Revenue Recognition
We recognize revenue on products shipped when title and risk of loss transfers, delivery has occurred, the price to the buyer is determinable and collectability is reasonably assured. We recognize service revenues upon delivery of the services. Service revenues represented less than 10% of total net sales for fiscal 2011, 2010 and 2009. We have relationships with certain of our customers and vendors whereby we provide fee-based services, which are recognized on a net basis within sales. Under specific conditions, we permit our customers to return or destroy products at customer locations. We record a reserve for sales returns, product destructions and allowances against amounts due to reduce the net recognized receivables to the amounts we reasonably believe will be collected. These reserves are based on the application of our historical gross profit percent against average sales returns and product destructions. Our actual sales return and product destruction rates have averaged between 10% and 12% over the past three years. Although our past experience has been a good indicator of future reserve levels, there can be no assurance that our current reserve levels will be adequate in the future.
Our distribution customers at times qualify for certain price protection and promotional monies from our vendors. We serve as an intermediary to settle these amounts between vendors and customers. We account for these amounts as reductions of revenues with corresponding reductions in cost of sales.
Our publishing business at times provides certain price protection, promotional monies, volume rebates and other incentives to customers. We record these amounts as reductions in revenue.
Allowance for Doubtful Accounts
We perform periodic credit evaluations of our customers’ financial condition. In determining the adequacy of our allowances, we analyze customer financial statements, historical collection experience, aging of receivables, substantial down-grading of credit scores, bankruptcy filings, and other economic and industry factors. Although we utilize risk management practices and methodologies to determine the adequacy of the allowance, the accuracy of the estimation process can be materially impacted by different judgments as to collectability based on the information considered and further deterioration of accounts. Our largest collection risks exist for customers that are in bankruptcy, or at risk of bankruptcy. If customer circumstances change (i.e., higher than expected defaults or an unexpected material adverse change in a major customer’s ability to meet its financial obligations to us), our estimates of the recoverability of amounts due could be reduced by a material amount.
24
Table of Contents
Goodwill and Intangible Assets
We review goodwill and indefinite lived intangible assets for potential impairment annually for each reporting unit, or when events or changes in circumstances indicate the carrying value of the goodwill might exceed its current fair value. We also assess potential impairment of goodwill and intangible assets when there is evidence that recent events or changes in circumstances have made recovery of an asset’s carrying value unlikely. The amount of impairment loss would be recognized as the excess of the asset’s carrying value over its fair value. Factors which may cause impairment include negative industry or economic trends and significant underperformance relative to historical or projected future operating results.
We determine fair value using widely accepted valuation techniques, including discounted cash flow and market multiple analysis. These types of analyses require us to make certain assumptions and estimates regarding industry economic factors and the profitability of future business strategies. We conduct impairment testing at least once annually based on our most current business strategy in light of present industry and economic conditions, as well as future expectations. If the operating results for our publishing business deteriorate considerably and are not consistent with our assumptions and estimates, we may be exposed to a goodwill impairment charge that could be material. During the fiscal year ended March 31, 2009, we determined that the fair value of three of our reporting units was less than their fair values, and accordingly, an impairment of goodwill and other intangibles was recorded. In determining the amount of impairment, we analyzed the fair values of the assets and liabilities of the reporting units as if the reporting units had been acquired in a current business combination. Our publishing business had a goodwill balance of $5.7 million and zero as of March 31, 2011 and 2010, respectively. We have no goodwill associated with our distribution business.
Impairment of Long-Lived Assets
Long-lived assets, such as property and equipment and amortizable intangible assets, are evaluated for impairment whenever events or changes in circumstances indicate the carrying value of an asset may not be recoverable. An impairment loss is recognized when estimated undiscounted cash flows expected to result from the use of the asset plus net proceeds expected from disposition of the asset (if any) are less than the carrying value of the asset. When an impairment loss is recognized, the carrying amount of the asset is reduced to its estimated fair value. If our results from operations deteriorate considerably and are not consistent with our assumptions, we may be exposed to a material impairment charge. During the fiscal year ended 2009, we determined that the fair value of various long-lived assets was less than their fair values, and accordingly, an impairment of other intangibles was recorded. In determining the amount of impairment, we analyzed the fair values of the assets and liabilities of the reporting units as if the reporting units had been acquired in a current business combination.
Inventory Valuation
Our inventories are recorded at the lower of cost or market. We use certain estimates and judgments to value inventory. We monitor our inventory to ensure that we properly identify inventory items that are slow-moving, obsolete or non-returnable, on a timely basis. A significant risk in our distribution business is product that has been purchased from vendors that cannot be sold at full distribution prices and is not returnable to the vendors. A significant risk in our publishing business is that certain products may run out of shelf life and be returned by our customers. Generally, these products can be sold in bulk to a variety of liquidators at a significantly reduced value. We establish reserves for the difference between carrying value and estimated realizable value in the periods when we first identify the lower of cost or market issue. If future demand or market conditions are less favorable than current analyses, additional inventory write-downs or reserves may be required and would be reflected in cost of sales in the period the determination is made.
Share-Based Compensation
We have granted stock options, restricted stock units and restricted stock to certain employees and non-employee directors. We recognize share-based compensation net of an estimated forfeiture rate and only recognize compensation cost for those shares expected to vest on a straight-line basis over the requisite service period of the award (normally the vesting period) or when the performance condition has been met.
Determining the appropriate fair value model and calculating the fair value of share-based payment awards require the input of highly subjective assumptions, including the expected life of the share-based payment awards and stock price volatility. We use the Black-Scholes model to value our stock option awards and the opening stock price on the date of grant to value restricted stock unit awards. We believe future volatility will not materially differ from the historical volatility. Thus, the fair value of the share-based payment awards represents our best estimates, but these estimates involve inherent uncertainties and the application of management
25
Table of Contents
judgment. As a result, if factors change and we use different assumptions, share-based compensation expense could be materially different in the future. In addition, we are required to estimate the expected forfeiture rate and only recognize expense for those shares expected to vest. If the actual forfeiture rate is materially different from the estimate, share-based compensation expense could be significantly different from what has been recorded in the current period.
Income Taxes
Income taxes are recorded under the liability method, whereby deferred income taxes are provided for temporary differences between the financial reporting and tax basis of assets and liabilities. In the preparation of our consolidated financial statements, management is required to estimate income taxes in each of the jurisdictions in which we operate. This process involves estimating actual current tax exposures together with assessing temporary differences resulting from differing treatment of items for tax and accounting purposes. These differences result in deferred tax assets and liabilities, which are included in our Consolidated Balance Sheets. Management reviews our deferred tax assets for recoverability on a quarterly basis and assesses the need for valuation allowances. The recoverability of these deferred tax assets are evaluated by considering historical levels of income, estimates of future taxable income streams and the impact of tax planning strategies. A valuation allowance is recorded to reduce deferred tax assets when it is determined that it is more likely than not that we would not be able to realize all or part of our deferred tax assets. At March 31, 2010 we carried a valuation allowance against our net deferred tax assets of $9.7 million which represents the amount of temporary differences which we did not anticipate recognizing with future projected income for fiscal years 2011 through 2014, or by net operating loss carrybacks. At March 31, 2011, we again evaluated the need for a valuation allowance and based on the history of pretax earnings, future taxable income projections and future reversals of existing taxable temporary differences, concluded we would more likely than not be able to realize the entire $30.7 million of deferred tax assets recorded at March 31, 2011. Therefore, we released the remaining $9.7 million of valuation allowance at that time, reducing the valuation allowance balance to zero at March 31, 2011.
Contingencies and Litigation
There are various claims, lawsuits and pending actions against us. If a loss arising from these actions is probable and can be reasonably estimated, we record the amount of the estimated loss. If the loss is estimated using a range within which no point is more probable than another, the minimum estimated liability is recorded. Based on current available information, we believe the ultimate resolution of existing actions will not have a material adverse effect on our consolidated financial statements. As additional information becomes available, we assess any potential liability related to existing actions and may need to revise our estimates. Future revisions of our estimates could materially impact our consolidated results of operations, cash flows or financial position.
Recently Issued Accounting Pronouncements
In June 2009, the FASB issued ASC 860-10, Transfers and Servicing. This Statement eliminates the concept of a “qualified special-purpose entity,” changes the requirements for derecognizing financial assets and requires additional disclosures in order to enhance information reported to users of financial statements by providing greater transparency about transfers of financial assets, including securitization transactions, and an entity’s continuing involvement in and exposure to the risks related to transferred financial assets. ASC 860-10 is effective for fiscal years beginning after November 15, 2009. We adopted ASC 860-10 in the first quarter of fiscal 2011, which did not have an impact on our consolidated financial statements.
In June 2009, the FASB also amended ASC 810-10, Consolidation, which addresses the effects of eliminating the qualified special purpose entity concept from ASC 860-10 and responds to concerns about the application and transparency of enterprises’ involvement with Variable Interest Entities (VIEs). ASC 810-10 is effective for fiscal years beginning after November 15, 2009. We adopted ASC 810-10 in the first quarter of fiscal 2011, which did not have an impact on our consolidated financial statements.
Reconciliation of GAAP Net Sales to Net Sales Before Inter-Company Eliminations
In evaluating our financial performance and operating trends, management considers information concerning our net sales before inter-company eliminations of sales that are not prepared in accordance with generally accepted accounting principles (“GAAP”) in the United States. Management believes these non-GAAP measures are useful because they provide supplemental information that facilitates comparisons to prior periods and for the evaluations of financial results. Management uses these non-GAAP measures to evaluate its financial results, develop budgets and manage expenditures. The method we use to produce non-GAAP results is not computed according to GAAP, is likely to differ from the methods used by other companies and should not be regarded as a replacement for corresponding GAAP measures. Net sales before inter-company eliminations has limitations as a supplemental measure, and you should not consider it in isolation or as a substitute for analysis of our results as reported under GAAP.
26
Table of Contents
The following table represents a reconciliation of GAAP net sales to net sales before inter-company eliminations:
| Fiscal Year Ended | ||||||||||||
| (Unaudited) (In thousands) |
March 31, 2011 |
March 31, 2010 |
March 31, 2009 |
|||||||||
| Net sales |
||||||||||||
| Distribution |
$ | 481,349 | $ | 487,692 | $ | 592,893 | ||||||
| Publishing |
31,731 | 32,058 | 42,490 | |||||||||
| Net sales before inter-company eliminations |
513,080 | 519,750 | 635,383 | |||||||||
| Inter-company sales |
(22,183 | ) | (23,980 | ) | (36,324 | ) | ||||||
| Net sales as reported |
$ | 490,897 | $ | 495,770 | $ | 599,059 | ||||||
Results of Operations
The following table sets forth for the periods indicated, the percentage of net sales represented by certain items included in our Consolidated Statements of Operations.
| Fiscal Years Ended March 31, | ||||||||||||
| 2011 | 2010 | 2009 | ||||||||||
| Net sales: |
||||||||||||
| Distribution |
98.0 | % | 98.4 | % | 99.0 | % | ||||||
| Publishing |
6.5 | 6.4 | 7.1 | |||||||||
| Inter-company sales |
(4.5 | ) | (4.8 | ) | (6.1 | ) | ||||||
| Total net sales |
100.0 | 100.0 | 100.0 | |||||||||
| Cost of sales, exclusive of depreciation |
86.7 | 86.3 | 91.7 | |||||||||
| Gross profit |
13.3 | 13.7 | 8.3 | |||||||||
| Operating Expenses |
||||||||||||
| Selling and marketing |
4.3 | 3.7 | 3.3 | |||||||||
| Distribution and warehousing |
2.2 | 2.0 | 2.0 | |||||||||
| General and administrative |
4.8 | 5.0 | 4.6 | |||||||||
| Depreciation and amortization |
0.8 | 0.7 | 1.3 | |||||||||
| Goodwill impairment |
— | — | 1.8 | |||||||||
| Total operating expenses |
12.1 | 11.4 | 13.0 | |||||||||
| Income (loss) from operations |
1.2 | 2.3 | (4.7 | ) | ||||||||
| Interest income (expense), net |
(0.4 | ) | (0.5 | ) | (0.5 | ) | ||||||
| Other income (expense), net |
— | 0.2 | (0.2 | ) | ||||||||
| Income (loss) from continuing operations — before taxes |
0.8 | 2.0 | (5.4 | ) | ||||||||
| Income tax benefit (expense) |
1.7 | 1.7 | (1.8 | ) | ||||||||
| Net income (loss) from continuing operations |
2.5 | 3.7 | (7.2 | ) | ||||||||
| Discontinued operations, net of tax |
||||||||||||
| Loss on sale of discontinued operations |
(1.1 | ) | — | — | ||||||||
| Income (loss) from discontinued operations |
0.8 | 0.8 | (7.6 | ) | ||||||||
| Net income (loss) |
2.2 | % | 4.5 | % | (14.8 | )% | ||||||
Segment Results
Certain information in this section contains forward-looking statements. Our actual results could differ materially from the statements contained in the forward-looking statements as a result of a number of factors, including but not limited to risks and uncertainties inherent in our business, dependency upon significant customers and vendors, the seasonality of our business, dependency upon software developers and manufacturers, effect of technology developments, effect of free product downloads, dependency upon key employees, risks of returns and inventory obsolescence, erosions in our gross profit margins, change in retailers methods of distribution, dependency upon financing, obtaining additional financing when required and the possible volatility of our stock price. See also Business — Forward-Looking Statements/Risk Factors in Item 1A of this Form 10-K.
Distribution Segment
The distribution segment distributes computer software, consumer electronics and accessories, video games, and home videos, and provides fee-based logistical services.
27
Table of Contents
Fiscal 2011 Results from Continuing Operations Compared With Fiscal 2010
Net Sales (before inter-company eliminations)
Net sales before inter-company eliminations for the distribution segment were $481.3 million for fiscal 2011 compared to $487.7 million for fiscal 2010, a decrease of $6.4 million or 1.3%. Net sales decreased $27.2 million in the software product group to $380.8 million for fiscal 2011 compared to $408.0 million for fiscal 2010, primarily due to a reduction in shelf space for our products at retail, the proliferation of digital software downloads and the departure of two vendors (which accounted for an additional $25.1 million of sales in fiscal 2010), partially offset by $13.5 million of additional sales in Canadian markets. Home video net sales increased $3.8 million to $41.9 million for fiscal 2011 from $38.1 million in fiscal 2010, due primarily to new title releases in fiscal 2011 compared to fiscal 2010. Video games net sales increased $243,000 to $27.5 million in fiscal 2011 from $27.3 million in fiscal 2010, due to new title releases during fiscal 2011. Consumer electronics and accessories net sales increased $16.8 million to $31.1 million during fiscal 2011 from $14.3 million for fiscal 2010, due to the distribution of additional new products. We believe future net sales will be dependent upon the ability to continue to add new, appealing content and upon the strength of the retail environment and overall economic conditions.
Gross Profit
Gross profit for the distribution segment was $48.4 million or 10.1% of net sales for fiscal 2011 compared to $53.5 million or 11.0% of net sales for fiscal 2010. The $5.1 million decrease in gross profit and 0.9% decrease in gross profit margin were both primarily due to increased sales of low margin products. We expect gross profit rates to fluctuate depending principally upon the make-up of products sold.
Operating Expenses
Total operating expenses for the distribution segment remained flat at $47.2 million or 9.8% of net sales for fiscal 2011 compared to $47.1 million or 9.7% of net sales for fiscal 2010.
Selling and marketing expenses for the distribution segment increased to $14.6 million or 3.0% of net sales for fiscal 2011 compared to $13.3 million or 2.7% of net sales for fiscal 2010. The $1.3 million increase was primarily due to the addition of resources to support the new Canadian distribution facility as well as increased freight expense related to freight surcharges and higher costs associated with consumer electronics and accessories sales.
Distribution and warehousing expenses for the distribution segment increased to $10.7 million or 2.2% of net sales for fiscal 2011 compared to $9.8 million or 2.0% of net sales for fiscal 2010. The $895,000 increase was primarily a result of personnel, rent and other warehouse costs incurred in connection with the opening of the new Canadian distribution facility and a $300,000 increase in variable personnel costs associated with warehouse project costs in fiscal 2011.
General and administration expenses for the distribution segment consist principally of executive, accounting and administrative personnel and related expenses, including professional fees. General and administration expenses for the distribution segment were $18.7 million or 3.9% of net sales for fiscal 2011 compared to $20.3 million or 4.2% of net sales for fiscal 2010. The $1.6 million decrease was primarily a result of a $3.4 million performance based compensation expense recorded during fiscal 2010 compared to zero in fiscal 2011, partially offset by a $1.7 million increase in legal disputes accrual in fiscal 2011.
Depreciation and amortization for the distribution segment was $3.3 million for fiscal 2011 compared to $3.7 million for fiscal 2010. The $412,000 decrease was primarily due to certain assets becoming fully depreciated.
Operating Income
Net operating income for the distribution segment was $1.2 million for fiscal 2011 compared to $6.4 million for fiscal 2010.
Fiscal 2010 Results from Continuing Operations Compared With Fiscal 2009
Net Sales (before inter-company eliminations)
Net sales before inter-company eliminations for the distribution segment were $487.7 million for fiscal 2010 compared to $592.9 million for fiscal 2009, a decrease of $105.2 million or 17.7%. Net sales decreased $50.6 million in the software product group to
28
Table of Contents
$408.0 million for fiscal 2010 compared to $458.6 million for fiscal 2009, primarily due to approximately $28.3 million loss of sales from a large retailer that filed for bankruptcy and was liquidated during fiscal 2009, the departure of a low margin vendor (which accounted for an additional $33.1 million of sales in fiscal 2009), a shift to fee-based value-added services and the overall retail decline and weak economic conditions. These decreases in net sales were partially offset by increased sales to current customers by providing additional product offerings. Home video net sales decreased $17.1 million to $38.1 million for fiscal 2010 from $55.2 million in fiscal 2009, due primarily to shelf space reductions at retailer locations and the weak retail market and poor overall economic conditions. Video games net sales decreased $43.4 million to $27.3 million in fiscal 2010 from $70.7 million in fiscal 2009, due to an $8.0 million loss of sales from a large retailer that filed for bankruptcy and was liquidated during fiscal 2009, the departure of a low margin vendor (which accounted for an additional $24.1 million of sales in fiscal 2009) and a lack of new releases versus the prior fiscal year. Consumer electronics and accessories net sales increased $5.9 million to $14.3 million during fiscal 2010 from $8.4 million for fiscal 2009, due to the distribution of new products.
Gross Profit
Gross profit for the distribution segment was $53.5 million or 11.0% of net sales for fiscal 2010 compared to $52.8 million or 8.9% of net sales for fiscal 2009. The $640,000 increase in gross profit and 2.1% increase in gross profit margin were primarily due to increased sales of higher margin software products, an increase in fee-based value-added services and the departure of low margin vendors.
Operating Expenses
Total operating expenses for the distribution segment were $47.1 million or 9.7% of net sales for fiscal 2010 compared to $51.7 million or 8.7% of net sales for fiscal 2009. Overall expenses decreased in all categories.
Selling and marketing expenses for the distribution segment decreased to $13.3 million or 2.7% of net sales for fiscal 2010 compared to $14.1 million or 2.4% of net sales for fiscal 2009 primarily due to a decrease in variable freight expenses. The reduction in current period expenses resulted from lower sales volumes and lower freight rates. These cost decreases were partially offset by an increase in marketing expenses resulting from reduced vendor participation during fiscal 2010.
Distribution and warehousing expenses for the distribution segment decreased $2.4 million to $9.8 million or 2.0% of net sales for fiscal 2010 compared to $12.2 million or 2.1% of net sales for fiscal 2009 due to lower shipment volume compared to the prior year, which contributed to a workforce reduction.
General and administration expenses for the distribution segment consist principally of executive, accounting and administrative personnel and related expenses, including professional fees. General and administration expenses for the distribution segment were $20.3 million or 4.2% of net sales for fiscal 2010 compared to $21.4 million or 3.6% of net sales for fiscal 2009. The $1.1 million decrease was primarily a result of reduced expenses related to the fiscal 2009 ERP implementation of $1.8 million, a workforce reduction during fiscal 2009 and a decrease in professional fees, which were partially offset by the $3.4 million performance-based compensation expense recorded during fiscal 2010 compared to zero in fiscal 2009.
Depreciation and amortization for the distribution segment was $3.7 million for fiscal 2010 compared to $4.1 million for fiscal 2009. The decrease is principally due to certain assets becoming fully depreciated.
Operating Income
Net operating income for the distribution segment was $6.4 million for fiscal 2010 compared to $1.1 million for fiscal 2009.
Publishing Segment
The publishing segment owns or licenses various widely-known computer software brands through Encore. In addition to sales to retailers, Encore also sells directly to consumers through its websites.
On May 17, 2010, Encore completed the acquisition of substantially all of the assets of Punch!, a leading provider of home and landscape architectural design software in the United States. The acquisition of Punch! expanded our content ownership and our strategy to enhance gross margins.
29
Table of Contents
We also published anime content through FUNimation Productions, Ltd. (“FUNimation”) prior to our sale of FUNimation on March 31, 2011. Accordingly, the results of operations, assets and liabilities of FUNimation for all periods presented are classified as discontinued operations (see further disclosure in Note 3 to our consolidated financial statements).
In fiscal 2009, a former component of our publishing business, BCI, began winding down its licensing operations related to budget home video, and the wind-down was completed during the fourth quarter of fiscal 2010.
Fiscal 2011 Results from Continuing Operations Compared With Fiscal 2010
Net Sales (before inter-company eliminations)
Net sales before inter-company eliminations for the publishing segment were $31.7 million for fiscal 2011 compared to $32.0 million for fiscal 2010. The $327,000 or 1.0% decrease in net sales was primarily due to a decline in the retail sales of existing print productivity and gaming products in fiscal 2011, partially offset by sales generated from the addition of the Punch! line of home design products and increased DTC sales. We believe sales results in the future will be dependent upon the ability to continue to add new, appealing content, to develop digitally downloadable products and to access a variety of sales channels.
Gross Profit
Gross profit for the publishing segment was $16.7 million or 52.8% of net sales for fiscal 2011 compared to $14.6 million or 45.5% of net sales for fiscal 2010. The $2.1 million increase in gross profit and 7.3% increase in gross profit margin percent were both primarily a result of improved margins from product sales mix, higher margin DTC sales and reduced royalty rates payable to certain licensors. We expect future gross profit rates to fluctuate depending principally upon the make-up of product sales.
Operating Expenses
Total operating expenses increased $2.6 million for the publishing segment to $12.0 million or 37.8% of net sales, for fiscal 2011, from $9.4 million or 29.3% of net sales for fiscal 2010. Overall expenses increased in all categories of operating expenses.
Selling and marketing expenses for the publishing segment were $6.5 million or 20.5% of net sales for fiscal 2011 compared to $4.8 million or 15.0% of net sales for fiscal 2010. The $1.7 million increase was primarily due to the $951,000 of sales personnel, outside services, and advertising costs related to Punch!, $397,000 additional advertising expenses related to the DTC business and other personnel and related costs.
General and administrative expenses for the publishing segment consist principally of executive, accounting and administrative personnel and related expenses, including professional fees. General and administrative expenses for the publishing segment increased to $4.9 million or 15.5% of net sales for fiscal 2011 compared to $4.2 million or 13.2% of net sales for fiscal 2010. The $680,000 increase was primarily due to $525,000 additional costs related to Punch!, $405,000 additional fees and other costs related to the DTC business and various other personnel and related costs, partially offset by $619,000 of performance-based compensation expense recorded during fiscal 2010 compared to zero recorded during fiscal 2011.
Depreciation and amortization expense for the publishing segment was $573,000 for fiscal 2011 compared to $350,000 for fiscal 2010. The $223,000 increase was primarily due to the amortization of the Punch! acquisition-related intangibles, net of a $92,000 decrease related to the final write-off of BCI masters during fiscal 2010.
Operating Income
The publishing segment had operating income of $4.8 million for fiscal 2011 compared to $5.2 million for fiscal 2010.
Fiscal 2010 Results from Continuing Operations Compared With Fiscal 2009
Net Sales (before inter-company eliminations)
Net sales before inter-company eliminations for the publishing segment were $32.0 million for fiscal 2010 versus $42.5 million for fiscal 2009. The $10.5 million or 24.6% decrease in net sales was primarily due to the inclusion of BCI in fiscal 2009 (which generated $10.0 million in net sales in fiscal 2009), shelf space reductions at retailer locations and decreased sales due to the weak retail market and poor overall economic conditions.
30
Table of Contents
Gross Profit (Loss)
Gross profit (loss) for the publishing segment was a gross profit of $14.6 million or 45.5% of net sales for fiscal 2010 compared to a gross loss of $3.2 million or negative 7.6% of net sales for fiscal 2009. The $17.8 million increase in gross profit was primarily a result of the impairment and other charges of $16.4 million recorded in fiscal 2009 related to accounts receivable reserves, inventory and prepaid royalties associated with the BCI restructuring as well as additional DTC sales in fiscal 2010 with higher margins.
The increase in gross profit (loss) margin percentage to 45.5% from negative 7.6%, a total increase of 53.1%, was due to impairment and other charges recorded in fiscal 2009 (38.8% of the increase), and improved margins from product sales mix and reduced royalty rates payable to certain licensors in fiscal 2010.
Operating Expenses
Total operating expenses decreased $16.5 million for the publishing segment to $9.4 million or 29.3% of net sales, for fiscal 2010, from $25.9 million or 61.1% of net sales for fiscal 2009. Expenses in fiscal 2009 included goodwill and other impairment charges recorded of $13.0 million. Overall expenses decreased in all categories of operating expenses.
Selling and marketing expenses for the publishing segment were $4.8 million or 15.0% of net sales for fiscal 2010 compared to $5.6 million or 13.2% of net sales for fiscal 2009. The $803,000 decrease was primarily due to $125,000 in severance expenses during fiscal 2009 and personnel cost savings resulting from the restructuring activities that we undertook during fiscal 2009, both partially offset by an additional $1.0 million in advertising expenses related to the DTC business in fiscal 2010.
General and administrative expenses for the publishing segment consist principally of executive, accounting and administrative personnel and related expenses, including professional fees. General and administrative expenses for the publishing segment were $4.2 million or 13.2% of net sales for fiscal 2010 compared to $6.1 million or 14.3% of net sales for fiscal 2009. The $1.9 million decrease was primarily due to restructuring severance costs of $305,000 recorded during fiscal 2009, personnel cost savings resulting from the restructuring activities that we undertook during fiscal 2009 and a reduction of professional fees, partially offset by $619,000 million of performance-based compensation expense recorded during fiscal 2010 compared to zero recorded during the prior year.
Depreciation and amortization expense for the publishing segment was $350,000 for fiscal 2010 compared to $3.7 million for fiscal 2009. The $3.4 million decrease was primarily due to a $2.0 million impairment of intangibles charge that was recorded during fiscal 2009 and was related to the operations of BCI, and the reduction in amortization expense associated with the masters’ cost basis reduction, which occurred as part of the restructuring activities that we undertook during fiscal 2009.
Goodwill impairment for the publishing segment was zero for fiscal 2010 compared to $10.5 million for fiscal 2009. The prior year charge primarily reflected the sustained decline in our share price during fiscal 2009, which resulted in our market capitalization being less than book value.
Operating Income (Loss)
The publishing segment had operating income from continuing operations of $5.2 million for fiscal 2010 compared to operating loss of $29.2 million for fiscal 2009.
Consolidated Other Income and Expense for All Periods
Interest income (expense), net was expense of $1.8 million for fiscal 2011 compared to expense of $2.2 million for fiscal 2010. The decrease in interest expense for fiscal 2011 was a result of a reduction in debt borrowings from fiscal 2010 and a write-off of debt acquisition costs of $289,000 during fiscal 2010.
Other income (expense), net for fiscal 2011 was net expense of $153,000, which consisted primarily of foreign exchange loss. Other income (expense), net for fiscal 2010 was net income of $788,000, which consisted primarily of foreign exchange gain.
31
Table of Contents
Interest income (expense), net was expense of $2.2 million expense for fiscal 2010 compared to expense of $3.2 million for fiscal 2009. The decrease in interest expense for fiscal 2010 was a result of a reduction in debt borrowings and a write-off of debt acquisition costs of $289,000 during fiscal 2010 compared to $950,000 during fiscal 2009.
Other income (expense), net for fiscal 2010 was net income of $788,000, which consisted primarily of foreign exchange gain. Other income (expense), net for fiscal 2009 was net expense of $1.2 million, which consisted primarily of foreign exchange loss.
Consolidated Income Tax Expense or Benefit from Continuing Operations for All Periods
We recorded income tax benefit from continuing operations of $8.4 million for fiscal 2011, or an effective rate of negative 208.7%, income tax benefit from continuing operations of $8.6 million for fiscal 2010, or an effective tax rate of negative 85.3% and income tax expense from continuing operations of $10.9 million, or an effective tax rate of negative 33.7% for fiscal 2009. The change in our effective tax rate from year to year is principally attributable to the fact that we recorded a valuation allowance against our deferred tax assets of $21.4 million during the year ended March 31, 2009, released $11.7 million of the valuation allowance during the year ended March 31, 2010, and released the remaining $9.7 million of the valuation allowance during the year ended March 31, 2011.
For the year ended March 31, 2011 we recorded income tax expense from discontinued operations of $2.2 million and income tax benefit from the sale of discontinued operations of $2.9 million. For the years ended March 31, 2010 and 2009, we recorded income tax expense from discontinued operations of $2.4 million and income tax benefit from discontinued operations of $25.4 million, respectively. The effective tax rate applied to discontinued operations for the year ended March 31, 2011 was 36.4% and the rate applied to the sale of discontinued operations was 36.1%. The effective tax rate applied to discontinued operations for the years ended March 31, 2010 and 2009 was 36.5% and 36.1%, respectively.
Deferred tax assets are evaluated by considering historical levels of income, estimates of future taxable income streams and the impact of tax planning strategies. A valuation allowance is recorded to reduce deferred tax assets when it is determined that it is more likely than not, based on the weight of available evidence, we would not be able to realize all or part of our deferred tax assets. An assessment is required of all available evidence, both positive and negative, to determine the amount of any required valuation allowance. During fiscal 2009, we recorded a valuation allowance against the deferred tax assets of $21.4 million, which represented the amount of temporary differences we did not anticipate recognizing with future projected taxable income, or by net operating loss carrybacks. During fiscal 2010, we released $11.7 million of the valuation allowance against these deferred tax assets, thus reducing the valuation allowance to $9.7 million. At March 31, 2011, we again evaluated the need for a valuation allowance and based on our history of pretax earnings, future taxable income projections and future reversals of existing taxable temporary differences concluded that we are more likely than not able to realize the entire $30.7 million of deferred tax assets recorded at March 31, 2011. Therefore, we released the remaining $9.7 million of valuation allowance at that time.
We recognize interest accrued related to unrecognized income tax benefits (“UTB’s”) in the provision for income taxes. At March 31, 2010, interest accrued was approximately $147,000, which was net of federal and state tax benefits and total UTB’s net of federal and state tax benefits that would impact the effective tax rate if recognized were $716,000. During the fiscal year ended March 31, 2011, an additional $88,000 of UTB’s were accrued, which was net of $48,000 of deferred federal and state income tax benefits. Additionally, $192,000 of UTB’s were reversed related to a statute of limitations lapse and $140,000 of UTB’s were reversed related to provision adjustments during the fiscal year ended March 31, 2011. As of March 31, 2011, interest accrued was $168,000 and total UTB’s, net of deferred federal and state income tax benefits that would impact the effective tax rate, if recognized, were $612,000.
Consolidated Net (Loss) Income from Continuing Operations
We recorded net income from continuing operations of $12.5 million for fiscal 2011, net income from continuing operations of $18.7 million for fiscal 2010 and net loss from continuing operations of $43.4 million for fiscal 2009.
Discontinued Operations
On March 31, 2011, we sold our wholly-owned subsidiary, FUNimation. Accordingly, all results of operations, assets and liabilities of FUNimation for all periods presented are classified as discontinued operations, and our consolidated financial statements, including the notes, have been reclassified to reflect such segregation for all periods presented.
32
Table of Contents
We recorded net income from discontinued operations of $3.9 million, net of tax for fiscal 2011, compared to $4.2 million, net of tax, for fiscal 2010. The reduction in net income was driven by $2.1 million write-down of FUNimation’s assets to fair value during fiscal 2011, partially offset by a strong title release in fiscal 2011 and a zero performance based compensation expense recorded during fiscal 2011 compared to $792,000 during fiscal 2010. Additionally, we recorded a loss on the sale of discontinued operations, net of tax for fiscal 2011 of $5.2 million associated with the sale of FUNimation on March 31, 2011.
We recorded net income from discontinued operations of $4.2 million, net of tax in fiscal 2010, compared to net loss of $45.1 million, net of tax, for fiscal 2009. The increase in net income was driven by goodwill and other asset impairment charges of $81.0 million during fiscal 2009, partially offset by shelf reductions at retailer locations and decreased sales due to the weak retail market and poor overall economic conditions in fiscal 2010 and a $792,000 performance based compensation expense recorded during fiscal 2010 compared to zero during fiscal 2009.
Consolidated Net (Loss) Income
Net income for fiscal 2011 was $11.2 million, net income for fiscal 2010 was $22.9 million and net loss for fiscal 2009 was $88.4 million.
Market Risk
Our exposure to market risk was primarily due to the fluctuating interest rates associated with variable rate indebtedness. See Item 7A — Quantitative and Qualitative Disclosure About Market Risk.
Seasonality and Inflation
Quarterly operating results are affected by the seasonality of our business. Specifically, our third quarter (October 1-December 31) typically accounts for our largest quarterly revenue figures and a substantial portion of our earnings. Our third quarter accounted for 30.0%, 25.4%, and 27.6% of our net sales for the fiscal years ended March 31, 2011, 2010 and 2009, respectively. As a supplier of products ultimately sold to consumers, our business is affected by the pattern of seasonality common to other suppliers of retailers, particularly during the holiday selling season. Poor economic or weather conditions during this period could negatively affect our operating results. Inflation is not expected to have a significant impact on our business, financial condition or results of operations since we can generally offset the impact of inflation through a combination of productivity gains and price increases.
Liquidity and Capital Resources
Cash Flow Analysis
Operating Activities
Cash provided by operating activities for fiscal 2011 totaled $8.7 million, compared to $13.0 million and $7.9 million for fiscal 2010 and 2009, respectively.
The net cash provided by operating activities for fiscal 2011 mainly reflected our net income, combined with various non-cash charges, including loss on sale of discontinued operations of $5.2 million, depreciation and amortization of $3.8 million, amortization of software development costs of $499,000, amortization of debt-acquisition costs of $596,000, share-based compensation of $1.1 million and an increase in deferred income taxes of $8.6 million, offset by our working capital demands. The following are changes in the operating assets and liabilities during fiscal 2011: accounts receivable decreased $4.2 million as a result of decreased sales; inventories increased $2.8 million, primarily reflecting additional inventory related to the opening of our Canadian distribution facility and new consumer electronics and accessories inventory purchases; income taxes receivable decreased $131,000, primarily due to the timing of required tax payments and tax refunds; accounts payable increased $912,000 primarily as a result of timing of payments and purchases; and accrued expenses decreased $4.0 million primarily due to the payment of the fiscal 2010 performance-based cash compensation accrual.
The net cash provided by operating activities for fiscal 2010 mainly reflected our net income, combined with various non-cash charges, including depreciation and amortization of $4.0 million, amortization of software development costs of $324,000, amortization of debt-acquisition costs of $502,000, write-off of debt acquisition costs of $289,000, share-based compensation of $1.0 million, increase in deferred income taxes of $7.3 million, a decrease in deferred compensation of $816,000, offset by our working
33
Table of Contents
capital demands. The following are changes in the operating assets and liabilities during fiscal 2010: accounts receivable decreased $13.1 million primarily due to a sales decrease and the timing of receipts; inventories increased by $1.1 million, primarily due to the timing of sales; prepaid expenses increased by $2.5 million primarily due to prepaid royalty advances; income taxes receivable decreased $4.8 million, primarily due to our net operating loss carryback refund; other assets decreased $314,000 due to amortization and recoupments; accounts payable decreased $21.0 million, primarily as a result of reduced purchases driven by lower sales volume, and timing of disbursements; and accrued expenses increased $2.7 million primarily related to accrued performance-based compensation expense offset by a decrease in royalty expenses resulting from a decrease in sales.
The net cash provided by operating activities for fiscal 2009 mainly reflected our net loss, combined with various non-cash charges, including depreciation and amortization of $7.8 million, amortization of debt-acquisition costs of $250,000, write-off of debt acquisition costs of $950,000, goodwill impairment of $10.5 million, share-based compensation of $1.0 million, increase in deferred income taxes of $14.9 million and a decrease in deferred compensation of $222,000, offset by our working capital demands. The following are changes in the operating assets and liabilities during fiscal 2009: accounts receivable increased $638,000 primarily due to the timing of receipts; inventories decreased $8.6 million, primarily due to the inventory impairment of $7.2 million; prepaid expenses decreased $1.0 million primarily due to impairment of $7.1 million, partially offset by additional prepaid royalty advances; income taxes receivable increased $3.9 million, primarily due to our anticipated net operating loss carryback; other assets decreased $734,000 due to amortization and recoupments; accounts payable increased $11.1 million, primarily as a result of timing of disbursements; and accrued expenses decreased $1.1 million primarily related to a decrease in royalty expenses resulting from a decrease in sales.
Investing Activities
Cash flows used in investing activities totaled $9.9 million, $1.5 million and $1.2 million in fiscal 2011, 2010 and 2009, respectively.
The acquisition of Punch! totaled $8.1 million in fiscal 2011. The investment in software development totaled $978,000, $1.4 million and $677,000 for fiscal 2011, 2010 and 2009, respectively.
The acquisition of property and equipment totaled $816,000, $1.2 million and $3.1 million in fiscal 2011, 2010 and 2009, respectively. Purchases of assets in fiscal 2011 consisted primarily of computer equipment and assets related to our Canadian distribution facility. Purchases of fixed assets in fiscal 2010 consisted primarily of computer equipment, and system development and equipment for our Canadian distribution facility. Purchases of fixed assets in fiscal 2009 consisted primarily of computer equipment and the final implementation of our ERP project.
Purchase of intangible assets totaled zero, $12,000 and $666,000 for fiscal 2011, 2010 and 2009, respectively.
Sales of marketable equity securities totaled zero, $1.0 million and $3.2 million during fiscal 2011, 2010 and 2009, respectively, and related to sales of assets held in the Rabbi trust formed for purposes of funding deferred compensation payments to a former CEO.
Financing Activities
Cash flows used in financing activities were $4.0 million in fiscal 2011, $14.8 million in fiscal 2010 and $20.6 million in fiscal 2009.
We had $6.6 million of net repayments of the revolving line of credit (proceeds of $205.6 million and repayments of $212.2 million), increase in checks written in excess of cash balances of $4.0 million and payment of deferred compensation of $1.3 million in fiscal 2011.
We had $17.5 million of net repayments of the revolving line of credit (proceeds of $196.1 million and repayments of $213.6 million), increase in checks written in excess of cash balances of $4.5 million and debt acquisition costs of $1.8 million in fiscal 2010.
We had $7.1 million of net repayments of the revolving line of credit (proceeds of $208.8 million and repayments of $215.9 million), repayments on notes payable of $9.7 million, payment of deferred compensation of $3.2 million, increase in checks written in excess of cash balances of $311,000 and debt acquisition costs of $850,000 in fiscal 2009.
34
Table of Contents
Discontinued Operations
Net cash flows provided by discontinued operations were $5.2 million for fiscal 2011 and consisted of $5.6 million of cash flows provided by operating activities, $435,000 of cash flows used in investing activities and $9,000 of cash flows used in financing activities.
Net cash flows provided by discontinued operations were $3.3 million for fiscal 2010 and consisted of $3.9 million of cash flows provided by operating activities, $570,000 of cash flows used in investing activities and $10,000 of cash flows used in financing activities.
Net cash flows provided by discontinued operations were $9.4 million for fiscal 2009 and consisted of $8.6 million of cash flows provided by operating activities, $864,000 of cash flows provided by investing activities and $23,000 of cash flows used in financing activities.
Capital Resources
In March 2007, we amended and restated our $65.0 million revolving credit facility with General Electric Corporation (“GE”) (the “GE Facility”) and entered into a $15.0 million four-year Term Loan facility (“Term Loan”) with Monroe Capital Advisors, LLC. The Term Loan was paid in full on June 12, 2008 in connection with the Third Amendment to the GE Facility.
On June 12, 2008, we entered into a Third Amendment and Waiver to Fourth Amended and Restated Credit Agreement (the “Third Amendment”) with GE which, among other things, revised the terms of the GE Facility as follows: (i) permitted us to pay off the remaining $9.7 million balance of the term loan facility with Monroe; (ii) created a $6.0 million tranche of borrowings subject to interest at the index rate plus 6.25%, or LIBOR plus 7.5%; (iii) modified the interest rate payable in connection with borrowings to range from an index rate of 0.75% to 1.75%, or LIBOR plus 2.0% to 3.0%, depending upon borrowing availability during the prior fiscal quarter; (iv) extended the term of the GE Facility to March 22, 2012; (v) modified the prepayment penalty to 1.5% during the first year following the date of the Third Amendment, 1% during the second year following the date of the Third Amendment, and 0.5% during the third year following the date of the Third Amendment; and (vi) modified certain financial covenants as of March 31, 2008.
On October 30, 2008, we entered into a Fourth Amendment and Waiver to Fourth Amended and Restated Credit Agreement (the “Fourth Amendment”) with GE which revised the GE Facility as follows: effective as of September 30, 2008, (i) clarified the calculation of EBITDA under the credit agreement to indicate that it would not be impacted by any pre-tax, non-cash charges to earnings related to goodwill impairment; and (ii) revised the definition of “Index Rate” to indicate that the interest rate for non-LIBOR borrowings would not be less than the LIBOR rate for an interest period of three months.
On February 5, 2009, we entered into a Fifth Amendment and Waiver to Fourth Amended and Restated Credit Agreement (the “Fifth Amendment”) with GE which revised the terms of the GE Facility as follows: effective as of December 31, 2008, (i) clarified that the calculation of EBITDA under the credit agreement would not be impacted by certain pre-tax, non-cash restructuring charges to earnings, or in connection with cash charges to earnings recognized in our financial results related to a force reduction; (ii) eliminated the $6.0 million tranche of borrowings under the credit facility; (iii) modified the interest rate in connection with borrowings under the facility to index rate plus 5.75%, or LIBOR plus 4.75%; (iv) altered the commitment termination date of the GE Facility to June 30, 2010; (v) eliminated the pre-payment penalty; and (vi) modified certain financial covenants as of December 31, 2008 and thereafter. At March 31, 2009, we had $24.1 million outstanding on the GE Facility, which was paid in full on November 12, 2009 in connection with us obtaining a new credit facility, as described below.
On November 12, 2009, we entered into a three year, $65.0 million revolving credit facility (the “Credit Facility”) with Wells Fargo Foothill, LLC as agent and lender, and Capital One Leverage Financing Corp. as a participating lender. The Credit Facility is secured by a first priority security interest in all of our assets, as well as the capital stock of our subsidiary companies. Additionally, the Credit Facility calls for monthly interest payments at the bank’s base rate, as defined in the Credit Facility, plus 4.0% or LIBOR plus 4.0%, at our discretion. The entire outstanding balance of principal and interest is due in full on November 12, 2012. Amounts available under the credit facility are subject to a borrowing base formula. Changes in the assets within the borrowing base formula can impact the amount of availability. At March 31, 2011 we had zero outstanding and based on the facility’s borrowing base and other requirements, we had excess availability of $33.3 million.
35
Table of Contents
In association with both credit facilities, and per the respective terms, we pay and have paid certain facility and agent fees. Weighted average interest on the Credit Facility was 7.5% at both March 31, 2011 and 2010 and under the GE Facility was 5.6% at March 31, 2009. Such interest amounts have been and continue to be payable monthly.
Under the Credit Facility we are required to meet certain financial and non-financial covenants. The financial covenants include a variety of financial metrics that are used to determine our overall financial stability and include limitations on our capital expenditures, a minimum ratio of adjusted EBITDA to fixed charges, limitations on prepaid royalties and a borrowing base availability requirement. At March 31, 2011, we were in compliance with all covenants under the Credit Facility. We currently believe we will be in compliance with all covenants in the Credit Facility over the next twelve months.
Liquidity
We finance our operations through cash and cash equivalents, funds generated through operations, accounts payable and our revolving credit facility. The timing of cash collections and payments to vendors requires usage of our revolving credit facility in order to fund our working capital needs. We have a cash sweep arrangement with our lender, whereby, daily, all cash receipts from our customers reduce borrowings outstanding under the Credit Facility. Additionally, all payments to our vendors that are presented by the vendor to our bank for payment increase borrowings outstanding under the Credit Facility. “Checks written in excess of cash balances” may occur from time to time, including period ends, and represent payments made to vendors that have not yet been presented by the vendor to our bank, and therefore a corresponding advance on our revolving line of credit has not yet occurred. On a terms basis, we extend varying levels of credit to our customers and receive varying levels of credit from our vendors. During the last twelve months, we have not had any significant changes in the terms extended to customers or provided by vendors which would have a material impact on the reported financial statements.
We continually monitor our actual and forecasted cash flows, our liquidity and our capital resources. We plan for potential fluctuations in accounts receivable, inventory and payment of obligations to creditors and unbudgeted business activities that may arise during the year as a result of changing business conditions or new opportunities. In addition to working capital needs for the general and administrative costs of our ongoing operations, we have cash requirements for among other things: (1) investments to license content and develop software for established products; (2) investments to sign exclusive distribution agreements; (3) equipment needs for our operations; and (4) asset or company acquisitions. During fiscal 2011, we invested approximately $2.2 million, before recoveries, in connection with the acquisition of licensed and exclusively distributed product in our publishing business. Additionally, we invested approximately $8.1 million related to the Punch! acquisition.
Net cash flows provided by discontinued operations were $5.2 million, $3.3 million and $9.4 million for fiscal 2011, fiscal 2010 and fiscal 2009, respectively.
Our $65.0 million Credit Facility is subject to certain borrowing base requirements and is available for working capital and general corporate needs. As of March 31, 2011, we had zero outstanding and excess availability of $33.3 million, based on the terms of the agreement. Amounts available under the Credit Facility are subject to a borrowing base formula. Changes in the assets within the borrowing base formula can impact the amount of availability.
We currently believe cash and cash equivalents, funds generated from the expected results of operations, the $22.5 million of net proceeds received from the sale of FUNimation, funds available under our Credit Facility and vendor terms will be sufficient to satisfy our working capital requirements, other cash needs, and to finance expansion plans and strategic initiatives for at least the next 12 months, absent significant acquisitions. Additionally, with respect to long term liquidity, we have an effective shelf registration statement covering the offer and sale of up to $20.0 million of common and/or preferred shares. Any growth through acquisitions would likely require the use of additional equity or debt capital, some combination thereof, or other financing.
36
Table of Contents
Contractual Obligations
The following table presents information regarding contractual obligations that exist as of March 31, 2011 by fiscal year (in thousands):
| Total | Less than
1 Year |
1-3 Years |
3-5 Years |
More than
5 Years |
||||||||||||||||
| Operating leases (1) |
$ | 16,150 | $ | 2,466 | $ | 4,665 | $ | 4,172 | $ | 4,847 | ||||||||||
| Capital leases (2) |
131 | 74 | 57 | — | — | |||||||||||||||
| Contingent payment – acquisition (3) |
948 | 526 | 422 | — | — | |||||||||||||||
| Note payable – acquisition (3) |
1,002 | 1,002 | — | — | — | |||||||||||||||
| License and distribution agreements |
2,512 | 1,132 | 1,220 | 160 | — | |||||||||||||||
| Total |
$ | 20,743 | $ | 5,200 | $ | 6,364 | $ | 4,332 | $ | 4,847 | ||||||||||
| (1) | See further disclosure in Note 16 to our consolidated financial statements. |
| (2) | See further disclosure in Note 17 to our consolidated financial statements. |
| (3) | See further disclosure in Note 4 to our consolidated financial statements. |
We have excluded liabilities resulting from uncertain tax positions of $822,000 from the table above because we are unable to make a reasonably reliable estimate of the period of cash settlement with the respective taxing authorities. Additionally, interest payments related to the Credit Facility have been excluded as future interest rates are uncertain.
Off-Balance Sheet Arrangements
We do not have any off-balance sheet arrangements (as such term is defined in Item 303 of Regulation S-K) that are reasonably likely to have a current or future effect on our financial condition or changes in financial condition, operating results, or liquidity.
Item 7A. — Quantitative and Qualitative Disclosures About Market Risk
Market Risk. Market risk refers to the risk that a change in the level of one or more market prices, interest rates, indices, volatilities, correlations or other market factors such as liquidity will result in losses for a certain financial instrument or group of financial instruments. We do not hold or issue financial instruments for trading purposes, and do not enter into forward financial instruments to manage and reduce the impact of changes in foreign currency rates because we have few foreign relationships. Based on the controls in place and the relative size of the financial instruments entered into, we believe the risks associated with not using these instruments will not have a material adverse effect on our consolidated financial position or results of operations.
Interest Rate Risk. Our exposure to changes in interest rates results primarily from our Credit Facility borrowings. As of March 31, 2011 we had zero outstanding indebtedness subject to interest rate fluctuations. Based on these borrowings subject to interest rate fluctuations outstanding on March 31, 2011, a 100-basis point change in the current LIBOR rate would have no impact on our annual interest expense. The level of outstanding indebtedness fluctuates from period to period and therefore could have a future impact on our interest expense.
Foreign Currency Risk. Although increasing in number, we have a limited number of customers in Canada. The majority of the sales and purchasing activity related to these customers results in receivables and accounts payables denominated in Canadian dollars. When these transactions are translated into U.S. dollars at the exchange rate in effect at the time of each transaction, gain or loss is recognized. These gains and/or losses are reported as a separate component within other income and expense. Additionally, our balance sheet pertaining to these foreign operations are translated into U.S. dollars at the exchange rate in effect at each month end. The net unrealized balance sheet translation gains and/or losses are reported as accumulated other comprehensive income or loss.
During the years ended March 31, 2011, 2010 and 2009, we had $129,000 of foreign exchange loss, $788,000 of foreign exchange gain and $1.2 million of foreign exchange loss, respectively. Gain or loss on these activities is a function of the change in the foreign exchange rate between the sale or purchase date and the collection or payment of cash. Though the change in the exchange rate is out of our control, we periodically monitor our Canadian activities and can reduce exposure from the exchange rate fluctuations by limiting these activities or taking other actions, such as exchange rate hedging.
37
Table of Contents
Item 8. Financial Statements and Supplementary Data
The information called for by this item is set forth in the Consolidated Financial Statements and Schedule covered by the Reports of Independent Registered Public Accounting Firms at the end of this report commencing at the pages indicated below:
Reports of Independent Registered Public Accounting Firm
Consolidated Balance Sheets at March 31, 2011 and 2010
Consolidated Statements of Operations for the years ended March 31, 2011, 2010 and 2009
Consolidated Statements of Shareholders’ Equity and Comprehensive Income (Loss) for the years ended March 31, 2009, 2010 and 2011
Consolidated Statements of Cash Flows for the years ended March 31, 2011, 2010 and 2009
Notes to Consolidated Financial Statements
Schedule II — Valuation and Qualifying Accounts and Reserves for the years ended March 31, 2011, 2010 and 2009
All of the foregoing Consolidated Financial Statements and Schedule are hereby incorporated in this Item 8 by reference.
Item 9. Changes in and Disagreements with Accountants on Accounting and Financial Disclosure
None.
Item 9A. Controls and Procedures
Evaluation of Disclosure Controls and Procedures
We maintain disclosure controls and procedures (“Disclosure Controls”), as such term is defined in Rules 13a-15(e) and 15d-15(e) under the Exchange Act, that are designed to ensure that information required to be disclosed in our Exchange Act reports, including our Annual Report on Form 10-K, was recorded, processed, summarized and reported within the time periods specified in the SEC’s rules and forms, and that such information was accumulated and communicated to our management, including our Interim Chief Executive Officer and Chief Financial Officer, as appropriate, to allow timely decisions regarding required disclosure.
As required by Rule 13a-15(b) and 15d-15(b) promulgated under the Exchange Act, we carried out an evaluation, under the supervision and with the participation of our management, including our Interim Chief Executive Officer and Chief Financial Officer, of the effectiveness of the design and operation of our disclosure controls and procedures as of the end of the period covered by this report. Based on that evaluation, the Interim Chief Executive Officer and Chief Financial Officer concluded that our disclosure controls and procedures were effective as of the date of such evaluation.
Management’s Report on Internal Control over Financial Reporting
Our management is responsible for establishing and maintaining adequate internal control over financial reporting, as defined in Rule 13a-15(f) promulgated under the Exchange Act. Internal control over financial reporting is a process designed by, or under the supervision of, our Interim Chief Executive Officer and Chief Financial Officer and effected by our Board of Directors, management and other personnel, to provide reasonable assurance regarding the reliability of financial reporting and the preparation of an issuer’s financial statements for external purposes in accordance with accounting principles generally accepted in the United States of America (“GAAP”). Internal control over financial reporting includes policies and procedures that:
(i.) pertain to the maintenance of records that, in reasonable detail, accurately and fairly reflect the transactions and dispositions of an issuer’s assets;
38
Table of Contents
(ii.) provide reasonable assurance that transactions are recorded as necessary to permit preparation of financial statements in accordance with GAAP, and that an issuer’s receipts and expenditures are being made only in accordance with authorizations of its management and directors; and
(iii.) provide reasonable assurance regarding prevention or timely detection of unauthorized acquisition, use or disposition of an issuer’s assets that could have a material effect on the consolidated financial statements.
An internal control material weakness is a significant deficiency, or combination of significant deficiencies, that results in more than a remote likelihood that a material misstatement of the annual or interim financial statements will not be prevented or detected. Because of its inherent limitations, internal control over financial reporting may not prevent or detect misstatements. Also, the application of any evaluation of effectiveness to future periods is subject to the risk that controls may become inadequate because of changes in conditions, or that compliance with the policies or procedures may deteriorate.
As required by Rule 13a-15(c) promulgated under the Exchange Act, our management, with the participation of our Interim Chief Executive Officer and Chief Financial Officer, evaluated the effectiveness of our internal control over financial reporting as of March 31, 2011. Management’s assessment was based on criteria set forth by the Committee of Sponsoring Organizations of the Treadway Commission in Internal Control — Integrated Framework (“COSO”). Based on Management’s assessment, Management believes that, as of March 31, 2011, our internal control over financial reporting is effective based on those criteria.
Grant Thornton LLP, our independent registered public accounting firm, has issued an attestation report, included herein, on our internal control over financial reporting.
Changes in Internal Control over Financial Reporting
There were no changes in our internal control over financial reporting that occurred during our last fiscal quarter that have materially affected, or are reasonably likely to materially affect, our internal control over financial reporting, as defined in Rule 13a-15(f) under the Exchange Act.
None.
PART III
Item 10. Directors, Executive Officers of the Registrant and Corporate Governance
Information regarding our executive officers is found in Part I, Item 1 of this report under the heading Executive Officers of the Company.
All other information required under this item will be contained in our Proxy Statement for our 2011 Annual Meeting of Shareholders, which will be filed with the SEC within 120 days after our fiscal year end and is incorporated herein by reference.
Item 11. Executive Compensation
Information required under this item will be contained in our Proxy Statement for our 2011 Annual Meeting of Shareholders, which will be filed with the SEC within 120 days after our fiscal year end and is incorporated herein by reference.
Item 12. Security Ownership of Certain Beneficial Owners and Management and Related Shareholder Matters
Information required under this item will be contained in our Proxy Statement for our 2011 Annual Meeting of Shareholders, which will be filed with the SEC within 120 days after our fiscal year end and is incorporated herein by reference.
Item 13. Certain Relationships and Related Transactions, and Director Independence
Information required under this item will be contained in our Proxy Statement for our 2011 Annual Meeting of Shareholders, which will be filed with the SEC within 120 days after our fiscal year end and is incorporated herein by reference.
39
Table of Contents
Item 14. Principal Accounting Fees and Services
Information required under this item will be contained in our Proxy Statement for our 2011 Annual Meeting of Shareholders, which will be filed with the SEC within 120 days after our fiscal year end and is incorporated herein by reference.
PART IV
Item 15. Exhibits and Financial Statement Schedules
(a) Documents filed as part of this report –
| (1) | Financial Statements. Our following consolidated financial statements and the Reports of Independent Registered Public Accounting Firm thereon are set forth at the end of this document: |
| (i) | Reports of Independent Registered Public Accounting Firm. |
| (ii) | Consolidated Balance Sheets as of March 31, 2011 and 2010. |
| (iii) | Consolidated Statements of Operations for the years ended March 31, 2011, 2010 and 2009 |
| (iv) | Consolidated Statements of Shareholders’ Equity and Comprehensive Income (Loss) for the years ended March 31, 2009, 2010 and 2011. |
| (v) | Consolidated Statements of Cash Flows for the years ended March 31, 2011, 2010 and 2009. |
| (vi) | Notes to Consolidated Financial Statements |
| (2) | Financial Statement Schedules |
| (i) | Schedule II — Valuation and Qualifying Accounts and Reserves |
Schedules other than those listed above have been omitted because they are inapplicable or the required information is either immaterial or shown in the Consolidated Financial Statements or the notes thereto.
| (3) | Exhibit Listing |
| Exhibit number |
Exhibit description |
Filed here with |
Incorporated by reference | |||||||||||||||||||
| Form | Period ending |
Exhibit | Filing date |
|||||||||||||||||||
| 2.1 | Partnership Interest Purchase Agreement by and among Navarre CP, LLC, Navarre CS, LLC, and Navarre CLP, LLC, and FUNimation GP, LLC, Anime LP Holdings, LLC and FUNimation LP, LLC dated March 31, 2011 | 8-K | 2.1 | 04/05/11 | ||||||||||||||||||
| 3.1 | Navarre Corporation Amended and Restated Articles of Incorporation | S-1 | 3.1 | 04/13/06 | ||||||||||||||||||
| 3.2 | Navarre Corporation Amended and Restated Bylaws | 8-K | 3.1 | 01/25/07 | ||||||||||||||||||
| 4.1 | Form of Specimen Certificate for Common Stock | S-1 | 4.1 | 04/13/06 | ||||||||||||||||||
| 4.2 | Form of Warrant dated March 21, 2006 | S-1 | 4.4 | 04/13/06 | ||||||||||||||||||
| 4.3 | Form of Agent’s Warrant | S-1/A | 4.5 | 06/26/06 | ||||||||||||||||||
| 10.1* | Navarre Corporation Amended and Restated 1992 Stock Option Plan | 10-K | 03/31/02 | 10.3 | 07/01/02 | |||||||||||||||||
| 10.2* | 2003 Amendment to 1992 Stock Option Plan | S-8 | 99.1 | 09/23/03 | ||||||||||||||||||
| 10.3* | Form of Individual Stock Option Agreement under 1992 Stock Option Plan | S-1 | 10.4 | 09/03/93 | ||||||||||||||||||
| 10.4* | Navarre Corporation Amended and Restated 2004 Stock Plan, as amended September 13, 2007 (but only as to the addition of 1,500,000 shares available for issuance) | S-8 | 4 | 02/22/06 | ||||||||||||||||||
| 10.5* | Amendment No. 2 to Amended and Restated 2004 Stock Plan | DEF14A | A | 07/28/09 | ||||||||||||||||||
40
Table of Contents
| 10.6* | Form of Employee Stock Option Agreement under 2004 Stock Plan | 10-K | 03/31/05 | 10.58 | 06/14/05 | |||||||||||||||||
| 10.7* | Form of Non-Employee Director Stock Option Agreement under 2004 Stock Plan | 10-K | 03/31/05 | 10.59 | 06/14/05 | |||||||||||||||||
| 10.8* | Form of Employee Restricted Stock Agreement under 2004 Stock Plan | 8-K | 10.2 | 04/04/06 | ||||||||||||||||||
| 10.9* | Form of Director Restricted Stock Agreement under 2004 Stock Plan | 8-K | 10.3 | 04/04/06 | ||||||||||||||||||
| 10.10* | Form of TSR Stock Unit Agreement under 2004 Stock Plan | 8-K | 10.4 | 04/04/06 | ||||||||||||||||||
| 10.11* | Form of Performance Stock Unit Agreement under 2004 Stock Plan | 8-K | 10.5 | 04/04/06 | ||||||||||||||||||
| 10.12* | Form of Restricted Stock Unit Agreement under 2004 Stock Plan | 10-Q | 09/31/07 | 10.1 | 11/08/07 | |||||||||||||||||
| 10.13* | Form of Post-Acquisition Employment Agreement among the Company, FUNimation Productions, Ltd. and Gen Fukunaga | 8-K | 10.1 | (b) | 01/11/05 | |||||||||||||||||
| 10.14* | Employment Agreement dated May 7, 2010 among the Company, FUNimation Productions Ltd., animeOnline Ltd. and Gen Fukunaga | 8-K | 99.1 | 5/27/10 | ||||||||||||||||||
| 10.15* | Amended and Restated Employment Agreement dated December 28, 2006 between the Company and Cary L. Deacon | 8-K | 99.1 | 12/29/06 | ||||||||||||||||||
| 10.16* | Amendment dated January 29, 2007 to Amended and Restated Employment Agreement between the Company and Cary L. Deacon | 8-K | 10.1 | 01/30/07 | ||||||||||||||||||
| 10.17* | Amendment dated March 20, 2008 to Amended and Restated Employment Agreement between the Company and Cary L. Deacon | 8-K | 10.1 | 03/21/08 | ||||||||||||||||||
| 10.18* | Amended and Restated Executive Severance Agreement dated March 20, 2008 between the Company and J. Reid Porter | 8-K | 10.2 | 03/21/08 | ||||||||||||||||||
| 10.19* | Executive Severance Agreement dated March 20, 2008 between the Company and Joyce Fleck | 10-K | 03/31/09 | 10.22 | 06/09/09 | |||||||||||||||||
| 10.20* | Executive Severance Agreement dated March 20, 2008 between the Company and Calvin Morrell | 10-K | 03/31/09 | 10.23 | 06/09/09 | |||||||||||||||||
| 10.21* | Fiscal Year 2009 Annual Management Incentive Plan | 10-K | 03/31/08 | 10.26 | 06/16/08 | |||||||||||||||||
| 10.22* | Fiscal Year 2010 Annual Management Incentive Plan | 8-K | 10.1 | 04/21/09 | ||||||||||||||||||
| 10.23* | Fiscal Year 2011 Annual Management Incentive Plan | 8-K | 10.1 | 05/14/10 | ||||||||||||||||||
| 10.24 | Office/Warehouse Lease dated April 1, 1998 between the Company and Cambridge Apartments, Inc. | 10-K | 03/31/99 | 10.6 | 06/29/99 | |||||||||||||||||
| 10.25 | Amendment dated September 27, 2001 to Office/Warehouse Lease between the Company and Cambridge Apartments, Inc. | 10-Q | 06/30/03 | 10.9.1 | 08/14/03 | |||||||||||||||||
| 10.26 | Agreement of Reciprocal Easements, Covenants, Conditions and Restrictions dated June 16, 2003 | 10-Q | 06/30/03 | 10.9.3 | 08/14/03 | |||||||||||||||||
| 10.27 | Amendment dated July 14, 2003 to Office/Warehouse Lease between the Company and Cambridge Apartments, Inc. | 10-Q | 06/30/03 | 10.9.2 | 08/14/03 | |||||||||||||||||
| 10.28 | Form of Amendment dated February 23, 2004 to Office/Warehouse Lease between the Company and Cambridge Apartments, Inc. | 10-K | 03/31/04 | 10.48 | 06/29/04 | |||||||||||||||||
| 10.29 | Form of Amendment dated June 2004 to Office/Warehouse Lease between the Company and Cambridge Apartments, Inc. | 10-K | 03/31/04 | 10.49 | 06/29/04 | |||||||||||||||||
| 10.30 | Addendum dated May 27, 2004 to Office/Warehouse Lease between the Company and Cambridge Apartments, Inc. | 10-K | 03/31/04 | 10.51 | 06/29/04 | |||||||||||||||||
| 10.31 | Addendum dated November 12, 2009 to Office/Warehouse Lease between the Company and Cambridge Apartments, Inc. | 10-K | 03/31/10 | 10.39 | 06/11/10 | |||||||||||||||||
41
Table of Contents
| 10.32 | Amendment dated March 21, 2004 to Office/Warehouse Lease between the Company and Airport One Limited Partnership | 10-K | 03/31/04 | 10.50 | 06/29/04 | |||||||||||||||||
| 10.33 | Amendment dated November 23, 2004 to Office/Warehouse Lease between the Company and Airport One Limited Partnership | 10-Q | 12/31/04 | 10.1 | 02/14/05 | |||||||||||||||||
| 10.34 | Amendment dated February 2, 2006 to Office/Warehouse Lease between the Company and Airport One Limited Partnership | 10-Q | 12/31/05 | 10.1 | 02/09/06 | |||||||||||||||||
| 10.35 | Form of Office/Warehouse Lease dated May 27, 2004 between the Company and NL Ventures IV New Hope, L.P. | 10-K | 03/31/04 | 10.47 | 06/29/04 | |||||||||||||||||
| 10.36 | Office Lease dated October 8, 2004 between Encore Software, Inc. and Kilroy Realty, L.P. | 10-Q | 09/30/04 | 10.57 | 11/15/04 | |||||||||||||||||
| 10.37 | Amendment dated December 29, 2004 to Office Lease between Encore Software, Inc. and Kilroy Realty, L.P. | 10-Q | 12/31/04 | 10.3 | 02/14/05 | |||||||||||||||||
| 10.38 | Addendum dated April 29, 2010 to Office Lease between Encore Software, Inc. and Kilroy Realty, L.P. | 10-K | 03/31/10 | 10.46 | 06/11/10 | |||||||||||||||||
| 10.39 | Office/Warehouse Lease dated November 19, 2009 between the Company and Orlando Corporation | 10-K | 03/31/10 | 10.47 | 06/11/10 | |||||||||||||||||
| 10.40 | Consent to Assignment dated March 1, 2010 of Office/Warehouse Lease between the Company, Navarre Distribution Services ULC and Orlando Corporation | 10-K | 03/31/10 | 10.48 | 06/11/10 | |||||||||||||||||
| 10.41 | Office Lease dated May 29, 2007 between FUNimation Productions, Ltd. and FMBP Industrial I LP | 10-K | 03/31/07 | 10.117 | 06/14/07 | |||||||||||||||||
| 10.42 | Form of Securities Purchase Agreement dated March 2006 between the Company and various purchasers | S-1 | 4.2 | 04/13/06 | ||||||||||||||||||
| 10.43 | Form of Registration Rights Agreement dated March 2006 between the Company and various purchasers | S-1 | 4.3 | 04/13/06 | ||||||||||||||||||
| 10.44 | Form of Fourth Amended and Restated Credit Agreement dated March 22, 2007 among the Company, General Electric Capital Corporation, as Agent, and Lenders | 8-K | 10.1 | 03/23/07 | ||||||||||||||||||
| 10.45 | Form of Amendment and Limited Waiver dated May 30, 2007 to Fourth Amended and Restated Credit Agreement among the Company, General Electric Capital Corporation, as Agent, and Lenders | 8-K | 10.1 | 05/31/07 | ||||||||||||||||||
| 10.46 | Form of Amendment and Limited Waiver dated June 30, 2007 to Fourth Amended and Restated Credit Agreement among the Company, General Electric Capital Corporation, as Agent, and Lenders | 8-K | 10.1 | 08/13/07 | ||||||||||||||||||
| 10.47 | Form of Amendment and Limited Waiver dated June 12, 2008 to Fourth Amended and Restated Credit Agreement among the Company, General Electric Capital Corporation, as Agent, and Lenders | 10-K | 3/31/08 | 10.59 | 06/16/08 | |||||||||||||||||
| 10.48 | Form of Amendment dated October 30, 2008 to Fourth Amended and Restated Credit Agreement among the Company, General Electric Capital Corporation, as Agent, and Lenders | 8-K | 10.1 | 10/31/08 | ||||||||||||||||||
| 10.49 | Form of Amendment and Limited Waiver dated February 5, 2009 to Fourth Amended and Restated Credit Agreement among the Company, General Electric Capital Corporation, as Agent, and Lenders | 10-Q | 12/31/08 | 10.1 | 02/09/09 | |||||||||||||||||
| 10.50 | Form of Amendment dated February 17, 2009 to Fourth Amended and Restated Credit Agreement among the Company, General Electric Capital Corporation, as Agent, and Lenders | 8-K | 10.1 | 02/19/09 | ||||||||||||||||||
| 10.51 | Form of Credit Agreement dated March 22, 2007 among the Company, Monroe Capital Advisors, LLC, as Agent, and Lenders | 8-K | 10.2 | 03/23/07 | ||||||||||||||||||
42
Table of Contents
| 10.52 |
Limited Waiver dated May 30, 2007 to Credit Agreement among the Company, Monroe Capital Advisors, LLC, as Agent, and Lenders | 8-K | 10.2 | 05/31/07 | ||||||||||||||||
| 10.53 |
Form of Amendment dated June 30, 2007 to Credit Agreement among the Company, Monroe Capital Advisors, LLC, as Agent, and Lenders | 8-K | 10.2 | 08/13/07 | ||||||||||||||||
| 10.54 |
Form of Credit Agreement dated November 12, 2009 among the Company, Wells Fargo Capital Finance, LLC, as Agent, and Lenders | 8-K | 10.1 | 11/13/09 | ||||||||||||||||
| 10.55 |
Consent and Amendment dated April 29, 2010 to Credit Agreement among the Company, Wells Fargo Capital Finance, LLC, as Agent, and Lenders | 10-K | 03/31/10 | 10.69 | 06/11/10 | |||||||||||||||
| 10.56 |
Consent and Amendment dated May 17, 2010 to Credit Agreement among the Company, Wells Fargo Capital Finance, LLC, as Agent, and Lenders | 8-K | 10.2 | 05/17/10 | ||||||||||||||||
| 10.57 |
Asset Purchase Agreement dated May 17, 2010 by and among Encore Software, Inc., Navarre Corporation and Punch Software, LLC | 8-K | 10.1 | 05/17/10 | ||||||||||||||||
| 10.58 |
Settlement Agreement, dated February 11, 2011, by and among Navarre Corporation, Steven R. Becker, Matthew A. Drapkin, Becker Drapkin Management, L.P., Becker Drapkin Partners (Q.P.), L.P., Becker Drapkin Partners, L.P., BD Partners II, L.P. and BC Advisors, LLC | 8-K | 10.1 | 02/14/11 | ||||||||||||||||
| 10.59* |
Fiscal Year 2012 Annual Management Incentive Plan | X | ||||||||||||||||||
| 14.1 |
Navarre Corporation Code of Business Conduct and Ethics | 10-K | 03/31/04 | 14.1 | 06/29/04 | |||||||||||||||
| 21.1 |
Subsidiaries of the Registrant | X | ||||||||||||||||||
| 23.1 |
Consent of Independent Registered Public Accounting Firm — Grant Thornton LLP | X | ||||||||||||||||||
| 24.1 |
Power of Attorney, contained on signature page | X | ||||||||||||||||||
| 31.1 |
Certification of the Interim Chief Executive Officer and Chief Financial Officer pursuant to Section 302 of the Sarbanes-Oxley Act of 2002 (Rules 13a-14 and 15d-14 of the Exchange Act) | X | ||||||||||||||||||
| 32.1 |
Certification of the Interim Chief Executive Officer and Chief Financial Officer pursuant to Section 906 of the Sarbanes-Oxley Act of 2002 (18 U.S.C. Section 1350) | X | ||||||||||||||||||
| 99.1 |
Unaudited pro forma condensed consolidated balance sheets of Navarre Corporation as of December 31, 2010, and the unaudited pro forma condensed consolidated statements of operations of Navarre Corporation for the nine months ended December 31, 2010, and the fiscal years ended March 31, 2010, 2009 and 2008 | 8-K/A | 99.2 | 04/06/11 | ||||||||||||||||
| * | Indicates a management contract or compensatory plan or arrangement |
43
Table of Contents
Pursuant to the requirements of the Section 13 or 15(d) of the Securities Exchange Act of 1934, the registrant has duly caused this report to be signed on its behalf by the undersigned, thereunto duly authorized.
| Navarre Corporation | ||||||
| (Registrant) | ||||||
| June 9, 2011 | By | /s/ J. Reid Porter | ||||
| J. Reid Porter | ||||||
| Interim President, Interim Chief Executive Officer and Chief Financial Officer | ||||||
Pursuant to the requirements of the Securities Exchange Act of 1934, this report has been signed below by the following persons on behalf of the registrant and in the capacities and on the dates indicated.
44
Table of Contents
POWER OF ATTORNEY
KNOW ALL PERSONS BY THESE PRESENTS, that each person whose signature appears below constitutes and appoints J. Reid Porter as his/her true and lawful attorney-in-fact and agent, each with the power of substitution and resubstitution, for him/her and in his/her name, place and stead, in any and all capacities, to sign any amendments to this Annual Report on Form 10-K, and to file the same, with exhibits thereto and other documents in connection therewith, with the Securities and Exchange Commission, granting unto said attorney-in-fact and agent, full power and authority to do and perform each and every act and thing requisite and necessary to be done in and about the premises, as fully to all intents and purposes as he or she might or could do in person, hereby ratifying and confirming all said attorney-in-fact and agent, or his substitute or substitutes, may lawfully do or cause to be done by virtue thereof.
| Signature |
Title |
Date | ||
| /s/ J. Reid Porter |
Interim President, Interim Chief Executive Officer and Chief Financial Officer (principal executive, financial and accounting officer) | June 9, 2011 | ||
| J. Reid Porter | ||||
| /s/ Eric H. Paulson |
Chairman of the Board | June 9, 2011 | ||
| Eric H. Paulson | ||||
| /s/ Keith A. Benson |
Director | June 9, 2011 | ||
| Keith A. Benson | ||||
| /s/ David F. Dalvey |
Director | June 9, 2011 | ||
| David F. Dalvey | ||||
| /s/ Timothy R. Gentz |
Director | June 9, 2011 | ||
| Timothy R. Gentz | ||||
| /s/ Frederick C. Green IV |
Director | June 9, 2011 | ||
| Frederick C. Green IV | ||||
| /s/ Kathleen P. Iverson |
Director | June 9, 2011 | ||
| Kathleen P. Iverson | ||||
| /s/ Bradley J. Shisler |
Director | June 9, 2011 | ||
| Bradley J. Shisler | ||||
| /s/ Tom F. Weyl |
Director | June 9, 2011 | ||
| Tom F. Weyl | ||||
| /s/ Richard S Willis |
Director | June 9, 2011 | ||
| Richard S Willis | ||||
45
Table of Contents
REPORT OF INDEPENDENT REGISTERED PUBLIC ACCOUNTING FIRM
Board of Directors and Shareholders
Navarre Corporation
We have audited the accompanying consolidated balance sheets of Navarre Corporation (a Minnesota corporation) and subsidiaries (the “Company”) as of March 31, 2011 and 2010, and the related consolidated statements of operations, shareholders’ equity and comprehensive income (loss), and cash flows for each of the three years in the period ended March 31, 2011. Our audits of the basic consolidated financial statements included the financial statement schedule listed in the index appearing under Item 15(a)(2). These financial statements and financial statement schedule are the responsibility of the Company’s management. Our responsibility is to express an opinion on these financial statements and financial statement schedule based on our audits.
We conducted our audits in accordance with the standards of the Public Company Accounting Oversight Board (United States). Those standards require that we plan and perform the audit to obtain reasonable assurance about whether the financial statements are free of material misstatement. An audit includes examining, on a test basis, evidence supporting the amounts and disclosures in the financial statements. An audit also includes assessing the accounting principles used and significant estimates made by management, as well as evaluating the overall financial statement presentation. We believe that our audits provide a reasonable basis for our opinion.
In our opinion, the consolidated financial statements referred to above present fairly, in all material respects, the financial position of Navarre Corporation and subsidiaries as of March 31, 2011 and 2010, and the results of their operations and their cash flows for each of the three years in the period ended March 31, 2011, in conformity with accounting principles generally accepted in the United States of America. Also in our opinion, the related financial statement schedule, when considered in relation to the basic consolidated financial statements taken as a whole, presents fairly, in all material respects, the information set forth therein.
We also have audited, in accordance with the standards of the Public Company Accounting Oversight Board (United States), Navarre Corporation and subsidiaries’ internal control over financial reporting as of March 31, 2011, based on criteria established in Internal Control-Integrated Framework issued by the Committee of Sponsoring Organizations of the Treadway Commission (COSO), and our report dated June 9, 2011 expressed an unqualified opinion on the effectiveness of the Company’s internal control over financial reporting.
/s/ Grant Thornton LLP
Minneapolis, Minnesota
June 9, 2011
46
Table of Contents
REPORT OF INDEPENDENT REGISTERED PUBLIC ACCOUNTING FIRM
Board of Directors and Shareholders
Navarre Corporation
We have audited Navarre Corporation (a Minnesota corporation) and subsidiaries (the “Company”) internal control over financial reporting as of March 31, 2011, based on criteria established in Internal Control-Integrated Framework issued by the Committee of Sponsoring Organizations of the Treadway Commission (COSO). The Company’s management is responsible for maintaining effective internal control over financial reporting and for its assessment of the effectiveness of internal control over financial reporting, included in the accompanying Management’s Report on Internal Control over Financial Reporting. Our responsibility is to express an opinion on the Company’s internal control over financial reporting based on our audit.
We conducted our audit in accordance with the standards of the Public Company Accounting Oversight Board (United States). Those standards require that we plan and perform the audit to obtain reasonable assurance about whether effective internal control over financial reporting was maintained in all material respects. Our audit included obtaining an understanding of internal control over financial reporting, assessing the risk that a material weakness exists, testing and evaluating the design and operating effectiveness of internal control based on the assessed risk, and performing such other procedures as we considered necessary in the circumstances. We believe that our audit provides a reasonable basis for our opinion.
A company’s internal control over financial reporting is a process designed to provide reasonable assurance regarding the reliability of financial reporting and the preparation of financial statements for external purposes in accordance with generally accepted accounting principles. A company’s internal control over financial reporting includes those policies and procedures that (1) pertain to the maintenance of records that, in reasonable detail, accurately and fairly reflect the transactions and dispositions of the assets of the company; (2) provide reasonable assurance that transactions are recorded as necessary to permit preparation of financial statements in accordance with generally accepted accounting principles, and that receipts and expenditures of the company are being made only in accordance with authorizations of management and directors of the company; and (3) provide reasonable assurance regarding prevention or timely detection of unauthorized acquisition, use, or disposition of the company’s assets that could have a material effect on the financial statements.
Because of its inherent limitations, internal control over financial reporting may not prevent or detect misstatements. Also, projections of any evaluation of effectiveness to future periods are subject to the risk that controls may become inadequate because of changes in conditions, or that the degree of compliance with the policies or procedures may deteriorate.
In our opinion, Navarre Corporation and subsidiaries maintained, in all material respects, effective internal control over financial reporting as of March 31, 2011, based on criteria established in Internal Control-Integrated Framework issued by COSO.
We also have audited, in accordance with the standards of the Public Company Accounting Oversight Board (United States), the consolidated balance sheets of Navarre Corporation and subsidiaries as of March 31, 2011 and 2010 and the related consolidated statements of operations, shareholders’ equity and comprehensive income (loss), and cash flows for each of the three years in the period ended March 31, 2011, and our report dated June 9, 2011 expressed an unqualified opinion on those financial statements.
/s/ Grant Thornton LLP
Minneapolis, Minnesota
June 9, 2011
47
Table of Contents
NAVARRE CORPORATION
CONSOLIDATED BALANCE SHEETS
(in thousands, except share amounts)
| March 31, | ||||||||
| 2011 | 2010 | |||||||
| Assets |
||||||||
| Current assets: |
||||||||
| Marketable securities |
$ | — | $ | 2 | ||||
| Accounts receivable, less allowances of $4,701 and $5,791, respectively |
57,833 | 60,855 | ||||||
| Receivable from the sale of discontinued operations |
24,000 | — | ||||||
| Inventories |
24,913 | 21,164 | ||||||
| Prepaid expenses |
3,957 | 3,377 | ||||||
| Income tax receivable |
— | 94 | ||||||
| Deferred tax assets — current, net |
6,436 | 7,603 | ||||||
| Current assets of discontinued operations |
— | 7,096 | ||||||
| Total current assets |
117,139 | 100,191 | ||||||
| Property and equipment, net of accumulated depreciation of $22,296 and $19,556, respectively |
9,299 | 11,790 | ||||||
| Software development costs, net of amortization of $823 and $324, respectively |
2,202 | 1,723 | ||||||
| Other assets: |
||||||||
| Intangible assets, net of accumulated amortization of $482 and $38, respectively |
2,375 | 32 | ||||||
| Goodwill |
5,709 | — | ||||||
| Deferred tax assets — non-current, net |
24,320 | 13,808 | ||||||
| Non-current prepaid expenses |
9,667 | 10,134 | ||||||
| Other assets |
3,155 | 4,166 | ||||||
| Non-current assets of discontinued operations |
— | 29,434 | ||||||
| Total assets |
$ | 173,866 | $ | 171,278 | ||||
| Liabilities and shareholders’ equity |
||||||||
| Current liabilities: |
||||||||
| Revolving line of credit |
$ | — | $ | 6,634 | ||||
| Accounts payable |
80,379 | 78,943 | ||||||
| Checks written in excess of cash balances |
8,685 | 4,816 | ||||||
| Deferred compensation |
— | 1,333 | ||||||
| Accrued expenses |
7,768 | 10,126 | ||||||
| Contingent payment obligation short-term — acquisition (Note 4) |
526 | — | ||||||
| Note payable — acquisition (Note 4) |
1,002 | — | ||||||
| Other liabilities — short-term |
103 | 51 | ||||||
| Current liabilities of discontinued operations |
— | 6,785 | ||||||
| Total current liabilities |
98,463 | 108,688 | ||||||
| Long-term liabilities |
||||||||
| Contingent payment obligation long-term — acquisition (Note 4) |
422 | — | ||||||
| Other liabilities — long-term |
1,795 | 1,829 | ||||||
| Total liabilities |
100,680 | 110,517 | ||||||
| Commitments and contingencies (Note 16) |
||||||||
| Shareholders’ equity: |
||||||||
| Common stock, no par value: |
||||||||
| Authorized shares — 100,000,000; issued and outstanding shares — 36,577,605 at March 31, 2011 and 36,366,668 at March 31, 2010 |
162,997 | 162,015 | ||||||
| Accumulated deficit |
(90,071 | ) | (101,254 | ) | ||||
| Accumulated other comprehensive income |
260 | — | ||||||
| Total shareholders’ equity |
73,186 | 60,761 | ||||||
| Total liabilities and shareholders’ equity |
$ | 173,866 | $ | 171,278 | ||||
See accompanying notes to consolidated financial statements.
48
Table of Contents
NAVARRE CORPORATION
CONSOLIDATED STATEMENTS OF OPERATIONS
(in thousands, except per share amounts)
| Years ended March 31, | ||||||||||||
| 2011 | 2010 | 2009 | ||||||||||
| Net sales |
$ | 490,897 | $ | 495,770 | $ | 599,059 | ||||||
| Cost of sales (exclusive of depreciation) |
425,729 | 427,726 | 549,458 | |||||||||
| Gross profit |
65,168 | 68,044 | 49,601 | |||||||||
| Operating expenses: |
||||||||||||
| Selling and marketing |
21,099 | 18,144 | 19,719 | |||||||||
| Distribution and warehousing |
10,694 | 9,799 | 12,166 | |||||||||
| General and administrative |
23,573 | 24,526 | 27,429 | |||||||||
| Depreciation and amortization |
3,848 | 4,037 | 7,780 | |||||||||
| Goodwill impairment |
— | — | 10,531 | |||||||||
| Total operating expenses |
59,214 | 56,506 | 77,625 | |||||||||
| Income (loss) from operations |
5,954 | 11,538 | (28,024 | ) | ||||||||
| Other income (expense): |
||||||||||||
| Interest (expense) income, net |
(1,754 | ) | (2,240 | ) | (3,222 | ) | ||||||
| Other income (expense), net |
(153 | ) | 788 | (1,194 | ) | |||||||
| Income (loss) from continuing operations before income tax |
4,047 | 10,086 | (32,440 | ) | ||||||||
| Income tax benefit (expense) |
8,446 | 8,602 | (10,943 | ) | ||||||||
| Net income (loss) from continuing operations |
12,493 | 18,688 | (43,383 | ) | ||||||||
| Discontinued operations, net of tax |
||||||||||||
| Loss on sale of discontinued operations |
(5,198 | ) | — | — | ||||||||
| Income (loss) from discontinued operations |
3,888 | 4,184 | (45,051 | ) | ||||||||
| Net income (loss) |
$ | 11,183 | $ | 22,872 | $ | (88,434 | ) | |||||
| Basic earnings (loss) per common share: |
||||||||||||
| Continuing operations |
$ | 0.34 | $ | 0.51 | $ | (1.20 | ) | |||||
| Discontinued operations |
(0.03 | ) | 0.12 | (1.24 | ) | |||||||
| Net income (loss) |
$ | 0.31 | $ | 0.63 | $ | (2.44 | ) | |||||
| Diluted earnings (loss) per common share: |
||||||||||||
| Continuing operations |
$ | 0.34 | $ | 0.51 | $ | (1.20 | ) | |||||
| Discontinued operations |
(0.04 | ) | 0.11 | (1.24 | ) | |||||||
| Net income (loss) |
$ | 0.30 | $ | 0.62 | $ | (2.44 | ) | |||||
| Weighted average shares outstanding: |
||||||||||||
| Basic |
36,446 | 36,285 | 36,207 | |||||||||
| Diluted |
36,952 | 36,643 | 36,207 | |||||||||
See accompanying notes to consolidated financial statements.
49
Table of Contents
NAVARRE CORPORATION
CONSOLIDATED STATEMENTS OF SHAREHOLDERS’ EQUITY AND COMPREHENSIVE INCOME (LOSS)
(in thousands, except share amounts)
| Common Stock | Accumulated | Accumulated Other Comprehensive |
Total Shareholders’ |
|||||||||||||||||
| Shares | Amount | Deficit | Income (Loss) | Equity | ||||||||||||||||
| Balance at March 31, 2008 |
36,227,886 | 160,103 | (35,692 | ) | — | 124,411 | ||||||||||||||
| Shares issued upon exercise of stock options and for restricted stock |
50,199 | 12 | — | — | 12 | |||||||||||||||
| Share based compensation |
— | 1,033 | — | — | 1,033 | |||||||||||||||
| Tax benefit from employee stock option plans |
— | 1 | — | — | 1 | |||||||||||||||
| Redemptions of common stock to cover tax withholdings |
(17,969 | ) | (15 | ) | — | — | (15 | ) | ||||||||||||
| Net loss |
— | — | (88,434 | ) | — | (88,434 | ) | |||||||||||||
| Unrealized loss on marketable securities |
— | — | — | (1 | ) | (1 | ) | |||||||||||||
| Comprehensive loss |
(88,435 | ) | ||||||||||||||||||
| Balance at March 31, 2009 |
36,260,116 | 161,134 | (124,126 | ) | (1 | ) | 37,007 | |||||||||||||
| Shares issued upon exercise of stock options and for restricted stock |
158,003 | 5 | — | — | 5 | |||||||||||||||
| Share based compensation |
— | 1,004 | — | — | 1,004 | |||||||||||||||
| Redemptions of common stock to cover tax withholdings |
(51,451 | ) | (128 | ) | — | — | (128 | ) | ||||||||||||
| Net income |
— | — | 22,872 | — | 22,872 | |||||||||||||||
| Unrealized gain on marketable securities |
1 | 1 | ||||||||||||||||||
| Comprehensive income |
22,873 | |||||||||||||||||||
| Balance at March 31, 2010 |
36,366,668 | $ | 162,015 | $ | (101,254 | ) | $ | — | $ | 60,761 | ||||||||||
| Shares issued upon exercise of stock options and for restricted stock |
284,739 | 56 | — | — | 56 | |||||||||||||||
| Share based compensation |
— | 1,096 | — | — | 1,096 | |||||||||||||||
| Redemptions of common stock to cover tax withholdings |
(73,802 | ) | (170 | ) | — | — | (170 | ) | ||||||||||||
| Net income |
— | — | 11,183 | — | 11,183 | |||||||||||||||
| Unrealized gain on foreign exchange rate translation |
260 | 260 | ||||||||||||||||||
| Comprehensive income |
11,443 | |||||||||||||||||||
| Balance at March 31, 2011 |
36,577,605 | $ | 162,997 | $ | (90,071 | ) | $ | 260 | $ | 73,186 | ||||||||||
See accompanying notes to consolidated financial statements.
50
Table of Contents
NAVARRE CORPORATION
CONSOLIDATED STATEMENTS OF CASH FLOWS
(in thousands)
| Years ended March 31, | ||||||||||||
| 2011 | 2010 | 2009 | ||||||||||
| Operating activities: |
||||||||||||
| Net income (loss) |
$ | 11,183 | $ | 22,872 | $ | (88,434 | ) | |||||
| Adjustments to reconcile net income (loss) to net cash provided by operating activities: |
||||||||||||
| (Income) loss from discontinued operations |
(3,888 | ) | (4,184 | ) | 45,051 | |||||||
| Loss on sale of discontinued operations |
5,198 | — | — | |||||||||
| Depreciation and amortization |
3,848 | 4,037 | 7,768 | |||||||||
| Amortization of debt acquisition costs |
596 | 502 | 250 | |||||||||
| Write-off of debt acquisition costs |
— | 289 | 950 | |||||||||
| Amortization of software development costs |
499 | 324 | — | |||||||||
| Goodwill impairment |
— | — | 10,531 | |||||||||
| Share-based compensation expense |
1,096 | 1,004 | 1,033 | |||||||||
| Deferred compensation expense |
— | (816 | ) | (222 | ) | |||||||
| Deferred income taxes |
(8,626 | ) | (7,293 | ) | 14,903 | |||||||
| Other |
303 | 88 | 295 | |||||||||
| Changes in operating assets and liabilities: |
||||||||||||
| Accounts receivable |
4,225 | 13,094 | (638 | ) | ||||||||
| Inventories |
(2,796 | ) | (1,118 | ) | 8,572 | |||||||
| Prepaid expenses |
(16 | ) | (2,535 | ) | 948 | |||||||
| Income taxes receivable |
131 | 4,772 | (3,929 | ) | ||||||||
| Other assets |
29 | 314 | 734 | |||||||||
| Accounts payable |
912 | (21,014 | ) | 11,135 | ||||||||
| Accrued expenses |
(4,000 | ) | 2,690 | (1,061 | ) | |||||||
| Net cash provided by operating activities |
8,694 | 13,026 | 7,886 | |||||||||
| Investing activities: |
||||||||||||
| Cash paid for acquisition |
(8,090 | ) | — | — | ||||||||
| Purchases of property and equipment |
(816 | ) | (1,198 | ) | (3,055 | ) | ||||||
| Purchases of intangible assets |
— | (12 | ) | (666 | ) | |||||||
| Investment in software development |
(978 | ) | (1,370 | ) | (677 | ) | ||||||
| Proceeds from sale of marketable equity securities |
— | 1,028 | 3,200 | |||||||||
| Proceeds from sale of intangible assets |
— | 20 | — | |||||||||
| Net cash used in investing activities |
(9,884 | ) | (1,532 | ) | (1,198 | ) | ||||||
| Financing activities: |
||||||||||||
| Proceeds from revolving line of credit |
205,560 | 196,060 | 208,758 | |||||||||
| Payments on revolving line of credit |
(212,194 | ) | (213,559 | ) | (215,939 | ) | ||||||
| Repayment of note payable |
— | — | (9,744 | ) | ||||||||
| Payment of deferred compensation |
(1,333 | ) | — | (3,200 | ) | |||||||
| Checks written in excess of cash balance |
3,974 | 4,519 | 311 | |||||||||
| Debt acquisition costs |
— | (1,790 | ) | (850 | ) | |||||||
| Other |
4 | (51 | ) | 107 | ||||||||
| Net cash used in financing activities |
(3,989 | ) | (14,821 | ) | (20,557 | ) | ||||||
| Net cash used in continuing operations |
(5,179 | ) | (3,327 | ) | (13,869 | ) | ||||||
| Discontinued operations: |
||||||||||||
| Net cash provided by operating activities |
5,623 | 3,907 | 8,583 | |||||||||
| Net cash (used in) provided by investing activities |
(435 | ) | (570 | ) | 864 | |||||||
| Net cash used in financing activities |
(9 | ) | (10 | ) | (23 | ) | ||||||
| Net increase (decrease) in cash and cash equivalents |
— | — | (4,445 | ) | ||||||||
| Cash and cash equivalents at beginning of year |
— | — | 4,445 | |||||||||
| Cash and cash equivalents at end of year |
$ | — | $ | — | $ | — | ||||||
| Supplemental cash flow information: |
||||||||||||
| Cash and cash equivalents paid for (received from): |
||||||||||||
| Interest |
$ | 1,675 | $ | 1,861 | $ | 3,885 | ||||||
| Income taxes, net of refunds |
14 | (5,773 | ) | (262 | ) | |||||||
| Supplemental schedule of non-cash investing and financing activities: |
||||||||||||
| Note payable and contingent payment obligations related to the Punch! purchase price allocation |
1,950 | — | — | |||||||||
| Redemptions of common stock to cover tax withholdings |
170 | 128 | 15 | |||||||||
| Other comprehensive income related to gain on foreign exchange translation |
260 | — | — | |||||||||
| Other comprehensive income (loss) related to gain (loss) on marketable securities |
— | 1 | (1 | ) | ||||||||
| Expiration of fully amortized masters |
— | 8,078 | — | |||||||||
See accompanying notes to consolidated financial statements.
51
Table of Contents
NAVARRE CORPORATION
NOTES TO CONSOLIDATED FINANCIAL STATEMENTS
March 31, 2011
Note 1 Business Description
Navarre Corporation, (the “Company” or “Navarre”), a Minnesota corporation formed in 1983, is a distributor, provider of complete logistics solutions and publisher of computer software. The Company operates through two business segments —distribution and publishing.
Through the distribution business, the Company distributes computer software, consumer electronics and accessories, video games, and home videos, and provides fee-based logistical services. The distribution business focuses on providing a range of value-added services, including vendor-managed inventory, electronic and internet-based ordering and gift card fulfillment. The Company has relationships with certain of its customers and vendors whereby the Company provides fee-based services, which are recognized on a net basis within sales.
Through the publishing business, the Company owns or licenses various widely-known computer software brands through Encore Software, Inc. (“Encore”). In addition to retail publishing, Encore also sells directly to consumers through its e-commerce websites.
The Company also formerly published and sold anime content through FUNimation Productions, Ltd. (“FUNimation”). The Company sold FUNimation on March 31, 2011 and accordingly, the results of operations, assets and liabilities of FUNimation for all periods presented are classified as discontinued operations (see further disclosure in Note 3).
The Company’s publishing business also formerly published budget home video through BCI Eclipse Company, LLC (“BCI”), which began winding down its licensing operations related to budget home video during fiscal 2009. The wind-down was completed during the fourth quarter of fiscal 2010.
Note 2 Summary of Significant Accounting Policies
Basis of Consolidation
The consolidated financial statements include the accounts of Navarre Corporation and its wholly-owned subsidiaries, Encore and BCI (collectively referred to herein as the “Company”). All significant inter-company accounts and transactions have been eliminated in consolidation. The results of operations, assets and liabilities of FUNimation for all periods are classified as discontinued operations.
Upon the sale of FUNimation, the Company assessed the terms of its investment interests to determine if any of the investments met the definition of a variable interest entity (“VIE”) in accordance with accounting standards effective through that date. Based on the Company’s evaluation it was determined that FUNimation was a VIE. Consolidating any VIEs within the Company’s financial results is required if the Company is found to be the primary beneficiary. However, because the Company did not have the power to direct the activities of the VIE that most significantly impacted their economic performance, nor did the Company have the obligation to absorb the significant losses or the right to receive significant benefits from the VIE, it was determined that the Company was not the primary beneficiary. Therefore, the results of FUNimation were not consolidated into the Company’s financial results (see further disclosure in Note 24).
Segment Reporting
The Company’s current presentation of segment data consists of two operating and reportable segments — distribution and publishing.
Fiscal Year
References in these footnotes to fiscal 2011, 2010 and 2009 represent the twelve months ended March 31, 2011, March 31, 2010 and March 31, 2009, respectively.
52
Table of Contents
Use of Estimates
The preparation of consolidated financial statements in conformity with accounting principles generally accepted in the United States of America requires management to make estimates and assumptions that affect the amounts of assets and liabilities and disclosure of contingent assets and liabilities at the date of the consolidated financial statements and the reported amounts of revenues and expenses during the reporting period. Significant estimates include the realizability of accounts receivable, vendor advances, inventories, goodwill, intangible assets, prepaid royalties, deferred tax assets and the adequacy of certain accrued liabilities and reserves. Actual results could differ from these estimates.
Reclassifications
Certain operating expense and balance sheet classifications included in the consolidated financial statements have been reclassified from the prior years’ presentations to conform to the current year presentation.
Fair Value of Financial Instruments
The carrying value of the Company’s current financial assets and liabilities, because of their short-term nature, approximates fair value.
Cash and Cash Equivalents
The Company considers short-term investments with an original maturity of three months or less when purchased to be cash equivalents. From time to time, the Company reports “checks written in excess of cash balances.” This amount represents payments made to vendors that have not yet been presented by the vendor to the Company’s bank and drawn against the Company’s revolving line of credit.
Marketable Securities
The Company has classified all marketable securities as available-for-sale which requires the securities to be reported at fair value, with unrealized gains and losses, net of tax, reported as a separate component of shareholders’ equity. Marketable securities at March 31, 2010 consisted of a money market fund. The account was liquidated during the first quarter of fiscal 2011 in conjunction with the final deferred compensation payment.
The fair value of marketable securities was determined by quoted market prices. Dividend and interest income were recognized when earned. Realized gains and losses for securities classified as available-for-sale were included in income and were derived using the specific identification method for determining the cost of the securities sold.
Inventories
Inventories are stated at the lower of cost or market with cost determined on the first-in, first-out (FIFO) method. The Company monitors its inventory to ensure that it properly identifies, on a timely basis, inventory items that are slow-moving and non-returnable. Certain publishing business products may run out of shelf life and be returned. Generally, these products can be sold in bulk to a variety of liquidators. A significant risk is product that cannot be sold at carrying value and is not returnable to the vendor or manufacturer. The Company adjusts the carrying value to the estimated realizable value in the periods when the Company first identifies the existence of a lower of cost or market issue. Consigned inventory includes product that has been delivered to customers for which revenue recognition criteria have not been met.
Advertising
Advertising costs are expensed as incurred. Advertising expense was $1.7 million, $1.1 million and $246,000 for the years ended March 31, 2011, 2010 and 2009, respectively.
53
Table of Contents
Property and Equipment
Property and equipment are recorded at cost. Depreciation is recorded, using the straight-line method, over estimated useful lives, ranging from three to ten years. Depreciation is computed using the straight-line method for leasehold improvements over the shorter of the lease term or the estimated useful life. Estimated useful lives by major asset categories are as follows:
| Asset |
Life in Years | |||
| Furniture and fixtures |
7 | |||
| Office equipment |
5 | |||
| Computer equipment |
3-5 | |||
| Warehouse equipment |
5 | |||
| Leasehold improvements |
1-10 | |||
| Enterprise resource planning (ERP) system |
7 | |||
Maintenance, repairs and minor renewals are charged to expense as incurred. Additions, major renewals and property and equipment improvements are capitalized.
Impairment of Long-Lived Assets
Long-lived assets, such as property and equipment and amortizable intangible assets, are evaluated for impairment whenever events or changes in circumstances indicate the carrying value of an asset may not be recoverable. An impairment loss is recognized when estimated undiscounted cash flows expected to result from the use of the asset plus net proceeds expected from disposition of the asset, if any, are less than the carrying value of the asset. When an impairment loss is recognized, the carrying amount of the asset is reduced to its estimated fair value (see further disclosure in Note 5 and Note 6).
Goodwill
Goodwill represents the excess of the purchase price over the fair value of identifiable net assets acquired in business combinations accounted for under the purchase method. The Company reviews goodwill for potential impairment annually for each reporting unit or when events or changes in circumstances indicate the carrying value of the goodwill might exceed its current fair value. Factors which may cause impairment include negative industry or economic trends and significant underperformance relative to historical or projected future operating results. The Company determines fair value using widely accepted valuation techniques, including discounted cash flow and market multiple analysis. The amount of impairment loss is recognized as the excess of the asset’s carrying value over its fair value (see further disclosure in Note 5 and Note 6).
Intangible Assets
Intangible assets include trademarks, developed technology, customer relationships, a customer list and a domain name. Intangible assets (except for trademarks) are amortized on a straight-line basis with estimated useful lives ranging from three to eight years. The straight-line method of amortization of these assets reflects an appropriate allocation of the costs of the intangible assets to its useful life. Intangible assets are tested for impairment whenever events or circumstances indicate that a carrying amount of an asset may not be recoverable. An impairment loss is generally recognized when the carrying amount of an asset exceeds the estimated fair value of the asset. Fair value is generally determined using a discounted cash flow analysis (see further disclosure in Note 5 and Note 6).
Trademarks are deemed to have indefinite lives and are evaluated for impairment annually.
Debt Issuance Costs
Debt issuance costs are included in “Other Assets” and are amortized over the life of the related debt. Amortization expense is included in interest expense in the accompanying Consolidated Statements of Operations.
Operating Leases
The Company conducts substantially all operations in leased facilities. Leasehold allowances, rent holidays and escalating rent provisions are accounted for on a straight-line basis over the term of the lease. The portion of deferred rent due in twelve months or less is considered short-term and is included in accrued expenses in the accompanying Consolidated Balance Sheets. The long-term portion is included in other liabilities — long-term.
54
Table of Contents
Revenue Recognition
Revenue on products shipped, including consigned products owned by the Company, is recognized when title and risk of loss transfers, delivery has occurred, the price to the buyer is determinable and collectability is reasonably assured. Service revenues are recognized upon delivery of the services and have represented less than 10% of total net sales for each of the reporting periods, fiscal 2011, 2010 and 2009. The Company has relationships with certain of its customers and vendors whereby the Company provides fee-based services, which are recognized on a net basis within sales. The Company permits its customers to return or destroy products at customer locations, under certain conditions. The Company records a reserve for sales returns, product destructions and allowances against amounts due to reduce the net recognized receivables to the amounts the Company reasonably believes will be collected. These reserves are based on the application of the Company’s historical or anticipated gross profit percent against average sales returns and product destructions, sales discounts percent against average gross sales and specific reserves for marketing programs.
The Company’s distribution customers, at times, qualify for certain price protection benefits from the Company’s vendors. The Company serves as an intermediary to settle these amounts between vendors and customers. The Company accounts for these amounts as reductions of revenues with corresponding reductions in cost of sales.
The Company’s publishing business, at times, provides certain price protection, promotional monies, volume rebates and other incentives to customers. The Company records these amounts as reductions in revenue.
Vendor Allowances
In the distribution business, the Company receives allowances from certain vendors as a result of purchasing their products. Vendor allowances are initially deferred. The deferred amounts are then recorded as a reduction of cost of sales when the related product is sold.
Marketing Development Funds
The Company has classified marketing development funds, such as price protection and promotions, as a reduction to revenues in the publishing business.
Accounts Receivable and Allowance for Doubtful Accounts
Credit is extended based on evaluation of a customer’s financial condition and, generally, collateral is not required. Accounts receivable are generally due within 30-90 days and are stated at amounts due from customers, net of an allowance for doubtful accounts. Accounts receivable outstanding longer than the contractual payment terms are considered past due. The Company does not accrue interest on past due accounts receivable. The Company performs periodic credit evaluations of its customers’ financial condition. The Company makes estimates of the uncollectability of its accounts receivable. In determining the adequacy of its allowances, the Company analyzes customer financial statements, historical collection experience, aging of receivables, substantial down-grading of credit scores, bankruptcy filings and other economic and industry factors. The Company writes off accounts receivable when they become uncollectible, and payments subsequently received on such receivables are credited to the allowance for doubtful accounts. Although risk management practices and methodologies are utilized to determine the adequacy of the allowance, it is possible that the accuracy of the estimation process could be materially impacted by different judgments as to collectability based on the information considered and further deterioration of accounts. The Company’s largest collection risks exist for customers that are in bankruptcy, or at risk of bankruptcy. The occurrence of these events is infrequent, but can be material when it does occur.
Shipping Costs and Revenue
Costs incurred in the distribution business related to the shipment of product to its customers are classified in selling expenses. These costs were $8.8 million, $7.8 million and $9.4 million for the years ended March 31, 2011, 2010 and 2009, respectively.
Costs incurred in the publishing business related to the shipment of product to its customers are classified in cost of sales. These costs were $749,000, $137,000 and $433,000 for the years ended March 31, 2011, 2010 and 2009, respectively.
Consolidated shipping revenue is included in net sales and was $2.4 million, $1.2 million and $616,000 for the years ended March 31, 2011, 2010 and 2009, respectively.
55
Table of Contents
Foreign Currency Transactions
Transaction gains and losses that arise from exchange rate fluctuations on transactions denominated in a currency other than the functional currency are included in the results of operations when settled or at the most recent balance sheet date if the transaction has not settled. Foreign currency gains and losses were a loss of $129,000, a gain of $788,000 and a loss of $1.2 million for the years ended March 31, 2011, 2010 and 2009, respectively.
Income Taxes
Income taxes are recorded under the asset and liability method. Deferred tax assets and liabilities are recognized for the future tax consequences attributable to differences between the financial statement carrying amounts of existing assets and liabilities and their respective tax bases. Deferred tax assets and liabilities are measured using enacted tax rates expected to apply to taxable income in the years in which those temporary differences are expected to be recovered or settled. The effect on deferred tax assets and liabilities of a change in tax rates is recognized in income in the period that includes the enactment date.
Stock-Based Compensation
The Company has two stock option plans for officers, non-employee directors and key employees. The Company measures the cost of employee services received in exchange for the award of equity instruments based on the fair value of the award at the date of grant. The cost is to be recognized over the period during which an employee is required to provide services in exchange for the award. The Company’s common stock is purchased upon the exercise of stock options, and restricted stock awards are settled in shares of the Company’s common stock.
Earnings (Loss) Per Share
Basic earnings (loss) per share is computed by dividing net income (loss) by the weighted average number of common shares outstanding during the year. Diluted earnings (loss) per share is computed by dividing net income (loss) by the sum of the weighted average number of common shares outstanding during the year plus all additional common shares that would have been outstanding if potentially dilutive common shares related to stock options, restricted stock and warrants had been issued. The following table sets forth the computation of basic and diluted earnings (loss) per share (in thousands, except for per share data):
| Years ended March 31, | ||||||||||||
| 2011 | 2010 | 2009 | ||||||||||
| Numerator: |
||||||||||||
| Net income (loss) from continuing operations |
$ | 12,493 | $ | 18,688 | $ | (43,383 | ) | |||||
| (Loss) income from discontinued operations, net |
(1,310 | ) | 4,184 | (45,051 | ) | |||||||
| Net income (loss) |
$ | 11,183 | $ | 22,872 | $ | (88,434 | ) | |||||
| Denominator: |
||||||||||||
| Denominator for basic earnings (loss) per share — weighted average shares |
36,446 | 36,285 | 36,207 | |||||||||
| Dilutive securities: Employee stock options, restricted stock and warrants |
506 | 358 | — | |||||||||
| Denominator for diluted earnings per share — adjusted weighted-average shares |
36,952 | 36,643 | 36,207 | |||||||||
| Basic earnings (loss) per common share |
||||||||||||
| Continuing operations |
$ | 0.34 | $ | 0.51 | $ | (1.20 | ) | |||||
| Discontinued operations |
(0.03 | ) | 0.12 | (1.24 | ) | |||||||
| Net income (loss) |
$ | 0.31 | $ | 0.63 | $ | (2.44 | ) | |||||
| Diluted earnings (loss) per common share |
||||||||||||
| Continuing operations |
$ | 0.34 | $ | 0.51 | $ | (1.20 | ) | |||||
| Discontinued operations |
(0.04 | ) | 0.11 | (1.24 | ) | |||||||
| Net income (loss) |
$ | 0.30 | $ | 0.62 | $ | (2.44 | ) | |||||
Approximately 2.7 million and 2.8 million of the Company’s stock options were excluded from the calculation of diluted earnings per share in fiscal 2011 and 2010, respectively, because the exercise prices of the stock options and the grant date fair value of the restricted stock were greater than the average price of the Company’s common stock and therefore their inclusion would have been anti-dilutive.
56
Table of Contents
Approximately 1.6 million warrants to purchase shares outstanding were also excluded for the years ended March 31, 2011, 2010 and 2009, because the exercise prices of the warrants was greater than the average price of the Company’s common stock and therefore their inclusion would have been anti-dilutive.
Due to the Company’s net loss for the year ended March 31, 2009, diluted loss per share from continuing operations excludes 3.2 million stock options and restricted stock awards because their inclusion would have been anti-dilutive.
Recently Issued Accounting Pronouncements
In June 2009, the FASB issued ASC 860-10, Transfers and Servicing. This Statement eliminates the concept of a “qualified special-purpose entity,” changes the requirements for derecognizing financial assets and requires additional disclosures in order to enhance information reported to users of financial statements by providing greater transparency about transfers of financial assets, including securitization transactions, and an entity’s continuing involvement in and exposure to the risks related to transferred financial assets. ASC 860-10 is effective for fiscal years beginning after November 15, 2009. The Company adopted ASC 860-10 in fiscal 2011 and the adoption did not have an impact on its consolidated financial position or results of operations.
In June 2009, the FASB also amended ASC 810-10, Consolidation, which addresses the effects of eliminating the qualified special purpose entity concept from ASC 860-10 and responds to concerns about the application and transparency of enterprises’ involvement with Variable Interest Entities (VIEs). ASC 810-10 is effective for fiscal years beginning after November 15, 2009. The Company adopted ASC 810-10 in fiscal 2011 and the adoption did not have an impact on its consolidated financial position or results of operations.
Note 3 Discontinued Operations
Sale Transaction
On March 31, 2011, the Company sold its wholly-owned subsidiary, FUNimation, for $24.0 million, which was received in full during fiscal 2012 and therefore recorded as a receivable on the Company’s Consolidated Balance Sheets at March 31, 2011. In connection with the sale, the Company entered into an agreement to act as FUNimation’s exclusive distributor in the United States on a continuing basis, and will also act as FUNimation’s logistics and fulfillment services provider (see further disclosure in Note 24).
The Company has presented all results of operations, assets and liabilities of FUNimation for all periods presented as discontinued operations, and the consolidated financial statements, including the notes, have been reclassified to reflect such segregation for all periods presented. The Company has elected to allocate a portion of the consolidated interest expense related to the revolving line of credit, based on a percentage of its assets, to the discontinued operations. The Company used the proceeds received upon the sale of FUNimation to reduce the Company’s borrowings and for general working capital needs. During fiscal 2011, the Company adjusted the carrying value of the assets and liabilities of discontinued operations by $2.1 million, to reflect fair value measurements. The loss was recorded as an impairment charge and is included in “Income (loss) from discontinued operations” in the Consolidated Statements of Operations.
57
Table of Contents
As part of the sale transaction, the Company recorded the following loss which is included in “Loss on sale of discontinued operations” in the Consolidated Statements of Operations in fiscal year 2011:
| Cash proceeds |
$ | 24,000 | ||
| Transaction costs |
(1,463 | ) | ||
| Net cash proceeds |
22,537 | |||
| Net assets sold: |
||||
| Accounts receivable, net |
7,187 | |||
| Inventories, net |
4,301 | |||
| Prepaid expenses |
144 | |||
| Property and equipment, net |
1,195 | |||
| License fees, net |
15,643 | |||
| Production costs, net |
10,643 | |||
| Accounts payable and accrued liabilities |
(8,438 | ) | ||
| Net assets sold |
30,675 | |||
| Loss on sale of discontinued operations, before income tax |
(8,138 | ) | ||
| Income tax benefit |
2,940 | |||
| Loss on sale of discontinued operations, net of tax |
$ | (5,198 | ) | |
The Company’s consolidated financial statements have been reclassified to segregate the assets, liabilities and operating results of the discontinued operations for all periods presented. Prior to reclassification, the discontinued operations were reported in the publishing operating segment. The summary of operating results from discontinued operations is as follows (in thousands):
| Years ended March 31, | ||||||||||||
| 2011 | 2010 | 2009 | ||||||||||
| Net sales |
$ | 35,398 | $ | 32,562 | $ | 31,932 | ||||||
| Interest expense |
425 | 561 | 1,322 | |||||||||
| Income (loss) from discontinued operations, before income tax |
6,109 | 6,583 | (70,478 | ) | ||||||||
| Income tax benefit (expense) |
(2,221 | ) | (2,399 | ) | 25,427 | |||||||
| Income (loss) from discontinued operations, net of tax |
$ | 3,888 | $ | 4,184 | $ | (45,051 | ) | |||||
| Loss on sale of discontinued operations, before income tax |
(8,138 | ) | — | — | ||||||||
| Income tax benefit |
2,940 | — | — | |||||||||
| Loss on sale of discontinued operations, net of tax |
$ | (5,198 | ) | $ | — | $ | — | |||||
The major classes of assets and liabilities of discontinued operations as of March 31, 2010 were as follows (in thousands):
| March 31, 2010 |
||||
| Accounts receivable, net |
$ | 1,772 | ||
| Inventory |
5,108 | |||
| Prepaid expenses |
216 | |||
| Current assets of discontinued operations |
7,096 | |||
| Property and equipment, net of accumulated depreciation |
1,516 | |||
| Intangible assets, net of amortization |
1,469 | |||
| License fees, net of amortization |
16,565 | |||
| Production costs, net of amortization |
9,814 | |||
| Other assets |
70 | |||
| Total assets of discontinued operations |
$ | 36,530 | ||
| Accounts payable |
$ | 3,508 | ||
| Accrued expenses and other |
3,277 | |||
| Current liabilities of discontinued operations |
$ | 6,785 | ||
58
Table of Contents
Impairments and Other Charges
During fiscal 2009, based on the Company’s annual impairment review, it was concluded that indicators of potential impairment were present due to the sustained decline in the Company’s share price which resulted in its market capitalization being less than its book value. The Company conducted impairment tests during fiscal 2009 based on facts and circumstances present at that time and its business strategy in light of existing industry and economic conditions, as well as taking into consideration future expectations. Additionally, the Company announced that FUNimation would no longer be involved in licensing operations related to home video of children’s properties. Accordingly, for the year ended March 31, 2009, the Company recorded $81.1 million in impairment and other charges related to the restructuring of FUNimation, which included $8.2 million for license fees and production costs, $71.2 million for goodwill, $1.0 million for trademarks, $555,000 for inventory and $111,000 of severance charges.
Note 4 Acquisition
Punch! Software, LLC
On May 17, 2010, the Company completed the acquisition of substantially all of the assets of Punch! Software, LLC, (“Punch!”) a leading provider of home and landscape architectural design software in the United States. Total consideration included: $8.1 million in cash at closing, a $1.1 million note payable on the first anniversary of the closing with interest at a rate of 0.67% per annum, plus up to two performance payments (contingent consideration) of up to $1.25 million each (undiscounted), based on the Company achieving minimum net sales of $8.0 million in connection with the acquired assets. If earned, these payments are payable on the first and second anniversary of the closing date. The combined fair value of the contingent consideration of $948,000 was estimated by applying the income approach. That measure is based on significant inputs that are not observable in the market (i.e., Level 3 inputs). Key assumptions include (1) a discount rate range of 20%-25% and (2) a probability adjusted level of revenues between $7.7 million and $9.4 million. During the second quarter of fiscal 2011, the purchase price was reduced by $98,000 based on the final working capital review, bringing the balance of the Company’s note payable to $1.0 million at March 31, 2011.
The acquisition of Punch! expanded the Company’s content ownership. Goodwill of $5.7 million arising from the acquisition consists largely of the synergies and economies of scale expected from combining the operations of the Company and Punch!. All goodwill was assigned to the Company’s publishing business. All of the goodwill recognized is expected to be deductible for income tax purposes over a 15 year tax period. This transaction does not qualify as an acquisition of a significant business pursuant to Regulation S-X and financial statements for the acquired business will not be filed. Operating results from the date of acquisition are included within the publishing business.
The purchase price is being allocated based on estimates of the fair value of assets acquired and liabilities assumed as follows (in thousands):
| Consideration: |
||||
| Cash |
$ | 8,090 | ||
| Note payable |
1,002 | |||
| Contingent payment obligation — short-term |
526 | |||
| Contingent payment obligation — long-term |
422 | |||
| Fair value of total consideration transferred |
$ | 10,040 | ||
| The Punch! purchase price was allocated as follows: |
||||
| Accounts receivable |
$ | 1,152 | ||
| Inventory |
815 | |||
| Prepaid expenses |
94 | |||
| Property and equipment |
18 | |||
| Purchased intangibles |
2,787 | |||
| Goodwill |
5,709 | |||
| Accounts payable |
(469 | ) | ||
| Accrued expenses |
(66 | ) | ||
| $ | 10,040 | |||
Net sales of Punch!, included in the Consolidated Statements of Operations for the ten month period in fiscal 2011 owned by the Company, were $6.3 million. Although the Company has made reasonable efforts to calculate the precise impact that the Punch! acquisition has had on the Company’s net income for fiscal 2011, the Company has deemed it impracticable to determine such amounts.
59
Table of Contents
Acquisition-related costs (included in selling, general, and administrative expenses in the Consolidated Statements of Operations) for fiscal 2011 were $185,000.
Note 5 Goodwill and Intangible Assets
Goodwill
The Company performs an impairment test of goodwill annually, or when events or a change in circumstances indicate that the carrying value might exceed the current fair value. Certain factors may result in the need to perform an impairment test other than annually, including significant underperformance of the Company’s business relative to expected operating results, significant adverse economic and industry trends, and a decision to divest an individual business within a reporting unit.
The Company’s reporting units are composed of either a discrete business or an aggregation of businesses with similar economic characteristics. For the purpose of performing the required goodwill impairment tests, the Company applies a present value (discounted cash flow) method to determine the fair value of the goodwill of the publishing business. There is no goodwill associated with the distribution segment.
Goodwill impairment is determined using a two-step process.
| • | The first step is to identify if a potential impairment exists by comparing the fair value of the publishing business with its carrying amount, including goodwill. If the fair value of a reporting unit exceeds its carrying amount, goodwill of the reporting unit is not considered to have a potential impairment and the second step of the process is not necessary. However, if the carrying amount of a reporting unit exceeds its fair value, the second step is performed to determine if goodwill is impaired and to measure the amount of impairment loss to recognize, if any. |
| • | The second step, if necessary, compares the implied fair value of goodwill with the carrying amount of goodwill. If the implied fair value of goodwill exceeds the carrying amount, then goodwill is not considered impaired. However, if the carrying amount of goodwill exceeds the implied fair value, an impairment loss is recognized in an amount equal to that excess. |
The Company estimates the fair value of the publishing business, using various valuation techniques, with the primary technique being a discounted cash flow analysis. A discounted cash flow analysis requires the Company to make various assumptions about sales, operating margins, growth rates and discount rates. Assumptions about discount rates are based on a weighted-average cost of capital derived from observable market inputs and comparable company data. Assumptions about sales, operating margins, and growth rates are based on management’s forecasts, business plans, economic projections, anticipated future cash flows and marketplace data. Assumptions are also made for varying perpetual growth rates for periods beyond the long-term business plan period.
In the fiscal 2011 evaluation of the fair value of the Company’s publishing segment, the Company assumed revenue in fiscal 2012 to remain relatively flat with a slight recovery in fiscal 2013. In fiscal 2011, the Company also assumed a discount rate of 20.0% and a perpetual growth rate of 2.0%.
The Company’s first step impairment analysis for fiscal 2011 indicated that the fair value of the Company’s publishing segment approximated or exceeded its carrying values and, therefore, resulted in no impairment charges in fiscal 2011. In fiscal 2010, the Company had no goodwill.
Indefinite Lived Intangible Assets
Indefinite lived intangible assets include the Punch! trademark, which is not amortized. The Company makes annual assessments, or as events or circumstances indicate that the asset might be impaired, separately from goodwill, to evaluate realizability of carrying values.
60
Table of Contents
The fair value of the indefinite lived intangible assets is determined for the annual impairment test using the relief from royalty valuation technique, which is a variation of the income approach. In fiscal 2011, a discount rate of 24.0% was used in this analysis. There were no impairment charges recorded during fiscal 2011. In fiscal 2010, the Company had no indefinite lived intangible assets.
Definite Lived Intangible Assets
The Company evaluates its definite lived intangible amortizing assets for impairment when changes in events and circumstances indicate that the carrying value might exceed the current fair value. The Company determines fair value utilizing current market values and future market trends. There were no impairment charges recorded during fiscal 2011 or 2010.
Intangible Asset Summary
Identifiable intangible assets, with zero residual value, are being amortized (except for the trademarks which have an indefinite life) over useful lives of five years for developed technology, eight years for customer relationships, three years for customer list and seven years for the domain name and are valued as follows (in thousands):
| As of March 31, 2011 | ||||||||||||
| Gross
carrying amount |
Accumulated amortization |
Net | ||||||||||
| Developed technology * |
$ | 1,940 | $ | 373 | $ | 1,567 | ||||||
| Customer relationships * |
80 | 10 | 70 | |||||||||
| Customer list * |
167 | 51 | 116 | |||||||||
| Domain name |
70 | 48 | 22 | |||||||||
| Trademarks (not amortized) * |
600 | — | 600 | |||||||||
| $ | 2,857 | $ | 482 | $ | 2,375 | |||||||
| * | Intangible assets acquired as part of the Punch! acquisition (see further disclosure in Note 4). |
| As of March 31, 2010 | ||||||||||||
| Gross
carrying amount |
Accumulated amortization |
Net | ||||||||||
| Domain name |
70 | 38 | 32 | |||||||||
| $ | 70 | $ | 38 | $ | 32 | |||||||
61
Table of Contents
Aggregate amortization expense for the years ended March 31, 2011, 2010 and 2009 was $444,000, $103,000 (which included $92,000 related to masters) and $3.5 million (which included a $2.0 million impairment charge related to masters), respectively. The following is a schedule of estimated future amortization expense (in thousands):
| 2012 |
$ | 526 | ||
| 2013 |
484 | |||
| 2014 |
386 | |||
| 2015 |
353 | |||
| Thereafter |
26 | |||
| Total |
$ | 1,775 | ||
Debt issuance costs
Debt issuance costs are included in “Other Assets” and are amortized over the life of the related debt. Debt issuance costs consisted of the following (in thousands):
| March 31, 2011 | March 31, 2010 | |||||||
| Debt issuance costs |
$ | 1,790 | $ | 1,790 | ||||
| Less: accumulated amortization |
845 | 249 | ||||||
| Debt issuance costs, net |
$ | 945 | $ | 1,541 | ||||
Amortization expense was $596,000, $502,000 and $250,000 for the years ended March 31, 2011, 2010 and 2009, respectively and was included in interest expense. During fiscal 2010, the Company wrote-off $289,000 in debt acquisition costs related to the payoff of the GE Facility, which charges were included in interest expense. During fiscal 2009, the Company wrote-off $950,000 in debt acquisition costs related to the payoff of the Company’s Term Loan facility and material modifications to the GE Facility, which charges were included in interest expense.
Note 6 Fiscal 2009 Impairments and Other Charges
During the annual impairment review in fiscal 2009, the Company reviewed its portfolio of businesses for poor performing activities and to identify areas where continued business investments would not meet its requirements for financial returns. As a result of the analysis, the Company announced BCI would no longer be involved in licensing operations related to budget home video and the remaining BCI content would be transferred to the distribution business.
Prepaid Royalties. The total prepaid royalty charges related to the BCI restructuring were $7.1 million during fiscal 2009. With the Company no longer publishing content in the budget home video category, the prepaid royalties would not be recouped by earnings from the sale of the product, and as such the Company took an impairment charge during fiscal 2009 for amounts that will not be recouped.
Masters and Goodwill. The total masters and goodwill impairment charges related to the publishing business were $12.5 million during fiscal 2009.
| • | Masters — The impairment related to BCI masters was $2.0 million during fiscal 2009. Impairment losses are measured by comparing the fair value of the assets (utilizing current market values and future market trends) to their carrying amounts. |
| • | Goodwill — The goodwill impairment charge for the publishing business was $10.5 million during fiscal 2009 based on the excess of the asset’s carrying value over its fair value. |
Inventory. The total inventory charges related to the publishing business were $7.3 million during fiscal 2009. The Company records inventory at the lower of cost or market. When it is determined that the market value is lower than the cost, the Company adjusts the carrying value to the estimated realizable value. The Company determines the estimated realizable value by reviewing quoted prices in active markets for similar or identical products.
Accounts Receivable Reserves. The total accounts receivable reserve charges were $2.0 million during fiscal 2009, which primarily represent anticipated returns of BCI content.
62
Table of Contents
Severance. The Company completed a company-wide reduction in force during fiscal 2009. The total severance costs related to the reduction in force were $1.0 million, $591,000 of which were associated with the distribution business and $430,000 with the publishing business. The Company records one-time termination benefit arrangement costs at the date of communication to employees as long as the plan establishes the benefits that employees will receive upon termination in sufficient detail to enable employees to determine the type and amount of benefits the employee would receive if involuntarily terminated. Certain executives had contractual benefits related to involuntary termination. The Company records severance costs when the payment of the benefits is probable and reasonably estimable.
The following table summarizes the impairment and other charges included in the Company’s Consolidated Statements of Operations for the year ended March 31, 2009 (in thousands):
| Prepaid Royalties – Publishing |
Masters, Goodwill and Trademarks- Publishing |
Inventory- Publishing |
Accounts Receivable Reserves- Publishing |
Severance- Publishing |
Severance- Distribution |
Total | ||||||||||||||||||||||
| Sales |
$ | — | $ | — | $ | — | $ | 1,057 | $ | — | $ | — | $ | 1,057 | ||||||||||||||
| Cost of sales |
7,076 | — | 7,300 | 985 | — | — | 15,361 | |||||||||||||||||||||
| Selling and marketing |
— | — | — | — | 125 | 13 | 138 | |||||||||||||||||||||
| Distribution and warehousing |
— | — | — | — | — | 74 | 74 | |||||||||||||||||||||
| General and administrative |
— | — | — | — | 305 | 504 | 809 | |||||||||||||||||||||
| Depreciation and amortization |
— | 2,029 | — | — | — | — | 2,029 | |||||||||||||||||||||
| Goodwill impairment |
— | 10,531 | — | — | — | — | 10,531 | |||||||||||||||||||||
| Total |
$ | 7,076 | $ | 12,560 | $ | 7,300 | $ | 2,042 | $ | 430 | $ | 591 | $ | 29,999 | ||||||||||||||
Note 7 Marketable Securities
Marketable securities consisted of a money market fund at March 31, 2010 which was held in a Rabbi trust established for the payment of deferred compensation for a former Chief Executive Officer (see further disclosure in Note 23). The account was liquidated during fiscal 2011 in conjunction with the final deferred compensation payment.
At March 31, 2010, the Company classified these securities as available-for-sale and recorded these securities at fair value using Level 1 quoted market prices. Dividend and interest income were recognized when earned. Realized gains and losses for securities classified as available-for-sale were included in income and were derived using the specific identification method for determining the cost of the securities sold. Gross unrealized holding gains (losses) were a gain of $1,000 at March 31, 2010 and a loss of $1,000 at March 31, 2009.
At March 31, 2010, all marketable securities were classified as current based on the scheduled payout of the deferred compensation, and were restricted to use only for the settlement of the deferred compensation liability.
Note 8 Comprehensive Income (Loss)
Other comprehensive income (loss) pertains to net unrealized gains (losses) on foreign exchange rate translation of the Company’s balance sheet pertaining to foreign operations and net unrealized gain (loss) on marketable securities. These net unrealized gains and losses are not included in net income (loss) but rather are recorded in accumulated other comprehensive income within shareholders’ equity.
Comprehensive income (loss) consisted of the following (in thousands):
| Years Ended March 31, | ||||||||||||
| 2011 | 2010 | 2009 | ||||||||||
| Net income (loss) |
$ | 11,183 | $ | 22,872 | $ | (88,434 | ) | |||||
| Net unrealized gain on foreign exchange rate translation, net of tax |
260 | — | — | |||||||||
| Net unrealized gain (loss) on marketable securities, net of tax |
— | 1 | (1 | ) | ||||||||
| Comprehensive income (loss) |
$ | 11,443 | $ | 22,873 | $ | (88,435 | ) | |||||
The changes in other comprehensive income (loss) are non-cash items.
63
Table of Contents
Accumulated other comprehensive income balances, net of tax effects, were $260,000 and zero at March 31, 2011 and 2010, respectively.
Note 9 Accounts Receivable
Accounts receivable consisted of the following (in thousands):
| March 31, 2011 | March 31, 2010 | |||||||
| Trade receivables |
$ | 60,151 | $ | 64,315 | ||||
| Vendor receivables |
2,039 | 1,802 | ||||||
| Other receivables |
344 | 529 | ||||||
| 62,534 | 66,646 | |||||||
| Less: allowance for doubtful accounts and sales discounts |
2,674 | 3,618 | ||||||
| Less: allowance for sales returns, net margin impact |
2,027 | 2,173 | ||||||
| Total |
$ | 57,833 | $ | 60,855 | ||||
Note 10 Inventories
Inventories, net of reserves, consisted of the following (in thousands):
| March 31, 2011 | March 31, 2010 | |||||||
| Finished products |
$ | 22,144 | $ | 19,144 | ||||
| Consigned inventory |
1,992 | 1,619 | ||||||
| Raw materials |
1,596 | 1,365 | ||||||
| 25,732 | 22,128 | |||||||
| Less: inventory reserve |
819 | 964 | ||||||
| Total |
$ | 24,913 | $ | 21,164 | ||||
Note 11 Prepaid Expenses
Prepaid expenses consisted of the following (in thousands):
| March 31, 2011 | March 31, 2010 | |||||||
| Prepaid royalties |
$ | 2,591 | $ | 2,107 | ||||
| Other prepaid expenses |
1,366 | 1,270 | ||||||
| Current prepaid expenses |
3,957 | 3,377 | ||||||
| Non-current prepaid royalties |
9,667 | 10,134 | ||||||
| Total prepaid expenses |
$ | 13,624 | $ | 13,511 | ||||
Note 12 Property and Equipment
Property and equipment consisted of the following (in thousands):
| March 31, 2011 | March 31, 2010 | |||||||
| Furniture and fixtures |
$ | 1,160 | $ | 1,140 | ||||
| Computer and office equipment |
18,173 | 17,500 | ||||||
| Warehouse equipment |
10,078 | 10,049 | ||||||
| Leasehold improvements |
1,944 | 1,898 | ||||||
| Construction in progress |
240 | 759 | ||||||
| Total |
31,595 | 31,346 | ||||||
| Less: accumulated depreciation and amortization |
22,296 | 19,556 | ||||||
| Net property and equipment |
$ | 9,299 | $ | 11,790 | ||||
Depreciation expense was $3.4 million, $3.9 million and $4.3 million for the years ended March 31, 2011, 2010 and 2009, respectively.
64
Table of Contents
Note 13 Capitalized Software Development Costs
The Company incurs software development costs for software to be sold, leased or marketed in the publishing business. Software development costs include third-party contractor fees and overhead costs. The Company capitalizes these costs once technological feasibility is achieved. Capitalization ceases and amortization of costs begins when the software product is available for general release to customers. The Company amortizes capitalized software development costs by the greater of the ratio of gross revenues of a product to the total current and anticipated future gross revenues of that product or the straight-line method over the remaining estimated economic life of the product. The carrying amount of software development costs may change in the future if there are any changes to anticipated future gross revenue or the remaining estimated economic life of the product. The Company tests for possible impairment whenever events or changes in circumstances, such as a reduction in expected cash flows, indicate that the carrying amount of the asset may not be recoverable. If indicators exist, the Company compares the undiscounted cash flows related to the asset to the carrying value of the asset. If the carrying value is greater than the undiscounted cash flow amount, an impairment charge is recorded in cost of goods sold in the Consolidated Statements of Operations for amounts necessary to reduce the carrying value of the asset to fair value. Software development costs consisted of the following (in thousands):
| March 31, 2011 | March 31, 2010 | |||||||
| Software development costs |
$ | 3,025 | $ | 2,047 | ||||
| Less: accumulated amortization |
823 | 324 | ||||||
| Software development costs, net |
$ | 2,202 | $ | 1,723 | ||||
Amortization expense was $499,000, $324,000 and zero for the years ended March 31, 2011, 2010 and 2009, respectively and is included in cost of goods sold in the Consolidated Statements of Operations.
Note 14 Accrued Expenses
Accrued expenses consisted of the following (in thousands):
| March 31, 2011 | March 31, 2010 | |||||||
| Compensation and benefits |
$ | 2,217 | $ | 6,527 | ||||
| Legal disputes |
2,854 | 907 | ||||||
| Royalties |
303 | 614 | ||||||
| Rebates |
1,246 | 1,252 | ||||||
| Interest |
96 | 205 | ||||||
| Other |
1,052 | 621 | ||||||
| Total |
$ | 7,768 | $ | 10,126 | ||||
Note 15 401(k) Plan
The Company has a defined contribution 401(k) profit-sharing plan for eligible employees, which is qualified under Sections 401(a) and 401(k) of the Internal Revenue Code of 1986, as amended. The plan covers substantially all full-time employees. Employees are entitled to make tax deferred contributions of up to 100% of their eligible compensation, subject to annual IRS limitations. The Company matches 50% of employee’s contributions up to the first 4% of their base pay, annually. The Company’s contributions charged to expense were $317,000, $295,000 and $273,000 for the years ended March 31, 2011, 2010, and 2009, respectively. The Company’s matching contributions vest over three years.
Note 16 Commitments and Contingencies
Contingent payment — Punch! acquisition
The Company accrued a $1.0 million note payable related to a deferred payment due on the first anniversary of the Punch! acquisition closing, plus interest at a rate of 0.67% per annum. Additionally, the Company may be obligated to make two contingent performance payments of up to $1.25 million each (undiscounted), based on the Company achieving minimum annual net sales of $8.0 million in connection with the acquired assets. If earned, these payments are payable on the first and second anniversary of the closing date. The combined fair value of the contingent consideration of $948,000 was estimated by applying the income approach. That measure is based on significant inputs that are not observable in the market (i.e. Level 3 inputs). Key assumptions include (1) a discount rate range of 20%-25% and (2) a probability adjusted level of revenues between $7.7 million and $9.4 million (see further disclosure in Note 4).
65
Table of Contents
Leases
The Company leases its facilities and a portion of its office and warehouse equipment. The terms of the lease agreements generally range from 3 to 15 years, with certain leases containing options to extend the leases up to an additional 10 years. The Company does not believe that exercise of the renewal options are reasonably assured at the inception of the lease agreements and, therefore, considers the initial base term to be the lease term. The leases require payment of real estate taxes and operating costs in addition to base rent. Total base rent expense was $2.5 million, $2.4 million and $2.3 million for the years ended March 31, 2011, 2010 and 2009, respectively. Lease terms vary, but generally provide for fixed and escalating rentals which range from an additional $0.06 per square foot to a 3% annual increase over the life of the lease.
The following is a schedule of future minimum rental payments required under noncancelable operating leases as of March 31, 2011 (in thousands):
| 2012 |
$ | 2,466 | ||
| 2013 |
2,507 | |||
| 2014 |
2,158 | |||
| 2015 |
2,156 | |||
| 2016 |
2,016 | |||
| Thereafter |
4,847 | |||
| Total |
$ | 16,150 | ||
Guarantee
On May 29, 2007, FUNimation entered into an office lease in Flower Mound, Texas. In order to obtain the lease, the Company, as the parent of the FUNimation subsidiary at that time, guaranteed the full and prompt payment of the lease obligations and as of March 31, 2011, the Company continued to be the guarantor. As of March 31, 2011, the amount of the future lease payments guaranteed was $4.1 million. An accrual related to any future obligation was not considered necessary at March 31, 2011 as there was no indication that FUNimation would not be able to pay the required lease payments. On April 14, 2011, the Company entered into an agreement to be released from the office lease guarantee by providing a five year, standby letter of credit for $1.5 million (see further disclosure in Note 28).
Litigation and Proceedings
In the normal course of business, the Company is involved in a number of litigation/arbitration and administrative/regulatory matters that, other than the matter described immediately below, are incidental to the operation of the Company’s business. These proceedings generally include, among other things, various matters with regard to products distributed by the Company and the collection of accounts receivable owed to the Company. The Company does not currently believe that the resolution of any of those pending matters will have a material adverse effect on the Company’s financial position or liquidity, but an adverse decision in more than one of these matters could be material to the Company’s consolidated results of operations.
Because of the preliminary status of many of these various legal proceedings, as well as the contingencies and uncertainties associated with these types of matters, it is difficult, if not impossible, to predict the exposure to the Company, with respect to many of proceedings. However, the Company is able to make an estimate of the probable costs for the resolution of certain legal claims and, as of March 31, 2011, approximately $2.9 million has been recorded in reserves with respect to such claims. This estimate has been developed in consultation with internal and outside counsel handling the Company’s defense in these matters and is based upon an analysis of potential results, assuming a combination of litigation and settlement strategies.
SEC Investigation
On February 17, 2006, the Company received an inquiry from the Division of Enforcement of the U.S. Securities and Exchange Commission (the “SEC”) requesting certain documents and information. This information request, and others received since that date, relate to information regarding the Company’s restatements of previously-issued financial statements, certain write-offs, reserve methodologies, and revenue recognition practices. The Company has cooperated fully with the SEC’s requests in connection with this non-public investigation.
66
Table of Contents
Note 17 Capital Leases
The Company leases certain equipment under noncancelable capital leases. At March 31, 2011 and 2010, leased capital assets included in property and equipment were as follows (in thousands):
| March 31, 2011 | March 31, 2010 | |||||||
| Computer and office equipment |
$ | 332 | $ | 298 | ||||
| Less: accumulated amortization |
224 | 172 | ||||||
| Net property and equipment |
$ | 108 | $ | 126 | ||||
Amortization expense for the years ended March 31, 2011, 2010 and 2009 was $52,000, $67,000 and $55,000, respectively. Future minimum lease payments, excluding additional costs such as insurance and maintenance expense payable by the Company under these agreements, by year and in the aggregate are as follows (in thousands):
| Minimum
Lease Commitments |
||||
| Year ending March 31: |
||||
| 2012 |
$ | 74 | ||
| 2013 |
44 | |||
| 2014 |
13 | |||
| Total minimum lease payments |
$ | 131 | ||
| Less: amounts representing interest at rates ranging from 6.9% to 9.4% |
10 | |||
| Present value of minimum capital lease payments, reflected in the balance sheet as current and noncurrent capital lease obligations of $66 and $55, respectively |
$ | 121 | ||
Note 18 Bank Financing and Debt
In March 2007, the Company amended and restated its $65.0 million revolving credit facility with GE (the “GE Facility”) and entered into a four year $15.0 million Term Loan facility (“Term Loan”) with Monroe Capital Advisors, LLC. The Term Loan was paid in full in connection with the Third Amendment to the GE Facility on June 12, 2008.
On June 12, 2008, the Company entered into a Third Amendment and Waiver to Fourth Amended and Restated Credit Agreement (the “Third Amendment”) with GE which, among other things, revised the terms of the GE Facility as follows: (i) permitted the Company to pay off the remaining $9.7 million balance of the term loan facility with Monroe; (ii) created a $6.0 million tranche of borrowings subject to interest at the index rate plus 6.25%, or LIBOR plus 7.5%; (iii) modified the interest rate in connection with borrowings to range from an index rate of 0.75% to 1.75%, or LIBOR plus 2.0% to 3.0%, depending upon borrowing availability during the prior fiscal quarter; (iv) extended the term of the GE Facility to March 22, 2012; (v) modified the prepayment penalty to 1.5% during the first year following the date of the Third Amendment, 1% during the second year following the date of the Third Amendment, and 0.5% during the third year following the date of the Third Amendment; and (vi) modified certain financial covenants as of March 31, 2008.
On October 30, 2008, the Company entered into a Fourth Amendment and Waiver to Fourth Amended and Restated Credit Agreement (the “Fourth Amendment”) with GE which revised the terms of the GE Facility as follows: effective as of September 30, 2008, (i) clarified the calculation of EBITDA under the credit agreement to indicate that it would not be impacted by any pre-tax, non-cash charges to earnings related to goodwill impairment; and (ii) revised the definition of “Index Rate” to indicate that the interest rate for non-LIBOR borrowings would not be less than the LIBOR rate for an interest period of three months.
On February 5, 2009, the Company entered into a Fifth Amendment and Waiver to Fourth Amended and Restated Credit Agreement (the “Fifth Amendment”) with GE which revised the terms of the GE Facility as follows: effective as of December 31, 2008, (i) clarified that the calculation of EBITDA under the credit agreement would not be impacted by certain pre-tax, non-cash restructuring charges to earnings, or in connection with cash charges to earnings recognized in the Company’s financial results related to a force reduction; (ii) eliminated the $6.0 million tranche of borrowings under the credit facility; (iii) modified the interest rate in connection with borrowings under the facility to index rate plus 5.75%, or LIBOR plus 4.75%; (iv) altered the commitment termination date of the GE Facility to June 30, 2010; (v) eliminated the pre-payment penalty; and (vi) modified certain financial covenants as of December 31, 2008 and thereafter. The Company paid the GE Facility in full on November 12, 2009 in connection with the new credit facility, as described below.
67
Table of Contents
On November 12, 2009, the Company entered into a three year, $65.0 million revolving credit facility (the “Credit Facility”) with Wells Fargo Foothill, LLC as agent and lender, and Capital One Leverage Financing Corp. as a participating lender. The Credit Facility is secured by a first priority security interest in all of the Company’s assets, as well as the capital stock of its subsidiary companies. Additionally, the Credit Facility calls for monthly interest payments at the bank’s base rate (as defined in the Credit Facility) plus 4.0%, or LIBOR plus 4.0%, at the Company’s discretion. The entire outstanding balance of principal and interest is due in full on November 12, 2012.
At March 31, 2011 and 2010, we had zero and $6.6 million, respectively, outstanding on the Credit Facility. Amounts available under the Credit Facility are subject to a borrowing base formula. Changes in the assets within the borrowing base formula can impact the amount of availability. Based on the Credit Facility’s borrowing base and other requirements at such dates, the Company had excess availability of $33.3 million and $38.4 million, at March 31, 2011 and 2010, respectively.
In association with both credit facilities, and per the respective terms, we pay and have paid certain facility and agent fees. Weighted average interest on the Credit Facility was 7.5% at both March 31, 2011 and 2010 and under the GE Facility was 5.6% at March 31, 2009. Such interest amounts have been and continue to be payable monthly.
Under the Credit Facility, the Company is required to meet certain financial and non-financial covenants. The financial covenants include a variety of financial metrics that are used to determine the Company’s overall financial stability as well as limitations on capital expenditures, a minimum ratio of adjusted EBITDA to fixed charges, limitations on prepaid royalties and a borrowing base availability requirement. At March 31, 2011, the Company was in compliance with all covenants under the Credit Facility. The Company currently believes it will be in compliance with all covenants in the Credit Facility over the next twelve months.
Letters of Credit
The Company was party to a $250,000 letter of credit related to a vendor at March 31, 2010, however, during fiscal 2011, the Company terminated this letter of credit as it was no longer required. No claims were made against this financial instrument (see further disclosure in Note 28).
Note 19 Income Taxes
The income tax provision (benefit) from continuing operations is comprised of the following (in thousands):
| Years ended March 31, | ||||||||||||
| 2011 | 2010 | 2009 | ||||||||||
| Current |
||||||||||||
| Federal |
$ | (134 | ) | $ | (1,417 | ) | $ | (4,020 | ) | |||
| Foreign |
233 | — | — | |||||||||
| State |
81 | 109 | 60 | |||||||||
| Deferred |
1,100 | 4,412 | (6,529 | ) | ||||||||
| Valuation allowance |
(9,726 | ) | (11,706 | ) | 21,432 | |||||||
| Tax expense (benefit) |
$ | (8,446 | ) | $ | (8,602 | ) | $ | 10,943 | ||||
A reconciliation of income tax expense (benefit) from continuing operations to the statutory federal rate is as follows (in thousands):
| Years ended March 31, | ||||||||||||
| 2011 | 2010 | 2009 | ||||||||||
| Expected federal income tax at statutory rate |
$ | 1,376 | $ | 3,429 | $ | (11,021 | ) | |||||
| State income taxes, net of federal tax effect |
133 | 214 | (660 | ) | ||||||||
| Valuation allowance |
(9,726 | ) | (11,706 | ) | 21,432 | |||||||
| Equity compensation |
1 | 101 | 185 | |||||||||
| Uncertain tax liability |
(104 | ) | (108 | ) | 90 | |||||||
| Other |
(126 | ) | (532 | ) | 917 | |||||||
| Tax expense (benefit) |
$ | (8,446 | ) | $ | (8,602 | ) | $ | 10,943 | ||||
68
Table of Contents
| Years ended March 31, | ||||||||||||
| 2011 | 2010 | 2009 | ||||||||||
| Expected federal income tax at statutory rate |
34.0 | % | 34.0 | % | 34.0 | % | ||||||
| State income taxes, net of federal tax effect |
3.3 | 2.1 | 2.0 | |||||||||
| Valuation allowance |
(240.3 | ) | (116.1 | ) | (66.1 | ) | ||||||
| Equity compensation |
— | 1.0 | (0.6 | ) | ||||||||
| Return to provision |
(5.0 | ) | (5.3 | ) | — | |||||||
| Other |
(0.7 | ) | (1.0 | ) | (3.0 | ) | ||||||
| Effective tax rate (continuing operations) |
(208.7 | )% | (85.3 | )% | (33.7 | )% | ||||||
The change in the effective tax rate from year to year is principally attributable to the fact that the Company recorded a valuation allowance against its deferred tax assets of $21.4 million during the year ended March 31, 2009, released $11.7 million of the valuation allowance during the year ended March 31, 2010, and released the remaining $9.7 million of the valuation allowance during the year ended March 31, 2011.
For the year ended March 31, 2011 the Company recorded income tax expense from discontinued operations of $2.2 million and income tax benefit from the sale of discontinued operations of $2.9 million. For the years ended March 31, 2010 and 2009, the Company recorded income tax expense from discontinued operations of $2.4 million and income tax benefit from discontinued operations of $25.4 million, respectively. The effective tax rate applied to discontinued operations for the year ended March 31, 2011 was 36.4% and the rate applied to the sale of discontinued operations was 36.1%. The effective tax rate applied to discontinued operations for the years ended March 31, 2010 and 2009 was 36.5% and 36.1%, respectively.
Deferred income taxes reflect the available tax carryforwards, which begin to expire in fiscal 2029, and the net tax effects of temporary differences between the carrying amounts of assets and liabilities for financial reporting purposes and the amounts used for income tax purposes. Significant components of the Company’s deferred tax assets as of March 31, 2011 and 2010 are as follows (in thousands):
| Years ended March 31, | ||||||||
| 2011 | 2010 | |||||||
| Deferred tax asset — current |
||||||||
| Collectability reserves |
$ | 1,873 | $ | 5,854 | ||||
| Reserve for inventory write-off |
296 | 349 | ||||||
| Reserve for sales discounts |
240 | 243 | ||||||
| Accrued vacations |
262 | 312 | ||||||
| Inventory — uniform capitalization |
172 | 138 | ||||||
| Incentive based deferred compensation |
— | 483 | ||||||
| Other |
205 | 214 | ||||||
| Net operating loss carryforward |
3,388 | 3,137 | ||||||
| Subtotal deferred tax asset — current |
6,436 | 10,730 | ||||||
| Valuation allowance |
— | (3,127 | ) | |||||
| Deferred tax asset — current, net |
6,436 | 7,603 | ||||||
| Deferred tax asset — non-current |
||||||||
| Net operating loss carryforward |
24,945 | — | ||||||
| Stock based compensation |
1,108 | 404 | ||||||
| Book/tax intangibles amortization |
(808 | ) | 21,562 | |||||
| Book/tax depreciation |
(1,791 | ) | (2,233 | ) | ||||
| Other |
866 | 674 | ||||||
| Subtotal deferred tax asset — non-current |
24,320 | 20,407 | ||||||
| Valuation allowance |
— | (6,599 | ) | |||||
| Deferred tax asset — non-current, net |
24,320 | 13,808 | ||||||
| Total deferred tax asset, net |
$ | 30,756 | $ | 21,411 | ||||
At March 31, 2011 and 2010, the Company had federal net operating loss carryforwards of $77.8 million and $7.7 million, respectively, which will begin to expire in 2029. The Company had foreign tax credit carryforwards of $444,000 and $259,000 at March 31, 2011 and 2010, which will begin to expire in 2016.
Deferred tax assets are evaluated by considering historical levels of income, estimates of future taxable income streams and the impact of tax planning strategies. A valuation allowance is recorded to reduce deferred tax assets when it is determined that it is more
69
Table of Contents
likely than not, based on the weight of available evidence, the Company would not be able to realize all or part of its deferred tax assets. An assessment is required of all available evidence, both positive and negative, to determine the amount of any required valuation allowance.
As a result of the market conditions and their impact on the Company’s future outlook, during the year ended March 31, 2009, management reviewed its deferred tax assets and concluded that the uncertainties related to the realization of some of its assets had become unfavorable. Management considered the positive and negative evidence for the potential utilization of the net deferred tax asset and concluded that it was more likely than not that the Company would not realize the full amount of net deferred tax assets. Accordingly, at March 31, 2009, a valuation allowance of $21.4 million was recorded for a portion of the net deferred tax assets and was included in income tax expense for the year ended March 31, 2009.
However, during fiscal 2010, the amount of deferred tax assets that the Company would have more likely than not been able to realize increased due to a tax law change allowing the Company to carry the net operating losses back additional years as well as the Company having higher than projected book income. As a result, the Company released $11.7 million of the valuation allowance against these deferred tax assets, reducing the valuation allowance balance to $9.7 million at March 31, 2010.
At March 31, 2011, the Company again evaluated the need for a valuation allowance and based on the history of pretax earnings, future taxable income projections and future reversals of existing taxable temporary differences, concluded it would more likely than not be able to realize the entire $30.7 million of deferred tax assets recorded at March 31, 2011. Therefore, the Company released the remaining $9.7 million of valuation allowance at that time. The deferred tax assets at March 31, 2011 are composed of temporary differences primarily related to the book write-off of certain intangibles and net operating loss carryforwards, which will begin to expire in fiscal 2029.
The Company recognizes interest accrued related to unrecognized income tax benefits (“UTB’s”) in the provision for income taxes. At March 31, 2010, interest accrued was approximately $147,000, which was net of federal and state tax benefits and total UTB’s net of federal and state tax benefits that would impact the effective tax rate if recognized were $716,000. During the fiscal year ended March 31, 2011, an additional $88,000 of UTB’s were accrued, which was net of $48,000 of deferred federal and state income tax benefits. Additionally, $192,000 of UTB’s were reversed related to a statute of limitations lapse and $140,000 of UTB’s were reversed related to provision adjustments during the fiscal year ended March 31, 2011. As of March 31, 2011, interest accrued was $168,000 and total UTB’s, net of deferred federal and state income tax benefits that would impact the effective tax rate if recognized, were $612,000.
The following table summarizes the activity related to the Company’s unrecognized tax benefits (in thousands):
| Years ended March 31, | ||||||||
| 2011 | 2010 | |||||||
| Income taxes payable, beginning of period |
$ | 987 | $ | 961 | ||||
| Gross increases related to prior year tax positions |
140 | 140 | ||||||
| Gross increases related to current year tax positions |
46 | 41 | ||||||
| Decrease related to statute of limitations lapses |
(155 | ) | (155 | ) | ||||
| Income taxes payable, end of period |
$ | 1,018 | $ | 987 | ||||
The Company’s federal income tax returns for tax years ending in 2007 through 2010 remain subject to examination by tax authorities. The Company files in numerous state jurisdictions with varying statutes of limitations. The Company does not anticipate that the total unrecognized tax benefits will significantly change prior to March 31, 2012.
Note 20 Shareholders’ Equity
The Company’s Articles of Incorporation authorize 10,000,000 shares of preferred stock, no par value. No preferred shares are issued or outstanding.
The Company did not repurchase any shares during the years ended March 31, 2011, 2010 or 2009.
Note 21 Private Placement Warrants
As of March 31, 2011 and 2010, the Company had warrants to purchase 1,596,001 shares of common stock outstanding. The warrants expire on September 21, 2011 and are exercisable at $5.00 per share. The Company has the right to require exercise of the
70
Table of Contents
warrants if, among other things, the volume weighted average price of the Company’s common stock exceeds $8.50 per share for each of 30 consecutive trading days. In addition, the warrants provide the investors the option to require the Company to repurchase the warrants for a purchase price, payable in cash within five (5) business days after such request, equal to the Black-Scholes value of any unexercised warrant shares, but only if, while the warrants are outstanding, the Company initiates the following change in control transactions: (i) the Company effects any merger or consolidation, (ii) the Company effects any sale of all or substantially all of its assets, (iii) any tender offer or exchange offer is completed whereby holders of the Company’s common stock are permitted to tender or exchange their shares for other securities, cash or property, or (iv) the Company effects any reclassification of the Company’s common stock whereby it is effectively converted into or exchanged for other securities, cash or property.
Note 22 Share-Based Compensation
The Company has two equity compensation plans: the Navarre Corporation 1992 Stock Option Plan and the Navarre Corporation 2004 Stock Plan (collectively, “the Plans”). The 1992 Plan expired on July 1, 2006, and no further grants are allowed under this Plan, however, there are outstanding options under this Plan. The 2004 Plan provides for equity awards, including stock options, restricted stock and restricted stock units. Eligible participants under the Plans are all employees (including officers and directors), non-employee directors, consultants and independent contractors.
Equity Compensation Plans
The Company currently grants stock options, restricted stock and restricted stock units under equity compensation plans. The Company adopted the 1992 Stock Option Plan and 2004 Stock Plan to attract and retain eligible persons to perform services for the Company. Eligible recipients include all employees, without limitation, officers and directors who are also employees as well as non-employee directors, consultants and independent contractors or employees of any of the Company’s subsidiaries. A maximum number of 7.5 million shares of common stock have been authorized and reserved for issuance under the 2004 Stock Plan. The number of shares authorized may also be increased from time to time by approval of the Board of Directors and the shareholders. The 1992 Stock Option Plan terminated in July 2006 and the 2004 Stock Plan terminates in September 2014. There were 2,588,490 shares available for future grant under the 2004 Stock Plan at March 31, 2011.
The Company is authorized to grant, among other equity instruments, stock options and restricted stock under the 2004 Stock Plan. Stock options have a maximum term fixed by the Compensation Committee of the Board of Directors, not to exceed 10 years from the date of grant. Stock options become exercisable during their terms in the manner determined by the Compensation Committee of the Board of Directors. Vesting for performance-based stock awards is subject to the performance criteria being achieved.
Restricted stock awards are non-vested stock awards that may include grants of restricted stock or restricted stock units. Restricted stock awards are independent of option grants and are generally subject to forfeiture if employment terminates prior to the release of the restrictions. Such awards vest as determined by the Compensation Committee of the Board of Directors, depending on the grant. Prior to vesting, ownership of the shares cannot be transferred. The Company expenses the cost of the restricted stock awards, which is the grant date fair value, ratably over the period during which the restrictions lapse. The grant date fair value is the Company’s opening stock price on the date of grant.
In fiscal 2011, each director who is not an employee of the Company was granted an option to purchase 12,000 (6,000 shares each year through fiscal 2010) shares of common stock under the 2004 Stock Plan on April 1, with an exercise price equal to fair market value. These options are designated as non-qualified stock options. Each option granted prior to September 15, 2005, vests in five annual increments of 20% of the original option grant beginning one year from the date of grant and expires on the earlier of (i) six years from the date of the grant, and (ii) one year after the person ceases to serve as a director. Each option granted on or after September 15, 2005, vests in three annual increments of 33 1/3% of the original option grant beginning one year from the date of grant, expires on the earlier of (i) ten years from the date of grant, and (ii) one year after the person ceases to serve as a director, and provides for the acceleration of vesting if the person ceases to serve as a director as a result of the Company’s mandatory director retirement policy.
The Company is entitled to (a) withhold and deduct from future wages of the participant (or from other amounts that may be due and owing to the participant from the Company), or (b) make other arrangements for the collection of all legally required amounts necessary to satisfy any and all federal, state and local withholding and employment-related tax requirements (i) attributable to the grant or exercise of an option or a restricted stock award or to a disqualifying disposition of stock received upon exercise of an incentive stock option, or (ii) otherwise incurred with respect to an option or a restricted stock award, or (iii) require the participant promptly to remit the amount of such withholding to the Company before taking any action with respect to an option or a restricted stock award.
71
Table of Contents
Stock Options
A summary of the Company’s stock option activity as of March 31, 2011, 2010 and 2009 and for those years ended is summarized as follows:
| Year
ended March 31, 2011 |
Year
ended March 31, 2010 |
Year
ended March 31, 2009 |
||||||||||||||||||||||
| Number of options |
Weighted average exercise price |
Number of options |
Weighted average exercise price |
Number of options |
Weighted average exercise price |
|||||||||||||||||||
| Options outstanding, beginning of period |
3,547,299 | $ | 4.77 | 3,165,528 | $ | 5.74 | 3,132,499 | $ | 6.78 | |||||||||||||||
| Granted |
910,000 | 2.11 | 848,500 | 1.89 | 782,500 | 0.83 | ||||||||||||||||||
| Exercised |
(52,336 | ) | 1.08 | (7,501 | ) | 0.69 | (9,600 | ) | 1.26 | |||||||||||||||
| Canceled |
(615,129 | ) | 10.59 | (459,228 | ) | 6.18 | (739,871 | ) | 4.65 | |||||||||||||||
| Options outstanding, end of period |
3,789,834 | $ | 3.24 | 3,547,299 | $ | 4.77 | 3,165,528 | $ | 5.74 | |||||||||||||||
| Options exercisable, end of period |
2,255,677 | $ | 4.16 | 2,149,646 | $ | 6.83 | 2,071,203 | $ | 7.79 | |||||||||||||||
| Shares available for future grant, end of period |
2,588,490 | 98,913 | 933,252 | |||||||||||||||||||||
The weighted average fair value of options granted during the year ended March 31, 2011 was $1.1 million and the total fair value of options exercisable was $5.6 million at March 31, 2011. The weighted average remaining contractual term for options outstanding was 7.2 years and for options exercisable was 6.0 years at March 31, 2011.
The aggregate intrinsic value represents the total pretax intrinsic value, based on the Company’s closing stock price of $1.90 as of March 31, 2011, which theoretically could have been received by the option holders had all option holders exercised their options as of that date. The total intrinsic value of stock options exercised during the years ended March 31, 2011 was $60,000. The aggregate intrinsic value for options outstanding was $719,000 and for options exercisable was $468,000 at March 31, 2011. The total number of in-the-money options exercisable as of March 31, 2011 was 961,333 and 1.1 million as of March 31, 2010 when the closing stock price was $2.08.
As of March 31, 2011, total compensation cost related to non-vested stock options not yet recognized was $1.4 million, which is expected to be recognized over the next 1.5 years on a weighted-average basis.
During the years ended March 31, 2011, 2010 and 2009, the Company received cash from the exercise of stock options totaling $56,000, $5,000 and $12,000, respectively. There was no excess tax benefit recorded for the tax deductions related to stock options during either the years ended March 31, 2011 or 2010.
Restricted Stock
Restricted stock granted to employees typically has a vesting period of three years and expense is recognized on a straight-line basis over the vesting period, or when the performance criteria have been met. The value of the restricted stock is established by the market price on the date of the grant or if based on performance criteria, on the date it is determined the performance criteria will be met. Restricted stock awards vesting is based on service criteria or achievement of performance targets. All restricted stock awards are settled in shares of common stock.
72
Table of Contents
A summary of the Company’s restricted stock activity as of March 31, 2011, 2010 and 2009 and changes during those years ended is summarized as follows:
| Year
ended March 31, 2011 |
Year
ended March 31, 2010 |
Year
ended March 31, 2009 |
||||||||||||||||||||||
| Shares | Weighted average grant date fair value |
Shares | Weighted average grant date fair value |
Shares | Weighted average grant date fair value |
|||||||||||||||||||
| Unvested, beginning of period |
508,486 | $ | 1.47 | 445,155 | $ | 1.18 | 171,917 | $ | 3.02 | |||||||||||||||
| Granted |
383,500 | 2.26 | 242,750 | 2.08 | 390,250 | 0.69 | ||||||||||||||||||
| Vested |
(232,403 | ) | 1.45 | (173,836 | ) | 1.61 | (63,932 | ) | 3.23 | |||||||||||||||
| Forfeited |
(75,248 | ) | 1.80 | (5,583 | ) | 1.10 | (53,080 | ) | 1.11 | |||||||||||||||
| Unvested, end of period |
584,335 | $ | 1.96 | 508,486 | $ | 1.47 | 445,155 | $ | 1.18 | |||||||||||||||
The weighted average fair value of restricted stock awards granted during the year ended March 31, 2011 was $867,000.
The total fair value of restricted stock awards vested during the years ended March 31, 2011, 2010 and 2009 was approximately $337,000, $431,000 and $52,000, respectively. The weighted average remaining vesting period for restricted stock awards outstanding at March 31, 2011 was 1.2 years.
As of March 31, 2011, total compensation cost related to non-vested restricted stock awards not yet recognized was $917,000 which is expected to be recognized over the next 1.4 years on a weighted-average basis. There was no excess tax benefit recorded for the tax deductions related to restricted stock during either the years ended March 31, 2011 or 2010.
Restricted Stock Units — Performance-Based
On April 1, 2006, the Company awarded restricted stock units to certain key employees. Receipt of the stock units was contingent upon the Company meeting Total Shareholder Return (“TSR”) targets relative to an external market condition and meeting the service condition. Each participant was granted a base number of units. The units, as determined at the end of the performance year (fiscal 2007), were to be issued at the end of the third year (fiscal 2009) if the Company’s average TSR target was achieved for the fiscal period 2007 through 2009. The total number of base units granted in fiscal 2007 was 66,000. During fiscal 2009, the Company adjusted the forfeiture rate and reduced stock based compensation expense by $134,000 based on actual terminations of recipients. The amount recorded for the years ended March 31, 2011, 2010 and 2009 was zero, zero and a $21,000 recovery, respectively, based upon the number of units granted. The Company did not achieve the TSR target at March 31, 2009, and therefore zero shares were issued and all restricted stock units were forfeited at that time.
Share-Based Compensation Valuation and Expense Information
The Company uses the Black-Scholes option pricing model to calculate the grant-date fair value of an option award. The fair value of options granted during the years ended March 31, 2011, 2010 and 2009 were calculated using the following assumptions:
| Year Ended March 31, 2011 |
Year Ended March 31, 2010 |
Year Ended March 31, 2009 |
||||||||||
| Expected life (in years) |
5.0 | 5.0 | 5.0 | |||||||||
| Expected volatility |
72 | % | 75 | % | 66 | % | ||||||
| Risk-free interest rate |
1.04—2.60 | % | 1.65—2.93 | % | 2.51—2.87 | % | ||||||
| Expected dividend yield |
0.0 | % | 0.0 | % | 0.0 | % | ||||||
Expected life uses historical employee exercise and option expiration data to estimate the expected life assumption for the Black-Scholes grant-date valuation. The Company believes that this historical data is currently the best estimate of the expected term of a new option. The Company uses a weighted-average expected life for all awards and has identified one employee population. Expected volatility uses the Company stock’s historical weighted-average volatility for the same period of time as the expected life. The Company has no reason to believe that its future volatility will differ from the past. The risk-free interest rate is based on the U.S. Treasury rate in effect at the time of the grant for the same period of time as the expected life. Expected dividend yield is zero, as the Company historically has not paid dividends. The Company used a forfeiture rate of 4.63% during the year ended March 31, 2011 and 5.40% during both the years ended March 31, 2010 and 2009.
73
Table of Contents
Share-based compensation expense related to employee stock options, restricted stock and restricted stock units, net of estimated forfeitures for the years ended March 31, 2011, 2010 and 2009 was $1.1 million, $1.0 million and $1.0 million, respectively. These amounts are included in general and administrative expenses in the Consolidated Statements of Operations. No amount of share-based compensation was capitalized.
Note 23 Related Party Transactions
Employment/Severance Agreements
The Company entered into an employment agreement with a former Chief Executive Officer (“CEO”) in 2001, which expired on March 31, 2007. Pursuant to the deferred compensation portion of this agreement, the Company agreed to pay over three years, beginning April 1, 2008, approximately $2.4 million plus interest at approximately 8% per annum. The Company expensed zero, $141,000 and $307,000 for this obligation during the years ended March 31, 2011, 2010 and 2009, respectively.
The employment agreement also contained a deferred compensation component that was earned by the former CEO upon the stock price achieving certain targets, which may be forfeited in the event that he did not comply with certain non-compete obligations. In April 2007, the Company deposited $4.0 million into a Rabbi trust, under the required terms of the agreement. Beginning April 1, 2008, the Rabbi trust paid annually $1.3 million, plus interest at 8%, for three years. At March 31, 2011 and 2010, outstanding accrued balances due under this arrangement were zero and $1.3 million, respectively. This deferred compensation agreement was paid in full during the first quarter of fiscal 2011.
The Company entered into a separation agreement with a former Chief Operating Officer (“COO”) in fiscal 2009. The Company was required to pay approximately $390,000 under this agreement. This amount was accrued, expensed and paid during the year ended March 31, 2009.
Employment Agreement — FUNimation
On May 27, 2010, the Company entered into a one-year executive employment agreement with a key FUNimation employee in connection with his continued employment as President and Chief Executive Officer of FUNimation (“the FUNimation CEO”). The agreement replaced a prior agreement entered into upon the acquisition of FUNimation and provided for a continuation of the executive employee’s base salary and an annual bonus payment consistent with the Company’s Annual Management Incentive Plan. The FUNimation CEO was also granted a restricted stock unit award of 22,500 shares of the Company’s Common Stock at the time of the agreement, which was to vest in three equal installments on November 3, 2010, 2011 and 2012. Under the agreement, the FUNimation CEO was also eligible for customary benefits that are provided to similarly-situated executives. Among other items, the agreement required the FUNimation CEO to cooperate and participate in the Company’s efforts to market FUNimation for potential sale. In the event that a transaction to sell FUNimation occurred during the term of the agreement, the FUNimation CEO was to receive, in addition to any other compensation payable to him, a transaction success fee in an amount equal to the greater of (i) $250,000 or (ii) 5% of certain transaction proceeds. On March 31, 2011, the Company recorded the $250,000 expense associated with this agreement as a direct cost related to sale of FUNimation. Additionally, the 15,000 remaining unvested restricted stock unit awards granted in conjunction with this agreement were forfeited on March 31, 2011 when the FUNimation CEO’s employment with Navarre was terminated in connection with the Company’s sale of FUNimation.
Note 24 Variable Interest Entity
On March 31, 2011, the Company sold its wholly-owned subsidiary, FUNimation. Upon the sale, the Company assessed the variable interest in FUNimation including the terms of the exclusive distribution and logistics and fulfillment services agreements, employment matter indemnification (maximum exposure of $250,000 included as an accrued expense), and the office lease guarantee (maximum exposure of $4.1 million, no liability recorded) to determine if FUNimation met the definition of a variable interest entity (“VIE”). Based on the Company’s evaluation it was determined that FUNimation was a VIE. Consolidating any VIEs within the Company’s financial results is required if the Company is found to be the primary beneficiary. However, because the Company did not have the power to direct the activities of the VIE that most significantly impacted their economic performance, nor did the Company have the obligation to absorb the significant losses or the right to receive significant benefits from the VIE, it was determined that the Company was not the primary beneficiary. Therefore, the results of FUNimation were not consolidated into the Company’s financial results (see further disclosure in Note 28).
74
Table of Contents
Note 25 Major Customers and Vendors
The Company has two major customers (both of which are within the distribution business) who accounted for 50% of consolidated net sales from continuing operations for fiscal 2011. These customers accounted for 53% and 51% of consolidated net sales from continuing operations for fiscal 2010 and fiscal 2009, respectively. Accounts receivable from these two customers totaled $21.4 million and $26.4 million at March 31, 2011 and 2010, respectively.
The Company has one major vendor who accounted for approximately $85.8 million, $102.9 million and $104.0 million in net sales in the fiscal years ended March 31, 2011, 2010 and 2009, respectively.
Note 26 Business Segments
The Company identifies its segments based on its organizational structure, which is primarily by business activity. Operating profit represents earnings before interest expense, interest income, income taxes and allocations of corporate costs to the respective divisions. Inter-company sales are made at market prices. The Company’s corporate office maintains a majority of the Company’s cash and revolving line of credit under its cash management policy.
Navarre operates two business segments: distribution and publishing.
Through the distribution business, the Company distributes computer software, consumer electronics and accessories, video games, and home videos, and provides complete logistical solutions. The distribution business focuses on providing vendors and retailers with a range of value-added services, including vendor-managed inventory, electronic and internet-based ordering, and gift card fulfillment.
Through the publishing business the Company owns or licenses various widely-known computer software through Encore. In addition to retail publishing, Encore also sells directly to consumers through its websites. The publishing business packages, brands, markets and sells published software directly to retailers, third party distributors, and to the Company’s distribution business.
The Company also formerly published and sold anime content through FUNimation Productions, Ltd. (“FUNimation”). The Company sold FUNimation on March 31, 2011 and accordingly, the results of operations, assets and liabilities of FUNimation for all periods presented are classified as discontinued operations (see further disclosure in Note 3).
The Company’s publishing business also formerly published budget home video through BCI Eclipse Company, LLC (“BCI”), which began winding down its licensing operations related to budget home video during fiscal 2009. The wind-down was completed during the fourth quarter of fiscal 2010.
Financial information by reportable segment is included in the following summary for the years ended March 31, 2011, 2010 and 2009 (in thousands):
| Fiscal Year 2011 |
Distribution | Publishing | Eliminations | Consolidated | ||||||||||||
| Net sales (1) |
$ | 481,349 | $ | 31,731 | $ | (22,183 | ) | $ | 490,897 | |||||||
| Income from operations |
1,186 | 4,768 | — | 5,954 | ||||||||||||
| Income from continuing operations before income taxes (2) |
1,747 | 5,342 | (3,042 | ) | 4,047 | |||||||||||
| Depreciation and amortization expense |
3,275 | 573 | — | 3,848 | ||||||||||||
| Restructuring, impairment and other charges |
— | — | — | — | ||||||||||||
| Capital expenditures |
732 | 84 | — | 816 | ||||||||||||
| Total assets (3) |
146,372 | 29,424 | (1,930 | ) | 173,866 | |||||||||||
| Fiscal Year 2010 |
Distribution | Publishing | Eliminations | Consolidated | ||||||||||||
| Net sales (1) |
$ | 487,692 | $ | 32,058 | $ | (23,980 | ) | $ | 495,770 | |||||||
| Income from operations |
6,353 | 5,185 | — | 11,538 | ||||||||||||
| Income from continuing operations before income taxes (2) |
6,875 | 6,180 | (2,969 | ) | 10,086 | |||||||||||
| Depreciation and amortization expense |
3,687 | 350 | — | 4,037 | ||||||||||||
| Restructuring, impairment and other charges |
— | — | — | — | ||||||||||||
| Capital expenditures |
1,076 | 122 | — | 1,198 | ||||||||||||
| Total assets (3) |
121,342 | 19,939 | (6,533 | ) | 134,748 | |||||||||||
75
Table of Contents
| Fiscal Year 2009 |
Distribution | Publishing | Eliminations | Consolidated | ||||||||||||
| Net sales (1) |
$ | 592,893 | $ | 42,490 | $ | (36,324 | ) | $ | 599,059 | |||||||
| Income (loss) from operations |
1,143 | (29,167 | ) | — | (28,024 | ) | ||||||||||
| Loss from continuing operations before income taxes (2) |
(484 | ) | (29,380 | ) | (2,576 | ) | (32,440 | ) | ||||||||
| Depreciation and amortization expense |
4,060 | 3,720 | — | 7,780 | ||||||||||||
| Restructuring, impairment and other charges |
591 | 29,408 | — | 29,999 | ||||||||||||
| Capital expenditures |
2,960 | 95 | — | 3,055 | ||||||||||||
| Total assets (3) |
131,355 | 13,629 | 1,564 | 146,548 | ||||||||||||
| (1) | Excluded from publishing sales above, were net sales from discontinued operations for the years ended March 31, 2011, 2010 and 2009 of $35.4 million, $32.6 million and $31.9 million, respectively. |
| (2) | Eliminations represent the portion of interest expense previously allocated to FUNimation, which was not allowed to be allocated to discontinued operations. |
| (3) | Excluded from total publishing assets above were zero, $36.5 million and $36.6 million in assets of discontinued operations at March 31, 2011, 2010 and 2009, respectively. |
Product Line Data
The following table provides net sales by product line for each business segment for the years ended March 31, 2011, 2010 and 2009 (in thousands):
| Fiscal Year 2011 |
Distribution | Publishing | Eliminations | Consolidated | ||||||||||||
| Software |
$ | 380,757 | $ | 31,731 | $ | (22,183 | ) | $ | 390,305 | |||||||
| Consumer electronics and accessories |
31,131 | — | — | 31,131 | ||||||||||||
| Video games |
27,513 | — | — | 27,513 | ||||||||||||
| Home video |
41,948 | — | — | 41,948 | ||||||||||||
| Consolidated |
$ | 481,349 | $ | 31,731 | $ | (22,183 | ) | $ | 490,897 | |||||||
| Fiscal Year 2010 |
Distribution | Publishing | Eliminations | Consolidated | ||||||||||||
| Software |
$ | 407,999 | $ | 31,823 | $ | (24,166 | ) | $ | 415,656 | |||||||
| Consumer electronics and accessories |
14,281 | — | — | 14,281 | ||||||||||||
| Video games |
27,270 | — | — | 27,270 | ||||||||||||
| Home video |
38,142 | 235 | 186 | 38,563 | ||||||||||||
| Consolidated |
$ | 487,692 | $ | 32,058 | $ | (23,980 | ) | $ | 495,770 | |||||||
| Fiscal Year 2009 |
Distribution | Publishing | Eliminations | Consolidated | ||||||||||||
| Software |
$ | 458,583 | $ | 32,447 | $ | (28,537 | ) | $ | 462,493 | |||||||
| Consumer electronics and accessories |
8,451 | — | — | 8,451 | ||||||||||||
| Video games |
70,660 | — | — | 70,660 | ||||||||||||
| Home video |
55,199 | 10,043 | (7,787 | ) | 57,455 | |||||||||||
| Consolidated |
$ | 592,893 | $ | 42,490 | $ | (36,324 | ) | $ | 599,059 | |||||||
Geographic Data
The following table provides net sales and property, plant and equipment by geographic region for the years ended March 31, 2011, 2010 and 2009 (in thousands):
| Years ended March 31, | ||||||||||||
| 2011 | 2010 | 2009 | ||||||||||
| United States |
$ | 449,287 | $ | 470,300 | $ | 581,521 | ||||||
| International |
41,610 | 25,470 | 17,538 | |||||||||
| Total net sales |
$ | 490,897 | $ | 495,770 | $ | 599,059 | ||||||
| Years ended March 31, | ||||||||||||
| 2011 | 2010 | 2009 | ||||||||||
| United States |
$ | 8,829 | $ | 11,433 | $ | 14,527 | ||||||
| International |
470 | 357 | — | |||||||||
| Total property, plant and equipment |
$ | 9,299 | $ | 11,790 | $ | 14,527 | ||||||
76
Table of Contents
Sales Channel Data
The following table provides net sales by sales channel for the years ended March 31, 2011, 2010 and 2009 (in thousands):
| Years ended March 31, | ||||||||||||
| 2011 | 2010 | 2009 | ||||||||||
| Retail |
$ | 441,775 | $ | 465,542 | $ | 572,535 | ||||||
| E-commerce |
49,122 | 30,228 | 26,524 | |||||||||
| Total net sales |
$ | 490,897 | $ | 495,770 | $ | 599,059 | ||||||
Note 27 Quarterly Data — Seasonality (Unaudited)
The Company’s quarterly operating results fluctuate significantly and will likely do so in the future as a result of seasonal variations of products ultimately sold at retail. The Company’s business is affected by the pattern of seasonality common to other suppliers of retailers, particularly the holiday selling season. Traditionally, the Company’s third quarter (October 1-December 31) has accounted for its largest quarterly revenue figures and a substantial portion of its earnings. The Company’s third quarter accounted for 30.0%, 25.4% and 27.6% of its net sales for the years ended March 31, 2011, 2010 and 2009, respectively.
The following table sets forth certain unaudited quarterly historical financial data of the Company’s operations on a consolidated basis for each of the four quarters in the years ended March 31, 2011 and March 31, 2010 (in thousands, except per share amounts):
| Quarter Ended | ||||||||||||||||
| Fiscal Year 2011 |
June 30 | September 30 | December 31 | March 31 | ||||||||||||
| Net sales |
$ | 98,792 | $ | 120,476 | $ | 147,325 | $ | 124,304 | ||||||||
| Gross profit |
14,477 | 17,260 | 17,813 | 15,618 | ||||||||||||
| Income (loss) from operations |
1,156 | 3,157 | 2,074 | (433 | ) | |||||||||||
| Net income from continuing operations |
203 | 1,457 | 1,067 | 9,766 | ||||||||||||
| Loss on sale of discontinued operations, net of tax |
— | — | — | (5,198 | ) | |||||||||||
| Income (loss) from discontinued operations, net of tax |
895 | 1,680 | 1,849 | (536 | ) | |||||||||||
| Net income |
$ | 1,098 | $ | 3,137 | $ | 2,916 | $ | 4,032 | ||||||||
| Basic earnings (loss) per common share: |
||||||||||||||||
| Continuing operations |
$ | 0.01 | $ | 0.04 | $ | 0.03 | $ | 0.26 | ||||||||
| Discontinued operations |
0.02 | 0.05 | 0.05 | (0.15 | ) | |||||||||||
| Net Income |
$ | 0.03 | $ | 0.09 | $ | 0.08 | $ | 0.11 | ||||||||
| Diluted earnings (loss) per common share: |
||||||||||||||||
| Continuing operations |
$ | 0.01 | $ | 0.04 | $ | 0.03 | $ | 0.26 | ||||||||
| Discontinued operations |
0.02 | 0.05 | 0.05 | (0.16 | ) | |||||||||||
| Net Income |
$ | 0.03 | $ | 0.09 | $ | 0.08 | $ | 0.10 | ||||||||
| Quarter Ended | ||||||||||||||||
| Fiscal Year 2010 |
June 30 | September 30 | December 31 | March 31 | ||||||||||||
| Net sales |
$ | 123,416 | $ | 113,491 | $ | 125,846 | $ | 133,017 | ||||||||
| Gross profit |
14,963 | 16,743 | 17,225 | 19,113 | ||||||||||||
| Income from operations |
1,144 | 3,001 | 2,857 | 4,536 | ||||||||||||
| Net income from continuing operations |
854 | 1,845 | 6,311 | 9,678 | ||||||||||||
| Income (loss) from discontinued operations, net of tax |
3,307 | 435 | 928 | (486 | ) | |||||||||||
| Net income |
$ | 4,161 | $ | 2,280 | $ | 7,239 | $ | 9,192 | ||||||||
| Basic earnings (loss) per common share: |
||||||||||||||||
| Continuing operations |
$ | 0.02 | $ | 0.05 | $ | 0.17 | $ | 0.27 | ||||||||
| Discontinued operations |
0.09 | 0.01 | 0.03 | (0.01 | ) | |||||||||||
| Net Income |
$ | 0.11 | $ | 0.06 | $ | 0.20 | $ | 0.26 | ||||||||
| Diluted earnings (loss) per common share: |
||||||||||||||||
| Continuing operations |
$ | 0.02 | $ | 0.05 | $ | 0.17 | $ | 0.27 | ||||||||
| Discontinued operations |
0.09 | 0.01 | 0.03 | (0.02 | ) | |||||||||||
| Net Income |
$ | 0.11 | $ | 0.06 | $ | 0.20 | $ | 0.25 | ||||||||
77
Table of Contents
Note 28 Subsequent Events
On April 6, 2011, the Board of Directors of the Company terminated the employment of the President and Chief Executive Officer, Cary L. Deacon. The Company anticipates that it will recognize approximately $1.4 million in expense during the first quarter of fiscal 2012 related to severance and certain equity compensation costs arising out of the termination of Mr. Deacon’s employment.
On April 14, 2011, the Company entered into an agreement to be released from the office lease guarantee related to the FUNimation lease in Flower Mound, Texas. The Company was released from the guaranty by providing a five year, standby letter of credit for $1.5 million, which is reduced by $300,000 each subsequent year. The standby letter of credit can be drawn down, to the extent in default, if the full and prompt payment of the lease is not completed by FUNimation. At March 31, 2011, an accrual related to any future obligation was not considered necessary as there was no indication that FUNimation would not be able to pay the required future lease payments totaling $4.1 million at March 31, 2011.
78
Table of Contents
Navarre Corporation
Schedule II — Valuation and Qualifying Accounts and Reserves
(in thousands)
| Description |
Balance at Beginning of Period |
Charged to Costs and Expenses |
Additions/ (Deductions) |
Balance at End of Period |
||||||||||||
| Year ended March 31, 2011: |
||||||||||||||||
| Deducted from asset accounts: |
||||||||||||||||
| Allowance for doubtful accounts |
$ | 1,093 | $ | 220 | $ | (465 | ) | $ | 848 | |||||||
| Allowance for sales returns |
2,173 | 4,140 | (4,286 | ) | 2,027 | |||||||||||
| Allowance for MDF and sales discounts |
2,525 | 3,436 | (4,135 | ) | 1,826 | |||||||||||
| Total |
$ | 5,791 | $ | 7,796 | $ | (8,886 | ) | $ | 4,701 | |||||||
| Year ended March 31, 2010: |
||||||||||||||||
| Deducted from asset accounts: |
||||||||||||||||
| Allowance for doubtful accounts |
$ | 1,453 | $ | 245 | $ | (605 | ) | $ | 1,093 | |||||||
| Allowance for sales returns |
4,963 | 1,814 | (4,604 | ) | 2,173 | |||||||||||
| Allowance for MDF and sales discounts |
3,636 | 7,153 | (8,264 | ) | 2,525 | |||||||||||
| Total |
$ | 10,052 | $ | 9,212 | $ | (13,473 | ) | $ | 5,791 | |||||||
| Year ended March 31, 2009: |
||||||||||||||||
| Deducted from asset accounts: |
||||||||||||||||
| Allowance for doubtful accounts |
$ | 1,131 | $ | 597 | $ | (275 | ) | $ | 1,453 | |||||||
| Allowance for sales returns |
3,344 | 8,651 | (7,032 | ) | 4,963 | |||||||||||
| Allowance for MDF and sales discounts |
3,767 | 8,037 | (8,168 | ) | 3,636 | |||||||||||
| Total |
$ | 8,242 | $ | 17,285 | $ | (15,475 | ) | $ | 10,052 | |||||||
79