Attached files
| file | filename |
|---|---|
| 8-K - 8-K - SquareTwo Financial Corp | a11-14459_18k.htm |
Exhibit 99.1
|
|
Paul A. Larkins, President and CEO L. Heath Sampson, Chief Financial Officer Accelerating Assets Back to Black June 8, 2011 Keefe, Bruyette & Woods, Inc. |
|
|
Forward-Looking Statements 2 The following information contains forward-looking statements within the meaning of the Private Securities Litigation Reform Act of 1995. These forward-looking statements are based on current expectations and beliefs of SquareTwo Financial Corporation and its subsidiaries (collectively, “SquareTwo” or the “Company”), as well as on a number of assumptions concerning future events. These statements are subject to risks, uncertainties, assumptions and other important factors, many of which are outside SquareTwo’s control, that could cause actual results to differ materially from the results discussed in the forward-looking statements. You are cautioned not to rely on such forward-looking statements because actual results may vary materially from those expressed or implied. All forward-looking statements are based on information available to SquareTwo on this date and SquareTwo does not assume any obligation to, and expressly disclaims any obligation to, update or revise any forward looking statements, whether as a result of new information, future events or otherwise. |
|
|
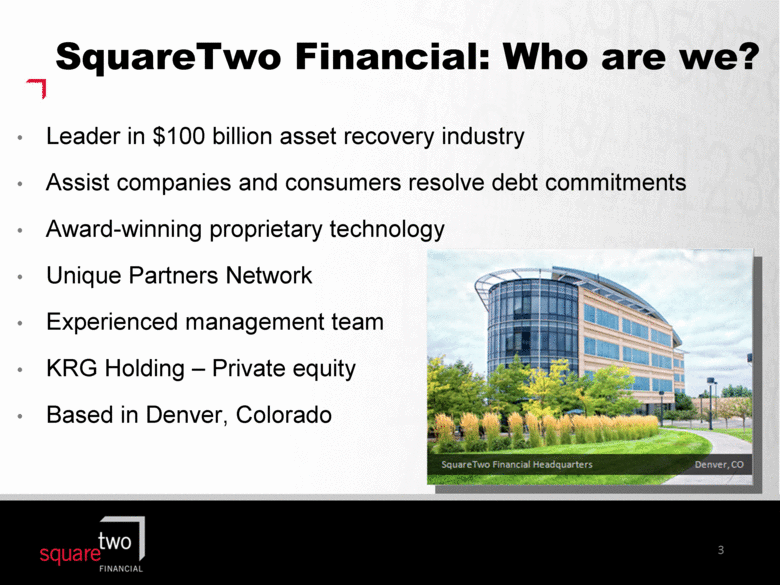
SquareTwo Financial: Who are we? 3 Leader in $100 billion asset recovery industry Assist companies and consumers resolve debt commitments Award-winning proprietary technology Unique Partners Network Experienced management team KRG Holding – Private equity Based in Denver, Colorado SquareTwo Financial Headquarters Denver, CO |
|
|
SquareTwo Overview SquareTwo is one of the largest receivable management firms that operates through a unique attorney-based franchise model Since our inception in 1994 we have: Purchased $27.2 billion of receivables deploying $1.7 billion of capital Collected over $2.9 billion on purchased receivables Historical cash-on-cash returns of 2.1x gross ROI and 1.4x net ROI SquareTwo maximizes returns on its current receivables base of $8.6 billion through the following: Best-in-class, real-time, inventory management Advanced analytics driving disciplined yet stringent underwriting A national and Canadian footprint of Partners that work collaboratively with SquareTwo and are incentivized based on our return hurdles 4 |
|
|
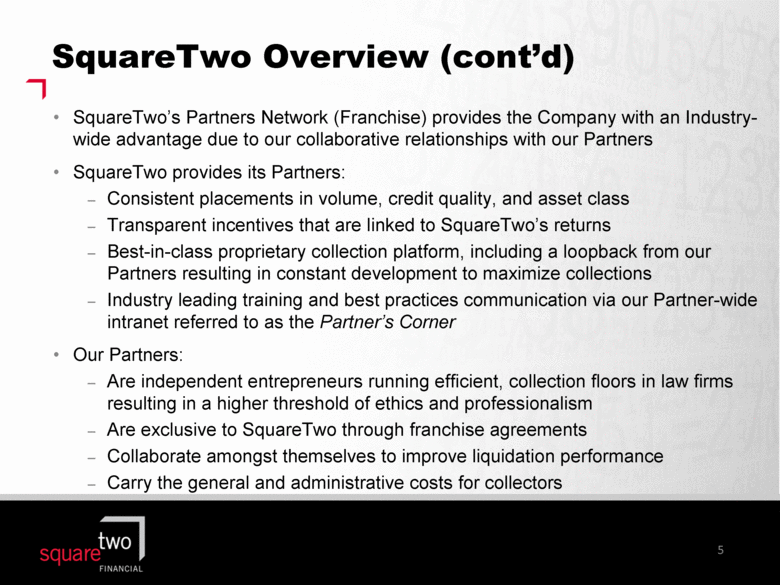
SquareTwo Overview (cont’d) SquareTwo’s Partners Network (Franchise) provides the Company with an Industry-wide advantage due to our collaborative relationships with our Partners SquareTwo provides its Partners: Consistent placements in volume, credit quality, and asset class Transparent incentives that are linked to SquareTwo’s returns Best-in-class proprietary collection platform, including a loopback from our Partners resulting in constant development to maximize collections Industry leading training and best practices communication via our Partner-wide intranet referred to as the Partner’s Corner Our Partners: Are independent entrepreneurs running efficient, collection floors in law firms resulting in a higher threshold of ethics and professionalism Are exclusive to SquareTwo through franchise agreements Collaborate amongst themselves to improve liquidation performance Carry the general and administrative costs for collectors 5 |
|
|
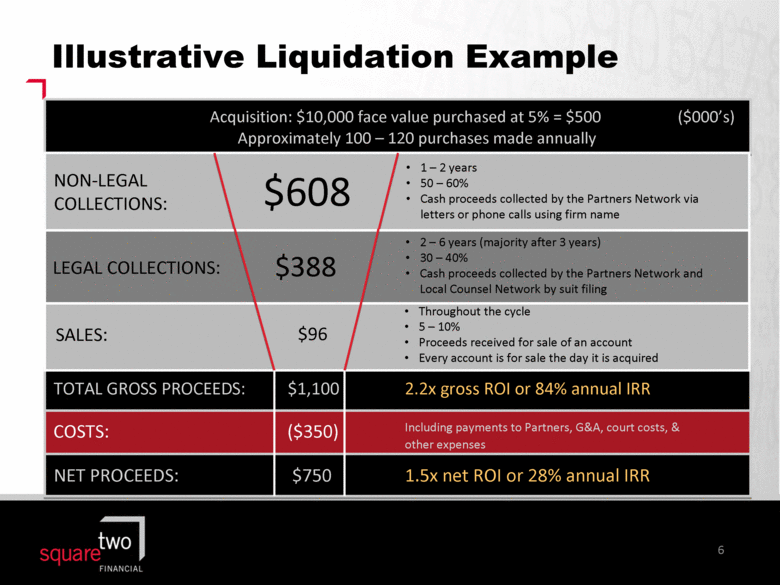
Illustrative Liquidation Example 6 TOTAL GROSS PROCEEDS: $1,100 2.2x gross ROI or 84% annual IRR Including payments to Partners, G&A, court costs, & other expenses NET PROCEEDS: $750 1.5x net ROI or 28% annual IRR Acquisition: $10,000 face value purchased at 5% = $500 ($000’s) Approximately 100 – 120 purchases made annually COSTS: ($350) $608 $388 $96 NON-LEGAL COLLECTIONS: LEGAL COLLECTIONS: SALES: 1 – 2 years 50 – 60% Cash proceeds collected by the Partners Network via letters or phone calls using firm name 2 – 6 years (majority after 3 years) 30 – 40% Cash proceeds collected by the Partners Network and Local Counsel Network by suit filing Throughout the cycle 5 – 10% Proceeds received for sale of an account Every account is for sale the day it is acquired |
|
|
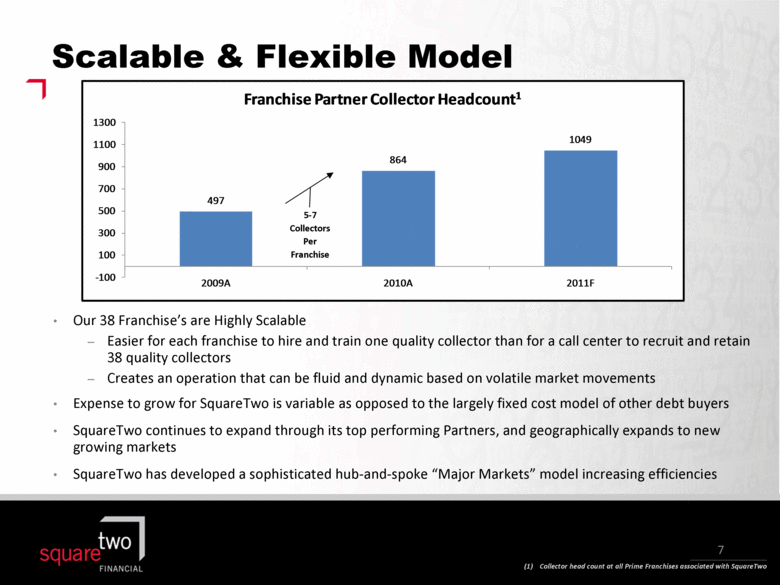
Scalable & Flexible Model Our 38 Franchise’s are Highly Scalable Easier for each franchise to hire and train one quality collector than for a call center to recruit and retain 38 quality collectors Creates an operation that can be fluid and dynamic based on volatile market movements Expense to grow for SquareTwo is variable as opposed to the largely fixed cost model of other debt buyers SquareTwo continues to expand through its top performing Partners, and geographically expands to new growing markets SquareTwo has developed a sophisticated hub-and-spoke “Major Markets” model increasing efficiencies ____________________ (1) Collector head count at all Prime Franchises associated with SquareTwo 5-7 Collectors Per Franchise 7 497 864 1049 - 100 100 300 500 700 900 1100 1300 2009A 2010A 2011F Franchise Partner Collector Headcount 1 |
|
|
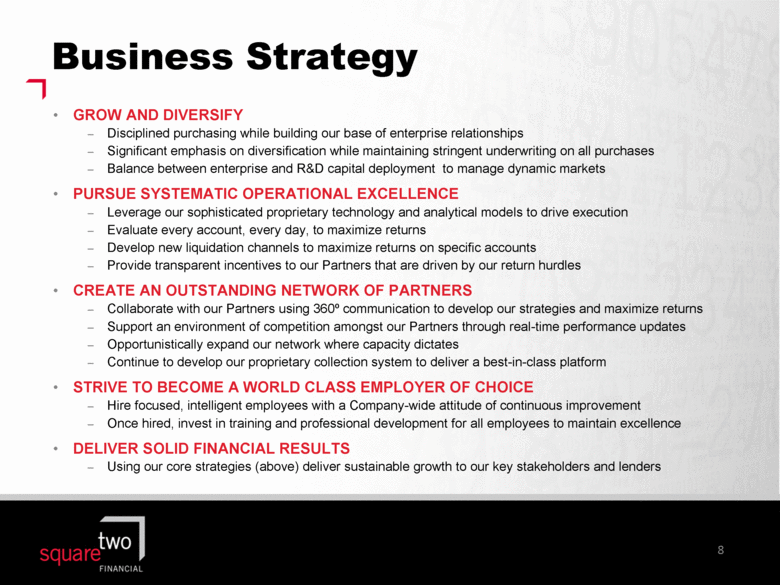
Business Strategy GROW AND DIVERSIFY Disciplined purchasing while building our base of enterprise relationships Significant emphasis on diversification while maintaining stringent underwriting on all purchases Balance between enterprise and R&D capital deployment to manage dynamic markets PURSUE SYSTEMATIC OPERATIONAL EXCELLENCE Leverage our sophisticated proprietary technology and analytical models to drive execution Evaluate every account, every day, to maximize returns Develop new liquidation channels to maximize returns on specific accounts Provide transparent incentives to our Partners that are driven by our return hurdles CREATE AN OUTSTANDING NETWORK OF PARTNERS Collaborate with our Partners using 360º communication to develop our strategies and maximize returns Support an environment of competition amongst our Partners through real-time performance updates Opportunistically expand our network where capacity dictates Continue to develop our proprietary collection system to deliver a best-in-class platform STRIVE TO BECOME A WORLD CLASS EMPLOYER OF CHOICE Hire focused, intelligent employees with a Company-wide attitude of continuous improvement Once hired, invest in training and professional development for all employees to maintain excellence DELIVER SOLID FINANCIAL RESULTS Using our core strategies (above) deliver sustainable growth to our key stakeholders and lenders 8 |
|
|
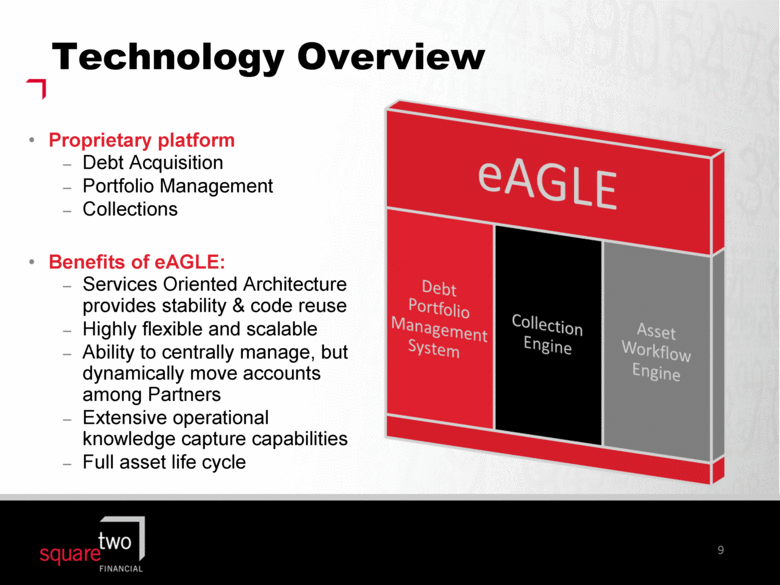
Technology Overview 9 Proprietary platform Debt Acquisition Portfolio Management Collections Benefits of eAGLE: Services Oriented Architecture provides stability & code reuse Highly flexible and scalable Ability to centrally manage, but dynamically move accounts among Partners Extensive operational knowledge capture capabilities Full asset life cycle |
|
|
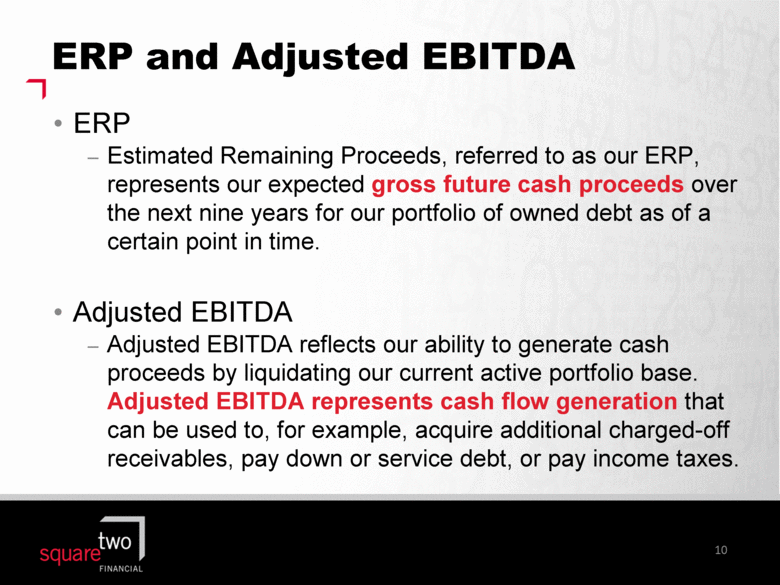
ERP and Adjusted EBITDA 10 ERP Estimated Remaining Proceeds, referred to as our ERP, represents our expected gross future cash proceeds over the next nine years for our portfolio of owned debt as of a certain point in time. Adjusted EBITDA Adjusted EBITDA reflects our ability to generate cash proceeds by liquidating our current active portfolio base. Adjusted EBITDA represents cash flow generation that can be used to, for example, acquire additional charged-off receivables, pay down or service debt, or pay income taxes. |
|
|
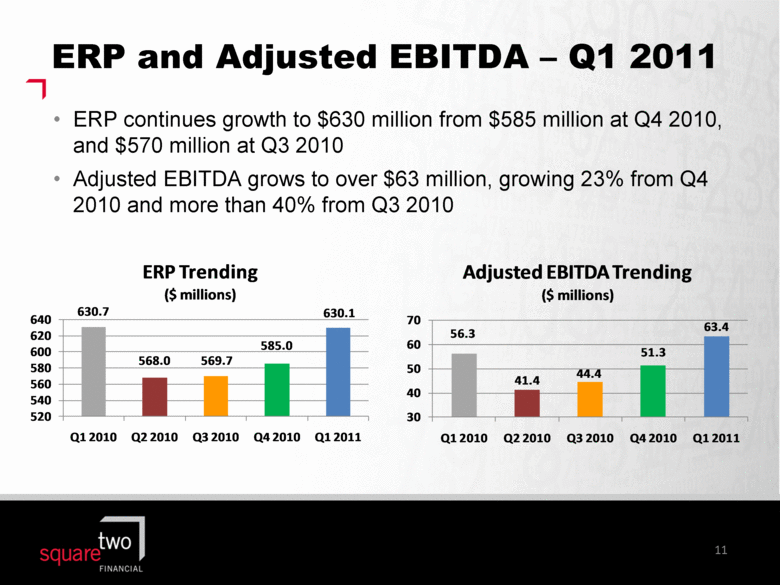
ERP and Adjusted EBITDA – Q1 2011 11 ERP continues growth to $630 million from $585 million at Q4 2010, and $570 million at Q3 2010 Adjusted EBITDA grows to over $63 million, growing 23% from Q4 2010 and more than 40% from Q3 2010 630.7 568.0 569.7 585.0 630.1 520 540 560 580 600 620 640 Q1 2010 Q2 2010 Q3 2010 Q4 2010 Q1 2011 ERP Trending ($ millions) Adjusted EBITDA Trending ($ millions) 70 60 50 40 30 Q1 2010 Q2 2010 Q3 2010 Q4 2010 Q1 2011 56.3 41.4 44.4 51.3 63.4 |
|
|
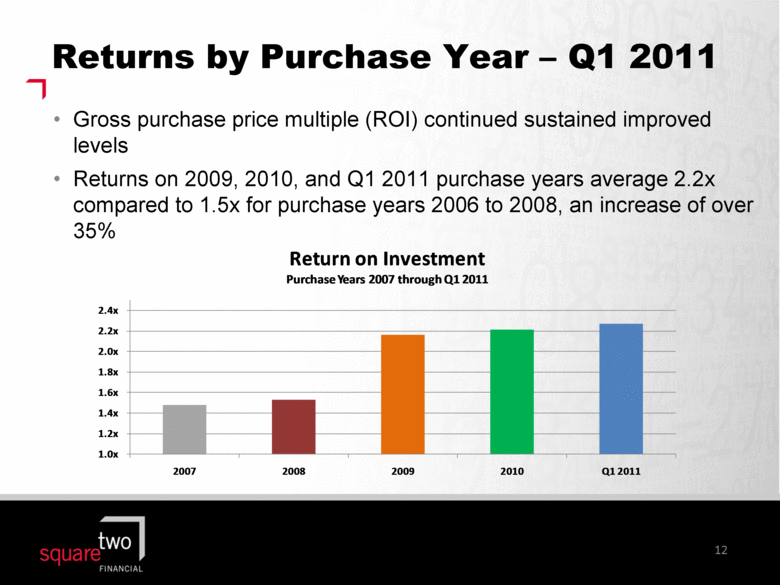
Returns by Purchase Year – Q1 2011 12 Gross purchase price multiple (ROI) continued sustained improved levels Returns on 2009, 2010, and Q1 2011 purchase years average 2.2x compared to 1.5x for purchase years 2006 to 2008, an increase of over 35% 1.0x 1.2x 1.4x 1.6 x 1.8 x 2.0x 2.2x 2.4x 2007 2008 2009 2010 Q1 2011 Return on Investment Purchase Years 2007 through Q1 2011 |
|
|
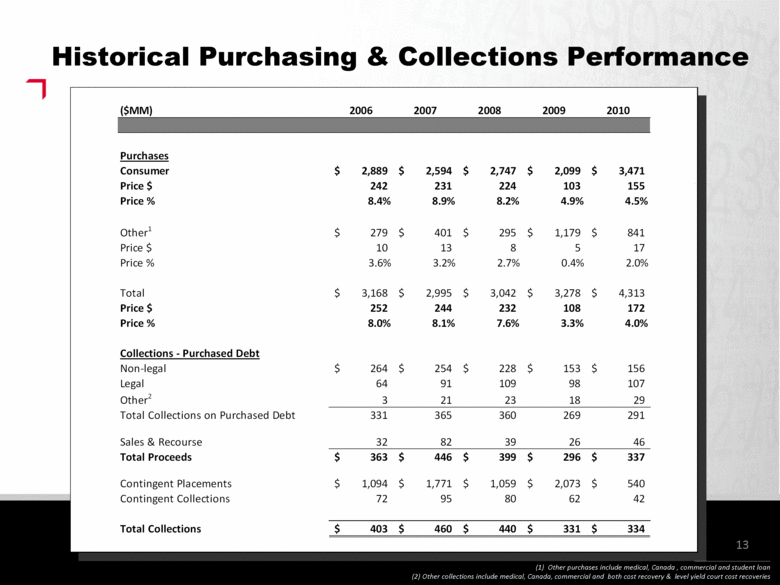
Historical Purchasing & Collections Performance 13 (1) Other purchases include medical, Canada , commercial and student loan (2) Other collections include medical, Canada, commercial and both cost recovery & level yield court cost recoveries ($MM) 2006 2007 2008 2009 2010 Purchases Consumer 2,889 $ 2,594 $ 2,747 $ 2,099 $ 3,471 $ Price $ 242 231 224 103 155 Price % 8.4% 8.9% 8.2% 4.9% 4.5% Other 1 279 $ 401 $ 295 $ 1,179 $ 841 $ Price $ 10 13 8 5 17 Price % 3.6% 3.2% 2.7% 0.4% 2.0% Total 3,168 $ 2,995 $ 3,042 $ 3,278 $ 4,313 $ Price $ 252 244 232 108 172 Price % 8.0% 8.1% 7.6% 3.3% 4.0% Collections - Purchased Debt Non-legal 264 $ 254 $ 228 $ 153 $ 156 $ Legal 64 91 109 98 107 Other 2 3 21 23 18 29 Total Collections on Purchased Debt 331 365 360 269 291 Sales & Recourse 32 82 39 26 46 Total Proceeds 363 $ 446 $ 399 $ 296 $ 337 $ Contingent Placements 1,094 $ 1,771 $ 1,059 $ 2,073 $ 540 $ Contingent Collections 72 95 80 62 42 Total Collections 403 $ 460 $ 440 $ 331 $ 334 $ |
|
|
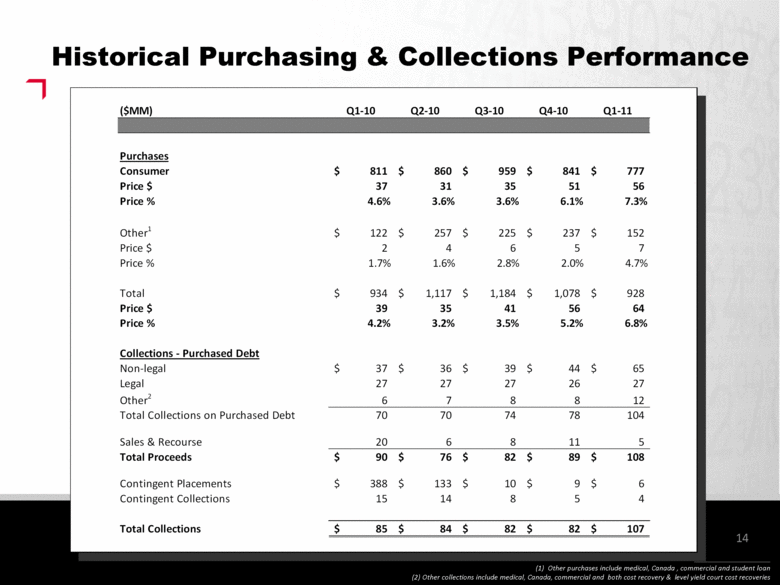
Historical Purchasing & Collections Performance 14 (1) Other purchases include medical, Canada , commercial and student loan (2) Other collections include medical, Canada, commercial and both cost recovery & level yield court cost recoveries ($MM) Q1-10 Q2-10 Q3-10 Q4-10 Q1-11 Purchases Consumer 811 $ 860 $ 959 $ 841 $ 777 $ Price $ 37 31 35 51 56 Price % 4.6% 3.6% 3.6% 6.1% 7.3% Other 1 122 $ 257 $ 225 $ 237 $ 152 $ Price $ 2 4 6 5 7 Price % 1.7% 1.6% 2.8% 2.0% 4.7% Total 934 $ 1,117 $ 1,184 $ 1,078 $ 928 $ Price $ 39 35 41 56 64 Price % 4.2% 3.2% 3.5% 5.2% 6.8% Collections - Purchased Debt Non-legal 37 $ 36 $ 39 $ 44 $ 65 $ Legal 27 27 27 26 27 Other 2 6 7 8 8 12 Total Collections on Purchased Debt 70 70 74 78 104 Sales & Recourse 20 6 8 11 5 Total Proceeds 90 $ 76 $ 82 $ 89 $ 108 $ Contingent Placements 388 $ 133 $ 10 $ 9 $ 6 $ Contingent Collections 15 14 8 5 4 Total Collections 85 $ 84 $ 82 $ 82 $ 107 $ |
|
|
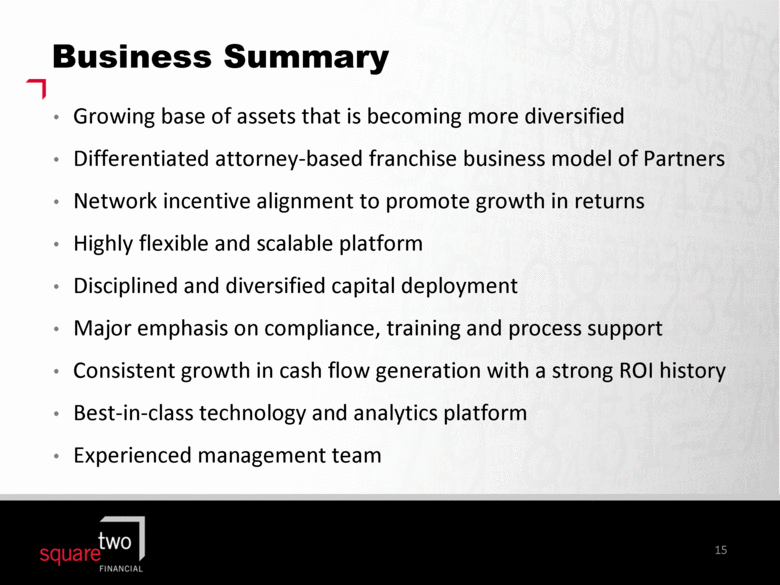
Business Summary Growing base of assets that is becoming more diversified Differentiated attorney-based franchise business model of Partners Network incentive alignment to promote growth in returns Highly flexible and scalable platform Disciplined and diversified capital deployment Major emphasis on compliance, training and process support Consistent growth in cash flow generation with a strong ROI history Best-in-class technology and analytics platform Experienced management team 15 |

