Attached files
| file | filename |
|---|---|
| EXCEL - IDEA: XBRL DOCUMENT - SquareTwo Financial Corp | Financial_Report.xls |
| EX-31.2 - EXHIBIT 31.2 - SquareTwo Financial Corp | q12015ex312cfocertification.htm |
| EX-31.1 - EXHIBIT 31.1 - SquareTwo Financial Corp | q12015ex311ceocertification.htm |
| EX-32.1 - EXHIBIT 32.1 - SquareTwo Financial Corp | q12015ex321soxcertification.htm |
UNITED STATES
SECURITIES AND EXCHANGE COMMISSION
Washington, DC 20549
________________________________________________________________
FORM 10-Q
________________________________________________________________
x QUARTERLY REPORT PURSUANT TO SECTION 13 OR 15(d) OF THE SECURITIES EXCHANGE ACT OF 1934
For the quarterly period ended March 31, 2015
or
o TRANSITION REPORT PURSUANT TO SECTION 13 OR 15(d) OF THE SECURITIES EXCHANGE ACT OF 1934
For the transition period from to
Commission File Number: 333-170734
_____________________________________________
SquareTwo Financial Corporation
(Exact name of Registrant as Specified in Its Charter)
_____________________________________________
Delaware | 84-1261849 | |
(State or Other Jurisdiction of Incorporation or Organization) | (I.R.S. Employer Identification No.) | |
4340 South Monaco Street, Second Floor | ||
Denver, Colorado | 80237 | |
(Address of Principal Executive Offices) | (Zip Code) | |
303-296-3345
(Registrant’s telephone number, including area code)
Not Applicable
(Former name, former address and former fiscal year, if changed since last report)
Indicate by check mark whether the registrant: (1) has filed all reports required to be filed by Section 13 or 15(d) of the Securities Exchange Act of 1934 during the preceding 12 months (or for such shorter period that the registrant was required to file such reports), and (2) has been subject to such filing requirements for the past 90 days. Yes o No o
(Note: The registrant is a voluntary filer of reports under Section 13 or 15(d) of the Securities Exchange Act of 1934; the registrant has filed during the preceding 12 months all reports that it would have been required to file by Section 13 or 15(d) of the Securities Exchange Act of 1934 if the registrant had been subject to one of such Sections.)
Indicate by check mark whether the registrant has submitted electronically and posted on its corporate Web site, if any, every Interactive Data File required to be submitted and posted pursuant to Rule 405 of Regulation S-T (§232.405 of this chapter) during the preceding 12 months (or for such shorter period that the registrant was required to submit and post such files). Yes x No o
Indicate by check mark whether the registrant is a large accelerated filer, an accelerated filer, a non-accelerated filer, or a smaller reporting company. See the definitions of “large accelerated filer,” “accelerated filer” and “smaller reporting company” in Rule 12b-2 of the Exchange Act. (Check one):
Large accelerated filer o | Accelerated filer o | |
Non-accelerated filer x (Do not check if a smaller reporting company) | Smaller reporting company o | |
Indicate by check mark whether the registrant is a shell company (as defined in Rule 12b-2 of the Act): Yes o No x
As of May 14, 2015, 1,000 shares of the registrant’s common stock, par value $0.001 per share, were outstanding.
TABLE OF CONTENTS
Page | ||
i
PART I
Item 1. Condensed Consolidated Financial Statements.
SquareTwo Financial Corporation and Subsidiaries
Condensed Consolidated Balance Sheets
(unaudited, in thousands except share data)
March 31, 2015 | December 31, 2014 | |||||||
Assets | ||||||||
Cash and cash equivalents | $ | 17,566 | $ | 15,677 | ||||
Restricted cash | 21,705 | 4,137 | ||||||
Trade receivables, net of allowance for doubtful accounts of $15 and $15, respectively | 2,398 | 1,851 | ||||||
Notes receivable | 178 | 194 | ||||||
Purchased debt, net | 200,506 | 222,700 | ||||||
Property and equipment, net | 22,384 | 23,189 | ||||||
Goodwill and intangible assets | 171,285 | 171,348 | ||||||
Other assets | 8,957 | 8,991 | ||||||
Total assets | $ | 444,979 | $ | 448,087 | ||||
Liabilities and stockholder's deficiency | ||||||||
Liabilities: | ||||||||
Accounts payable, trade | $ | 2,433 | $ | 3,225 | ||||
Payable from trust accounts | 1,740 | 1,404 | ||||||
Taxes payable | 281 | 475 | ||||||
Accrued interest and other liabilities | 30,844 | 24,499 | ||||||
Deferred tax liability, net | 11,521 | 11,408 | ||||||
Line of credit | 148,333 | 138,702 | ||||||
Notes payable, net of discount | 289,380 | 289,370 | ||||||
Obligations under capital lease agreements | 1,817 | 2,310 | ||||||
Total liabilities | 486,349 | 471,393 | ||||||
Commitments and contingencies (Note 9) | ||||||||
Stockholder's deficiency: | ||||||||
Common stock, par value $0.001 per share; 1,000 shares authorized, issued and outstanding | — | — | ||||||
Additional paid-in capital | 190,202 | 190,191 | ||||||
Accumulated deficit | (231,598 | ) | (215,823 | ) | ||||
Accumulated other comprehensive loss | (6,323 | ) | (3,636 | ) | ||||
Total SquareTwo deficiency | (47,719 | ) | (29,268 | ) | ||||
Noncontrolling interest | 6,349 | 5,962 | ||||||
Total stockholder's deficiency | (41,370 | ) | (23,306 | ) | ||||
Total liabilities and stockholder's deficiency | $ | 444,979 | $ | 448,087 | ||||
See Notes to the Condensed Consolidated Financial Statements
1
SquareTwo Financial Corporation and Subsidiaries
Condensed Consolidated Statements of Operations
(unaudited, in thousands)
Three Months Ended | ||||||||
March 31, | ||||||||
2015 | 2014 | |||||||
Revenues | ||||||||
Purchased debt revenue, net | $ | 52,403 | $ | 71,490 | ||||
Other revenue | 6 | 19 | ||||||
Total revenues | 52,409 | 71,509 | ||||||
Expenses | ||||||||
Purchased debt expense | 34,479 | 39,078 | ||||||
Court costs, net | 7,261 | 9,183 | ||||||
Salaries and payroll taxes | 8,662 | 7,557 | ||||||
General and administrative | 3,307 | 4,043 | ||||||
Depreciation and amortization | 1,756 | 1,642 | ||||||
Total operating expenses | 55,465 | 61,503 | ||||||
Operating (loss) income | (3,056 | ) | 10,006 | |||||
Other expenses | ||||||||
Interest expense | 11,088 | 11,009 | ||||||
Other expense | 84 | 106 | ||||||
Total other expenses | 11,172 | 11,115 | ||||||
Loss before income taxes | (14,228 | ) | (1,109 | ) | ||||
Income tax expense | (1,160 | ) | (1,037 | ) | ||||
Net loss | (15,388 | ) | (2,146 | ) | ||||
Less: Net income attributable to the noncontrolling interest | 387 | 341 | ||||||
Net loss attributable to SquareTwo | $ | (15,775 | ) | $ | (2,487 | ) | ||
See Notes to the Condensed Consolidated Financial Statements
2
SquareTwo Financial Corporation and Subsidiaries
Condensed Consolidated Statements of Comprehensive Loss
(unaudited, in thousands)
Three Months Ended | ||||||||
March 31, | ||||||||
2015 | 2014 | |||||||
Net loss | $ | (15,388 | ) | $ | (2,146 | ) | ||
Other comprehensive loss, net of tax: | ||||||||
Currency translation adjustment | (2,687 | ) | (834 | ) | ||||
Comprehensive loss | (18,075 | ) | (2,980 | ) | ||||
Less: Comprehensive income attributable to the noncontrolling interest | 387 | 341 | ||||||
Comprehensive loss attributable to SquareTwo | $ | (18,462 | ) | $ | (3,321 | ) | ||
See Notes to the Condensed Consolidated Financial Statements
3
SquareTwo Financial Corporation and Subsidiaries
Condensed Consolidated Statements of Changes in Stockholder's Deficiency
(unaudited, in thousands)
Common Stock | Additional Paid-In Capital | Accumulated Deficit | Accumulated Other Comprehensive Loss | Total SquareTwo Deficiency | Noncontrolling Interest | Total Stockholder's Deficiency | ||||||||||||||||||||||
Balances, December 31, 2014 | $ | — | $ | 190,191 | $ | (215,823 | ) | $ | (3,636 | ) | $ | (29,268 | ) | $ | 5,962 | $ | (23,306 | ) | ||||||||||
Net (loss) income | — | — | (15,775 | ) | — | (15,775 | ) | 387 | (15,388 | ) | ||||||||||||||||||
Currency translation adjustment | — | — | — | (2,687 | ) | (2,687 | ) | — | (2,687 | ) | ||||||||||||||||||
Stock option expense | — | 11 | — | — | 11 | — | 11 | |||||||||||||||||||||
Balances, March 31, 2015 | $ | — | $ | 190,202 | $ | (231,598 | ) | $ | (6,323 | ) | $ | (47,719 | ) | $ | 6,349 | $ | (41,370 | ) | ||||||||||
See Notes to the Condensed Consolidated Financial Statements
4
SquareTwo Financial Corporation and Subsidiaries
Condensed Consolidated Statements of Cash Flows
(unaudited, in thousands)
Three Months Ended | ||||||||
March 31, | ||||||||
2015 | 2014 | |||||||
Operating activities | ||||||||
Net loss | $ | (15,388 | ) | $ | (2,146 | ) | ||
Adjustments to reconcile net loss to net cash used in operating activities: | ||||||||
Depreciation and amortization | 1,756 | 1,642 | ||||||
Amortization of loan origination fees and debt discount | 826 | 732 | ||||||
Purchased debt valuation allowance reversals | (2,419 | ) | (205 | ) | ||||
Stock option expense | 11 | 24 | ||||||
Amortization of prepaid and other non-cash expenses | 1,477 | 919 | ||||||
Deferred tax provision, net of valuation allowance | 113 | — | ||||||
Changes in operating assets and liabilities: | ||||||||
Income tax payable/receivable | (177 | ) | 85 | |||||
Restricted cash | (17,568 | ) | (19,024 | ) | ||||
Other assets | (2,694 | ) | (2,119 | ) | ||||
Accounts payable and accrued liabilities | 6,253 | 5,715 | ||||||
Net cash used in operating activities | (27,810 | ) | (14,377 | ) | ||||
Investing activities | ||||||||
Investment in purchased debt | (22,002 | ) | (25,764 | ) | ||||
Proceeds applied to purchased debt principal | 45,254 | 42,267 | ||||||
Payments to branch offices related to asset purchase program | (259 | ) | — | |||||
Investment in property and equipment, including internally developed software | (958 | ) | (1,082 | ) | ||||
Net cash provided by investing activities | 22,035 | 15,421 | ||||||
Financing activities | ||||||||
Repayments of investment by Parent | — | (150 | ) | |||||
Payments on notes payable | (170 | ) | (187 | ) | ||||
Proceeds from line of credit | 102,192 | 117,758 | ||||||
Payments on line of credit | (92,561 | ) | (114,476 | ) | ||||
Origination fees on line of credit | — | (33 | ) | |||||
Payments on capital lease obligations | (493 | ) | (377 | ) | ||||
Net cash provided by financing activities | 8,968 | 2,535 | ||||||
Increase in cash and cash equivalents | 3,193 | 3,579 | ||||||
Impact of foreign currency translation on cash | (1,304 | ) | (302 | ) | ||||
Cash and cash equivalents at beginning of period | 15,677 | 9,379 | ||||||
Cash and cash equivalents at end of period | $ | 17,566 | $ | 12,656 | ||||
Supplemental cash flow information | ||||||||
Cash paid for interest | $ | 1,795 | $ | 1,784 | ||||
Cash paid for income taxes | 1,221 | 957 | ||||||
Property and equipment financed with capital leases and notes payable | — | 406 | ||||||
See Notes to the Condensed Consolidated Financial Statements
5
SquareTwo Financial Corporation and Subsidiaries
Notes to the Condensed Consolidated Financial Statements
(unaudited, in thousands except share amounts or otherwise indicated)
1. Organization and Basis of Presentation
SquareTwo Financial Corporation (together with its subsidiaries referred to herein as “SquareTwo,” "we," "our," "us," or the “Company”) is a Delaware corporation that was organized in February 1994 and is headquartered in Denver, Colorado. On August 5, 2005, CA Holding Inc. (“Parent”) acquired 100% of the outstanding stock of SquareTwo and its subsidiaries (the “Acquisition”). The accompanying condensed consolidated financial statements reflect Parent’s basis in SquareTwo. SquareTwo’s subsidiaries purchase domestic and Canadian charged-off receivables (referred to herein as “purchased debt”).
The Company is a leading purchaser of charged-off consumer and commercial receivables in the accounts receivable management industry. Our primary business is the acquisition, management and collection of charged-off consumer and commercial accounts receivable that we purchase from financial institutions, finance and leasing companies, and other issuers in the United States (U.S.) and Canada. In the U.S, we pursue recovery of accounts through our Closed Loop Network, a unique combination of company-owned call centers along with a network of regional law offices, also referred to as "branch offices", exclusively dedicated to SquareTwo. Branch offices pursue proceeds on purchased debt owned by the Company for a fee. Each of our branch offices is independently owned and has executed agreements that provide the legal structure for the exclusive relationship with SquareTwo. SquareTwo places certain of its accounts for collection with its call centers operating under the subsidiary SquareTwo Financial Services Corporation. Until August 2014, SquareTwo Financial Services Corporation was legally known as SquareTwo Financial Commercial Funding Corporation. Along with its legal name change, this entity has registered to conduct its non-legal collection activities within the United States under the d/b/a name Fresh View Solutions ("Fresh View").
Our Canadian subsidiaries exclusively purchase and service charged-off Canadian accounts. We utilize a combination of a company-owned call center and third-party non-legal and legal collection firms to pursue recovery of our Canadian accounts.
The accompanying unaudited condensed consolidated financial statements of the Company have been prepared in accordance with U.S. generally accepted accounting principles (“GAAP”) for interim financial information and with the instructions to Form 10-Q and Rule 10-01 of Regulation S-X promulgated by the Securities and Exchange Commission (“SEC”) and, therefore, do not include all information and disclosures required by GAAP for complete financial statements. In the opinion of the Company, however, the accompanying unaudited condensed consolidated financial statements contain all adjustments, consisting only of normal recurring adjustments, necessary for a fair presentation of the Company’s condensed consolidated balance sheet as of March 31, 2015, its condensed consolidated statements of operations and condensed consolidated statements of comprehensive loss for the three months ended March 31, 2015 and 2014, its condensed consolidated statements of changes in stockholder's deficiency for the three months ended March 31, 2015, and its condensed consolidated statements of cash flows for the three months ended March 31, 2015 and 2014. The condensed consolidated statements of operations and condensed consolidated statements of comprehensive loss of the Company for the three months ended March 31, 2015 may not be indicative of future results. These unaudited condensed consolidated financial statements should be read in conjunction with the audited consolidated financial statements and notes thereto for the year ended December 31, 2014 included in the Company’s most recent Annual Report on Form 10-K.
2. Summary of Significant Accounting Policies
Principles of Consolidation
The condensed consolidated financial statements of the Company are prepared in accordance with GAAP and include the accounts of SquareTwo and its subsidiaries. SquareTwo owns the following subsidiaries: ReFinance America, Ltd.; CACV of Colorado, LLC; CACH, LLC; Collect Air, LLC; Healthcare Funding Solutions, LLC; SquareTwo Financial Services Corporation (d/b/a Fresh View Solutions); Collect America of Canada, LLC, and certain other inactive entities not listed. Collect America of Canada, LLC has a wholly-owned subsidiary, SquareTwo Financial Canada Corporation, which has an 86% ownership interest in CCL Financial Inc. ("CCL"). CCL is a consolidated subsidiary of the Company. As previously disclosed, Parent owns 100% of the outstanding equity of SquareTwo and all other Parent investments are dormant. Expenses incurred by Parent on SquareTwo’s behalf have been allocated to SquareTwo and are reflected in the condensed consolidated financial statements of SquareTwo. Intercompany transactions and balances have been eliminated in consolidation.
6
SquareTwo has two reportable operating segments, as defined by the Financial Accounting Standards Board's ("FASB") Accounting Standards Codification ("ASC") Topic 280, Segment Reporting: Domestic and Canada.
Accounting Estimates
The preparation of financial statements in conformity with GAAP requires management to make estimates and assumptions that affect the amounts reported in the financial statements and the accompanying notes. Actual results could differ from those estimates. The Company's condensed consolidated financial statements are based on a number of significant estimates, including the collectability of purchased debt and the timing of such proceeds, impairment testing of goodwill and the branch office network indefinite-lived intangible asset, and accounting for income taxes. Due to the uncertainties inherent in the estimation process, it is at least reasonably possible that the Company's estimates in connection with these items could be materially revised within the near term.
Revenue Recognition from Purchased Debt
Purchased debt represents receivables that have been charged-off as uncollectible by the originating organization and that may or may not have been subject to previous collection efforts. Through its subsidiaries, the Company purchases the rights to the unrecovered balances owed by individual customers from various financial institutions at a substantial discount from face value and records the purchase at the Company's cost to acquire the portfolio.
We account for our purchased debt under the guidance of ASC Subtopic 310-30, Loans and Debt Securities Acquired with Deteriorated Credit Quality ("ASC 310-30"). Under ASC 310-30, static pools of purchased debt may be established and accounted for under either the interest method of accounting (referred to by us as "level yield") or the cost recovery method of accounting. These pools are aggregated based on certain common risk criteria. Each static pool is recorded at cost and is accounted for as a single unit for the recognition of income, reduction of carrying value and any valuation allowance. Once a static pool is established, individual accounts are not added to or removed from the pool. Purchased debt accounted for under our level yield method of accounting is pooled each quarter, whereas purchased debt accounted for under cost recovery is pooled by each individual purchase. The cost recovery method prescribed by ASC 310-30 is required when cash proceeds on a particular purchase cannot be reasonably predicted in timing or amount. Purchased debt accounted for under the cost recovery method is comprised of Canadian portfolios acquired prior to January 1, 2012, commercial, student loan, medical, and any other purchases in the U.S. or Canada for which we do not have the necessary experience to forecast the timing and amount of cash flows. For purchased debt that we believe we can reasonably forecast the timing and amount of our cash proceeds we utilize the level yield method.
Level Yield Method
Most of our purchased debt is accounted for under the level yield method of accounting. Under the level yield method of accounting, cash proceeds on each static pool are allocated to both revenue and to reduce the carrying value (the purchased debt, net line item on the condensed consolidated balance sheets) based on an estimated gross internal rate of return ("IRR") for that pool. We determine the applicable IRR for each static pool based on our estimate of the expected cash proceeds of that pool which is based on our estimated remaining proceeds ("ERP") for the static pool, and the rate of return required to reduce the carrying value of that pool to zero over its estimated life. Each pool's IRR is typically determined using an expected life up to twelve years. As described below, if cash proceeds for a pool deviate from the forecast in timing or amount, we adjust the carrying value of the pool or its IRR (which determines our future revenue recognition), as applicable.
Purchased debt portfolios with similar economic characteristics accounted for under the level yield method are accumulated into static pools on a quarterly basis. Cash proceeds on a pool that are greater than the revenue recognized in accordance with the established IRR will reduce the carrying value of the static pool (also referred to as "amortization" of the pool). Cash proceeds on a pool that are lower than the revenue recognized in accordance with the established IRR will increase the carrying value of the static pool as required by ASC 310-30.
The expected trends of each pool are analyzed at least quarterly. If these trends are different than the original estimates, certain adjustments may be required. Each quarter, we use our ERP to determine our estimate of future cash proceeds for each pool. We then use all factors available, such as the types of assets within the pool, our experience with those assets, the age of the pool, any recent fluctuations in our recovery rates from the various channels we collect from, and where that pool is in its own collection life cycle. We use these factors for each static pool to determine a range of future proceeds, which becomes smaller as we gain more experience with each static pool. We determine our best estimate of future proceeds within that range, which may be used for adjustments to our revenue recognition, or for our determination of allowance charges.
7
Using our best estimate of future proceeds, if we estimate a reduction or delay in the receipt of the aggregate future cash proceeds on a pool, a valuation allowance may be recognized and the original IRR remains unchanged. The valuation allowance is determined to the extent that the present value (using the established IRR) of the revised future cash proceeds is less than the current carrying value of the pool. If we estimate an increase in the aggregate future cash proceeds or an acceleration of the timing of future cash proceeds on a pool, the IRR may be increased prospectively to reflect revised best estimates of those future cash proceeds over the remaining life of the pool. If there was a previous valuation allowance taken, reversal of the previously recognized valuation allowance occurs prior to any increases to the IRR. ASC 310-30 requires that each pool be evaluated independently and does not allow netting across pools. Thus, even in periods of increasing cash proceeds for our entire purchased debt portfolio, we may be required to record a valuation allowance. Allowance charges for purchased debt are included as adjustments to the purchased debt revenue, net line item in the condensed consolidated statements of operations.
Canadian purchases made on or after January 1, 2012 are being accounted for under the level yield method unless we are unable to reasonably forecast the timing and amount of cash proceeds. Purchases eligible for the level yield method are being accumulated into static pools on a quarterly basis separately from U.S. purchases.
Cost Recovery Method
Treatment of cash proceeds under the cost recovery method differs from treatment under the level yield method. Under the cost recovery method, as cash proceeds, excluding court cost recoveries, less collection fees paid are received, they directly reduce the carrying value of the purchased debt. For every dollar recorded as a fee paid to the branch offices or third party collection firms, there is a corresponding dollar recorded as revenue in the purchased debt revenue, net line item in the condensed consolidated statements of operations (i.e. the expense and revenue amounts are equal). Once the purchase's carrying value has been reduced to zero, all cash proceeds, excluding court cost recoveries, are recorded as revenues. Court cost recoveries received for purchased debt accounted for under the cost recovery method of accounting are netted against court cost expenditures in the court costs, net line item in the condensed consolidated statements of operations. As compared to the level yield method of accounting, the cost recovery method of accounting generally results in a more rapid reduction in the carrying value of purchased debt and slower recognition of revenue with respect thereto.
We assess our purchased debt accounted for under the cost recovery method at least annually, or more frequently if necessary, to determine if a valuation allowance is necessary. If the carrying value of a purchase is greater than our best estimate of future cash proceeds, excluding court cost recoveries, net of the fees expected to be paid for collections on that purchase, we record a valuation allowance for the difference. In the instance that our best estimate of future cash proceeds, excluding court cost recoveries, increases for a cost recovery purchase that had a valuation allowance previously recorded, we may reverse a portion or the entire valuation allowance, as estimates indicate. Similar to our process to determine our revenue recognition, or allowance charges for our level yield pools as described above, we use all factors available, and our ERP to determine our best estimate of future cash proceeds for our purchased debt accounted for under the cost recovery method.
Reclassifications
Certain reclassifications have been made to prior year amounts in order to conform to the current year presentation. The Company has revised the presentation of its condensed consolidated statements of operations for all the periods presented to provide improved visibility and comparability with the current year presentation. Other direct operating expense, previously a separate line item on the condensed consolidated statements of operations, of $3,906 for the three months ended March 31, 2014 has been reclassified to purchased debt expense.
Recently Issued Accounting Pronouncements
In May 2014, the FASB and the IASB issued Accounting Standards Update ("ASU") No. 2014-09, Revenue from Contracts with Customers (Topic 606). ASU No. 2014-09 is a comprehensive new revenue recognition standard that supersedes virtually all existing revenue guidance under GAAP and IFRS. The standard’s core principle is that a company will recognize revenue when it transfers promised goods or services to customers in an amount that reflects the consideration to which the company expects to be entitled in exchange for those goods or services. In doing so, companies will need to use more judgment and make more estimates than under current guidance. The new standard, which does not apply to financial instruments, is currently effective for annual reporting periods beginning after December 15, 2016, including interim periods within that reporting period. The Company is in the process of determining the impact this standard may have on its financial statements.
8
In August 2014, the FASB issued ASU No. 2014-15, Presentation of Financial Statements-Going Concern (Subtopic 205-40): Disclosure of Uncertainties about an Entity’s Ability to Continue as a Going Concern. ASU No. 2014-15 provides guidance about management's responsibility to evaluate whether there is substantial doubt about an entity's ability to continue as a going concern at each annual and interim reporting period, and to provide related footnote disclosures. This update will be effective for the Company for the annual period ending after December 15, 2016.
In February 2015, the FASB issued ASU No. 2015-02, Consolidation (Topic 810): Amendments to the Consolidation Analysis. ASU No. 2015-02 amends current consolidation guidance, affecting the evaluation of whether certain legal entities should be consolidated. All legal entities are subject to reevaluation under the revised consolidation model. The Company is evaluating this ASU to determine whether any of our current conclusions with respect to consolidation of legal entities will change under the new guidance. At this time, we have not estimated the impact of this ASU on our financial statements and related disclosures. The requirements of this update are effective for annual reporting periods beginning after December 15, 2015, including interim periods within those reporting periods, and early adoption is permitted.
In April 2015, the FASB issued ASU No. 2015-03, Interest—Imputation of Interest (Subtopic 835-30): Simplifying the Presentation of Debt Issuance Costs. ASU No. 2015-03 requires entities to present debt issuance costs related to a recognized debt liability as a direct deduction from the carrying value of that debt liability and will therefore impact our presentation of debt issuance costs when implemented. The recognition and measurement guidance for debt issuance costs is not impacted by ASU No. 2015-03. This update is effective for annual reporting periods beginning after December 15, 2015, including interim periods within those reporting periods, and early adoption is permitted.
In April 2015, the FASB issued ASU No. 2015-05, Intangibles—Goodwill and Other—Internal-Use Software (Subtopic 350-40): Customer's Accounting for Fees Paid in a Cloud Computing Arrangement. ASU 2015-05 provides guidance for customers to determine whether a cloud computing arrangement includes a software license to be accounted for consistent with the acquisition of other software licenses. Cloud computing arrangements that do not include a software license shall be accounted for as service contracts. This update is effective for annual reporting periods beginning after December 15, 2015, including interim periods within those reporting periods, and early adoption is permitted. The Company will adopt this update prospectively for any cloud computing arrangements entered into or materially modified after the effective date.
3. Purchased Debt
The following table shows the changes in purchased debt, net for the periods presented:
Three Months Ended | ||||||||||||||||||||||||
Level Yield | Cost Recovery | Totals | ||||||||||||||||||||||
March 31, | March 31, | March 31, | ||||||||||||||||||||||
2015 | 2014 | 2015 | 2014 | 2015 | 2014 | |||||||||||||||||||
Balance at beginning of period | $ | 206,642 | $ | 254,419 | $ | 16,058 | $ | 19,938 | $ | 222,700 | $ | 274,357 | ||||||||||||
Purchases | 16,349 | 24,745 | 5,653 | 1,019 | 22,002 | 25,764 | ||||||||||||||||||
Valuation allowance reversals | 2,342 | 205 | 77 | — | 2,419 | 205 | ||||||||||||||||||
Proceeds applied to purchased debt principal | (41,386 | ) | (38,601 | ) | (3,868 | ) | (3,666 | ) | (45,254 | ) | (42,267 | ) | ||||||||||||
Other(1) | (1,361 | ) | (454 | ) | — | (19 | ) | (1,361 | ) | (473 | ) | |||||||||||||
Balance at end of period | $ | 182,586 | $ | 240,314 | $ | 17,920 | $ | 17,272 | $ | 200,506 | $ | 257,586 | ||||||||||||
(1) Other includes impacts of the Company’s currency translation.
9
The following table shows the relationship of purchased debt proceeds to gross revenue recognized and proceeds applied to principal for the periods presented:
Three Months Ended | ||||||||||||||||||||||||
Level Yield | Cost Recovery | Totals | ||||||||||||||||||||||
March 31, | March 31, | March 31, | ||||||||||||||||||||||
2015 | 2014 | 2015 | 2014 | 2015 | 2014 | |||||||||||||||||||
Proceeds | $ | 82,338 | $ | 99,481 | $ | 12,135 | $ | 12,759 | $ | 94,473 | $ | 112,240 | ||||||||||||
Less: | ||||||||||||||||||||||||
Gross revenue recognized | 40,952 | 60,880 | 8,000 | 8,771 | 48,952 | 69,651 | ||||||||||||||||||
Cost recovery court cost recoveries(1) | — | — | 267 | 322 | 267 | 322 | ||||||||||||||||||
Proceeds applied to purchased debt principal | 41,386 | 38,601 | 3,868 | 3,666 | 45,254 | 42,267 | ||||||||||||||||||
$ | — | $ | — | $ | — | $ | — | $ | — | $ | — | |||||||||||||
(1) Cost recovery court cost recoveries are recorded as a contra expense in the court costs, net line item in the condensed consolidated statements of operations.
The following table reconciles gross revenue recognized to purchased debt revenue, net for the periods presented:
Three Months Ended | ||||||||||||||||||||||||
Level Yield | Cost Recovery | Totals | ||||||||||||||||||||||
March 31, | March 31, | March 31, | ||||||||||||||||||||||
2015 | 2014 | 2015 | 2014 | 2015 | 2014 | |||||||||||||||||||
Gross revenue recognized | $ | 40,952 | $ | 60,880 | $ | 8,000 | $ | 8,771 | $ | 48,952 | $ | 69,651 | ||||||||||||
Purchased debt royalties | 946 | 1,456 | 119 | 224 | 1,065 | 1,680 | ||||||||||||||||||
Valuation allowance reversals | 2,342 | 205 | 77 | — | 2,419 | 205 | ||||||||||||||||||
Other(1) | — | — | (33 | ) | (46 | ) | (33 | ) | (46 | ) | ||||||||||||||
Purchased debt revenue, net | $ | 44,240 | $ | 62,541 | $ | 8,163 | $ | 8,949 | $ | 52,403 | $ | 71,490 | ||||||||||||
(1) Other items relate to certain profit sharing items that reduce the Company’s revenue recorded on purchased debt and the branch office asset purchase program (discontinued).
The following table shows the detail of the Company’s purchases for the periods presented:
Three Months Ended | ||||||||||||||||||||||||
Level Yield | Cost Recovery | Totals | ||||||||||||||||||||||
March 31, | March 31, | March 31, | ||||||||||||||||||||||
2015 | 2014 | 2015 | 2014 | 2015 | 2014 | |||||||||||||||||||
Purchase price | $ | 16,349 | $ | 24,745 | $ | 5,653 | $ | 1,019 | $ | 22,002 | $ | 25,764 | ||||||||||||
Face value | 165,947 | 184,417 | 70,903 | 36,380 | 236,850 | 220,797 | ||||||||||||||||||
% of face | 9.9 | % | 13.4 | % | 8.0 | % | 2.8 | % | 9.3 | % | 11.7 | % | ||||||||||||
Accretable yield represents the difference between the ERP of our purchased debt accounted for under the level yield method and the carrying value of those assets. The ERP is used in determining our revenue recognition, and adjustments to our revenue recognition, for our purchased debt accounted for under the level yield method, which is described in further detail in Note 2.
During the three months ended March 31, 2015, the Company purchased $165.9 million in face value debt that qualified for the level yield method of accounting for a purchase price of $16.3 million. The ERP expected at acquisition for these level yield portfolios amounted to $28.9 million. The accretable yield for these purchases was $12.6 million, or the ERP of $28.9 million less the purchase price of $16.3 million.
10
The following table represents the change in accretable yield for the periods presented:
2015 | 2014 | |||||||
Balance at December 31, prior year | $ | 389,803 | $ | 523,006 | ||||
Impact from revenue recognized on purchased debt, net | (43,294 | ) | (61,085 | ) | ||||
Additions from current purchases | 12,592 | 13,150 | ||||||
Reclassifications to accretable yield, including foreign currency translation | 2,409 | 13,555 | ||||||
Balance at March 31, | $ | 361,510 | $ | 488,626 | ||||
The following table shows the changes in the valuation allowance for the Company’s purchased debt for the periods presented:
Three Months Ended | ||||||||||||||||||||||||
Level Yield | Cost Recovery | Totals | ||||||||||||||||||||||
March 31, | March 31, | March 31, | ||||||||||||||||||||||
2015 | 2014 | 2015 | 2014 | 2015 | 2014 | |||||||||||||||||||
Balance at beginning of period | $ | 125,758 | $ | 126,084 | $ | 19,694 | $ | 17,584 | $ | 145,452 | $ | 143,668 | ||||||||||||
Valuation allowance reversals | (2,342 | ) | (205 | ) | (77 | ) | — | (2,419 | ) | (205 | ) | |||||||||||||
Balance at end of period | $ | 123,416 | $ | 125,879 | $ | 19,617 | $ | 17,584 | $ | 143,033 | $ | 143,463 | ||||||||||||
4. Goodwill and Intangible Assets
Indefinite lived intangible assets consist of goodwill and the value of the Company’s branch offices and were identified as part of purchase accounting at the date of the Acquisition. The Company tests its indefinite lived intangible assets annually for impairment unless there is a triggering event during an interim period that would necessitate testing.
We have two operating segments: Domestic and Canada. In accordance with FASB ASC Topic 350, Intangibles-Goodwill and Other, we have deemed our operating segments to be reporting units for the purpose of testing goodwill for impairment.
The following is a summary of intangible assets as of the dates presented:
March 31, 2015 | December 31, 2014 | |||||||
Goodwill | $ | 146,395 | $ | 146,458 | ||||
Branch office intangible | 24,890 | 24,890 | ||||||
Total intangible assets | $ | 171,285 | $ | 171,348 | ||||
The change in goodwill of $0.1 million represents the effect of foreign currency translation on the goodwill of our Canada segment which had a balance of C$0.6 million at March 31, 2015 and December 31, 2014.
5. Notes Payable and Other Borrowings
Line of Credit
The following is a listing of the Company’s outstanding line of credit borrowings, balances, and interest rates under the revolving credit facility as of the dates presented:
March 31, 2015 | December 31, 2014 | |||||||||||||||||
Type of Debt | Weighted Average Interest Rate(1) | Balance | Maturity | Weighted Average Interest Rate(1) | Balance | Maturity | ||||||||||||
Line of Credit US | 4.8 | % | $ | 148,333 | April 2016 | 4.8 | % | $ | 138,702 | April 2016 | ||||||||
Line of Credit Canada | 5.8 | % | — | April 2016 | 5.8 | % | — | April 2016 | ||||||||||
Total Line of Credit | $ | 148,333 | $ | 138,702 | ||||||||||||||
(1) Weighted average interest rates exclude the impact of the amortization of fees associated with the origination of these instruments.
11
The remaining unamortized costs of the facility were $1,117 and $1,443 at March 31, 2015 and December 31, 2014, respectively, and are included in the other assets line item on the condensed consolidated balance sheets. These costs are amortized on a straight-line basis over the remaining term of the facility.
The Company had accrued interest on its line of credit of $130 and $81 at March 31, 2015 and December 31, 2014, respectively, which are included in the accrued interest and other liabilities line item on the condensed consolidated balance sheets.
At March 31, 2015, our availability under the line of credit facility was $37.0 million based on our borrowing base calculation.
Notes Payable
The following is a listing of the Company’s outstanding notes payable borrowings, balances, and interest rates as of the dates presented:
March 31, 2015 | December 31, 2014 | |||||||||||||||||
Type of Debt | Weighted Average Interest Rate(1) | Balance | Maturity | Weighted Average Interest Rate(1) | Balance | Maturity | ||||||||||||
Senior Second Lien Notes, net of $1,452 and $1,631 unamortized discount | 11.625 | % | $ | 288,548 | April 2017 | 11.625 | % | $ | 288,369 | April 2017 | ||||||||
Other Notes Payable | 6.1 | % | 832 | 2015 - 2021 | 5.8 | % | 1,001 | 2015 - 2021 | ||||||||||
Total Notes Payable | $ | 289,380 | $ | 289,370 | ||||||||||||||
(1) Weighted average interest rates exclude the impact of the amortization of fees associated with the origination of these instruments.
The remaining unamortized costs of the Senior Second Lien Notes were $2,584 and $2,904 at March 31, 2015 and December 31, 2014, respectively, and are included in the other assets line item on the condensed consolidated balance sheets. These costs are amortized on a straight-line basis over the remaining term of the notes.
The Company had accrued interest on its Senior Second Lien Notes payable of $16,856 and $8,428 at March 31, 2015 and December 31, 2014, respectively, which is included in the accrued interest and other liabilities line item on the condensed consolidated balance sheets.
Covenants
The senior revolving credit facility, as amended, and the Senior Second Lien Notes have certain covenants and restrictions, as is customary for such facilities, with which the Company must comply. As of March 31, 2015, the Company was in compliance with all covenants and restrictions of the revolving credit facility and Senior Second Lien Notes.
Letters of Credit
The Company had outstanding letters of credit totaling $492 at March 31, 2015 and December 31, 2014 which had not been drawn on and remained outstanding. The letters of credit have been issued to provide support in connection with our licensing applications.
6. Stockholder's Deficiency
Common Stock
As of March 31, 2015 and December 31, 2014, the Company was authorized to issue 1,000 shares, all of which are reserved as common stock, with 1,000 shares outstanding with a par value of $0.001 per share. There are no other equity shares outstanding that would take preference over the common stock in the instance that the Company pays dividends or liquidates. The outstanding shares are voting common stock and are owned 100% by Parent.
12
Noncontrolling Interest
The Company holds a controlling interest of approximately 86% in its Canadian subsidiary, CCL. The portions of net income and comprehensive income attributable to the noncontrolling interest in CCL are shown on our condensed consolidated statements of operations and condensed consolidated statements of comprehensive loss.
Accumulated Other Comprehensive Loss
During the three months ended March 31, 2015 and 2014, comprehensive loss included currency translation adjustments resulting from converting transactions and balances related to our Canada segment's operations from Canadian dollars to U.S. dollars. The following is a summary of the changes in accumulated other comprehensive loss for the periods presented:
Accumulated Other Comprehensive Loss | Currency Translation Adjustment | Accumulated Other Comprehensive Loss | ||||||
Balance, December 31, 2014 | $ | (3,636 | ) | $ | (3,636 | ) | ||
Other comprehensive loss, net of tax of $0 | (2,687 | ) | (2,687 | ) | ||||
Balance, March 31, 2015 | $ | (6,323 | ) | $ | (6,323 | ) | ||
Accumulated Other Comprehensive Loss | Currency Translation Adjustment | Accumulated Other Comprehensive Loss | ||||||
Balance, December 31, 2013 | $ | (1,347 | ) | $ | (1,347 | ) | ||
Other comprehensive loss, net of tax of $0 | (834 | ) | (834 | ) | ||||
Balance, March 31, 2014 | $ | (2,181 | ) | $ | (2,181 | ) | ||
7. Fair Value of Financial Instruments
ASC Topic 820, Fair Value Measurements and Disclosures ("ASC 820"), defines fair value based on the price that would be received to sell an asset or paid to transfer a liability in an orderly transaction between market participants at the measurement date. ASC 820 establishes a fair value hierarchy that prioritizes observable and unobservable inputs used to measure fair value. The fair value hierarchy consists of three broad levels, which are described below:
· Level 1-Quoted prices (unadjusted) in active markets for identical assets or liabilities that the reporting entity can access at the measurement date.
· Level 2-Inputs other than quoted prices included in Level 1, that are observable for the asset or liability, either directly or indirectly, such as quoted prices for similar assets or liabilities in active markets; quoted prices for identical or similar assets or liabilities in markets that are not active; or other inputs that are observable or can be corroborated by observable market data.
· Level 3-Unobservable inputs that are supported by little, if any, market activity and that are significant to the fair value of the assets and liabilities. This includes certain pricing models, discounted cash flow methodologies and similar techniques that use significant unobservable inputs.
Purchased Debt
The Company initially records purchased debt at cost. Purchased debt for which a valuation allowance has not been recorded are subsequently recorded net of amortization under the interest method or the cost recovery method as discussed previously in Note 2. If a valuation allowance is required for a level yield pool, the Company records that portion of the total purchased debt balance by discounting the future cash flows generated by its proprietary forecasting model using the IRR as a discount rate. Valuation allowances for cost recovery pools are determined using the Company's proprietary forecasting model cash flows, which are undiscounted.
13
Estimated Fair Value
The following tables display the carrying value and estimated fair value of the Company's financial instruments held in accordance with ASC 820 as of the dates presented:
March 31, 2015 | ||||||||||||||||||||
Carrying amounts | Estimated fair value | Level 1 | Level 2 | Level 3 | ||||||||||||||||
Purchased debt(1) | $ | 200,506 | $ | 526,662 | $ | — | $ | — | $ | 526,662 | ||||||||||
Line of credit(2) | 148,333 | 148,333 | — | 148,333 | — | |||||||||||||||
Senior Second Lien Notes, net of $1,452 unamortized discount(3) | 288,548 | 266,575 | 266,575 | — | — | |||||||||||||||
Other Notes Payable(4) | 832 | 832 | — | 832 | — | |||||||||||||||
December 31, 2014 | ||||||||||||||||||||
Carrying amounts | Estimated fair value | Level 1 | Level 2 | Level 3 | ||||||||||||||||
Purchased debt(1) | $ | 222,700 | $ | 563,674 | $ | — | $ | — | $ | 563,674 | ||||||||||
Line of credit(2) | 138,702 | 138,702 | — | 138,702 | — | |||||||||||||||
Senior Second Lien Notes, net of $1,631 unamortized discount(3) | 288,369 | 288,157 | 288,157 | — | — | |||||||||||||||
Other Notes Payable(4) | 1,001 | 1,001 | — | 1,001 | — | |||||||||||||||
(1) The Company's estimated fair value of purchased debt has been determined using our consolidated ERP discounted using a rate that approximates our weighted average cost of capital. Our ERP expectations are based on historical data as well as assumptions about future collection rates and customer behavior. The estimated fair value of purchased debt should not be construed to represent the underlying value of the Company.
(2) The Company has both a domestic and Canadian revolving credit facility. These instruments contain variable borrowing rates that are based in part on observed available market interest rates. As a result, the Company believes the carrying values of these instruments approximate fair value.
(3) The fair value of our Senior Second Lien Notes is based on observed available market trading metrics as of the dates presented.
(4) We estimated the fair value of these notes to approximate carrying value, as the applicable interest rates of the notes approximate those of our other current borrowings, which are based in part on observable market rates.
The carrying values of cash and cash equivalents, accounts receivable and payable, accrued expenses, and notes receivable are considered to approximate fair value due to the short-term nature of these instruments.
8. Income Taxes
For financial statement reporting purposes, the Company is treated as a stand-alone entity, and therefore all components of the provision for, or benefit from income taxes as well as the deferred tax assets and liabilities recognized herein reflect only the financial results and position of SquareTwo. For income tax purposes, the Company is included in the consolidated return of Parent. Parent files income tax returns in the U.S. federal jurisdiction, and various state and foreign jurisdictions. Parent's U.S. federal income tax returns were last examined for the tax year ended December 31, 2004, and Parent potentially remains subject to examination for all tax years ended on or after December 31, 2010.
For the three months ended March 31, 2015 the combined state, federal and Canadian tax expense from operations was $1.2 million and was comprised of foreign taxes on Canadian operations based on an effective tax rate of approximately 26.5% and deferred expense of $0.1 million related to Canadian withholding tax recognized in connection with Internal Revenue Code (“IRC”) Section 956 income from Canadian operations. Any tax benefits related to pretax losses generated by the Company’s ongoing U.S. operations during 2015 have been fully offset by a corresponding increase in the valuation allowance as the Company remains in full valuation allowance position at March 31, 2015.
While virtually all IRC Section 956 income generated in the U.S. during 2015 can be offset by the Company’s net operating losses in the U.S., the $0.1 million expense relates specifically to withholding taxes on the amount of the deemed distribution under IRC Section 956, which would be payable in Canada upon an actual distribution in the future. Therefore, to the extent the amount of Canadian earnings and profits deemed distributed is not actually repatriated to the U.S., the withholding tax will not be paid.
14
9. Commitments and Contingencies
Litigation
From time to time the Company is a defendant in ordinary routine litigation alleging violations of applicable state and federal laws by the Company or the branch offices acting on its behalf that is incidental to our business. These suits may include actions which may purport to be on behalf of a class of consumers. While the litigation and regulatory environment is challenging and continually changing, for the Company, our branch offices and our industry, in our opinion, such matters will not individually, or in the aggregate, result in a materially adverse effect on the Company's financial position, results of operations or cash flows. Management believes the range of reasonably possible loss for outstanding claims beyond those previously accrued is between zero and $1.5 million. The Company accrues for loss contingencies as they become probable and estimable.
10. Segment Information
In its operation of the business, the chief operating decision maker ("CODM"), our Chief Executive Officer, reviews certain financial information, including segment statements of profitability prepared on a basis not consistent with GAAP. The segment information within this note is reported on that basis. The CODM evaluates this information in deciding how to allocate resources and in assessing performance. The Company has two reportable operating segments: Canada operations and Domestic operations, which have been determined based on the way our Board of Directors, the CODM, and our Senior Leadership Team review the Company's strategy and performance.
The accounting policies of our two segments are the same as those described in the summary of significant accounting policies in Note 2. Canadian purchases made on or after January 1, 2012 are being accounted for under the level yield method unless we are unable to reasonably forecast the timing and amount of cash proceeds. Purchases eligible for the level yield method are accumulated into static pools on a quarterly basis separately from U.S. purchases.
The following tables present the Company's operating segment results for the periods presented:
Cash Proceeds on Purchased Debt:
Three Months Ended March 31, | ||||||||
Cash Proceeds on Purchased Debt | 2015 | 2014 | ||||||
Domestic | $ | 83,262 | $ | 101,986 | ||||
Canada | 11,211 | 10,254 | ||||||
Consolidated | $ | 94,473 | $ | 112,240 | ||||
Total Revenues:
Three Months Ended March 31, | ||||||||
Total Revenues | 2015 | 2014 | ||||||
Domestic | $ | 45,837 | $ | 65,359 | ||||
Canada | 6,572 | 6,150 | ||||||
Consolidated | $ | 52,409 | $ | 71,509 | ||||
Adjusted EBITDA:
Three Months Ended March 31, | ||||||||
Adjusted EBITDA(1) | 2015 | 2014 | ||||||
Domestic | $ | 33,291 | $ | 46,771 | ||||
Canada | 8,393 | 7,421 | ||||||
Consolidated | $ | 41,684 | $ | 54,192 | ||||
(1) Segment Adjusted EBITDA is calculated consistently with the methodology used to report the Company's consolidated Adjusted EBITDA, except with regard to the costs of certain overhead items that may benefit both operating segments. The costs of these overhead items are included in the calculation of Domestic Adjusted EBITDA, but have not been allocated to Canada. This treatment of certain overhead costs is consistent with CODM review.
15
Segment net income or loss is not presented herein, which is consistent with the CODM's review of segment information. The table below reconciles consolidated net loss to consolidated Adjusted EBITDA for the periods presented:
Reconciliation of Net loss to Adjusted EBITDA ($ in thousands) | Three Months Ended March 31, | |||||||
2015 | 2014 | |||||||
Net loss | $ | (15,388 | ) | $ | (2,146 | ) | ||
Interest expense | 11,088 | 11,009 | ||||||
Interest income | (41 | ) | (19 | ) | ||||
Income tax expense | 1,160 | 1,037 | ||||||
Depreciation and amortization | 1,756 | 1,642 | ||||||
EBITDA | (1,425 | ) | 11,523 | |||||
Adjustments related to purchased debt accounting | ||||||||
Proceeds applied to purchased debt principal(1) | 45,254 | 42,267 | ||||||
Purchased debt valuation allowance reversals(2) | (2,419 | ) | (205 | ) | ||||
Certain other or non-cash expenses | ||||||||
Stock option expense(3) | 11 | 24 | ||||||
Other(4) | 263 | 583 | ||||||
Adjusted EBITDA | $ | 41,684 | $ | 54,192 | ||||
(1) Cash proceeds applied to purchased debt principal rather than recorded as revenue.
(2) Represents non-cash valuation allowance reversals on purchased debt.
(3) Represents the non-cash expense related to option grants of Parent’s equity granted to certain employees, directors and branch office owners.
(4) Consistent with the covenant calculations within our revolving credit facility, other includes, as applicable, branch office note reserves, lease breakup costs, certain consulting fees, management fees paid to KRG, certain transaction expenses, recruiting expense, severance expense, and certain non-recurring items.
The table below reconciles net cash used in operating activities to Adjusted EBITDA for the periods presented:
Reconciliation of Net Cash Used in Operating Activities to Adjusted EBITDA ($ in thousands) | Three Months Ended March 31, | |||||||
2015 | 2014 | |||||||
Net cash used in operating activities | $ | (27,810 | ) | $ | (14,377 | ) | ||
Proceeds applied to purchased debt principal(1) | 45,254 | 42,267 | ||||||
Interest expense to be paid in cash(2) | 10,262 | 10,277 | ||||||
Interest income | (41 | ) | (19 | ) | ||||
Amortization of prepaid and other non-cash expenses | (1,477 | ) | (919 | ) | ||||
Changes in operating assets and liabilities and deferred taxes: | ||||||||
Restricted cash(3) | 17,568 | 19,024 | ||||||
Other operating assets and liabilities and deferred taxes(4) | (3,495 | ) | (3,681 | ) | ||||
Income tax expense | 1,160 | 1,037 | ||||||
Other(5) | 263 | 583 | ||||||
Adjusted EBITDA | $ | 41,684 | $ | 54,192 | ||||
(1) Cash proceeds applied to purchased debt principal are shown in the investing activities section of the condensed consolidated statements of cash flows.
(2) Represents interest expense, excluding non-cash amortization of loan origination fees and debt discount.
(3) Represents the change in restricted cash balances for the period due to the timing of payments on our line of credit and semi-annual interest payments on our Senior Second Lien Notes.
(4) The amount represents timing differences due to the recognition of certain expenses and revenue items on a cash versus accrual basis.
16
(5) Consistent with the covenant calculations within our revolving credit facility, other includes, as applicable, branch office note reserves, lease breakup costs, certain consulting fees, management fees paid to KRG, certain transaction expenses, recruiting expense, severance expense, and certain non-recurring items.
Segment assets were as follows as of the dates presented:
Total Assets | March 31, 2015 | December 31, 2014 | ||||||
Domestic | $ | 411,574 | $ | 414,711 | ||||
Canada | 33,405 | 33,376 | ||||||
Consolidated | $ | 444,979 | $ | 448,087 | ||||
Long-lived assets, excluding financial instruments and deferred taxes, of our Canada segment were not material at March 31, 2015 or December 31, 2014.
11. Supplemental Guarantor Information
The payment obligations under the Senior Second Lien Notes (see Note 5) are fully and unconditionally guaranteed, jointly and severally, on a senior secured basis by substantially all of SquareTwo Financial Corporation’s (the “Borrower”) 100% owned existing and future domestic subsidiaries (“Guarantor Subsidiaries”). The Senior Second Lien Notes are not guaranteed by Parent.
The consolidating financial information presented below reflects information regarding the Borrower, the issuer of the Senior Second Lien Notes, the Guarantor Subsidiaries, and all other subsidiaries of the Borrower (“Non-Guarantor Subsidiaries”). This basis of presentation is not intended to present the financial condition, results of operations or cash flows of the Company, the Borrower, the Guarantor Subsidiaries or the Non-Guarantor Subsidiaries for any purpose other than to comply with the specific requirements for subsidiary guarantor reporting. The consolidating information is prepared in accordance with the same accounting policies as are applied to the Company’s condensed consolidated financial statements except for accounting for income taxes of the Guarantor Subsidiaries, which is reflected entirely in the Borrower’s financial statements as all material Guarantor Subsidiaries are disregarded entities for tax purposes and are combined with the Borrower in the consolidated income tax return of Parent.
The presentation of the Borrower’s financial statements represents the equity method of accounting for the Guarantor and Non-Guarantor Subsidiaries. The results of operations of the Guarantor and Non-Guarantor Subsidiaries reflect certain expense allocations from the Borrower, which are made in relation to the intercompany balances and the intercompany usage of the Borrower’s assets.
17
Condensed Consolidating Balance Sheets
March 31, 2015 | ||||||||||||||||||||
Borrower | Guarantor Subsidiaries | Non-Guarantor Subsidiaries | Eliminations | Total | ||||||||||||||||
Assets | ||||||||||||||||||||
Cash and cash equivalents | $ | — | $ | — | $ | 17,566 | $ | — | $ | 17,566 | ||||||||||
Restricted cash | 16,594 | 5,111 | — | — | 21,705 | |||||||||||||||
Trade receivables, net of allowance for doubtful accounts | 1,293 | 34 | 1,071 | — | 2,398 | |||||||||||||||
Notes receivable | — | — | 178 | — | 178 | |||||||||||||||
Purchased debt, net | — | 186,568 | 13,938 | — | 200,506 | |||||||||||||||
Property and equipment, net | 22,042 | 212 | 130 | — | 22,384 | |||||||||||||||
Goodwill and intangible assets | 170,780 | — | 505 | — | 171,285 | |||||||||||||||
Other assets | 6,787 | 1,378 | 792 | — | 8,957 | |||||||||||||||
Investment in subsidiaries | 225,802 | — | — | (225,802 | ) | — | ||||||||||||||
Total assets | $ | 443,298 | $ | 193,303 | $ | 34,180 | $ | (225,802 | ) | $ | 444,979 | |||||||||
Liabilities and equity (deficiency) | ||||||||||||||||||||
Liabilities: | ||||||||||||||||||||
Accounts payable, trade | $ | 2,623 | $ | (190 | ) | $ | — | $ | — | $ | 2,433 | |||||||||
Payable from trust accounts | 1,585 | 57 | 98 | — | 1,740 | |||||||||||||||
Payable to Borrower | — | 334,399 | 3,276 | (337,675 | ) | — | ||||||||||||||
Taxes payable | 142 | — | 139 | — | 281 | |||||||||||||||
Accrued interest and other liabilities | 29,285 | 670 | 889 | — | 30,844 | |||||||||||||||
Deferred tax liability (asset), net | 11,529 | — | (8 | ) | — | 11,521 | ||||||||||||||
Line of credit | 148,333 | — | — | — | 148,333 | |||||||||||||||
Notes payable, net of discount | 289,380 | — | — | — | 289,380 | |||||||||||||||
Obligations under capital lease agreements | 1,817 | — | — | — | 1,817 | |||||||||||||||
Total liabilities | 484,694 | 334,936 | 4,394 | (337,675 | ) | 486,349 | ||||||||||||||
Equity (deficiency): | ||||||||||||||||||||
Common stock | — | — | — | — | — | |||||||||||||||
Additional paid-in capital | 190,202 | 4,145 | 1 | (4,146 | ) | 190,202 | ||||||||||||||
(Accumulated deficit) retained earnings | (231,598 | ) | (145,778 | ) | 29,759 | 116,019 | (231,598 | ) | ||||||||||||
Accumulated other comprehensive loss | — | — | (6,323 | ) | — | (6,323 | ) | |||||||||||||
Total (deficiency) equity before noncontrolling interest | (41,396 | ) | (141,633 | ) | 23,437 | 111,873 | (47,719 | ) | ||||||||||||
Noncontrolling interest | — | — | 6,349 | — | 6,349 | |||||||||||||||
Total (deficiency) equity | (41,396 | ) | (141,633 | ) | 29,786 | 111,873 | (41,370 | ) | ||||||||||||
Total liabilities and (deficiency) equity | $ | 443,298 | $ | 193,303 | $ | 34,180 | $ | (225,802 | ) | $ | 444,979 | |||||||||
18
December 31, 2014 | ||||||||||||||||||||
Borrower | Guarantor Subsidiaries | Non-Guarantor Subsidiaries | Eliminations | Total | ||||||||||||||||
Assets | ||||||||||||||||||||
Cash and cash equivalents | $ | — | $ | — | $ | 15,677 | $ | — | $ | 15,677 | ||||||||||
Restricted cash | (360 | ) | 4,497 | — | — | 4,137 | ||||||||||||||
Trade receivables, net of allowance for doubtful accounts | 1,221 | 22 | 608 | — | 1,851 | |||||||||||||||
Notes receivable | — | — | 194 | — | 194 | |||||||||||||||
Purchased debt, net | — | 206,542 | 16,158 | — | 222,700 | |||||||||||||||
Property and equipment, net | 22,783 | 254 | 152 | — | 23,189 | |||||||||||||||
Goodwill and intangible assets | 170,779 | — | 569 | — | 171,348 | |||||||||||||||
Other assets | 6,614 | 1,571 | 806 | — | 8,991 | |||||||||||||||
Investment in subsidiaries | 243,404 | — | — | (243,404 | ) | — | ||||||||||||||
Total assets | $ | 444,441 | $ | 212,886 | $ | 34,164 | $ | (243,404 | ) | $ | 448,087 | |||||||||
Liabilities and equity (deficiency) | ||||||||||||||||||||
Liabilities: | ||||||||||||||||||||
Accounts payable, trade | $ | 3,549 | $ | (227 | ) | $ | (97 | ) | $ | — | $ | 3,225 | ||||||||
Payable from trust accounts | 1,252 | 58 | 94 | — | 1,404 | |||||||||||||||
Payable to Borrower | — | 342,772 | 2,842 | (345,614 | ) | — | ||||||||||||||
Taxes payable | 138 | — | 337 | — | 475 | |||||||||||||||
Accrued interest and other liabilities | 23,336 | 385 | 778 | — | 24,499 | |||||||||||||||
Deferred tax liability (asset) | 11,416 | — | (8 | ) | — | 11,408 | ||||||||||||||
Line of credit | 138,702 | — | — | — | 138,702 | |||||||||||||||
Notes payable, net of discount | 289,370 | — | — | — | 289,370 | |||||||||||||||
Obligations under capital lease agreements | 2,310 | — | — | — | 2,310 | |||||||||||||||
Total liabilities | 470,073 | 342,988 | 3,946 | (345,614 | ) | 471,393 | ||||||||||||||
Equity (deficiency): | ||||||||||||||||||||
Common stock | — | — | — | — | — | |||||||||||||||
Additional paid-in capital | 190,191 | 2,922 | 1 | (2,923 | ) | 190,191 | ||||||||||||||
(Accumulated deficit) retained earnings | (215,823 | ) | (133,024 | ) | 27,891 | 105,133 | (215,823 | ) | ||||||||||||
Accumulated other comprehensive loss | — | — | (3,636 | ) | — | (3,636 | ) | |||||||||||||
Total (deficiency) equity before noncontrolling interest | (25,632 | ) | (130,102 | ) | 24,256 | 102,210 | (29,268 | ) | ||||||||||||
Noncontrolling interest | — | — | 5,962 | — | 5,962 | |||||||||||||||
Total (deficiency) equity | (25,632 | ) | (130,102 | ) | 30,218 | 102,210 | (23,306 | ) | ||||||||||||
Total liabilities and (deficiency) equity | $ | 444,441 | $ | 212,886 | $ | 34,164 | $ | (243,404 | ) | $ | 448,087 | |||||||||
19
Condensed Consolidating Statements of Operations
Three Months Ended March 31, 2015 | ||||||||||||||||||||
Borrower | Guarantor Subsidiaries | Non-Guarantor Subsidiaries | Eliminations | Total | ||||||||||||||||
Revenues | ||||||||||||||||||||
Purchased debt revenue, net | $ | 1,069 | $ | 44,765 | $ | 6,569 | $ | — | $ | 52,403 | ||||||||||
Other revenue | 3 | — | 3 | — | 6 | |||||||||||||||
Total revenues | 1,072 | 44,765 | 6,572 | — | 52,409 | |||||||||||||||
Expenses | ||||||||||||||||||||
Purchased debt expense | 1 | 32,092 | 2,386 | — | 34,479 | |||||||||||||||
Court costs, net | — | 7,179 | 82 | — | 7,261 | |||||||||||||||
Salaries and payroll taxes | 1,580 | 6,884 | 198 | — | 8,662 | |||||||||||||||
General and administrative | 802 | 1,852 | 653 | — | 3,307 | |||||||||||||||
Depreciation and amortization | 660 | 1,087 | 9 | — | 1,756 | |||||||||||||||
Total operating expenses | 3,043 | 49,094 | 3,328 | — | 55,465 | |||||||||||||||
Operating (loss) income | (1,971 | ) | (4,329 | ) | 3,244 | — | (3,056 | ) | ||||||||||||
Other expenses | ||||||||||||||||||||
Interest expense | 2,663 | 8,425 | — | — | 11,088 | |||||||||||||||
Other expense (income) | 123 | — | (39 | ) | — | 84 | ||||||||||||||
Total other expenses | 2,786 | 8,425 | (39 | ) | — | 11,172 | ||||||||||||||
(Loss) income before income taxes | (4,757 | ) | (12,754 | ) | 3,283 | — | (14,228 | ) | ||||||||||||
Income tax expense | (132 | ) | — | (1,028 | ) | — | (1,160 | ) | ||||||||||||
Loss from subsidiaries | (10,886 | ) | — | — | 10,886 | — | ||||||||||||||
Net (loss) income | (15,775 | ) | (12,754 | ) | 2,255 | 10,886 | (15,388 | ) | ||||||||||||
Less: Net income attributable to the noncontrolling interest | — | — | 387 | — | 387 | |||||||||||||||
Net (loss) income attributable to SquareTwo | $ | (15,775 | ) | $ | (12,754 | ) | $ | 1,868 | $ | 10,886 | $ | (15,775 | ) | |||||||
20
Three Months Ended March 31, 2014 | ||||||||||||||||||||
Borrower | Guarantor Subsidiaries | Non-Guarantor Subsidiaries | Eliminations | Total | ||||||||||||||||
Revenues | ||||||||||||||||||||
Purchased debt revenue, net | $ | 1,766 | $ | 63,583 | $ | 6,141 | $ | — | $ | 71,490 | ||||||||||
Other revenue | 6 | 4 | 9 | — | 19 | |||||||||||||||
Total revenues | 1,772 | 63,587 | 6,150 | — | 71,509 | |||||||||||||||
Expenses | ||||||||||||||||||||
Purchased debt expense | 2 | 36,629 | 2,447 | — | 39,078 | |||||||||||||||
Court costs, net | — | 9,115 | 68 | — | 9,183 | |||||||||||||||
Salaries and payroll taxes | 1,321 | 6,045 | 191 | — | 7,557 | |||||||||||||||
General and administrative | 541 | 2,656 | 846 | — | 4,043 | |||||||||||||||
Depreciation and amortization | 556 | 1,075 | 11 | — | 1,642 | |||||||||||||||
Total operating expenses | 2,420 | 55,520 | 3,563 | — | 61,503 | |||||||||||||||
Operating (loss) income | (648 | ) | 8,067 | 2,587 | — | 10,006 | ||||||||||||||
Other expenses | ||||||||||||||||||||
Interest expense | 1,305 | 9,704 | — | — | 11,009 | |||||||||||||||
Other expense (income) | 128 | — | (22 | ) | — | 106 | ||||||||||||||
Total other expenses | 1,433 | 9,704 | (22 | ) | — | 11,115 | ||||||||||||||
(Loss) income before income taxes | (2,081 | ) | (1,637 | ) | 2,609 | — | (1,109 | ) | ||||||||||||
Income tax expense | (143 | ) | — | (894 | ) | — | (1,037 | ) | ||||||||||||
Loss from subsidiaries | (263 | ) | — | — | 263 | — | ||||||||||||||
Net (loss) income | (2,487 | ) | (1,637 | ) | 1,715 | 263 | (2,146 | ) | ||||||||||||
Less: Net income attributable to the noncontrolling interest | — | — | 341 | — | 341 | |||||||||||||||
Net (loss) income attributable to SquareTwo | $ | (2,487 | ) | $ | (1,637 | ) | $ | 1,374 | $ | 263 | $ | (2,487 | ) | |||||||
21
Condensed Consolidating Statements of Comprehensive (Loss) Income
Three Months Ended March 31, 2015 | ||||||||||||||||||||
Borrower | Guarantor Subsidiaries | Non-Guarantor Subsidiaries | Eliminations | Total | ||||||||||||||||
Net (loss) income | $ | (15,775 | ) | $ | (12,754 | ) | $ | 2,255 | $ | 10,886 | $ | (15,388 | ) | |||||||
Other comprehensive loss, net of tax: | ||||||||||||||||||||
Currency translation adjustment | — | — | (2,687 | ) | — | (2,687 | ) | |||||||||||||
Comprehensive loss | (15,775 | ) | (12,754 | ) | (432 | ) | 10,886 | (18,075 | ) | |||||||||||
Less: Comprehensive income attributable to the noncontrolling interest | — | — | 387 | — | 387 | |||||||||||||||
Comprehensive loss attributable to SquareTwo | $ | (15,775 | ) | $ | (12,754 | ) | $ | (819 | ) | $ | 10,886 | $ | (18,462 | ) | ||||||
22
Three Months Ended March 31, 2014 | ||||||||||||||||||||
Borrower | Guarantor Subsidiaries | Non-Guarantor Subsidiaries | Eliminations | Total | ||||||||||||||||
Net (loss) income | $ | (2,487 | ) | $ | (1,637 | ) | $ | 1,715 | $ | 263 | $ | (2,146 | ) | |||||||
Other comprehensive loss, net of tax: | ||||||||||||||||||||
Currency translation adjustment | — | — | (834 | ) | — | (834 | ) | |||||||||||||
Comprehensive (loss) income | (2,487 | ) | (1,637 | ) | 881 | 263 | (2,980 | ) | ||||||||||||
Less: Comprehensive income attributable to the noncontrolling interest | — | — | 341 | — | 341 | |||||||||||||||
Comprehensive (loss) income attributable to SquareTwo | $ | (2,487 | ) | $ | (1,637 | ) | $ | 540 | $ | 263 | $ | (3,321 | ) | |||||||
23
Condensed Consolidating Statements of Cash Flows
Three Months Ended March 31, 2015 | ||||||||||||||||||||
Borrower | Guarantor Subsidiaries | Non-Guarantor Subsidiaries | Eliminations | Total | ||||||||||||||||
Operating activities | ||||||||||||||||||||
Net (loss) income | $ | (15,775 | ) | $ | (12,754 | ) | $ | 2,255 | $ | 10,886 | $ | (15,388 | ) | |||||||
Adjustments to reconcile net (loss) income to net cash (used in) provided by operating activities: | ||||||||||||||||||||
Depreciation and amortization | 660 | 1,087 | 9 | — | 1,756 | |||||||||||||||
Amortization of loan origination fees and debt discount | 826 | — | — | — | 826 | |||||||||||||||
Purchased debt valuation allowance reversals | — | (2,419 | ) | — | — | (2,419 | ) | |||||||||||||
Stock option expense | 11 | — | — | — | 11 | |||||||||||||||
Amortization of prepaid and other non-cash expenses | 2,885 | (1,423 | ) | 15 | — | 1,477 | ||||||||||||||
Deferred tax provision, net of valuation allowance | 113 | — | — | — | 113 | |||||||||||||||
Loss from subsidiaries | 10,886 | — | — | (10,886 | ) | — | ||||||||||||||
Changes in operating assets and liabilities: | ||||||||||||||||||||
Income tax payable/receivable | 4 | — | (181 | ) | — | (177 | ) | |||||||||||||
Restricted cash | (16,954 | ) | (614 | ) | — | — | (17,568 | ) | ||||||||||||
Other assets | (3,783 | ) | 1,170 | (81 | ) | — | (2,694 | ) | ||||||||||||
Accounts payable and accrued liabilities | 5,356 | 580 | 317 | — | 6,253 | |||||||||||||||
Net cash (used in) provided by operating activities | (15,771 | ) | (14,373 | ) | 2,334 | — | (27,810 | ) | ||||||||||||
Investing activities | ||||||||||||||||||||
Investment in purchased debt | — | (18,259 | ) | (3,743 | ) | — | (22,002 | ) | ||||||||||||
Proceeds applied to purchased debt principal | — | 40,652 | 4,602 | — | 45,254 | |||||||||||||||
Payments to branch offices related to asset purchase program | — | (259 | ) | — | (259 | ) | ||||||||||||||
Investment in subsidiaries | 7,782 | — | — | (7,782 | ) | — | ||||||||||||||
Investment in property and equipment, including internally developed software | (979 | ) | 21 | — | — | (958 | ) | |||||||||||||
Net cash provided by investing activities | 6,803 | 22,155 | 859 | (7,782 | ) | 22,035 | ||||||||||||||
Financing activities | ||||||||||||||||||||
Repayments of investment by Parent, net | — | (7,782 | ) | — | 7,782 | — | ||||||||||||||
Payments on notes payable | (170 | ) | — | — | — | (170 | ) | |||||||||||||
Proceeds from line of credit | 102,192 | — | — | — | 102,192 | |||||||||||||||
Payments on line of credit | (92,561 | ) | — | — | — | (92,561 | ) | |||||||||||||
Payments on capital lease obligations | (493 | ) | — | — | — | (493 | ) | |||||||||||||
Net cash provided by (used in) financing activities | 8,968 | (7,782 | ) | — | 7,782 | 8,968 | ||||||||||||||
Increase in cash and cash equivalents | — | — | 3,193 | — | 3,193 | |||||||||||||||
Impact of foreign currency translation on cash | — | — | (1,304 | ) | — | (1,304 | ) | |||||||||||||
Cash and cash equivalents at beginning of period | — | — | 15,677 | — | 15,677 | |||||||||||||||
Cash and cash equivalents at end of period | $ | — | $ | — | $ | 17,566 | $ | — | $ | 17,566 | ||||||||||
Supplemental cash flow information | ||||||||||||||||||||
Cash paid for interest | $ | 1,795 | $ | — | $ | — | $ | — | $ | 1,795 | ||||||||||
Cash paid for income taxes | 16 | — | 1,205 | — | 1,221 | |||||||||||||||
Property and equipment financed with capital leases and notes payable | — | — | — | — | — | |||||||||||||||
24
Three Months Ended March 31, 2014 | ||||||||||||||||||||
Borrower | Guarantor Subsidiaries | Non-Guarantor Subsidiaries | Eliminations | Total | ||||||||||||||||
Operating activities | ||||||||||||||||||||
Net (loss) income | $ | (2,487 | ) | $ | (1,637 | ) | $ | 1,715 | $ | 263 | $ | (2,146 | ) | |||||||
Adjustments to reconcile net (loss) income to net cash (used in) provided by operating activities: | ||||||||||||||||||||
Depreciation and amortization | 556 | 1,075 | 11 | — | 1,642 | |||||||||||||||
Amortization of loan origination fees and debt discount | 732 | — | — | — | 732 | |||||||||||||||
Purchased debt valuation allowance reversals | — | (205 | ) | — | — | (205 | ) | |||||||||||||
Stock option expense | 16 | 8 | — | — | 24 | |||||||||||||||
Amortization of prepaid and other non-cash expenses | 750 | 166 | 3 | — | 919 | |||||||||||||||
Loss from subsidiaries | 263 | — | — | (263 | ) | — | ||||||||||||||
Changes in operating assets and liabilities: | ||||||||||||||||||||
Income tax payable/receivable | 19 | — | 66 | — | 85 | |||||||||||||||
Restricted cash | (16,549 | ) | (2,475 | ) | — | — | (19,024 | ) | ||||||||||||
Other assets | (1,672 | ) | (1,002 | ) | 555 | — | (2,119 | ) | ||||||||||||
Accounts payable and accrued liabilities | 5,567 | 23 | 125 | — | 5,715 | |||||||||||||||
Net cash (used in) provided by operating activities | (12,805 | ) | (4,047 | ) | 2,475 | — | (14,377 | ) | ||||||||||||
Investing activities | ||||||||||||||||||||
Investment in purchased debt | — | (22,790 | ) | (2,974 | ) | — | (25,764 | ) | ||||||||||||
Proceeds applied to purchased debt principal | — | 38,189 | 4,078 | — | 42,267 | |||||||||||||||
Investment in subsidiaries | 11,336 | — | — | (11,336 | ) | — | ||||||||||||||
Investment in property and equipment including internally developed software | (1,066 | ) | (16 | ) | — | — | (1,082 | ) | ||||||||||||
Net cash provided by investing activities | 10,270 | 15,383 | 1,104 | (11,336 | ) | 15,421 | ||||||||||||||
Financing activities | ||||||||||||||||||||
Repayments of investment by Parent, net | (150 | ) | (11,336 | ) | — | 11,336 | (150 | ) | ||||||||||||
Payments on notes payable | (187 | ) | — | — | — | (187 | ) | |||||||||||||
Proceeds from line of credit | 117,758 | — | — | — | 117,758 | |||||||||||||||
Payments on line of credit | (114,476 | ) | — | — | — | (114,476 | ) | |||||||||||||
Origination fees on line of credit | (33 | ) | — | — | — | (33 | ) | |||||||||||||
Payments on capital lease obligations | (377 | ) | — | — | — | (377 | ) | |||||||||||||
Net cash provided by (used in) financing activities | 2,535 | (11,336 | ) | — | 11,336 | 2,535 | ||||||||||||||
Increase in cash and cash equivalents | — | — | 3,579 | — | 3,579 | |||||||||||||||
Impact of foreign currency translation on cash | — | — | (302 | ) | — | (302 | ) | |||||||||||||
Cash and cash equivalents at beginning of period | — | — | 9,379 | — | 9,379 | |||||||||||||||
Cash and cash equivalents at end of period | $ | — | $ | — | $ | 12,656 | $ | — | $ | 12,656 | ||||||||||
Supplemental cash flow information | ||||||||||||||||||||
Cash paid for interest | $ | 1,784 | $ | — | $ | — | $ | — | $ | 1,784 | ||||||||||
Cash paid for income tax | 125 | — | 832 | — | 957 | |||||||||||||||
Property and equipment financed with capital leases and notes payable | 406 | — | — | — | 406 | |||||||||||||||
25
12. Subsequent Events
Subsequent to March 31, 2015, the Company entered into business agreements with its branch offices that, effective June 2015, will replace the existing contractual arrangements that were subject to franchise law. The new agreements preserve and maintain the exclusive relationship between SquareTwo and its branch offices while removing the restrictions imposed by state laws governing franchise relationships. Similar to the prior agreements, the new agreements do not specify the compensation arrangements for the branch offices. The recovery fees SquareTwo pays its branch offices remain subject to change by SquareTwo at its discretion. The new agreements further define the relationship, roles and responsibilities of the parties. The agreements have a three year term. Under the terms of the agreements, SquareTwo will require use of its proprietary collection and account management software, however SquareTwo will no longer charge royalty fees as a percentage of each dollar collected. In lieu of a royalty fee, SquareTwo will decrease the amount of fees it pays the branch offices for each dollar collected in order to equalize the net economics of the royalty impacts to the branch offices and the Company.
26
Item 2. Management's Discussion and Analysis of Financial Condition and Results of Operations.
Some of the information in this Quarterly Report on Form 10-Q includes “forward-looking statements” within the meaning of Section 27A of the Securities Act of 1933, as amended, and Section 21E of the Securities Exchange Act of 1934, as amended. All statements other than statements of historical facts included in this Quarterly Report on Form 10-Q, including, without limitation, certain statements under “Management’s Discussion and Analysis of Financial Condition and Results of Operations,” may constitute forward-looking statements. In some cases you can identify these “forward-looking statements” by words like “may,” "will," “should,” “expect,” “intend,” “estimate,” “anticipate,” "plan," "foresee," “predict,” “believe,” “potential” or “continue” or, in each case, the negative or other variations or similar expressions. All forward-looking statements reflect our current beliefs and assumptions with respect to our future results, business plans and prospects, and are based on information currently available to us. Accordingly, these statements are subject to significant risks and uncertainties and our actual results, business plans and prospects could differ significantly from those expressed in, or implied by, these statements. Factors that could cause or contribute to such differences include, but are not limited to, those described under “Risk Factors” in our most recent Annual Report on Form 10-K (File No. 333- 170734). We undertake no obligation to update publicly or publicly revise any forward-looking statement, whether as a result of new information or otherwise.
Unless otherwise indicated, the terms (i) “SquareTwo,” “we,” “our,” “us” and the “Company” refer to SquareTwo Financial Corporation and all of its restricted subsidiaries on a consolidated basis, (ii) “SquareTwo Financial Corporation” refers to SquareTwo Financial Corporation and not to its parent company or any of its subsidiaries, and (iii) “Parent” refers to CA Holding, Inc. and not to any of its subsidiaries. You should read this discussion and analysis in conjunction with the condensed consolidated financial statements and notes that appear elsewhere in this Quarterly Report on Form 10-Q. Our financial information may not be indicative of our future performance and does not necessarily reflect what our financial condition and results of operations would have been had we operated as an independent, stand-alone entity during all periods presented.
Our Company
We are a leading purchaser of charged-off consumer and commercial receivables in the accounts receivable management industry. Our primary business is the acquisition, management and collection of charged-off consumer and commercial accounts receivable that we purchase from financial institutions, finance and leasing companies, and other issuers in the United States (U.S.) and Canada. We believe that we are one of the largest purchasers of "fresh" charged-off credit card and consumer loan receivables in the U.S. The act of charging off an account is an action required by banking regulations and is an accounting action that does not release the obligor on the account from his/her responsibility to pay amounts due on the account. Because the credit issuer was unable to collect the charged-off receivables that we purchase, we are able to acquire these portfolios at a substantial discount to their face value.
Our focus throughout the recovery process is on the customer, and helping the customer resolve their outstanding financial commitments, while ensuring that those customers who demonstrate a significant ability to pay their contractual obligations actually satisfy their obligations. In accordance with our commitment to customer service and respect, which we have labeled the “Fair Square Promise”, we are dedicated to treating customers fairly and ethically and maintaining stringent compliance standards, which we believe allows us to liquidate more effectively.
Pursuant to the Fair Square Promise, our business model leverages our analytic expertise, technology platform, and in the U.S., a unique combination of company-owned call centers operating under the d/b/a name Fresh View Solutions (“Fresh View”) along with a network of regional law offices, also referred to as "branch offices", exclusively dedicated to SquareTwo. We refer to this network of branch offices and company-owned call centers as the “Closed Loop Network” because all newly acquired customer accounts are managed within this network through our centralized, proprietary technology platform called eAGLE, regardless of where an account is in its lifecycle. This Closed Loop Network along with its integrated account management system allows us to achieve the highest level of information security and data accuracy, as well as provide a uniform customer experience during every stage of collections regardless of location. We also utilize non-exclusive law firms to liquidate legacy customer commitments, for collections on accounts where legal judgments and payment plans had been established prior to the formation of our Closed Loop Network. Lastly, in Canada, where we exclusively service our Canadian customers, we utilize a company-owned call center as well as third-party non-legal and legal collection firms.
From 1999, our first full year of purchasing debt, to March 31, 2015, we have invested approximately $2.6 billion in the acquisition of charged-off receivables, representing over $38.1 billion in face value of accounts.
The combination of our historical and future recovery efforts is expected to result in cumulative gross cash proceeds of approximately 2.1x our invested capital since our first purchase in 1998. Based on our proprietary analytical models, which
27
utilize historical and current account level data, as well as economic, pricing and collection trends, we expect that our U.S. owned charged-off receivables as of March 31, 2015 of $7.3 billion (active face value) will generate approximately $555.0 million in gross cash proceeds. We refer to this as estimated remaining proceeds ("ERP"). In addition, we expect our Canadian owned charged-off receivables of $1.2 billion (active face value) to generate approximately $57.0 million in additional ERP. Therefore, the total ERP for both our U.S. and Canadian owned charged-off receivables was $612.1 million as of March 31, 2015. These expectations are based on historical data as well as assumptions about future collection rates and consumer behavior. We cannot guarantee that we will achieve such proceeds.
Our U.S. Closed Loop Network
Recovery efforts on all newly acquired U.S. purchased debt are managed by the Closed Loop Network discussed in the preceding section. Historically, our branch offices were the primary channel for recovery work on our behalf. At the beginning of the fourth quarter of 2014, we significantly expanded our asset recovery options in the U.S by opening our second company-owned call center which is dedicated to consumer accounts. The majority of newly acquired accounts will be placed for collection with Fresh View as we continue to build out our company-owned call centers. Legal recovery operations will continue to progress as necessary through our dedicated legal channel.
The expansion of our collection capabilities through Fresh View enables us to satisfy a wide array of our bank clients’ needs while helping SquareTwo remain a leader in compliance. Regardless of where in our Closed Loop Network we place an account, either with Fresh View or with one of our branch offices, all customer account information and collection activity is managed within eAGLE, our proprietary integrated account management system, and in accordance with a standardized set of comprehensive policies and operational procedures, which we refer to as our “Compliance Management System.” This ensures that regardless of the chosen recovery option, we provide a uniform customer experience and a consistent approach to delivering the Fair Square Promise. In addition, our Closed Loop Network business model creates valuable operating efficiencies and synergies, which we believe will translate to improved financial performance in the future.
For accounts placed with our network of regional branch offices, the branch performs recovery work exclusively on our behalf and utilizes our account management system in accordance with specified contractual arrangements. As of March 31, 2015, our contractual agreements with the branch offices originally spanned three to seven years and had staggered maturities between 2015 and 2018. The contractual agreement provides the branch office with a license to use our proprietary collection software and obligates them to pay us a royalty fee for each dollar collected.
We are under no obligation to provide accounts to any branch office. We pay these offices a recovery fee, which varies based upon their performance against our return assumptions and is subject to adjustment based upon the performance against our operational and compliance standards. These include providing a positive customer experience within the context of the Fair Square Promise and our Compliance Management System, and conformance with legal and regulatory requirements. We have historically allocated accounts to our branch offices based on capacity, geographic coverage, and their performance against our return expectations and adherence to operational and compliance requirements.
Underwriting and Purchasing
The success of our business depends heavily on our ability to find charged-off receivables for purchase, evaluate these assets accurately and acquire them at the appropriate pricing. We have a dedicated Business Development team that generates portfolio acquisition opportunities in the markets in which we operate. Historically, we have purchased charged-off receivables from seven of the ten largest U.S. credit card issuers, as well as from super-regional and regional banks and other issuers of credit. Potential purchasing opportunities are reviewed in detail by our Decision Science department, which is responsible for preparing forecasted cash flows for each purchase based on our proprietary statistical models and our experience with similar purchases. These models and related assumptions are reviewed by our investment committee, which includes members of our senior leadership team and representatives from each key business function, to determine the appropriate purchase price for the available portfolios. We target purchases that meet return thresholds determined by our investment committee. In times of increased pricing in the market, we may accept a lower return, while still maintaining our yield-based purchasing strategy. In addition to the credit card and consumer loan business, we are actively engaged in the development of business opportunities in purchasing other forms of charged-off domestic and Canadian financial obligations.
28
Sources of Revenue and Expense
Sources of Revenue
Our primary sources of revenue are revenues recognized on our portfolio base of purchased debt assets which are driven by cash proceeds from non-legal collections, legal collections, court cost recoveries, sales, recourse and bankruptcy. In addition, we earn royalties from our branch offices ranging from 2% to 4% of each dollar collected in the non-legal channels for the use of our proprietary collection platform, eAGLE.
Expense
Purchased Debt Expense
Purchased debt expense represents direct and indirect costs of collections related to our purchased debt. In the U.S., the majority of our direct expenses represent the fees that we pay to our branch offices based on their collections on our U.S. purchased debt. The fee we pay to our branch offices varies depending on the age and type of purchased debt and certain network performance targets and other operational factors. Purchased debt expense in the U.S. also includes all costs related to our call centers, as well as legal compliance costs and certain other indirect operating and branch office costs. In Canada, purchased debt expense includes the cost of our collectors as well as fees paid to outside agencies with whom we place certain accounts.
Court Costs, Net
Court costs represent court costs and related fees on accounts placed for legal action. Court costs are expensed as incurred and are reduced by court cost recoveries for purchased debt accounted for under the cost recovery method. Court cost recoveries for purchased debt accounted for under the level yield method are included in level yield proceeds which drive purchased debt revenue, net. We estimate that we recover in excess of one-third of all court costs expended.
Costs to Collect
We refer to the costs related to the collection of purchased debt as our "costs to collect" which includes purchased debt expense and gross court costs. We evaluate our costs to collect, both including and excluding court costs, in relation to total collections rather than revenue due to the timing differences between revenue and expense recognition under U.S. generally accepted accounting principles ("GAAP").
Salaries and Payroll Taxes
Salaries and payroll taxes include all employment-related expenses, including salaries, wages, bonuses, insurance, payroll taxes and benefits, except those associated with our call centers which are included in Purchased Debt Expense
General and Administrative
General and administrative expenses consist of rent, utilities, marketing, information technology, property and other miscellaneous taxes, office, travel and entertainment, accounting and payroll services, consulting fees, licenses, and general insurance.
Depreciation and Amortization
We incur depreciation related to our property and equipment. We incur amortization on the value of our internally developed proprietary collection platform, eAGLE, which is used by our call centers and branch offices.
29
Results of Operations
We have two reportable operating segments, as defined by the Financial Accounting Standards Board's ("FASB") Accounting Standards Codification ("ASC") Topic 280, Segment Reporting: Domestic and Canada.
A reporting segment's operating results are regularly reviewed by the Company's Chief Operating Decision Maker ("CODM"), our Chief Executive Officer, to make decisions about resources to be allocated to the segment and assess its performance. Consistent with how the Board of Directors, the CODM, and the leadership team review the Company's results, the following discussion and analysis is primarily around consolidated results. Segment specific information reviewed by the CODM and Company directors is discussed later in this section under the heading "Segment Performance Summary".
Three Months Ended March 31, 2015 Compared to Three Months Ended March 31, 2014
Purchasing Activity
The following table summarizes the purchasing activity for the three months ended March 31, 2015 compared to the three months ended March 31, 2014:
Three Months Ended | |||||||||||||||
Purchasing Activity ($ in thousands) | March 31, | ||||||||||||||
2015 | 2014 | $ Variance | % Variance | ||||||||||||
Credit Card/Consumer Loan - Fresh(1) | |||||||||||||||
Face Value | $ | 97,305 | $ | 174,811 | $ | (77,506 | ) | (44.3 | )% | ||||||
Price | 11,579 | 24,172 | (12,593 | ) | (52.1 | )% | |||||||||
Price (%) | 11.9 | % | 13.8 | % | |||||||||||
Credit Card/Consumer Loan - Non-Fresh(1) | |||||||||||||||
Face Value | 68,642 | 9,606 | 59,036 | (3) | |||||||||||
Price | 4,770 | 573 | 4,197 | (3) | |||||||||||
Price (%) | 6.9 | % | 6.0 | % | |||||||||||
Other(2) | |||||||||||||||
Face Value | 70,903 | 36,380 | 34,523 | 94.9 | % | ||||||||||
Price | 5,653 | 1,019 | 4,634 | (3) | |||||||||||
Price (%) | 8.0 | % | 2.8 | % | |||||||||||
Purchased Debt - Total | |||||||||||||||
Face Value | $ | 236,850 | $ | 220,797 | $ | 16,053 | 7.3 | % | |||||||
Price | 22,002 | 25,764 | (3,762 | ) | (14.6 | )% | |||||||||
Price (%) | 9.3 | % | 11.7 | % | |||||||||||
(2) Other includes commercial, student loan, and other purchased debt assets.
(3) Not meaningful
Credit Card/Consumer Loan - Fresh
Credit card and consumer loan - fresh purchases were $97.3 million of face value receivables at a price of $11.6 million during the three months ended March 31, 2015, compared to $174.8 million of face value receivables at a price of $24.2 million during the three months ended March 31, 2014, a decrease of 44.3% in face value and 52.1% in capital deployed. The decrease in purchase face value continues to be attributed to reduced supply and elevated pricing in the market. The decrease in average price from 13.8% to 11.9% is primarily attributed to change in issuer mix.
Credit Card/Consumer Loan - Non-Fresh
Credit card and consumer loan - non-fresh purchases consist of purchases of charged-off receivables that have been worked by an external agency or other party external to the originating financial institution. Credit card and consumer loan -
30
non-fresh purchases were $68.6 million of face value receivables at a price of $4.8 million during the three months ended March 31, 2015, compared to $9.6 million of face value receivables at a price of $0.6 million during the three months ended March 31, 2014, an increase of $59.0 million in face value and $4.2 million in capital deployed. The increases in 2015 were due to more favorable opportunities for capital deployment in the non-fresh category compared to fresh.
Other
Other purchases consist of commercial, student loan, and other various asset classes. Other purchases were $70.9 million in face value at a price of $5.7 million during the three months ended March 31, 2015, compared to $36.4 million in face value at a price of $1.0 million during the three months ended March 31, 2014, an increase of $34.5 million in face value and $4.6 million in capital deployed due to increases in commercial purchasing consistent with our diversification strategy. Our average price for other purchases increased from 2.8% to 8.0% primarily due to product mix and age of portfolios with more commercial fresh purchases in 2015. We continue to deploy capital into the other category only if the anticipated return exceeds our targeted return thresholds.
Cash Proceeds on Purchased Debt
A key driver to our performance, and one of the primary metrics monitored by our management team, is cash proceeds received from our purchased debt. This measurement, and our focus on cash proceeds, is important because proceeds drive our business operations. Included in cash proceeds are non-legal collections, legal collections, the reimbursement of court costs, bankruptcy proceeds, returns of non-conforming accounts (which we refer to as "recourse"), and sales.
The following table summarizes the cash proceeds activity for the three months ended March 31, 2015 compared to the three months ended March 31, 2014:
Three Months Ended | |||||||||||||||
March 31, | |||||||||||||||
Cash Proceeds ($ in thousands) | 2015 | 2014 | $ Variance | % Variance | |||||||||||
Credit card/consumer loan collections | |||||||||||||||
Non-legal collections | $ | 38,326 | $ | 52,253 | $ | (13,927 | ) | (26.7 | )% | ||||||
Legal collections | 48,288 | 52,875 | (4,587 | ) | (8.7 | )% | |||||||||
Other collections(1) | 6,517 | 5,282 | 1,235 | 23.4 | % | ||||||||||
Total collections | 93,131 | 110,410 | (17,279 | ) | (15.6 | )% | |||||||||
Sales, recourse & bankruptcy proceeds | 1,342 | 1,830 | (488 | ) | (26.7 | )% | |||||||||
Total cash proceeds on purchased debt | $ | 94,473 | $ | 112,240 | $ | (17,767 | ) | (15.8 | )% | ||||||
(1) Other includes collections and court cost recoveries on commercial, student loan, medical, and other accounts.
Credit Card/Consumer Loan Collections
Non-legal Collections
Credit card and consumer loan non-legal collections were $38.3 million during the three months ended March 31, 2015 compared to $52.3 million during the three months ended March 31, 2014, a decrease of $13.9 million or 26.7%. This decrease is driven primarily by lower face value of purchases in 2013 and 2014 and therefore less inventory in the non-legal channel. Credit card/consumer loan non-legal collections represented 41.2% and 47.3% of total collections during the three months ended March 31, 2015 and 2014, respectively.
Legal Collections
Credit card and consumer loan legal collections were $48.3 million during the three months ended March 31, 2015 compared to $52.9 million during the three months ended March 31, 2014, a decrease of $4.6 million or 8.7%. Legal collections were impacted less by the lower volume of purchases than non-legal collections due to the time lag between when portfolios are acquired versus when legal action, our strategy of last resort, is commenced. Credit card/consumer loan legal collections represented 51.8% and 47.9% of total collections during the three months ended March 31, 2015 and 2014, respectively.
31
Other Collections
Other collections were $6.5 million during the three months ended March 31, 2015 compared to $5.3 million during the three months ended March 31, 2014, an increase of $1.2 million or 23.4%. The increase in other collections was primarily the result of an increase in commercial collections.
Sales, Recourse, and Bankruptcy Proceeds
Sales, recourse, and bankruptcy proceeds were $1.3 million during the three months ended March 31, 2015 compared to $1.8 million during the three months ended March 31, 2014. This decrease is attributed to the shift away from account re-sales offset by an increase in bankruptcy proceeds in 2015. With very few exceptions, such as discontinued medical portfolios, we no longer sell accounts.
32
Consolidated Results
The following table summarizes the results of our operations for the three months ended March 31, 2015 compared to the three months ended March 31, 2014:
Three Months Ended | |||||||||||||||
March 31, | |||||||||||||||
Consolidated Results ($ in thousands) | 2015 | 2014 | $ Variance | % Variance | |||||||||||
Revenues | |||||||||||||||
Purchased debt revenue, net | $ | 52,403 | $ | 71,490 | $ | (19,087 | ) | (26.7 | )% | ||||||
Other revenue | 6 | 19 | (13 | ) | (68.4 | )% | |||||||||
Total revenues | 52,409 | 71,509 | (19,100 | ) | (26.7 | )% | |||||||||
Expenses | |||||||||||||||
Purchased debt expense | 34,479 | 39,078 | (4,599 | ) | (11.8 | )% | |||||||||
Court costs, net | 7,261 | 9,183 | (1,922 | ) | (20.9 | )% | |||||||||
Salaries and payroll taxes | 8,662 | 7,557 | 1,105 | 14.6 | % | ||||||||||
General and administrative | 3,307 | 4,043 | (736 | ) | (18.2 | )% | |||||||||
Depreciation and amortization | 1,756 | 1,642 | 114 | 6.9 | % | ||||||||||
Total operating expenses | 55,465 | 61,503 | (6,038 | ) | (9.8 | )% | |||||||||
Operating (loss) income | (3,056 | ) | 10,006 | (13,062 | ) | (130.5 | )% | ||||||||
Other expenses | |||||||||||||||
Interest expense | 11,088 | 11,009 | 79 | 0.7 | % | ||||||||||
Other expense | 84 | 106 | (22 | ) | (20.8 | )% | |||||||||
Total other expenses | 11,172 | 11,115 | 57 | 0.5 | % | ||||||||||
Loss before income taxes | (14,228 | ) | (1,109 | ) | (13,119 | ) | (1) | ||||||||
Income tax expense | (1,160 | ) | (1,037 | ) | (123 | ) | (11.9 | )% | |||||||
Net loss | $ | (15,388 | ) | $ | (2,146 | ) | $ | (13,242 | ) | (1) | |||||
(1) Not meaningful.
Purchased Debt Revenue, Net
Purchased debt revenue, net was $52.4 million during the three months ended March 31, 2015 compared to $71.5 million during the three months ended March 31, 2014, a decrease of $19.1 million or 26.7%. The change was predominantly driven by a $19.9 million decrease in gross revenue on level yield assets. Increased purchase prices led to lower return expectations on certain 2013 and 2014 purchases, which resulted in a decrease in the weighted average internal rate of return ("IRR"). Furthermore, the average carrying value of level yield purchased debt assets decreased from $247.4 million to $194.6 million.
Purchased Debt Expense
Purchased debt expense was $34.5 million during the three months ended March 31, 2015 compared to $39.1 million during the three months ended March 31, 2014. Purchased debt expense decreased 11.8%, which was primarily attributable to a decrease of 15.6% in total collections on purchased debt.
Court Costs, Net
Court costs, net were $7.3 million during the three months ended March 31, 2015, compared to $9.2 million during the three months ended March 31, 2014. Court costs are expensed as incurred; however, partial recovery of these costs occurs over several years. We estimate that we recover in excess of one-third of all court costs expended.
Costs to Collect
Costs to collect include purchased debt expense and gross court costs. We evaluate our costs to collect, both including and excluding court costs, in relation to total collections rather than revenue due to the timing differences between revenue and
33
expense recognition for GAAP purposes. For the purpose of this metric, we use gross court costs in the numerator because court cost recoveries are included in total collections.
The following table summarizes our costs to collect and our costs to collect excluding court costs as a percentage of total collections for the three months ended March 31, 2015 compared to the three months ended March 31, 2014:
Three Months Ended | |||||||||||||
March 31, | |||||||||||||
Costs to Collect ($ in thousands) | 2015 | 2014 | $ Variance | % Variance | |||||||||
Total collections | 93,131 | 110,410 | $ | (17,279 | ) | (15.6 | )% | ||||||
Costs to collect(1) | 42,007 | 48,583 | (6,576 | ) | (13.5 | )% | |||||||
Costs to collect as a % of collections | 45.1 | % | 44.0 | % | |||||||||
Costs to collect excluding court costs | 34,479 | 39,078 | (4,599 | ) | (11.8 | )% | |||||||
Costs to collect excluding court costs as a % of collections | 37.0 | % | 35.4 | % | |||||||||
(1) Excludes court cost recoveries of $0.3 million and $0.3 million, respectively, to arrive at gross court costs.
The increase in costs to collect as a percentage of collections was partially due to the impact of lower volumes and the mix of legal collections as a percentage of total collections having increased from 47.9% during the three months ended March 31, 2014 to 51.8% during the three months ended March 31, 2015, as well as an increase in court costs as a percentage of collections.
Salaries and Payroll Taxes
Salaries and payroll taxes were $8.7 million during the three months ended March 31, 2015, compared to $7.6 million during the three months ended March 31, 2014, an increase of $1.1 million or 14.6%. The increase was driven by an increase in headcount and related compensation expenses primarily related to increased compliance staffing.
Income Tax Expense
For the three months ended March 31, 2015 the combined state, federal and Canadian tax expense from operations was $1.2 million compared to $1.0 million for the same period in 2014. Tax expense in 2015 was comprised of foreign taxes on Canadian operations based on an effective tax rate of approximately 26.5% and deferred expense of $0.1 million related to Canadian withholding tax recognized in connection with Internal Revenue Code (“IRC”) Section 956 income from Canadian operations. Any tax benefits related to pretax losses generated by the Company’s ongoing U.S. operations during 2015 have been fully offset by a corresponding increase in the valuation allowance as the Company remains in full valuation allowance position at March 31, 2015.
While virtually all IRC Section 956 income generated in the U.S. during 2015 can be offset by the Company’s net operating losses in the U.S., the $0.1 million expense relates specifically to withholding taxes on the amount of the deemed distribution under IRC Section 956, which would be payable in Canada upon an actual distribution in the future. Therefore, to the extent the amount of Canadian earnings and profits deemed distributed is not actually repatriated to the U.S., the withholding tax will not be paid.
Adjusted EBITDA
Adjusted EBITDA is calculated as income before interest, taxes, depreciation and amortization (including amortization of the carrying value on our purchased debt), as adjusted by several items. Adjusted EBITDA generally represents cash proceeds on our owned charged-off receivables plus the contributions of our other business activities less operating expenses (other than non-cash expenses, such as depreciation and amortization) as adjusted. Adjusted EBITDA, which is a non-GAAP financial measure, should not be considered an alternative to, or more meaningful than, net income prepared on a GAAP basis. We present Adjusted EBITDA because we consider it to be an important supplemental measure of our performance. We believe Adjusted EBITDA is representative of our cash flow generation that can be used to purchase charged-off receivables, pay down or service debt, pay income taxes, and for other uses. We believe that Adjusted EBITDA is frequently used by investors and other interested parties in the evaluation of companies in our industry. In addition, the instruments governing our
34
indebtedness use Adjusted EBITDA to measure our compliance with certain covenants and, in certain circumstances, our ability to make certain borrowings.
The following table summarizes our Adjusted EBITDA for the three months ended March 31, 2015 compared to the three months ended March 31, 2014:
Three Months Ended | |||||||||||||||
March 31, | |||||||||||||||
Adjusted EBITDA ($ in thousands) | 2015 | 2014 | $ Variance | % Variance | |||||||||||
Non-legal collections | $ | 38,326 | $ | 52,253 | $ | (13,927 | ) | (26.7 | )% | ||||||
Legal collections | 48,288 | 52,875 | (4,587 | ) | (8.7 | )% | |||||||||
Other collections(1) | 6,517 | 5,282 | 1,235 | 23.4 | % | ||||||||||
Sales, recourse & bankruptcy proceeds | 1,342 | 1,830 | (488 | ) | (26.7 | )% | |||||||||
Contribution of other business activities(2) | 1,071 | 1,699 | (628 | ) | (37.0 | )% | |||||||||
Total inflows | 95,544 | 113,939 | (18,395 | ) | (16.1 | )% | |||||||||
Purchased debt expense | 34,479 | 39,078 | (4,599 | ) | (11.8 | )% | |||||||||
Court costs, net | 7,261 | 9,183 | (1,922 | ) | (20.9 | )% | |||||||||
Salaries, general and administrative expenses | 11,969 | 11,600 | 369 | 3.2 | % | ||||||||||
Other(3) | 425 | 493 | (68 | ) | (13.8 | )% | |||||||||
Total outflows | 54,134 | 60,354 | (6,220 | ) | (10.3 | )% | |||||||||
Adjustments(4) | 274 | 607 | (333 | ) | (54.9 | )% | |||||||||
Adjusted EBITDA | $ | 41,684 | $ | 54,192 | $ | (12,508 | ) | (23.1 | )% | ||||||
(1) Other includes collections and court cost recoveries on commercial, student loan, medical, and other accounts.
(2) Includes royalties on purchased debt and other revenue.
(3) Represents certain other items consistent with our debt covenant calculation.
(4) Consistent with the covenant calculations within our revolving credit facility, adjustments include, as applicable, the non-cash expense related to option grants of Parent’s equity granted to our employees, directors and branch office owners, branch office note reserve, lease breakup costs, certain consulting fees, management fees paid to KRG, certain transaction expenses, recruiting expense, severance expense, and certain non-recurring items.
The table above represents cash generated by collecting debt, selling debt and other business activities, less operating and other cash expenses, resulting in Adjusted EBITDA. The table below reconciles net loss to EBITDA and adjusts for certain purchasing items and other non-cash items to reconcile to Adjusted EBITDA for the three months ended March 31, 2015 compared to the three months ended March 31, 2014:
Three Months Ended | |||||||||||||||
Reconciliation of Net Loss to Adjusted EBITDA ($ in thousands) | March 31, | ||||||||||||||
2015 | 2014 | $ Variance | % Variance | ||||||||||||
Net loss | $ | (15,388 | ) | $ | (2,146 | ) | $ | (13,242 | ) | (5) | |||||
Interest expense | 11,088 | 11,009 | 79 | 0.7 | % | ||||||||||
Interest income | (41 | ) | (19 | ) | (22 | ) | (115.8 | )% | |||||||
Income tax expense | 1,160 | 1,037 | 123 | 11.9 | % | ||||||||||
Depreciation and amortization | 1,756 | 1,642 | 114 | 6.9 | % | ||||||||||
EBITDA | (1,425 | ) | 11,523 | (12,948 | ) | (112.4 | )% | ||||||||
Adjustments related to purchased debt accounting | |||||||||||||||
Proceeds applied to purchased debt principal(1) | 45,254 | 42,267 | 2,987 | 7.1 | % | ||||||||||
Purchased debt valuation allowance reversals(2) | (2,419 | ) | (205 | ) | (2,214 | ) | (5) | ||||||||
Certain other or non-cash expenses | |||||||||||||||
Stock option expense(3) | 11 | 24 | (13 | ) | (54.2 | )% | |||||||||
Other(4) | 263 | 583 | (320 | ) | (54.9 | )% | |||||||||
Adjusted EBITDA | $ | 41,684 | $ | 54,192 | $ | (12,508 | ) | (23.1 | )% | ||||||
35
(1) Cash proceeds applied to purchased debt principal rather than recorded as revenue.
(2) Represents non-cash valuation allowance reversals on purchased debt.
(3) Represents the non-cash expense related to option grants of Parent’s equity granted to certain employees, directors and branch office owners.
(4) Consistent with the covenant calculations within our revolving credit facility, other includes, as applicable, branch office note reserves, lease breakup costs, certain consulting fees, management fees paid to KRG, certain transaction expenses, recruiting expense, severance expense, and certain non-recurring items.
(5) Not meaningful.
The table below reconciles net cash used in operating activities to Adjusted EBITDA for the three months ended March 31, 2015 compared to the three months ended March 31, 2014:
Three Months Ended | |||||||||||||||
Reconciliation of Net Cash Used in Operating Activities to Adjusted EBITDA ($ in thousands) | March 31, | ||||||||||||||
2015 | 2014 | $ Variance | % Variance | ||||||||||||
Net cash used in operating activities | $ | (27,810 | ) | $ | (14,377 | ) | $ | (13,433 | ) | (93.4 | )% | ||||
Proceeds applied to purchased debt principal(1) | 45,254 | 42,267 | 2,987 | 7.1 | % | ||||||||||
Interest expense to be paid in cash(2) | 10,262 | 10,277 | (15 | ) | (0.1 | )% | |||||||||
Interest income | (41 | ) | (19 | ) | (22 | ) | (115.8 | )% | |||||||
Amortization of prepaid and other non-cash expenses | (1,477 | ) | (919 | ) | (558 | ) | (60.7 | )% | |||||||
Changes in operating assets and liabilities and deferred taxes: | |||||||||||||||
Restricted cash(3) | 17,568 | 19,024 | (1,456 | ) | (7.7 | )% | |||||||||
Other operating assets and liabilities and deferred taxes(4) | (3,495 | ) | (3,681 | ) | 186 | 5.1 | % | ||||||||
Income tax expense | 1,160 | 1,037 | 123 | 11.9 | % | ||||||||||
Other(5) | 263 | 583 | (320 | ) | (54.9 | )% | |||||||||
Adjusted EBITDA | $ | 41,684 | $ | 54,192 | $ | (12,508 | ) | (23.1 | )% | ||||||
(1) Cash proceeds applied to purchased debt principal are shown in the investing activities section of the condensed consolidated statements of cash flows.
(2) Represents interest expense, excluding non-cash amortization of loan origination fees and debt discount.
(3) Represents the change in restricted cash balances for the period due to the timing of payments on our line of credit and semi-annual interest payments on our Senior Second Lien Notes.
(4) The amount represents timing differences due to the recognition of certain expenses and revenue items on a cash versus accrual basis.
(5) Consistent with the covenant calculations within our revolving credit facility, other includes, as applicable, branch office note reserves, lease breakup costs, certain consulting fees, management fees paid to KRG, certain transaction expenses, recruiting expense, severance expense, and certain non-recurring items.
Segment Performance Summary
We have two reportable segments in accordance with the GAAP criteria for segment reporting: Domestic and Canada. A reporting segment's operating results are regularly reviewed by the CODM to make decisions about resources to be allocated to the segment and assess its performance. The segment operating results discussed in this section are presented on a basis consistent with our current management reporting being reviewed by our Board of Directors and the CODM.
36
Domestic Performance Summary
The following table presents selected financial data for our Domestic operating segment for the three months ended March 31, 2015 compared to the three months ended March 31, 2014:
Domestic Segment Performance Summary | Three Months Ended | ||||||||||||||
March 31, | |||||||||||||||
($ in thousands) | 2015 | 2014 | $ Variance | % Variance | |||||||||||
Purchases - face value | $ | 197,923 | $ | 192,532 | $ | 5,391 | 2.8 | % | |||||||
Purchases - price | 18,259 | 22,790 | (4,531 | ) | (19.9 | )% | |||||||||
Purchases - price (%) | 9.2 | % | 11.8 | % | |||||||||||
Cash proceeds on purchased debt | 83,262 | 101,986 | (18,724 | ) | (18.4 | )% | |||||||||
Total revenues | 45,837 | 65,359 | (19,522 | ) | (29.9 | )% | |||||||||
Adjusted EBITDA(1) | 33,291 | 46,771 | (13,480 | ) | (28.8 | )% | |||||||||
(1) Segment Adjusted EBITDA is calculated consistently with the methodology used to report the Company's consolidated Adjusted EBITDA, except with regard to the costs of certain overhead items that may benefit both operating segments. The costs of these overhead items are included in the calculation of Domestic Adjusted EBITDA, but have not been allocated to Canada. This treatment of certain overhead costs is consistent with CODM review.
Purchases
Three months ended March 31, 2015 compared with three months ended March 31, 2014
Total domestic purchases increased $5.4 million or 2.8% in face value and decreased $4.5 million or 19.9% in capital deployed. Credit card/consumer loan - fresh debt purchases decreased $83.9 million in face value and $13.2 million in capital deployed. Credit card/consumer loan - non-fresh debt purchases increased $54.7 million in face value and $4.0 million in capital deployed. Purchases of student loan and commercial accounts increased $34.5 million in face value and $4.6 million in capital deployed. The decrease in credit/card consumer loan - fresh purchasing continues to be attributed to reduced supply in the market.
Cash Proceeds
Three months ended March 31, 2015 compared with three months ended March 31, 2014
Domestic cash proceeds on purchased debt decreased $18.7 million or 18.4%. The largest driver was a $14.6 million or 33.7% decrease in credit card/consumer loan non-legal collections, due to lower face value of purchases in 2013 and 2014 and therefore less inventory in the non-legal channel. In addition, credit card/consumer loan legal collections decreased $4.8 million or 9.3% due to the lower face value of purchases. Legal collections were impacted less by the lower purchases volume than non-legal collections due to the time lag between when portfolios are acquired versus when legal action, our strategy of last resort, is commenced.
Total Revenues
Three months ended March 31, 2015 compared with three months ended March 31, 2014
Total domestic revenues decreased $19.5 million or 29.9%. Gross revenue on level yield assets decreased by $20.7 million due to a decrease in the weighted average IRR. Increased purchase prices led to lower return expectations on certain 2013 and 2014 purchases, which resulted in a lower overall weighted average IRR.
Adjusted EBITDA
Three months ended March 31, 2015 compared with three months ended March 31, 2014
Domestic Adjusted EBITDA decreased $13.5 million or 28.8%, primarily driven by the decrease in cash proceeds on purchased debt of $18.7 million, which resulted in a partially offsetting $6.5 million decrease in costs to collect.
37
Canada Performance Summary
The following table presents selected financial data for our Canada operating segment for the three months ended March 31, 2015 compared to the three months ended March 31, 2014:
Canada Segment Performance Summary | Three Months Ended | ||||||||||||||
March 31, | |||||||||||||||
($ in thousands) | 2015 | 2014 | $ Variance | % Variance | |||||||||||
Purchases - face value | $ | 38,927 | $ | 28,265 | $ | 10,662 | 37.7 | % | |||||||
Purchases - price | 3,743 | 2,974 | 769 | 25.9 | % | ||||||||||
Purchases - price (%) | 9.6 | % | 10.5 | % | |||||||||||
Cash proceeds on purchased debt | 11,211 | 10,254 | 957 | 9.3 | % | ||||||||||
Total revenues | 6,572 | 6,150 | 422 | 6.9 | % | ||||||||||
Adjusted EBITDA(1) | 8,393 | 7,421 | 972 | 13.1 | % | ||||||||||
(1) Segment Adjusted EBITDA is calculated consistently with the methodology used to report the Company's consolidated Adjusted EBITDA, except with regard to the costs of certain overhead items that may benefit both operating segments. The costs of these overhead items are included in the calculation of Domestic Adjusted EBITDA, but have not been allocated to Canada. This treatment of certain overhead costs is consistent with CODM review.
Purchases
Three months ended March 31, 2015 compared with three months ended March 31, 2014
Purchases by our Canada segment increased $10.7 million in face value and $0.8 million in capital deployed, net of foreign currency translation impact of $0.7 million, primarily due to greater acquisition opportunities in credit card/consumer loan - fresh that met our return criteria.
Cash Proceeds
Three months ended March 31, 2015 compared with three months ended March 31, 2014
Canada's cash proceeds on purchased debt increased $1.0 million or 9.3%, net of foreign currency translation impact of $1.8 million. This increase was due primarily to an increase in non-legal collections due to higher face value of purchases in 2014 and 2015 and therefore more inventory in the non-legal channel.
Total Revenues
Three months ended March 31, 2015 compared with three months ended March 31, 2014
Total revenues from our Canada segment increased $0.4 million or 6.9%, net of foreign currency translation impact of $1.0 million. The increase in revenue is primarily due to an increase in gross revenue on level yield assets.
Adjusted EBITDA
Three months ended March 31, 2015 compared with three months ended March 31, 2014
Canada Adjusted EBITDA increased $1.0 million or 13.1%, net of foreign currency translation impact of $1.4 million. This increase was primarily driven by the increase in cash proceeds on purchased debt.
38
Supplemental Performance Data
Our Owned Portfolios
As of March 31, 2015, our active owned charged-off receivables in the U.S. and Canada totaled $8.4 billion in face value and consisted of approximately 2.2 million accounts. We believe that these accounts will represent a significant base of cash flows for us. The following table sets forth summary information on our active owned charged-off receivables as of March 31, 2015.
Account Type | # of Active Accts (in thousands) | Avg. Bal. per Acct. | Active Face Value(3) ($ in millions) | Active Face Value (% of Total) | Capital Deployed(1) ($ in millions) | Capital Deployed(1) (% of Total) | |||||||||||||||
Credit Card/Consumer Loan - Fresh | 1,367 | $ | 3,917 | $ | 5,354 | 63.6 | % | $ | 2,108 | 80.9 | % | ||||||||||
Credit Card/Consumer Loan - Non-Fresh | 734 | 2,935 | 2,154 | 25.6 | % | 352 | 13.5 | % | |||||||||||||
Other(2) | 60 | 15,233 | 914 | 10.9 | % | 146 | 5.6 | % | |||||||||||||
Total/Average | 2,161 | $ | 3,897 | $ | 8,422 | 100.0 | % | $ | 2,606 | 100.0 | % | ||||||||||
(1) Capital Deployed is an aggregate life-to-date total by account type. It is a representation of resource allocation and includes active and inactive accounts.
(2) Other includes commercial, student loan, medical and other purchased debt assets.
(3) Canadian amounts converted to U.S. dollars using the exchange rate as of March 31, 2015.
Owned Portfolio Performance
The following tables show certain data related to our purchased debt portfolios. These tables describe purchase price, cash proceeds received to date, estimated remaining cash proceeds, and related gross return on investment.
The gross ROIs for 2007 and 2008 shown below are lower in comparison to most of our historical multiples. These lower ROIs were generally caused by increased market pricing and an overall deterioration in the macroeconomic environment. The gross ROIs for 2013 -2015 purchases are also lower in comparison to most of our historical returns, primarily due to lower supply that has resulted in increased market competition and rising prices.
U.S. Purchased Debt Portfolio as of March 31, 2015 ($ in thousands)
Purchase Period | Purchase Price(1) | Valuation Allowance (2) | Purchased Debt, net Carrying Value(3) | % of Carrying Value Unamortized(4) | Actual Proceeds Life to Date | Estimated Remaining Proceeds | Total Estimated Proceeds(5) | Gross ROI(6) | |||||||||||||||||||||
2006 and prior | $ | 896,340 | $ | (5,328 | ) | $ | 513 | — | % | $ | 2,108,459 | $ | 11,140 | $ | 2,119,599 | 2.36x | |||||||||||||
2007 | 236,005 | (56,859 | ) | 2,569 | 1 | % | 352,829 | 4,915 | 357,744 | 1.52x | |||||||||||||||||||
2008 | 226,030 | (66,122 | ) | 5,386 | 2 | % | 341,623 | 10,618 | 352,241 | 1.56x | |||||||||||||||||||
2009 | 105,157 | (613 | ) | 1,797 | 2 | % | 213,803 | 11,572 | 225,375 | 2.14x | |||||||||||||||||||
2010 | 164,117 | (2,173 | ) | 510 | — | % | 401,336 | 40,333 | 441,669 | 2.69x | |||||||||||||||||||
2011 | 244,959 | (2,949 | ) | 4,656 | 2 | % | 551,008 | 78,084 | 629,092 | 2.57x | |||||||||||||||||||
2012 | 246,011 | (4,081 | ) | 20,222 | 8 | % | 444,826 | 106,346 | 551,172 | 2.24x | |||||||||||||||||||
2013 | 240,595 | (4,908 | ) | 77,435 | 32 | % | 266,794 | 158,399 | 425,193 | 1.77x | |||||||||||||||||||
2014 | 105,532 | — | 57,208 | 54 | % | 57,903 | 101,655 | 159,558 | 1.51x | ||||||||||||||||||||
2015 | 18,259 | — | 17,145 | 94 | % | 1,372 | 31,962 | 33,334 | 1.83x | ||||||||||||||||||||
Total | $ | 2,483,005 | $ | (143,033 | ) | $ | 187,441 | $ | 4,739,953 | $ | 555,024 | $ | 5,294,977 | 2.13x | |||||||||||||||
(1) Purchase price represents cost of each purchase.
(2) Valuation allowance represents the total valuation allowance on our purchased debt, net of reversals.
(3) Portfolio carrying value represents the net book value of our purchased debt portfolios excluding the impact of the branch office asset purchase program (discontinued).
(4) Percentage of carrying value unamortized represents the carrying value divided by the purchase price.
39
(5) Total estimated proceeds represent actual proceeds life to date plus the estimated remaining proceeds.
(6) Gross ROI represents the total estimated proceeds divided by purchase price.
Canada Purchased Debt Portfolio as of March 31, 2015 (U.S. dollars in thousands)
Purchase Period | Purchase Price(1) | Valuation Allowance | Purchased Debt, net Carrying Value(2) | % of Carrying Value Unamortized | Actual Proceeds Life to Date(1) | Estimated Remaining Proceeds(2) | Total Estimated Proceeds | Gross ROI | |||||||||||||||||||||
2006 and prior | $ | 5,885 | $ | — | $ | — | — | % | $ | 9,483 | $ | 13 | $ | 9,496 | 1.61x | ||||||||||||||
2007 | 7,889 | — | — | — | % | 15,046 | 95 | 15,141 | 1.92x | ||||||||||||||||||||
2008 | 6,282 | — | — | — | % | 9,752 | 151 | 9,903 | 1.58x | ||||||||||||||||||||
2009 | 3,350 | — | — | — | % | 9,504 | 478 | 9,982 | 2.98x | ||||||||||||||||||||
2010 | 7,706 | — | — | — | % | 29,731 | 2,501 | 32,232 | 4.18x | ||||||||||||||||||||
2011 | 22,745 | — | — | — | % | 60,503 | 5,411 | 65,914 | 2.90x | ||||||||||||||||||||
2012 | 26,746 | — | 161 | 1 | % | 50,266 | 6,734 | 57,000 | 2.13x | ||||||||||||||||||||
2013 | 17,515 | — | 2,237 | 13 | % | 24,048 | 12,007 | 36,055 | 2.06x | ||||||||||||||||||||
2014 | 21,215 | — | 9,078 | 43 | % | 15,093 | 23,389 | 38,482 | 1.81x | ||||||||||||||||||||
2015 | 3,743 | — | 2,463 | 66 | % | 1,568 | 6,256 | 7,824 | 2.09x | ||||||||||||||||||||
Total | $ | 123,076 | $ | — | $ | 13,939 | $ | 224,994 | $ | 57,035 | $ | 282,029 | 2.29x | ||||||||||||||||
(1) Converted to U.S. dollars using average historical exchange rates effective in the month of activity.
(2) Converted to U.S. dollars using the exchange rate as of March 31, 2015.
Consolidated Purchased Debt Portfolio as of March 31, 2015 (U.S. dollars in thousands)
Purchase Period | Purchase Price | Valuation Allowance | Purchased Debt, net Carrying Value | % of Carrying Value Unamortized | Actual Proceeds Life to Date | Estimated Remaining Proceeds | Total Estimated Proceeds | Gross ROI | |||||||||||||||||||||
2006 and prior | $ | 902,225 | $ | (5,328 | ) | $ | 513 | — | % | $ | 2,117,942 | $ | 11,153 | $ | 2,129,095 | 2.36x | |||||||||||||
2007 | 243,894 | (56,859 | ) | 2,569 | 1 | % | 367,875 | 5,010 | 372,885 | 1.53x | |||||||||||||||||||
2008 | 232,312 | (66,122 | ) | 5,386 | 2 | % | 351,375 | 10,769 | 362,144 | 1.56x | |||||||||||||||||||
2009 | 108,507 | (613 | ) | 1,797 | 2 | % | 223,307 | 12,050 | 235,357 | 2.17x | |||||||||||||||||||
2010 | 171,823 | (2,173 | ) | 510 | — | % | 431,067 | 42,834 | 473,901 | 2.76x | |||||||||||||||||||
2011 | 267,704 | (2,949 | ) | 4,656 | 2 | % | 611,511 | 83,495 | 695,006 | 2.60x | |||||||||||||||||||
2012 | 272,757 | (4,081 | ) | 20,383 | 7 | % | 495,092 | 113,080 | 608,172 | 2.23x | |||||||||||||||||||
2013 | 258,110 | (4,908 | ) | 79,672 | 31 | % | 290,842 | 170,406 | 461,248 | 1.79x | |||||||||||||||||||
2014 | 126,747 | — | 66,286 | 52 | % | 72,996 | 125,044 | 198,040 | 1.56x | ||||||||||||||||||||
2015 | 22,002 | — | 19,608 | 89 | % | 2,940 | 38,218 | 41,158 | 1.87x | ||||||||||||||||||||
Total | $ | 2,606,081 | $ | (143,033 | ) | $ | 201,380 | $ | 4,964,947 | $ | 612,059 | $ | 5,577,006 | 2.14x | |||||||||||||||
Estimated Remaining Proceeds
Based on our proprietary models and analytics, we have developed detailed cash flow forecasts for our charged-off receivables. As outlined in the tables below, we anticipate that our U.S. owned charged-off receivables as of March 31, 2015 will generate a total of approximately $555.0 million of gross cash proceeds. Our ERP expectations are based on historical data as well as assumptions about future collection rates and consumer behavior and are subject to a variety of factors that are beyond our control, and we cannot guarantee that we will achieve these results.
40
U.S. Purchased Debt Calendar Year Estimated Remaining Proceeds by Year of Purchase ($ in thousands)
Purchase Year | 2015 | 2016 | 2017 | 2018 | 2019 | 2020 | 2021 | 2022 | 2023 and thereafter(2) | Total | |||||||||||||||||||
2006 and prior(1) | $5,891 | $3,818 | $1,173 | $258 | $— | $— | $— | $— | $— | $11,140 | |||||||||||||||||||
2007 | 2,324 | 1,103 | 1,008 | 387 | 93 | — | — | — | — | 4,915 | |||||||||||||||||||
2008 | 5,703 | 2,445 | 919 | 1,031 | 418 | 102 | — | — | — | 10,618 | |||||||||||||||||||
2009 | 4,196 | 3,943 | 2,007 | 559 | 537 | 264 | 66 | — | — | 11,572 | |||||||||||||||||||
2010 | 12,515 | 12,543 | 8,366 | 4,174 | 1,158 | 1,006 | 457 | 114 | — | 40,333 | |||||||||||||||||||
2011 | 22,008 | 21,423 | 15,730 | 10,349 | 4,891 | 1,512 | 1,445 | 583 | 143 | 78,084 | |||||||||||||||||||
2012 | 33,065 | 26,264 | 17,806 | 13,179 | 8,670 | 4,052 | 1,335 | 1,289 | 686 | 106,346 | |||||||||||||||||||
2013 | 51,563 | 43,869 | 24,036 | 16,337 | 11,446 | 7,378 | 3,298 | 358 | 114 | 158,399 | |||||||||||||||||||
2014 | 35,660 | 29,307 | 14,423 | 7,892 | 4,704 | 3,462 | 2,749 | 2,200 | 1,258 | 101,655 | |||||||||||||||||||
2015 | 11,596 | 8,155 | 4,372 | 2,724 | 1,594 | 1,153 | 912 | 752 | 704 | 31,962 | |||||||||||||||||||
Total | $184,521 | $152,870 | $89,840 | $56,890 | $33,511 | $18,929 | $10,262 | $5,296 | $2,905 | $555,024 | |||||||||||||||||||
Cumulative Percent | 33.2 | % | 60.8 | % | 77.0 | % | 87.2 | % | 93.3 | % | 96.7 | % | 98.5 | % | 99.5 | % | 100.0 | % | |||||||||||
U.S. Purchased Debt Rolling Twelve Months Estimated Remaining Proceeds by Year of Purchase ($ in thousands)
Purchase Year | 0 - 12 Months | 13 - 24 Months | 25 - 36 Months | 37 - 48 Months | 49 - 60 Months | 61 - 72 Months | 73 - 84 Months | 85 - 96 Months | 97 - 120 Months(2) | Total | |||||||||||||||||||
2006 and prior(1) | $7,289 | $2,825 | $908 | $118 | $— | $— | $— | $— | $— | $11,140 | |||||||||||||||||||
2007 | 2,648 | 1,058 | 886 | 273 | 50 | — | — | — | — | 4,915 | |||||||||||||||||||
2008 | 6,717 | 1,652 | 985 | 915 | 291 | 58 | — | — | — | 10,618 | |||||||||||||||||||
2009 | 5,362 | 3,459 | 1,543 | 495 | 500 | 170 | 43 | — | — | 11,572 | |||||||||||||||||||
2010 | 16,047 | 11,495 | 7,318 | 3,162 | 1,018 | 908 | 315 | 70 | — | 40,333 | |||||||||||||||||||
2011 | 27,988 | 19,877 | 14,396 | 8,984 | 3,608 | 1,462 | 1,279 | 410 | 80 | 78,084 | |||||||||||||||||||
2012 | 40,989 | 23,177 | 16,712 | 12,037 | 7,515 | 2,970 | 1,325 | 1,142 | 479 | 106,346 | |||||||||||||||||||
2013 | 65,035 | 37,690 | 21,343 | 14,918 | 10,498 | 6,349 | 2,319 | 151 | 96 | 158,399 | |||||||||||||||||||
2014 | 45,418 | 24,004 | 12,440 | 6,756 | 4,321 | 3,258 | 2,595 | 2,064 | 799 | 101,655 | |||||||||||||||||||
2015 | 14,020 | 7,049 | 3,853 | 2,382 | 1,455 | 1,082 | 866 | 720 | 535 | 31,962 | |||||||||||||||||||
Total | $231,513 | $132,286 | $80,384 | $50,040 | $29,256 | $16,257 | $8,742 | $4,557 | $1,989 | $555,024 | |||||||||||||||||||
Cumulative Percent | 41.7 | % | 65.5 | % | 80.0 | % | 89.0 | % | 94.3 | % | 97.2 | % | 98.8 | % | 99.6 | % | 100.0 | % | |||||||||||
(1) Represents estimated remaining proceeds for purchased debt acquired during the years 2004-2006.
(2) Although the maximum forecast period for charged-off receivables is 144 months, at March 31, 2015 no portfolio was expected to generate remaining cash proceeds in excess of the next 120 months.
41
Historical Proceeds
The following table demonstrates our ability to realize continuing cash flow streams on our purchased debt, showing our cash proceeds by year, and year of purchase.
U.S. Period of Proceeds ($ in thousands)
Purchase Year | 2006 & Prior(2) | 2007 | 2008 | 2009 | 2010 | 2011 | 2012 | 2013 | 2014 | 2015 | Total | ||||||||||||||||||||||
2006 & Prior(1) | $ | 1,329,748 | $ | 338,808 | $ | 180,830 | $ | 96,778 | $ | 61,165 | $ | 40,410 | $ | 26,238 | $ | 18,207 | $ | 13,516 | $ | 2,759 | $ | 2,108,459 | |||||||||||
2007 | — | 98,929 | 111,049 | 54,363 | 34,500 | 21,178 | 14,424 | 9,919 | 6,889 | 1,578 | 352,829 | ||||||||||||||||||||||
2008 | — | — | 98,025 | 88,017 | 65,471 | 38,416 | 24,983 | 15,024 | 9,699 | 1,988 | 341,623 | ||||||||||||||||||||||
2009 | — | — | — | 49,074 | 71,698 | 41,300 | 27,948 | 13,681 | 8,407 | 1,695 | 213,803 | ||||||||||||||||||||||
2010 | — | — | — | — | 90,429 | 130,132 | 94,374 | 53,213 | 27,698 | 5,490 | 401,336 | ||||||||||||||||||||||
2011 | — | — | — | — | — | 163,304 | 196,236 | 120,068 | 60,322 | 11,078 | 551,008 | ||||||||||||||||||||||
2012 | — | — | — | — | — | — | 176,605 | 163,096 | 88,015 | 17,110 | 444,826 | ||||||||||||||||||||||
2013 | — | — | — | — | — | — | — | 122,488 | 119,738 | 24,568 | 266,794 | ||||||||||||||||||||||
2014 | — | — | — | — | — | — | — | — | 42,279 | 15,624 | 57,903 | ||||||||||||||||||||||
2015 | — | — | — | — | — | — | — | — | — | 1,372 | 1,372 | ||||||||||||||||||||||
Total | $ | 1,329,748 | $ | 437,737 | $ | 389,904 | $ | 288,232 | $ | 323,263 | $ | 434,740 | $ | 560,808 | $ | 515,696 | $ | 376,563 | $ | 83,262 | $ | 4,739,953 | |||||||||||
(1) Represents purchase vintage years 1998-2006.
(2) Represents proceeds from purchased debt during the years 1998-2006.
42
The following chart represents our historical proceeds on owned debt by quarter, with collections shown in black and sales, recourse & bankruptcy proceeds in gray.
Quarterly Cash Proceeds ($ in millions)
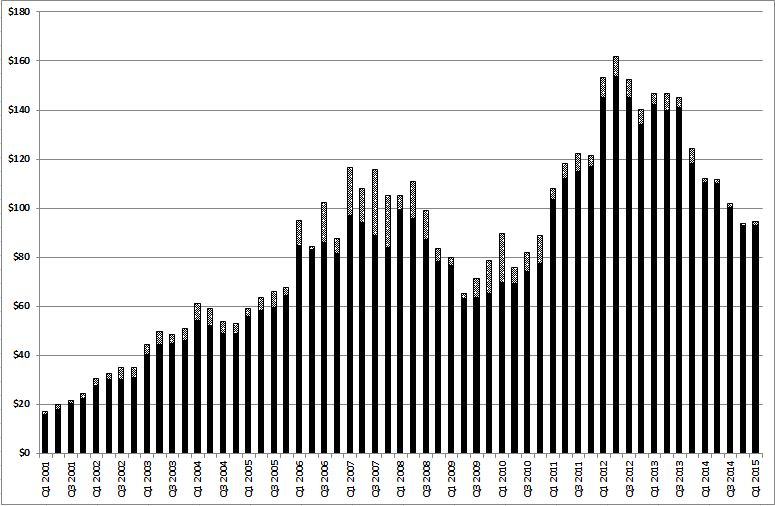
Liquidity and Capital Resources
Working Capital
Our primary sources of working capital are cash flows from operations, excess cash balances and bank borrowings. Our working capital levels fluctuate throughout the year based on purchasing volumes and are generally positively affected by first and second quarter collections each year when we historically tend to have higher collections. Generally, these higher first and second quarter collections are driven by tax refunds, patterns of seasonal employment, and the impact of reductions in consumer spending following the holiday season. We use our working capital to purchase charged-off receivables, service our indebtedness, and fund our operations to generate long-term growth.
Under our current borrowing structure, our domestic and Canadian line of credit borrowings are managed separately. Our domestic operation sweeps all cash proceeds obtained to pay down our domestic line of credit daily. As a result, we maintain minimal domestic cash balances on hand, excluding our restricted cash. Domestically and in Canada, we borrow from our line of credit only as needed to reduce overall interest costs on our outstanding borrowings. Our line of credit, in total for both domestic and Canadian operations, is subject to a borrowing base and is described further in our condensed consolidated financial statements. To the extent our Canadian cash flow exceeds the cash flow needs of our Canadian operation including purchasing new assets, the excess Canadian cash flow, after paying down the Canadian line of credit to zero, is held in our Canadian bank accounts or used to pay down our domestic line of credit.
The Company from time to time enters into forward flow purchase agreements with various debt sellers to purchase specified amounts of debt for designated prices. These contracts typically cover a year or less and can generally be canceled by the Company at its discretion with 30-60 days’ notice. At March 31, 2015, the Company did not have any non-cancelable forward flow purchase agreements.
43
Based on our current level of operations, we have sufficient liquidity to fund our operations through the next twelve months. Our purchasing volumes and proceeds in any period fluctuate based on pricing and other macro-economic factors. We view our liquidity as our availability to borrow on our domestic and Canadian line of credit, plus our domestic and Canadian non-restricted cash balances, which primarily includes excess Canadian cash on hand. As of March 31, 2015, our total availability under our line of credit was $37.0 million based on our borrowing base calculation, and our non-restricted cash balances were $17.6 million, resulting in liquidity as of March 31, 2015 of $54.5 million.
Cash Flows
Our primary sources of liquidity are cash proceeds from purchased debt, cash from operations, excess cash balances, and borrowings on our senior revolving credit facility. Our primary uses of liquidity are to purchase additional charged-off receivables, fund operating expenses, and service our indebtedness. Our total indebtedness, net of discount, at March 31, 2015 and December 31, 2014 was $439.5 million and $430.4 million, respectively, including obligations under capital leases. Our ability to service our debt and to fund planned purchases of charged-off receivables will depend on our ability to generate cash proceeds in the future, which, to a certain extent, is subject to general economic, financial, competitive, legislative, regulatory and other factors beyond our control.
The following table provides a summary of the components of cash flow for the periods presented:
Three Months Ended | ||||||||
March 31, | ||||||||
$ in thousands | 2015 | 2014 | ||||||
Net cash used in operating activities | $ | (27,810 | ) | $ | (14,377 | ) | ||
Net cash provided by investing activities | 22,035 | 15,421 | ||||||
Net cash provided by financing activities | 8,968 | 2,535 | ||||||
Increase in cash and cash equivalents (1) | $ | 3,193 | $ | 3,579 | ||||
(1) Before the impact of foreign currency translation on cash of $(1,304) and $(302), respectively.
Operating Activities
Cash generated from operations is dependent upon our ability to generate proceeds on our purchased debt. Many factors, including the economy and our and the branch offices' ability to maintain low collector turnover and adequate liquidation rates, are essential to our ability to generate cash proceeds. Fluctuations in these factors that cause volatility in our business could have a material impact on our expected future cash flows. Proceeds on purchased debt recorded as revenue are included in the operating activities, while proceeds recorded as amortization of purchased debt principal are included in the investing activities. See the reconciliation of net cash used in operating activities to Adjusted EBITDA in the Results of Operations section herein.
Our operating activities used net cash of $27.8 million and $14.4 million during the three months ended March 31, 2015 and 2014, respectively, resulting in a net increase in cash used in operating activities of $13.4 million. The increase in cash used by operating activities was primarily due to a decrease of $20.7 million in proceeds on purchased debt recorded as revenue, excluding non-cash valuation allowance charges and reversals. This was partially offset by a corresponding decrease in costs to collect including court costs of $6.6 million. The remaining change in net cash used in operating activities was due to normal changes in operating assets and liabilities.
Investing Activities
Our investing activities provided net cash of $22.0 million and $15.4 million during the three months ended March 31, 2015 and 2014, respectively. Cash used in investing activities is primarily driven by investments in charged-off receivables offset by cash proceeds applied to the carrying value of our purchased debt. The increase in cash provided by investing activities of $6.6 million was primarily due to a $3.8 million decrease in investments in purchased debt and a $3.0 million increase in cash proceeds recorded as a reduction of our purchased debt carrying value.
Financing Activities
Our financing activities provided net cash of $9.0 million and $2.5 million during the three months ended March 31, 2015 and 2014, respectively. Financing activities are primarily driven by purchasing volume (which drives our incremental
44
borrowing), payments on our revolving credit facility, capital lease obligations, and payments of origination fees on our revolving line of credit. Cash is provided by draws on our revolving credit facility and proceeds are used to pay down the revolving credit facility. The increase in cash provided by financing activities of $6.4 million was primarily due to a decrease of $15.6 million in draws on our revolving credit facility offset by a decrease of $21.9 million in payments on our revolving line of credit resulting from reduced proceeds on purchased debt during 2015 compared to 2014.
Long-term Financing
Senior Revolving Credit Facility and Senior Second Lien Notes
As of March 31, 2015, there were no material changes to the Company's revolving credit facility or its Senior Second Lien Notes from the information previously disclosed except for additional draws and repayments on the revolving credit facility. The balance of the outstanding line of credit under the revolving credit facility was $148.3 million and $138.7 million at March 31, 2015 and December 31, 2014, respectively; a decrease of $9.6 million. At March 31, 2015, our availability under the line of credit was $37.0 million based on our borrowing base calculation.
Company Debt Outstanding as a Multiple of TTM Adjusted EBITDA
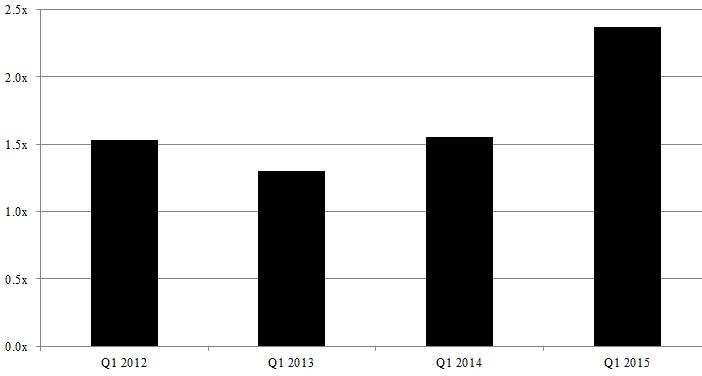
We believe the metric of debt outstanding as a multiple of TTM Adjusted EBITDA is representative of the Company's business model operating leverage. The ratio increased from 1.6x at March 31, 2014 to 2.4x at March 31, 2015 as a result of a 34.7% decrease in our TTM Adjusted EBITDA and a 0.3% decrease in our total debt. Adjusted EBITDA declined primarily due to lower cash proceeds on purchased debt as a result of lower purchasing volumes.
Covenants
The senior revolving credit facility and the Senior Second Lien Notes have certain covenants and restrictions, as is customary for such facilities, with which the Company must comply. Some of the financial covenants under the revolving credit facility include: minimum Adjusted EBITDA, capital expenditures limits, and maximum operating lease obligations. The minimum Adjusted EBITDA covenant, as defined in detail in the revolving credit facility agreement is $165 million for each of the trailing twelve month periods beginning with the fiscal quarter ending December 31, 2014. The maximum capital expenditures covenant for any fiscal year, as further described in the revolving credit facility agreement, is $8 million and is subject to provisions set forth in the agreement. Maximum aggregate rent expense and certain other operating lease obligations, excluding a certain operating lease, are $3 million in any fiscal year.
As of March 31, 2015, the Company was in compliance with all covenants and restrictions of the revolving credit facility and Senior Second Lien Notes.
45
Capital Leases
We had outstanding capital lease obligations relating to computer and office equipment of $1.3 million and software agreements of $0.5 million as of March 31, 2015.
Related Party Loans
During 2001, we entered into two promissory notes with two individuals related to a co-founder and member of our Board of Directors, P. Scott Lowery. The notes were issued to repurchase common stock of SquareTwo held by these related parties. These notes bear interest at a fixed rate of 8.0% and require us to make monthly principal and interest payments of less than $0.1 million. As of March 31, 2015, these notes had outstanding balances of $0.3 million and $0.3 million, respectively. The notes mature on January 15, 2016, and August 15, 2021, respectively.
Off-Balance Sheet Arrangements
As of March 31, 2015, we did not have any off balance sheet arrangements as defined by Item 303(a)(4) of Regulation S-K.
Critical Accounting Policies
The preparation of financial statements and related disclosures in conformity with GAAP and our discussion and analysis of our financial condition and results of operations require our management to make judgments, assumptions and estimates that affect the amounts reported in our condensed consolidated financial statements and accompanying notes. We base our estimates on historical experience and on various other assumptions we believe to be reasonable under the circumstances, the results of which form the basis for making judgments about the carrying values of assets and liabilities. Actual results may differ from these estimates and such differences may be material.
Management believes our critical accounting policies and estimates are those related to revenue recognition, accounting estimates, valuation of acquired goodwill and intangible assets, and income taxes. Management believes these policies to be critical because they are both important to the portrayal of our financial condition and results, and they require management to make judgments and estimates about matters that are inherently uncertain.
Revenue Recognition from Purchased Debt
We account for our purchased debt under the guidance of ASC Subtopic 310-30, Loans and Debt Securities Acquired with Deteriorated Credit Quality (“ASC 310-30”). Under ASC 310-30, static pools of purchased debt, aggregated based on certain common risk criteria, can be accounted for under either the interest method of accounting or the cost recovery method of accounting. Revenue recognition under ASC 310-30 is based in part on life-to-date performance of our static pools as well as our forecasts of future proceeds on those pools, which reflect our judgments and various assumptions and estimates made quarterly. See accounting for income recognized on purchased debt discussed in detail in Note 2 to the condensed consolidated financial statements.
Accounting Estimates
The preparation of financial statements in conformity with GAAP requires management to make estimates and assumptions that affect the amounts reported in the financial statements and the accompanying notes. Actual results could differ from those estimates. Our condensed consolidated financial statements are based on a number of significant estimates, including the collectability of purchased debt and the timing of such proceeds. Due to the uncertainties inherent in the estimation process, it is at least reasonably possible that our estimates in connection with these items could be materially revised within the near term.
Goodwill and Intangible Assets
Goodwill represents the cost of acquired businesses in excess of the fair value assigned to the net tangible and identifiable intangible assets acquired. As prescribed by ASC Topic 350, Intangibles-Goodwill and Other, goodwill is not amortized. We review goodwill for impairment annually, or more frequently, if indicators of possible impairment arise. Potential impairment is indicated when the book value of a reporting unit, including goodwill, exceeds its fair value. Significant judgments are required to estimate the fair value of reporting units and intangible assets including estimating future cash flows, and determining appropriate discount rates, growth rates, and other assumptions. If potential impairment exists, the fair value of
46
the reporting unit is compared to the fair value of its assets and liabilities, excluding goodwill, to estimate the implied value of the reporting unit's goodwill. An impairment loss is recognized for any excess of the book value of the reporting unit's goodwill over the implied fair value.
In connection with the Acquisition, certain intangible assets were identified. The branch office intangible, with a value of $24.9 million, was deemed to have an indefinite life and, therefore, is not being amortized. We perform an impairment test annually, or more frequently, if events or changes in circumstances indicate impairment of intangible assets. We also annually evaluate the remaining useful life of the branch office intangible to determine whether events and circumstances continue to support the indefinite life assertion. Our judgments regarding the existence of impairment indicators and future cash flows related to intangible assets are based on operational performance of our businesses, market conditions and other factors.
Income Taxes
The Company uses the liability method of accounting for income taxes in accordance with the authoritative guidance for income taxes. When the Company prepares its condensed consolidated financial statements, it estimates income taxes based on the various jurisdictions where it conducts business. This requires the Company to estimate current tax exposure and to assess temporary differences that result from differing treatments of certain items for tax and accounting purposes. Deferred income taxes are recognized based on the difference between the financial statements and income tax bases of assets and liabilities using the enacted tax rates in effect for the year in which the differences are expected to reverse. The Company then assesses the likelihood that deferred tax assets will be realized. Valuation allowances are established, when necessary, to reduce deferred tax assets to the amount expected to be realized. When the Company establishes a valuation allowance or increases this allowance in an accounting period, it records a corresponding tax expense in the condensed consolidated statements of operations. The Company includes interest and penalties related to the income taxes within its provision for income taxes. See Note 8 for additional discussion of income taxes.
Management must make significant judgments to determine the provision for income taxes, deferred tax assets and liabilities, and any valuation allowance to be recorded against the deferred tax assets.
Item 3. Quantitative and Qualitative Disclosure About Market Risk.
Market Risk
We are exposed to various types of market risk in the normal course of business, including the impact of interest rate changes, foreign currency exchange rate fluctuations, changes in corporate tax rates, and inflation. From time to time, we employ risk management strategies that may include the use of derivatives, such as interest rate swap agreements. We do not enter into derivatives for trading purposes.
For additional discussion of market risks affecting SquareTwo Financial, see "Quantitative and Qualitative Disclosure About Market Risk" in our Annual Report on Form 10-K. Our exposure to market risk has not changed materially since the filing of our most recent Annual Report on Form 10-K.
Item 4. Controls and Procedures.
Under the supervision and with the participation of our management, including the Chief Executive Officer and Chief Financial Officer, we have evaluated the effectiveness of our disclosure controls and procedures (as such term is defined in Rules 13a-15(e) and 15d-15(e) under the Securities Exchange Act of 1934) as of the end of the period covered by this report. Based on that evaluation, the Chief Executive Officer and Chief Financial Officer have concluded that these disclosure controls and procedures were effective as of the end of the period covered by this report. There were no changes in our internal control over financial reporting during the three months ended March 31, 2015 that have materially affected, or are reasonably likely to materially affect, our internal control over financial reporting.
47
PART II
Item 1. Legal Proceedings.
From time to time the Company is a defendant in ordinary routine litigation alleging violations of applicable state and federal laws by the Company or the branch offices acting on its behalf that is incidental to our business. These suits may include actions which may purport to be on behalf of a class of consumers. While the litigation and regulatory environment is challenging and continually changing, for the Company, our branch offices and our industry, in our opinion, such matters will not individually, or in the aggregate, result in a materially adverse effect on the Company's financial position, results of operations or cash flows. Management believes the range of reasonably possible loss for outstanding claims beyond those previously accrued is between zero and $1.5 million. The Company accrues for loss contingencies as they become probable and estimable.
Item 1A. Risk Factors.
In addition to the other information set forth in this report, you should carefully consider the factors discussed in the section entitled "Risk Factors" in our most recent Annual Report on Form 10-K.
There have been no material changes to risk factors previously disclosed in our most recent Annual Report on Form 10-K.
Item 2. Unregistered Sales of Equity Securities and Use of Proceeds.
None.
Item 3. Defaults Upon Senior Securities.
None.
Item 4. Mine Safety Disclosures.
Not applicable.
Item 5. Other Information.
None.
48
Item 6. Exhibits.
Exhibit No. | Description |
31.1 | Certification of Principal Executive Officer pursuant to Section 302 of the Sarbanes Oxley Act of 2002 |
31.2 | Certification of Principal Financial Officer pursuant to Section 302 of the Sarbanes Oxley Act of 2002 |
32.1 | Certification of Principal Executive Officer and Principal Financial Officer pursuant to Section 906 of the Sarbanes Oxley Act of 2002 |
101.INS | XBRL Instance Document |
101.SCH | XBRL Taxonomy Extension Schema Document |
101.CAL | XBRL Taxonomy Extension Calculation Linkbase Document |
101.DEF | XBRL Taxonomy Extension Definition Linkbase Document |
101.LAB | XBRL Taxonomy Extension Label Linkbase Document |
101.PRE | XBRL Taxonomy Extension Presentation Linkbase Document |
49
SIGNATURES
Pursuant to the requirements of Section 13 or 15(d) of the Securities Exchange Act of 1934, the registrant has duly caused this report to be signed on its behalf by the undersigned, thereunto duly authorized.
SQUARETWO FINANCIAL CORPORATION | ||
May 14, 2015 | By: | /s/ Paul A. Larkins |
Name: | Paul A. Larkins | |
Title: | Chief Executive Officer | |
(Principal Executive Officer) | ||
May 14, 2015 | By: | /s/ John D. Lowe |
Name: | John D. Lowe | |
Title: | Senior Vice President and Chief Financial Officer | |
(Principal Financial and Accounting Officer) | ||
50