Attached files
| file | filename |
|---|---|
| 8-K - FORM 8-K - WESTWOOD HOLDINGS GROUP INC | d8k.htm |
 Westwood
Holdings Group, Inc. Investment Management & Specialty Finance Conference
June 7, 2011
Brian O. Casey
President &
Chief Executive Officer
Susan M. Byrne
Chairman &
Co-Chief Investment Officer
Exhibit 99.1 |
 Forward
– Looking Statements
Statements in this presentation that are not purely historical facts, including statements
about our expected future financial position, preliminary estimates, results of
operations or cash flows, as well as other statements including words such as
“anticipate,” “believe,”
“plan,”
“estimate,”
“expect,”
“intend,”
“should,”
“could,”
“goal,”
“target,”
“designed,”
“on track,”
“comfortable with,”
“optimistic”
and other similar expressions, constitute forward-
looking statements within the meaning of Section 27A of the Securities Act of 1933, as
amended, and Section 21E of the Securities Exchange Act of 1934, as amended.
Actual results and the timing of some events could differ materially from those projected in or contemplated by the forward-
looking statements due to a number of factors, including, without limitation, those set forth
below: •
our ability to identify and successfully market services that appeal to our customers;
•
the significant concentration of our revenues in four of our customers;
•
our relationships with investment consulting firms;
•
our relationships with current and potential customers;
•
our ability to retain qualified personnel;
•
our ability to successfully develop and market new asset classes;
•
our ability to maintain our fee structure in light of competitive fee pressures;
•
competition in the marketplace;
•
downturn in the financial markets;
•
the passage of legislation adversely affecting the financial services industries;
•
interest rates;
•
changes in our effective tax rate;
•
our ability to maintain an effective system of internal controls; and
•
the other risks detailed from time to time in our SEC reports.
Additional
factors
that
could
cause
our
actual
results
to
differ
materially
from
our
expectations
are
discussed
under
the
section
entitled
“Risk
Factors”
in our Form 10-K for the year ended December 31, 2010, which together with our other
filings can be viewed at www.sec.gov. You should not unduly rely on these
forward-looking statements. Except as required by law, we are not obligated to publicly release any revisions to these forward-looking
statements. |
 Agenda
I.
Firm Overview
II.
Investment Process & Products
III.
Growth Opportunities
IV.
Financial Highlights
V.
Summary |
 Firm
Overview |
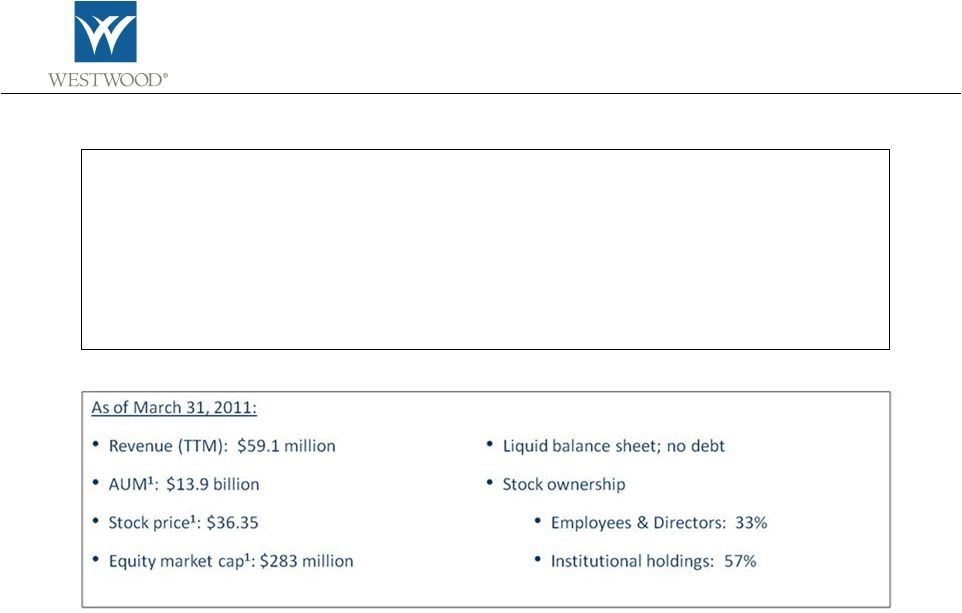 Westwood
Overview •
Asset management firm focused on Value & Income investment strategies
•
Serving institutional, private client and mutual fund investors since 1983
•
Track record of providing strong long-term risk-adjusted returns
•
Client-centered culture; interests aligned with equity-based incentives
•
Publicly traded since 2002 (NYSE : WHG)
Page 1
1
as of May 31, 2011 |
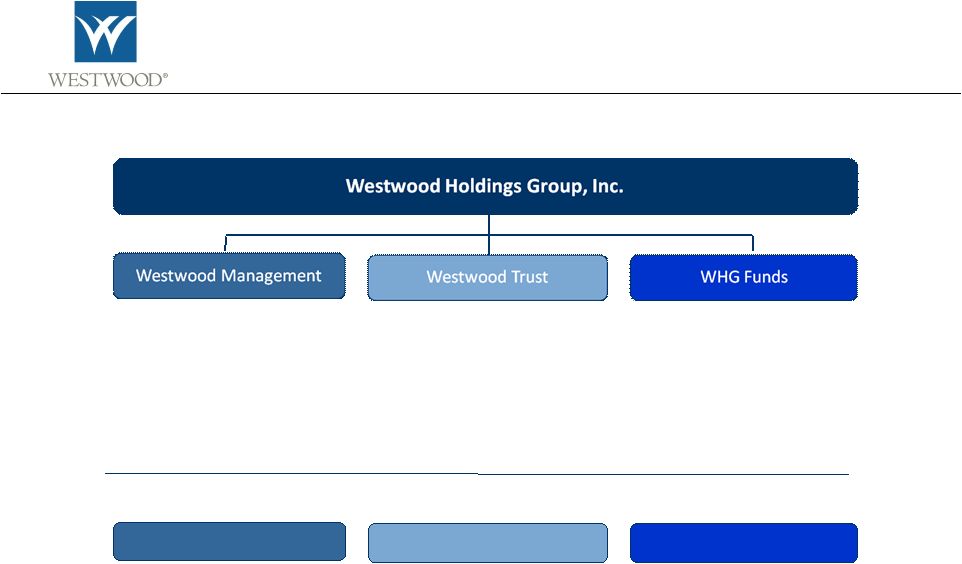 Product
Distribution •
Separately managed portfolios
•
Subadvisory
•
Collective funds
•
Targeted consultant
relationships
•
Subadvisory partners
•
Plan sponsor direct marketing
•
Enhanced
Balanced
TM
asset
allocation model
•
Commingled funds
•
Separately managed portfolios
•
Tax-managed accounts
•
Client referrals
•
Third party referral sources
•
Local community involvement
•
Capped expense ratios
•
Institutional share class
•
Defined contribution plans
•
Other institutions
•
A share class
•
Mutual fund supermarkets
•
DC consultants
•
Private Wealth Advisors
•
Media
Page 2
Distribution Channels
Institutional
Private Wealth
Mutual Funds |
 Investment
Process & Products |
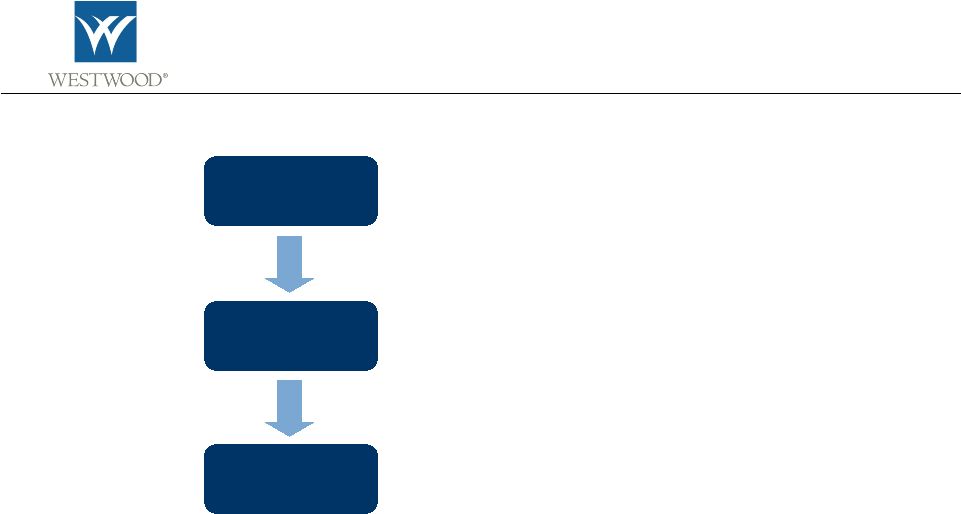 Overview of
Investment Process Qualities that Westwood analysts look for in securities:
•
Strong free cash flow characteristics
•
Stable to improving return on equity
•
Improving balance sheet
•
Upside earnings surprise without corresponding change in consensus estimates
Portfolio
Teams
Research
Analysts
•
Idea generation
•
Proprietary fundamental research
•
Make buy & sell recommendations
4 Research
Groups
•
Led by senior analysts
•
Weekly due diligence meetings to review analyst recommendations
•
Approved securities move to list of portfolio candidates
•
At least one member from each Research Group
•
Weekly meetings to review portfolio and new names
•
Makes buy and sell decisions and manages portfolio risk
Page 3
Team-based approach with risk analysis incorporated at every level
|
 *Due
to
capacity
constraints,
this
product
closed
to
new
investors
effective
October
1,
2009.
Performance
provided
reflects
the
institutional
track
record
which
started
January
1,
2002.
In
2001,
Westwood
transitioned
a
midcap
core
equity
strategy
to
the
institutional
SMidCap
strategy.
The
midcap
core
portfolio
was
exclusively
offered
to
private
clients
of
Westwood's
Trust
Company.
This
change
occurred
as
a
result
of
the
increased
demand
we
observed
by
institutional
investors.
January
1,
2002reflects
the
inception
of
the
institutional
SMidCap
Equity
strategy.
The
true
inception
date
of
the
composite
is
7/1/97.
This
strategy
has
consistently
adhered
to
Westwood's
investment
process
and
philosophy.
Past
performance
is
not
a
guarantee
of
future
returns.
Returns
are
preliminary
and
are
subject
to
change.
Please
see
appendix
for
full
performance
disclosures
(http://westwoodgroup.com/disclaimers.pdf).
The
disclosures
provided
are
considered
an
integral
part
of
this
presentation.
Benchmark
DataSource:
©
2011
MellonAnalytical
Solutions,
LLC.
All
Rights
Reserved.
Investment Product Performance vs. Benchmark
Through March 31, 2011
Page 4
Our investment teams have delivered excess returns across Value & Income
products…
…with lower risk than their benchmarks |
 Growth
Opportunities |
 Growth
Opportunities •
Significant capacity remains in seasoned products
o
Opportunity for operating leverage is substantial
•
Subadvisory mandates
o
Access to broad distribution infrastructure & global markets
o
Support partner distribution network vs. building proprietary distribution network
•
WHG Funds
o
Seven mutual funds managed by Westwood Management
o
Strong organic growth; assets under management currently exceed $1.2 billion
o
WHG Dividend Growth Fund added via McCarthy acquisition
o
Asset acquisition opportunities
•
Private Wealth
o
Westwood Trust product development and asset gathering platform
o
Leverage referral sources
o
Expand
private
wealth
platform
in
new
markets
–
i.e.
McCarthy
Group
Advisors
(Omaha)
Page 5 |
 Corporate
Development Opportunities We seek to augment organic growth by pursuing strategic
opportunities •
Mutual fund asset acquisition opportunities
o
Adds scale to WHG Funds
o
Incrementally profitable –
minimal ongoing costs
o
Benefits fund shareholders via expense ratio reduction opportunities
•
Private wealth
o
Expand private wealth platform in new markets
o
Acquire relationship managers and asset gatherers
•
Acquire additional products and research capabilities
o
International
o
Emerging Markets
o
Global
Page 6 |
 Completed
Acquisitions Philadelphia
Fund
–
November
2009
o
$52 million AUM LargeCap Value fund (PHILX)
o
Merged into WHG LargeCap Value Fund (WHGLX)
o
Incremental scale and profitability for WHG Funds
o
Accretive purchase, low risk assets
McCarthy
Group
Advisors
–
November
2010
o
$1.1 billion AUM private wealth firm based in Omaha
o
Talented professionals with excellent reputation; loyal client base
o
Provides access to vibrant, underserved wealth market
o
Principals want to continue to grow the company
o
Addition to WHG Funds lineup –
WHG Dividend Growth Fund (WHGDX); $68 million as of 12/31/10
Page 7 |
 International
Product Expansion We are exploring multiple opportunities to broaden our product lineup
to include international/emerging markets/global portfolio management.
o
Demand from institutional investors continues to be strong
o
Scarcity
of
quality
managers
with
available
capacity,
especially
in
emerging
markets
o
Considering buy / build / hire options
Page 8 |
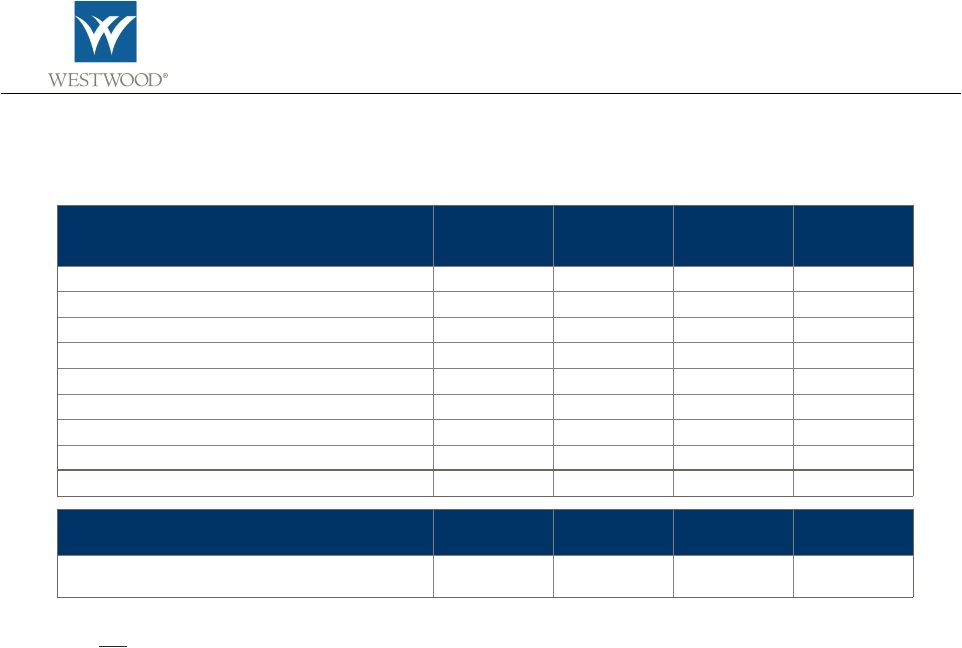 Significant
Product Capacity Remains Page 9
Seasoned Products
(>3 year track record & >$100 Million in assets)
Assets Under
Management
As of 5/31/11
Estimated
Maximum
Capacity AUM
Asset Growth
Potential
Product
Inception
LargeCap Value
$6.3 billion
$25 billion
$18.7 billion
1987
SMidCap Value
$3.0+ billion
$3 billion
Closed
1997
SMidCap Plus+
$430 million
$8 billion
$7.6 billion
2010
SmallCap Value
$245 million
$1.5 billion
$1.3 billion
2004
AllCap Value
$210 million
$10 billion
$9.8 billion
2002
Dividend Growth
$150 million
$20 billion
$19.9 billion
2001
Income Opportunity
$690 million
$2 billion
$1.3 billion
2003
MLP
$170 million
$1.5 billion
$1.3 billion
2003
Total Seasoned
$11.6 billion
$71 billion
$59 billion
Unseasoned (R&D) & Legacy Products
Balanced / Fixed Income / REIT / MidCap / LargeCap Enhanced /
Global Strategic Diversification
$678 million
N/A
N/A
Various
Note:
Table reflects Westwood Management AUM as of 5/31/11 (including Westwood Trust commingled
funds); excludes approximately $860 million in Westwood Trust separately managed
accounts, agency assets and subadvised commingled funds and $830 million of additional assets managed by Omaha office
Opportunity for asset growth and operating leverage are substantial
|
 Subadvisory
Page 10
Subadvisory opportunities –
attractive means for enhanced distribution of scalable products
•
Access to established distribution channels
•
Generally lower average fee, but high profitability due to low incremental costs
•
Current Westwood Subadvisory mandates |
 Growth in
Subadvisory Assets Page 11
We have added 5 relationships and increased Subadvisory assets by $841 million since Q1
2008 |
 Pictet &
Cie •
One of Europe’s oldest (founded in 1805) and largest ($418 B AUM) private banks
•
Selected Westwood to manage their first U.S. Value fund
•
Marketing tours to 15 European cities with Pictet since Spring 2010
Cities Visited:
Lugano, Milan, Paris, Zurich, Geneva, Lisbon, Madrid,
Luxembourg, Frankfurt, London, Helsinki, Stockholm, Amsterdam,
The
Hague & Vienna
•
Unique opportunity to introduce Westwood to significant new markets
•
Near-term
asset
expectations
are
modest
–
AUM
of
$216
million
at
5/31/11
•
Longer-term opportunity is substantial
Page 12 |
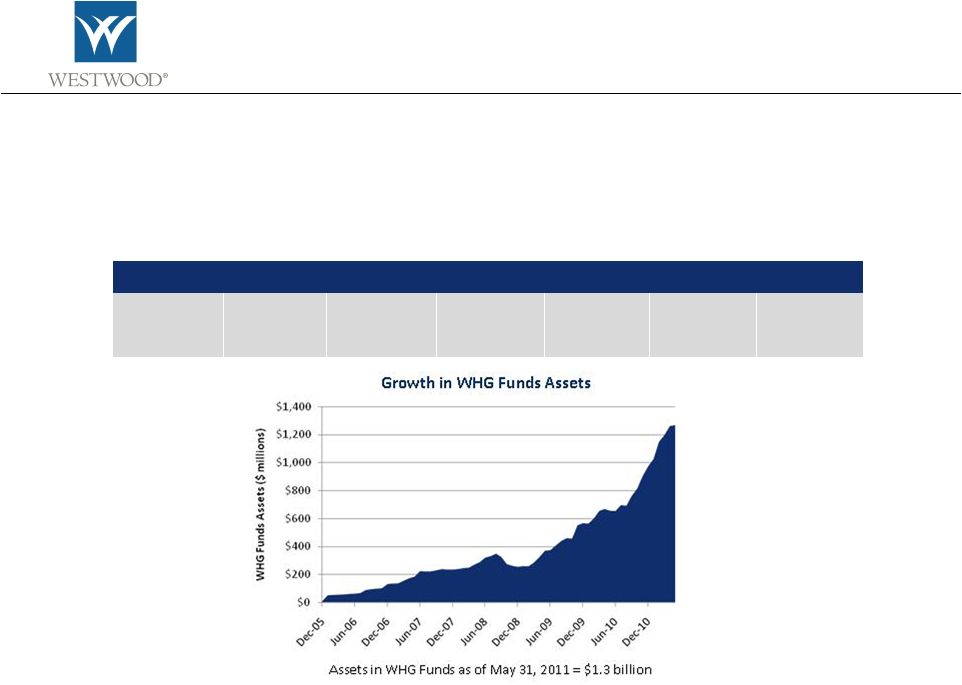 WHG
Funds Page 13
WHG Funds
•
Strong asset growth –
assets have grown to $1.3 billion from initial two fund launch in December 2005
•
Targeted primarily to institutional, defined contribution and RIA markets
Domestic Value & Income Strategies
LargeCap
Value
WHGLX
SMidCap
WHGMX
SMidCap
Plus+
WHGPX
SmallCap
Value
WHGSX
Dividend
Growth
WHGDX
Balanced
WHGBX
Income
Opportunity
WHGIX |
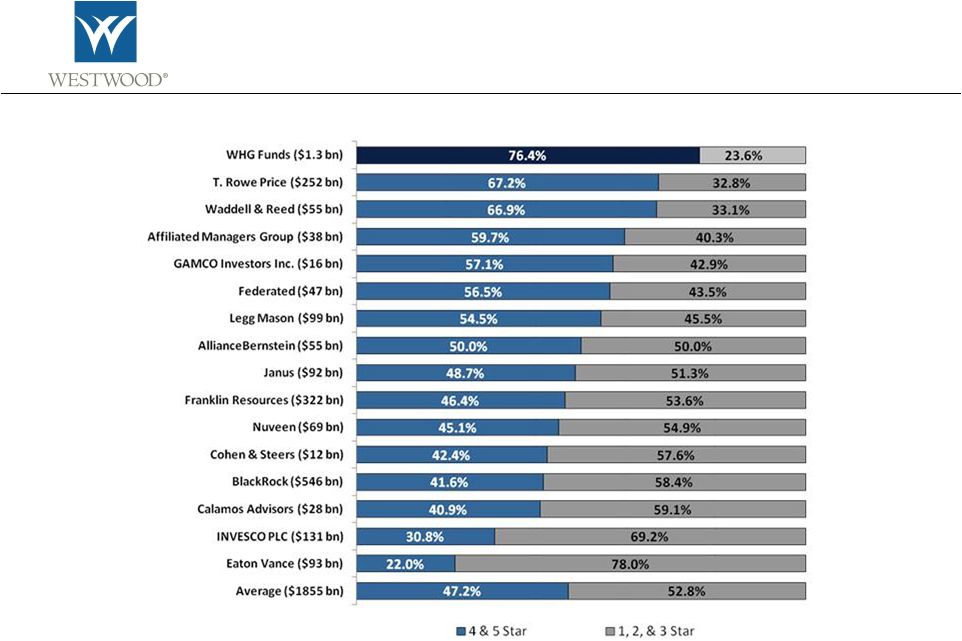 WHG Funds
– Morningstar Ratings
Proportion of Assets Rated Four or Five Star (Asset Weighted)
Page 14
Source: JPMorgan U.S. Asset Managers – North America Equity Research dated December
14, 2010; Strategic Insight.
WHG Funds
AUM as of 5/31/11 |
 Westwood
Trust – Private Wealth
Solid performance and a high rate of client retention
A comprehensive allocation strategy
–
Consultative approach
–
Low cost, efficient solution
–
Asset gathering platform
–
“Best Ideas”
Trust services
–
Establishes long-term trust relationship
–
Capable of serving multiple generations
International Growth
High Yield
International Value
Domestic Growth
–
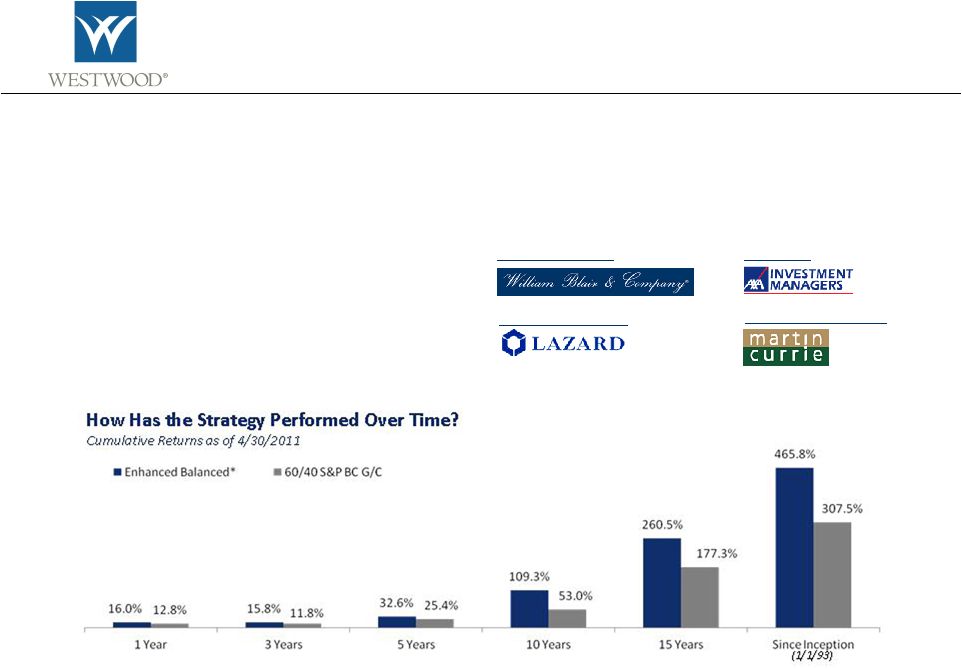
Enhanced Balanced™
asset allocation model consisting of
•
9 asset classes managed by Westwood Management
•
4 asset classes managed by subadvisors
*The Westwood Trust Representative Client is a representative account showing a client who has
been diversified among the available Westwood commingled funds throughout their term with Westwood. Past performance does not guarantee future results.
Stock
market conditions vary from year to year and can result in a decline in market value.
This information is provided for clients and prospective clients of Westwood Management Corp. and Westwood Trust only. This is not an offer or recommendation to buy or sell a
security or an economic sector.
Page 15 |
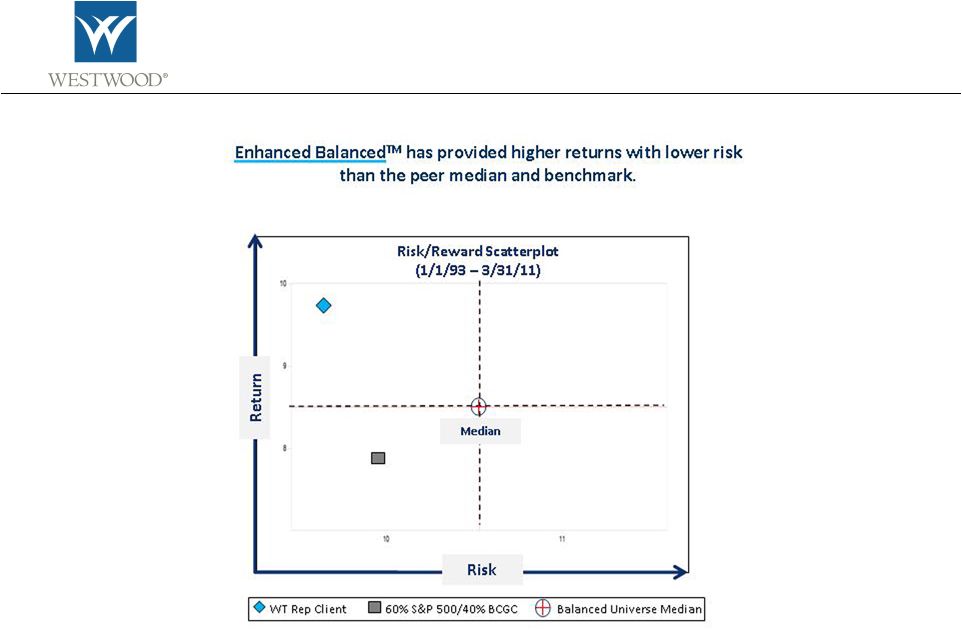 The eA US
Balanced/TAA Universe consists of 102 return sets. The Westwood Trust Representative Client is a representative account showing a client who has been diversified among the available
Westwood commingled funds throughout their term with Westwood.
Past performance does not guarantee future results.
Stock market conditions vary from year to year and can result in a decline in market
value. This information is provided for clients and prospective clients of Westwood Management Corp. and
Westwood Trust
only. This is not an offer or recommendation to buy or sell a security or an economic
sector. Westwood Trust –
Private Wealth
Enhanced Balanced™
Performance
Page 16 |
 Financial
Highlights |
 Growth in
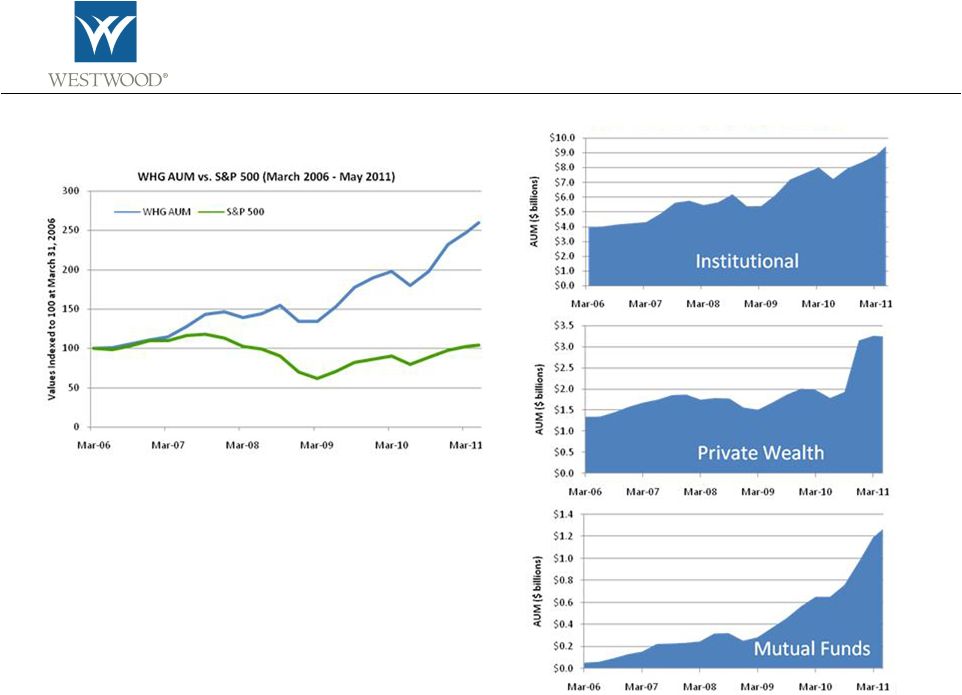
Assets Under Management •
5-year compound annual growth rate in AUM of 20%
•
Over this same period, the level of the S&P 500 index
has risen by 4%
•
Trailing five years net inflows of $4.2 billion
AUM Growth in a Challenging Environment
Total AUM at 5/31/11 = $13.9 Billion
Page 17 |
 Revenue
Growth (excluding performance-based fees)
Page 18
•
Consistent growth in asset-based fee revenue: 5-year CAGR of over 22%
•
The value of the S&P 500 index is essentially flat over this time period
|
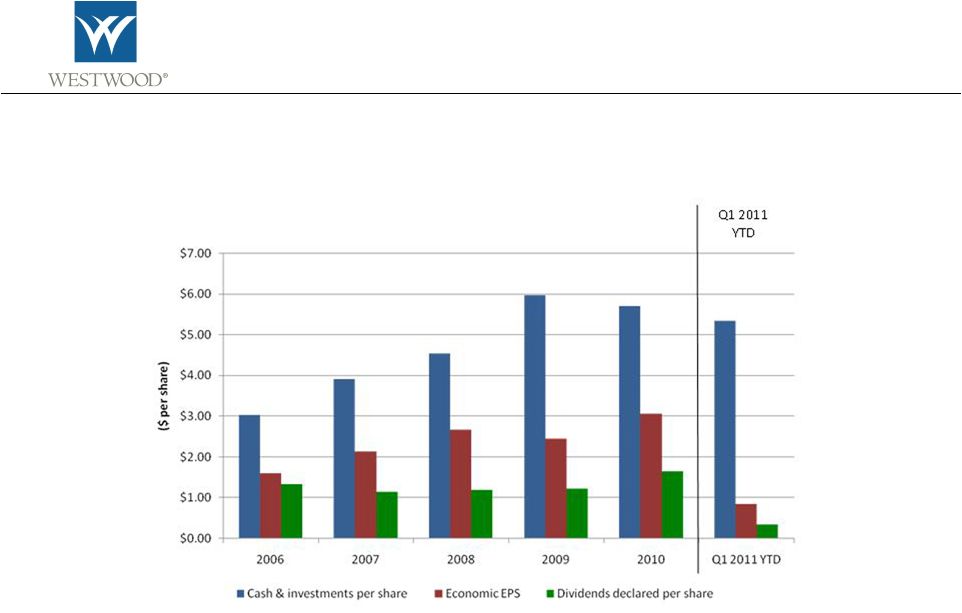 Economic EPS,
Dividends & Growing Cash Balances 2006 –
YTD Q1 2011
Cash & Liquid Investments as of March 31, 2011 were 107% higher than at year-end
2006 Note: 2007 and 2008 economic EPS include impact of performance fees of $3.0
million and $8.7 million, respectively; cash & investments excludes shares of
Teton Advisors, Inc. Page 19 |
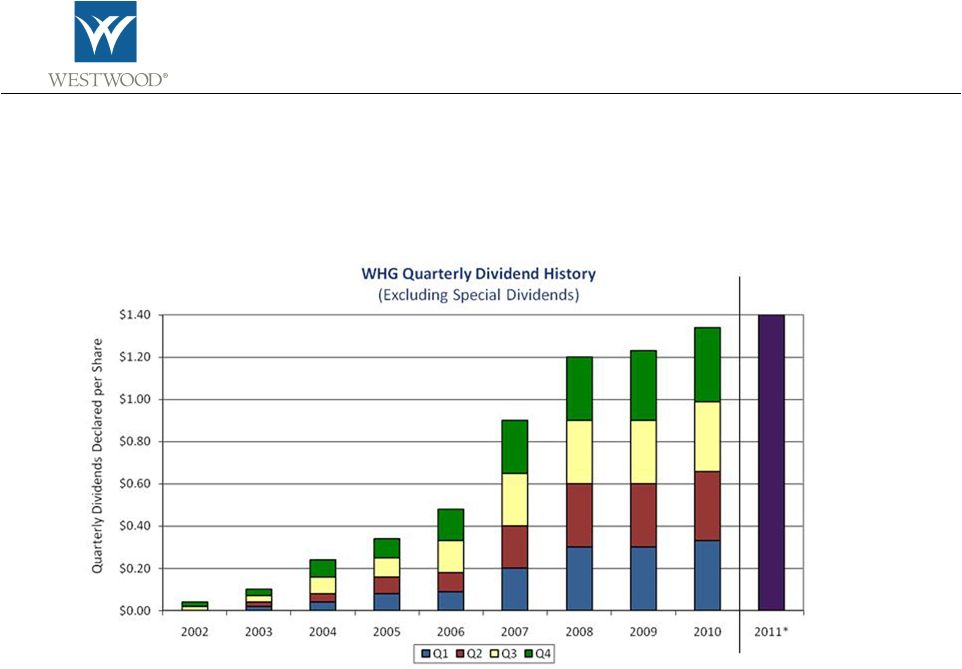 WHG Quarterly
Dividend History Page 20
•
We seek to share excess cash with shareholders
•
Dividends declared since 2002: $70 million ($10.56 per share)
•
3.9% yield as of May 31, 2011 close at $1.40 annualized dividend rate
*Annualized
based on
quarterly
dividend of
$0.35 per share |
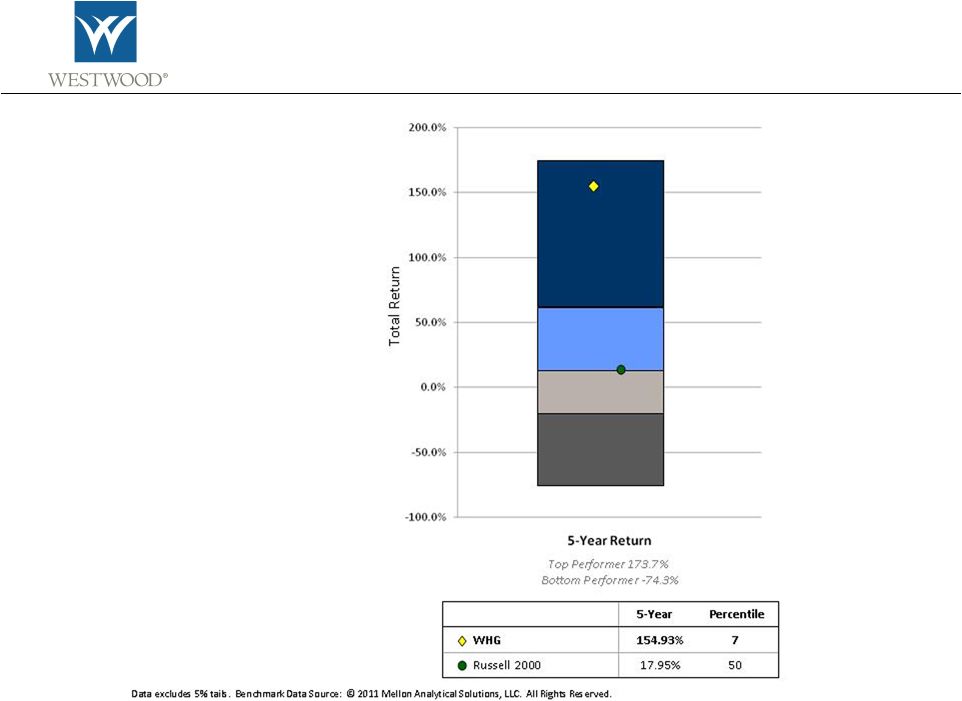 WHG Stock
Performance vs. NYSE Listed Companies as of 3/31/11
Page 21 |
 Ownership
& Results Page 22
Equity-based compensation is a critical part of our compensation program
•
Aligns employees’
interests with clients and shareholders
•
Attracts and retains talented individuals and teams
•
Very high retention of key personnel
•
Transparency of public company structure allows broad dissemination of key financial metrics
to all employee shareholders
•
Restricted stock recipients have voting rights and receive dividends upon vesting
Results
•
Strong product performance.
Key products have outperformed respective benchmarks over
trailing 5-year period as of March 31, 2011.
•
Growth in assets under management.
AUM has increased by 200% from June 2002 spin-off to
May 31, 2011.
•
Increased shareholder value.
Market value has increased from $75 million at June 2002 to $313
million at March 31, 2011 –
a total return of 362% compared to 111% for the Russell 2000 index
over the same period.
•
Excess cash returned to shareholders through dividends.
We have declared $70 million in
dividends to shareholders since June 2002. |
 Importance of
Alignment Page 23
•
We have long believed that our ownership model and employee compensation program
provide effective alignment of employees’
interests with clients and shareholders.
•
A recent study by Casey Quirk reveals evidence that employee ownership and low employee
turnover are positively correlated with better business performance.
•
Firms with low employee turnover produced 3-7% higher compounded revenue growth
over the 2003-2009 study period compared to firms with high employee turnover.
•
Firms with employee ownership produced 3.4% higher compounded revenue growth
over the study period compared to firms with no employee ownership.
•
The
Casey
Quirk/eVestment
Alliance
2010
Consultant
Survey
indicates
that
strong
alignment
has
become
a
critical
selection
criteria
for
gatekeepers.
•
92% of consultants surveyed responded that alignment issues are part of their manager
search criteria.
•
The two most important alignment issues for survey respondents were ownership
structure and long-term incentives. |
 Summary
|
 Summary of
Strategic Priorities Ongoing Priorities
•
Serve clients attentively
•
Generate competitive investment performance
•
Service consultant relationships
•
Leverage referral sources at Westwood Trust
•
WHG stock –
increase visibility; diversify/broaden ownership
Near Term Priorities
•
Leverage investment management expertise with distribution partners (Subadvisory)
•
Expand awareness of WHG Funds with Private Wealth Advisory firms
and Defined Contribution
Consultants
•
Invest in client reporting, branding, work environment and technology enhancements
•
Cultivate new “R&D”
products
•
Corporate development opportunities
•
Pursue International, Emerging Markets and Global investment management capabilities
Page 24 |
 www.westwoodgroup.com
200
Crescent
Court
Suite
1200
Dallas,
Texas
75201
T. 214.756.6900
*
*
*
*
*
*
*
*
*
*
*
*
*
*
*
*
*
*
*
*
*
*
*
*
*
*
*
*
*
*
*
*
* |
 Disclosures |
 Economic
Earnings Reconciliation Economic Earnings Reconciliation
($ thousands)
2006
2007
2008
2009
2010
Q1 2011
GAAP net income
4,508
$
7,944
$
10,543
$
7,895
$
11,280
$
3,549
$
Add: Restricted stock expense
4,500
5,316
6,735
7,666
9,269
2,383
Add: Stock option expense
126
-
-
-
-
-
Add: Intangible amortization
-
-
-
13
155
125
Add: Tax benefit from goodwill amortization
-
-
-
5
59
52
Less: Cumulative effect of change in accounting
principle
(39)
-
-
-
-
-
Non-GAAP economic earnings
9,095
$
13,260
$
17,278
$
15,579
$
20,763
$
6,109
$
Diluted shares
5,690,455
6,199,669
6,451,468
6,366,988
6,795,351
7,166,577
Economic EPS
1.60
$
2.14
$
2.68
$
2.45
$
3.06
$
0.85
$
|
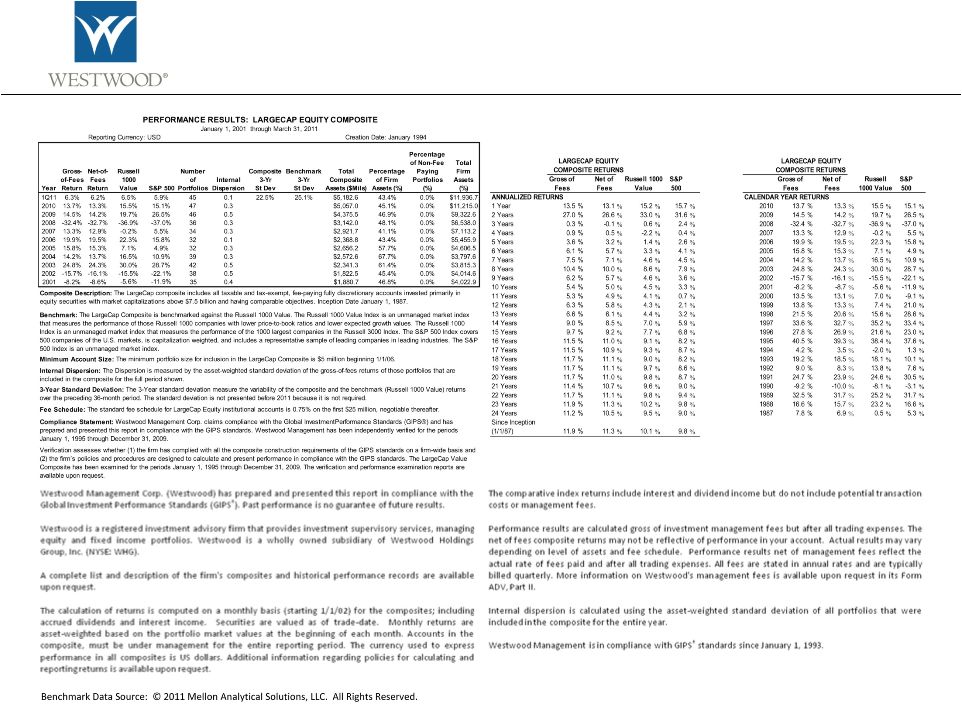 LargeCap
Value Disclosure Information |
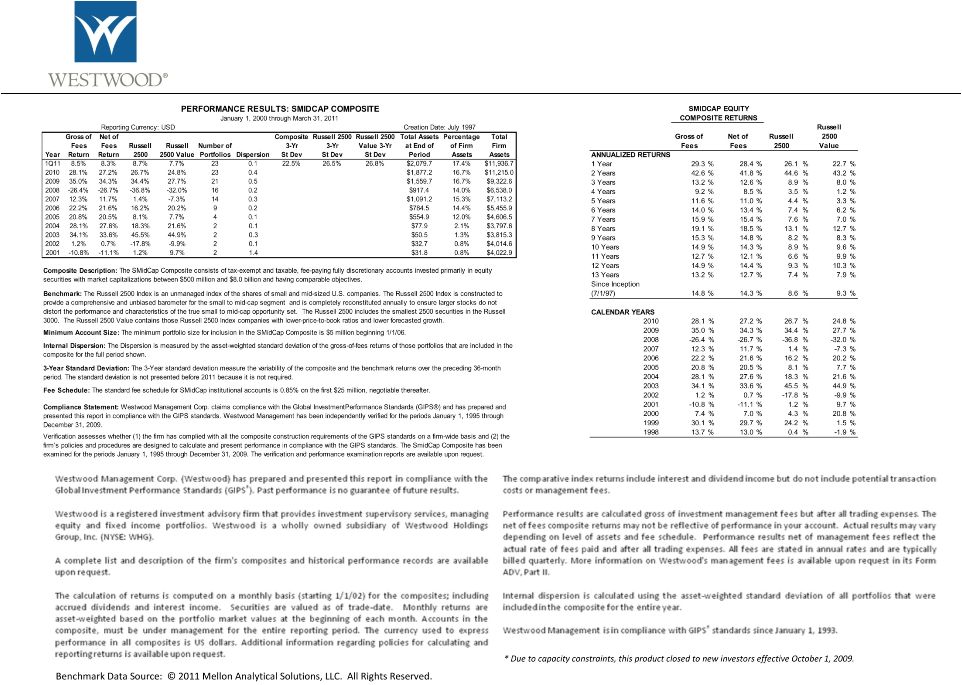 SMidCap Value
Disclosure Information* |
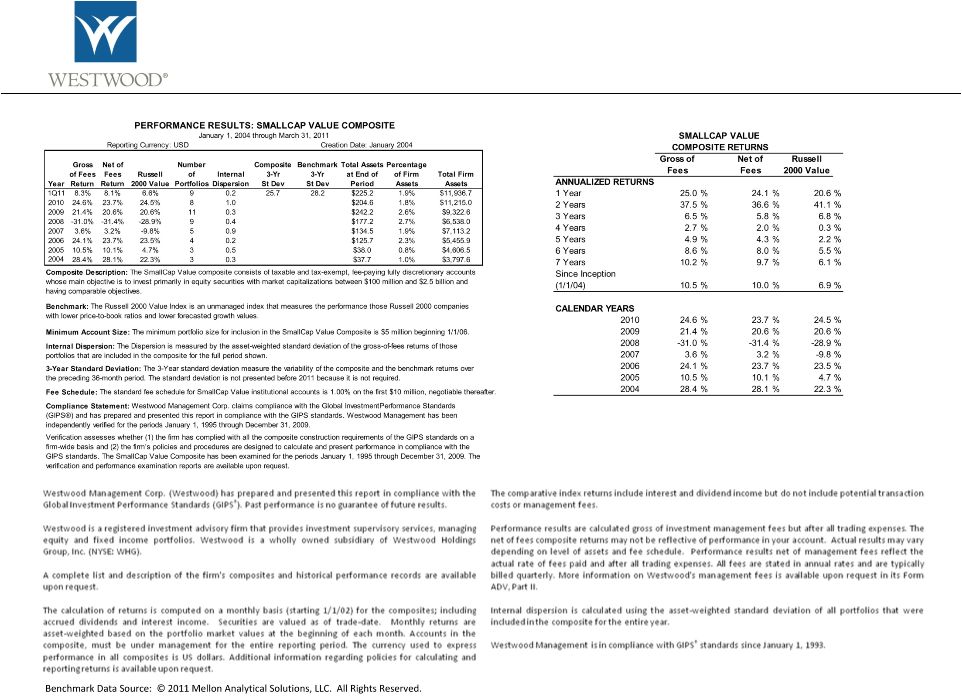 SmallCap
Value Disclosure Information |
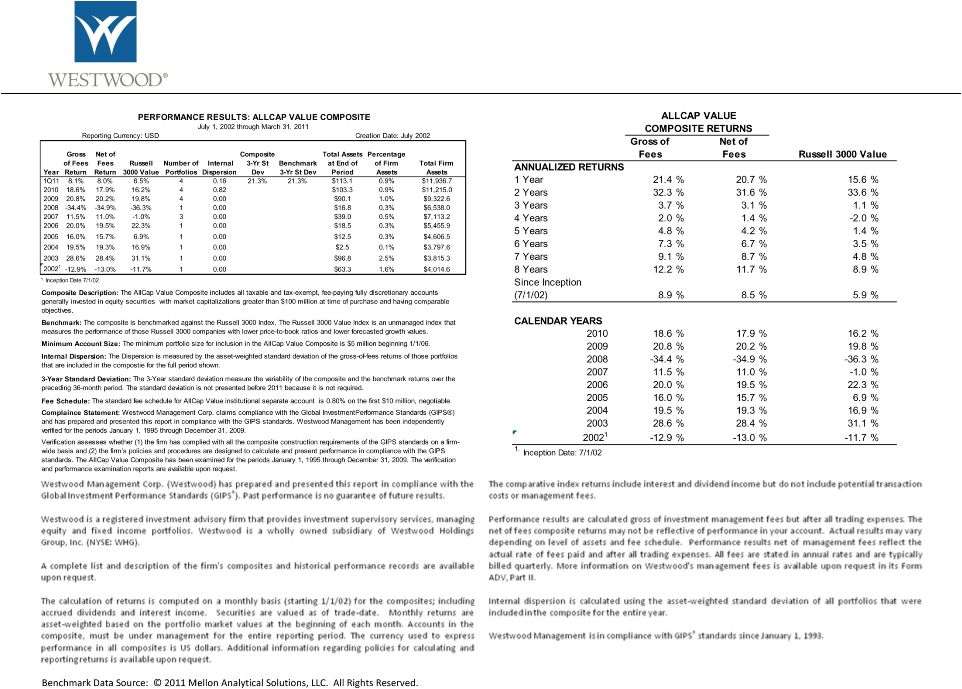 AllCap Value
Disclosure Information |
 Income
Opportunity Disclosure Information |
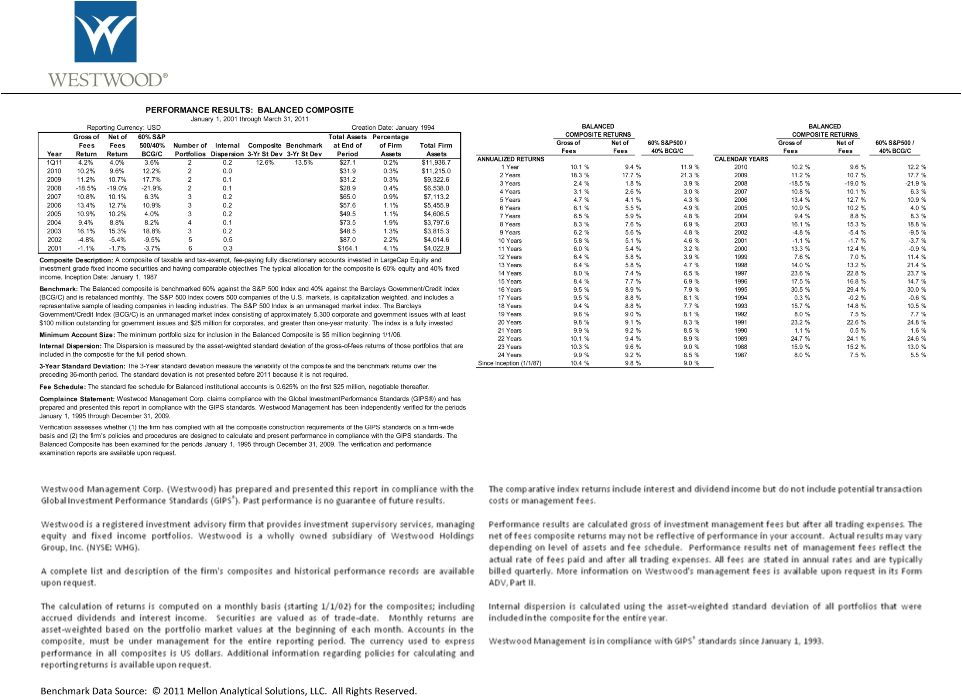 Balanced
Disclosure Information |
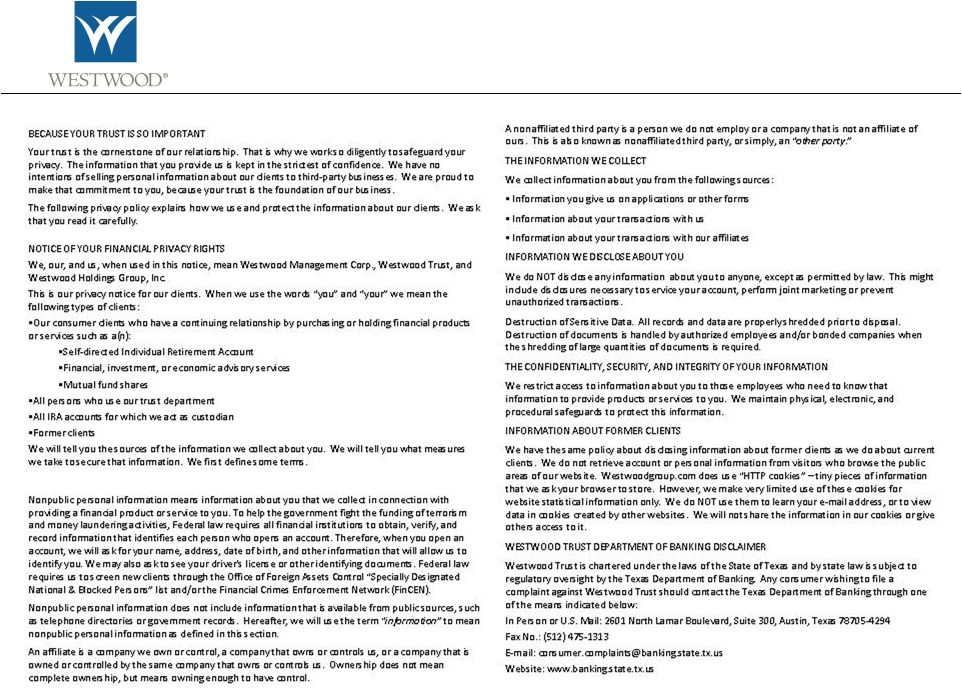 IMPORTANT
INFORMATION ABOUT YOUR PRIVACY |