Attached files
| file | filename |
|---|---|
| 8-K - FORM 8-K - Noranda Aluminum Holding CORP | d8k.htm |
 Post Q1 2011
Investor Meetings |
 The following
information contains, or may be deemed to contain, "forward-looking
statements" (as defined in the U.S. Private Securities Litigation Reform Act of
1995). By their nature, forward-looking statements involve risks and uncertainties
because they relate to events and depend on circumstances that may or may not occur in
the future. The future results of Noranda may vary from the results expressed in, or
implied by, the following forward looking statements, possibly to a material degree. For
a discussion of some of the important factors that could cause the Noranda results to
differ from those
expressed in, or implied by, the following forward-looking statements, please
refer to our filings with the SEC, including our annual report on Form 10-K.
Forward Looking Statements
2 |
 Mr. Mahoney
was appointed Chief Financial Officer in May 2009 Mr. Mahoney has over 24 years of
cyclical industry experience in senior financial management positions for semiconductor
and electrical components companies including Hi-P International
Limited and Molex Inc.
Mr. Mahoney received a BA in Economics and History from the
University of Virginia and an MBA from the University of Michigan
President
and
Chief Executive
Officer
Robert B. Mahoney
Mr. Smith was appointed President, Chief Executive Officer and
Director in 2008
Mr. Smith has diverse leadership experience, including various
management assignments with The Dow Chemical Company and
positions as COO of Resolution Performance Products and CEO of
Covalence Specialty Materials
Mr. Smith holds a BA in Chemistry and an MBA from Harvard
University
Layle “Kip”
Smith
3
Management Attendees
Chief Financial
Officer |
 •
Global economic growth drives positive aluminum fundamentals
•
Our operating model is leveraged to the aluminum prices
–
We are fully integrated, from bauxite to aluminum foil
–
We have cost effective, globally competitive assets
–
We choose to manage with a focus on productivity
–
We drive a value-added growth strategy
•
We have financial capacity and flexibility to support growth
–
We have a highly flexible capital structure with no near-term maturities, undrawn
revolver and no maintenance covenants
–
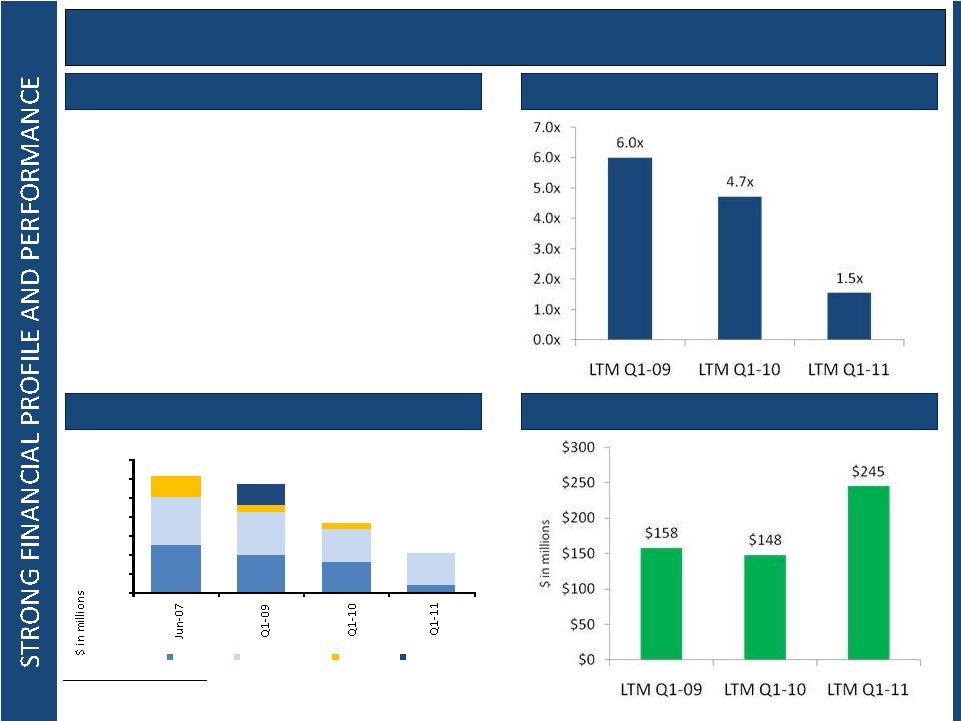
Our ratio of net debt to LTM adjusted EBITDA was 1.5x at Q1 2011
Key Investment Messages
4 |
 5
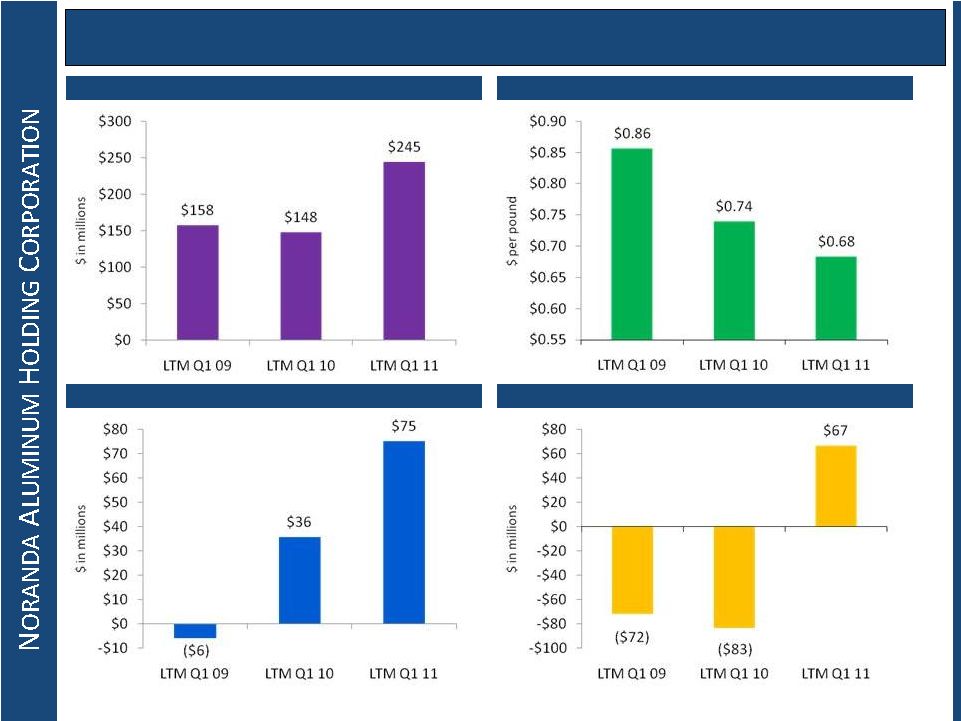
Produced Financial Success in 2010, Continued in Q1 2011
LTM Net Income Excluding Special Items
LTM Operating Cash Flow, Excluding Aluminum Hedges
LTM Integrated Primary Aluminum Net Cash Cost
LTM Adjusted EBITDA |
 Key Investment
Highlights We are well positioned to take advantage of favorable medium-
and long-term fundamentals
Integrated,
Cost Effective
Assets
Profitable Growth
& Productivity
Experienced
Management
Team
Favorable
Industry
Dynamics
Strong
Financial
Profile and
Performance |
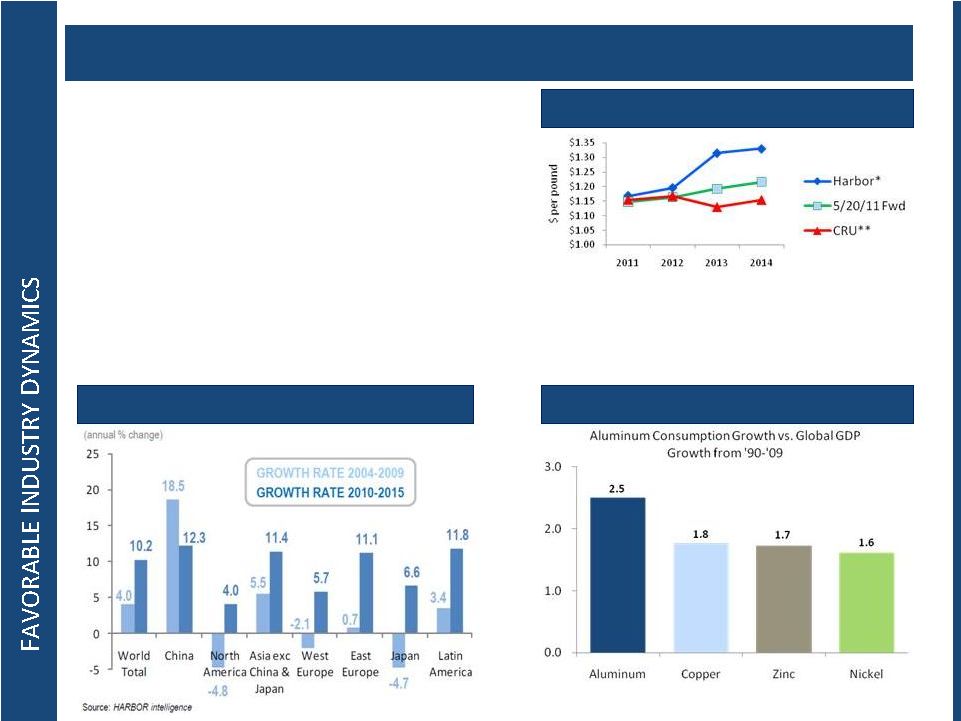 •
Global aluminum demand is expected to
continue to grow
–
Global economic growth
–
Higher standards of living and increased
demand from emerging markets
•
Aluminum is highly correlated with GDP
growth
–
Favorable substitution trends
–
Rapid urbanization
–
Environmental consciousness
*Source: Harbor Intelligence; 5 Al analysts most accurate from 2001
through 2010, as of May 19, 2011.
** Source: CRU Aluminum Quarterly, as of April 26, 2010.
Global economic growth drives positive aluminum fundamentals
Forecasts of Average Annual LME
Beta to Global GDP
7
Regional Global Aluminum Demand Forecast
Source: CRU |
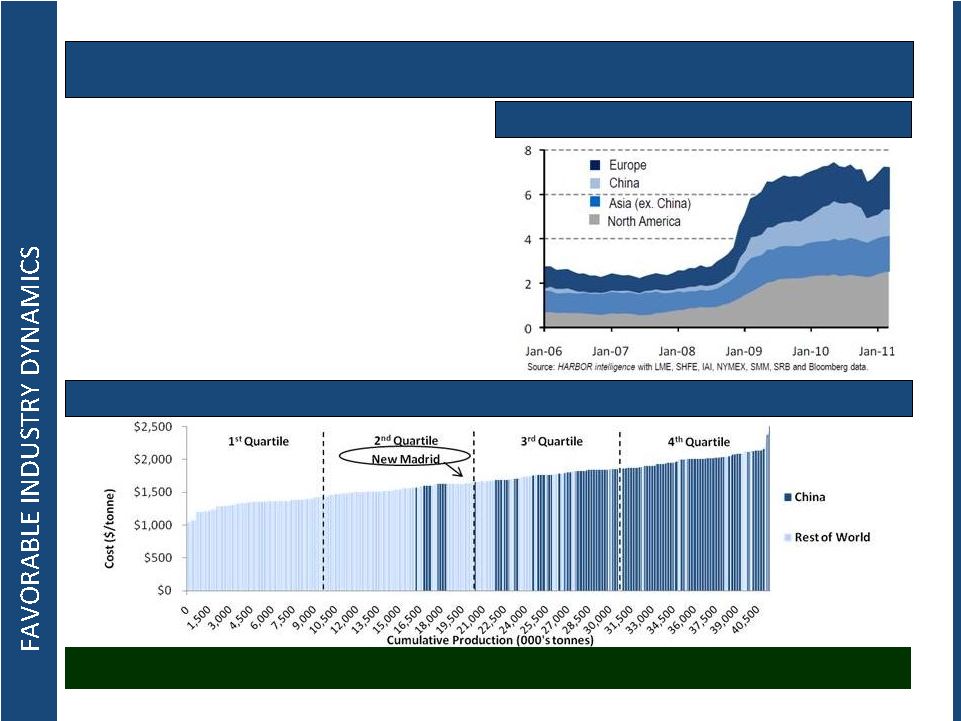 World
Aluminum
Smelter
Business
Costs
for
2010
(1)
8
•
Though aluminum inventory levels
remain elevated, physical availability is
tight, indicating inventories supported
by financing arrangements
•
Rising global smelter costs help to
place a natural
floor for the aluminum
metal price
New Madrid smelter is in 2
nd
quartile
“Cost push”
and supply constraints expected to support LME prices
(1)
CRU Data March 14, 2011.
Visible Aluminum Inventories by Region (mmt) |
 Key Investment
Highlights Exhibited significant ability to create value across the cycle
9
Integrated,
Cost Effective
Assets
Profitable Growth
& Productivity
Experienced
Management
Team
Favorable
Industry
Dynamics
Strong
Financial
Profile and
Performance |
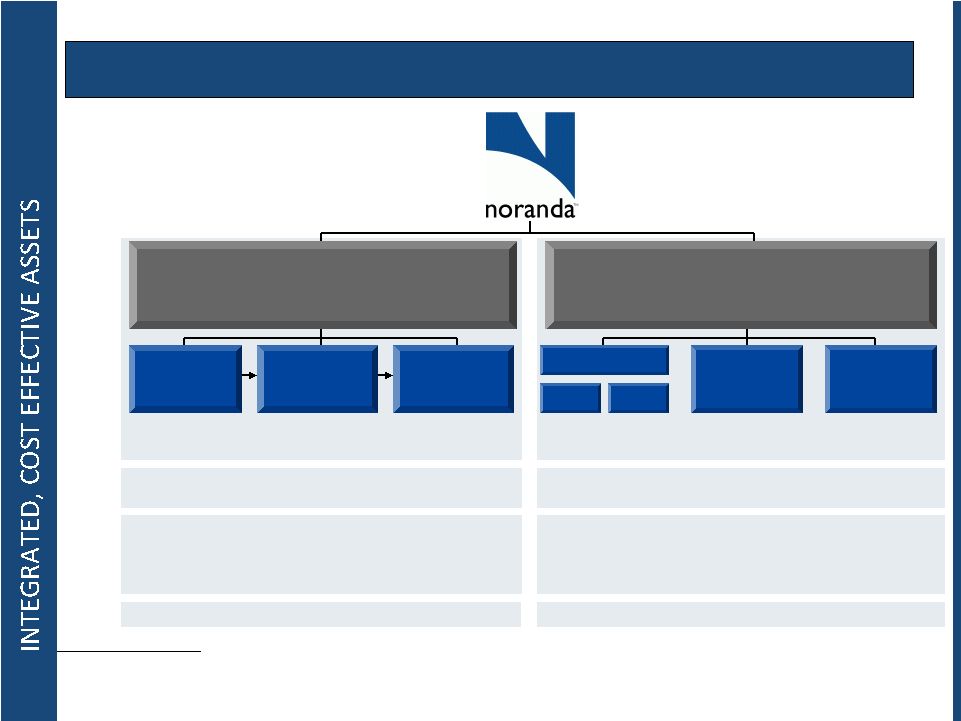 Downstream Business
Annual Capacity: 495mm lbs
(2)
St. Ann
Bauxite Mine
New Madrid
Aluminum
Smelter
Newport
Rolling Mills
Salisbury
Rolling Mills
East
Mill
West
Mill
Huntingdon
Rolling Mills
Bauxite
Discovery Bay,
Jamaica
4.5mm Mt
Alumina
Gramercy, LA
1.2mm Mt
Aluminum
Primary Metal
New Madrid, MO
263k
Mt
(580mm
lbs)
(1)
Fin stock (HVAC) and Auto, Semi-Rigid Container Stock, Flexible Packaging,
Transformer Windings
Huntingdon, TN
Huntingdon
West
235mm
lbs
(2)
Huntingdon
East
130mm
lbs
(2)
Newport, AR
35mm
lbs
(2)
Salisbury, NC
95mm
lbs
(2)
Products:
Location:
Annual
Capacity:
Upstream Business
Upstream Business
Annual Capacity: 580mm lbs
LTM Q1 2011 Cash Cost was $0.68
Gramercy
Refinery
Revenue
Drivers:
Volume & LME
Residential construction / remodeling, packaging, U.S. consumer
(1)
According to CRU’s March 2011 production forecasts, at full capacity New Madrid
represents 15% of U.S. primary aluminum production. (2)
Maximum capacity, with actual capacity depending upon production mix.
Noranda’s Integrated Footprint
10 |
 Vertically
Integrated Upstream Business Primary
Aluminum
Alumina
Noranda
Bauxite
Mine
Noranda
Alumina
Refinery
New Madrid
Primary Aluminum
Smelter
Bauxite
Integration drives leverage to LME, secure supply and expanded cost-cutting
opportunities •
The integration of our Upstream Business is the lynchpin to our
strategy and sustainability
•
Significant Operating Leverage to LME
–
Third party sales of excess raw materials (e.g., bauxite and
alumina) enhance our leverage to LME
•
Secure Supply
–
We have sufficient capacity to provide over 100% of our
internal alumina and bauxite requirements
•
Low Cost & Operating Flexibility
–
Competitive positions on global business costs curves:
Bauxite
–
second
quartile,
Alumina
–
third
quartile,
Primary
Aluminum
–
second
quartile
11 |
 Noranda
chooses to manage costs without directly linking them to the LME
Operating Leverage Comparison
15%
New Madrid
(263k mt)
Not Indexed
to LME
Not Indexed
to LME
Pure
US$ Exposure
LTM Q1 2011 Business Summary
(1)
Represents LTM Q1 2011 actual.
(2)
Represents LTM Q1 2011 integrated upstream margin on cash cost per pound multiplied by
583 million pounds. LTM Primary aluminum shipments (mm lbs)
583
LTM average LME ($/lb)
$ 1.02
LTM MWTP ($/lb)
0.06
LTM average realized Midwest Transaction
Price ($/lb)
(1)
1.08
0.68
Integrated
upstream
margin
on
cash
cost
(1)
($/lb)
$ 0.39
Integrated upstream segment profit ($ mm)
(2)
$ 230
Rolled
products
segment
profit
(1)
($
mm)
52
Corporate
expenses
(1)
($
mm)
(27)
Total
segment
profit
(1)
($
mm)
$ 255
12
Net
integrated
cash
cost
of
primary
aluminum
($/lb)
(1) |
 •
Foil products
•
Light gauge sheet
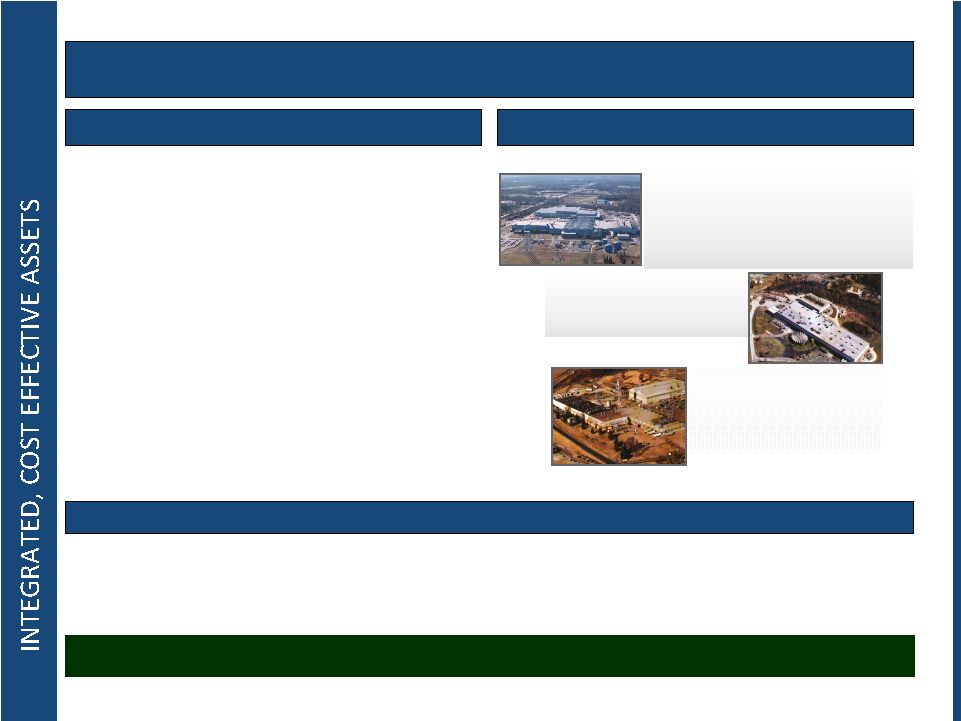
Rolling Mill Operations
Four Rolling Mills in Three States
Huntingdon, TN
2 plants, East and West
Started 1967 & 2000
Max. East capacity: 130mm lbs
(1)
Max. West capacity: 235mm lbs
(1)
Salisbury, NC
Started 1965
Max. Capacity: 95mm lbs
(1)
Newport, AR
Started 1951
Max. Capacity:
35mm lbs
(1)
Downstream segment completes integration and is a stable free cash flow generator
Low Cost, Leading Downstream Business
•
Low Cost Production
–
Huntingdon West is the lowest conversion
cost foil mill in North America according to
CRU
–
Q1 2011 LTM adjusted EBITDA of $245
million
–
Maintenance capital expenditures average
25% of adjusted EBITDA
•
Focused Growth
–
Gained demand share in 2009 and 2010
Products
_______________________
(1) Maximum capacity, with actual capacity depending upon
production mix. •
HVAC fin stock
•
Container
•
Transformer winding
13
•
Stable
source
of
free
cash
flow |
 Key Investment
Highlights Disciplined cost-cutting & profitable growth drive our
sustainability 14
Integrated,
Cost Effective
Assets
Profitable Growth
& Productivity
Experienced
Management
Team
Favorable
Industry
Dynamics
Strong
Financial
Profile and
Performance |
 Multiple Levers
for Growth •
Noranda has several avenues through which to pursue growth
Growth offers new opportunities to drive cost savings and productivity
Prudent capital investment
Debottlenecking
Increase share of demand
Strategic acquisitions
15 |
 Primary
$27
Bauxite
$20
Alumina
$17
Corporate
$2
Flat-Rolled
$11
Strong Focus on Productivity
2010 CORE savings
$77 million
CORE productivity program generating substantial recurring cost savings
16
Primary
$25
Flat-Rolled
$18
2009 CORE savings
$43 million
Primary
$11
Bauxite
$2
Alumina
$3
Corporate
$2
Flat-Rolled
$3
Q1 2011 CORE
savings $21 million
EBITDA
88%
CAPEX
12%
Average CORE
savings by type
•
CORE program generates:
–
EBITDA savings (cost
savings, cost avoidance
or cash generation)
–
Capital expenditure
savings or avoidance
•
CORE program is fundamental to our integrated strategy
•
$140 million CORE savings target during the period from 2009
through 2011
–
Exceeded our $140 million target during Q1 2011
–
New three year target to be announced in H2 2011 |
 Less debt,
lower costs, more cash flow and strong liquidity Key Investment Highlights
17
Integrated,
Cost Effective
Assets
Profitable Growth
& Productivity
Experienced
Management
Team
Favorable
Industry
Dynamics
Strong
Financial
Profile and
Performance |
 18
We Have Created the Financial Flexibility to Grow
Debt Balances (gross balances)
Net Debt
(3)
to LTM Adjusted EBITDA
LTM Adjusted EBITDA
Strong Balance Sheet
•
Highly flexible capital structure with no
near-term maturities, undrawn
revolver
(1)
, $257 million of liquidity
(2)
and no maintenance covenants
•
Repositioned during downturn by using
hedges to repurchase/repay debt
$420
$728
$1,142
$1,230
$0
$200
$400
$600
$800
$1,000
$1,200
$1,400
Term B
AcquisitionCo
HoldCo
Revolver
(1)
As of March 31,2011
(2)
$41.5 million of cash plus $215.2 million of available borrowing capacity under Revolver, as
of March 31, 2011
(3)
Net debt is calculated as debt less cash and cash equivalents |
 Key Investment
Highlights Deep experience in cyclical and commodity businesses
19
Integrated,
Cost Effective
Assets
Profitable Growth
& Productivity
Experienced
Management
Team
Favorable
Industry
Dynamics
Strong
Financial
Profile and
Performance |
 •
Management has created significant shareholder value at Noranda
•
Our executive team’s 14 members have an average of 24 years of experience in cyclical
and commodity industries
–
Layle “Kip”
Smith,
President
and
Chief
Executive
Officer,
has
over
26
years
of
leadership
experience,
including
in
various management positions with The Dow Chemical Company, as COO of Resolution Performance
Products and as CEO of Covalence Specialty Materials
–
Robert
B.
Mahoney,
Chief
Financial
Officer,
has
over
24
years
of
cyclical
industry
experience
in
senior
financial
management positions for semiconductor and electrical components
companies
–
Gail E. Lehman,
Vice
President
&
General
Counsel,
has
over
20
years
of
corporate
law
experience,
having
held
senior
roles at industrial companies Honeywell, Covalence Specialty Materials and Hawker
Beechcraft –
Peter
J.
Hartland,
President
of
the
Upstream
Business,
most
recently
served
as
President
of
the
Coatings
&
Inks
Division for Hexion Specialty Chemicals, Inc. Since 1982, Hartland has held several
operational management positions with Hexion and its predecessor, Borden
Chemical –
Scott
Croft,
President
of
Norandal
USA,
Inc,
has
25
years
of
experience
in
the
rolling
mill
business
–
Richard
Lapine,
Vice
President
of
Sales
&
Marketing,
has
35
years
of
experience
in
Chemicals,
Plastics
and
Automotive segments as a former executive at The Dow Chemical Company
–
Charles
Skoda,
Vice
President
of
Operations
Support,
has
10
years
of
experience
in
cyclical
industries,
including
as
an
executive at Capital One, following a decorated career as an aviator in the U.S. Navy
–
Remaining executive team members bring strong experience and are
experts in their functional areas
20
Experienced Management Team |
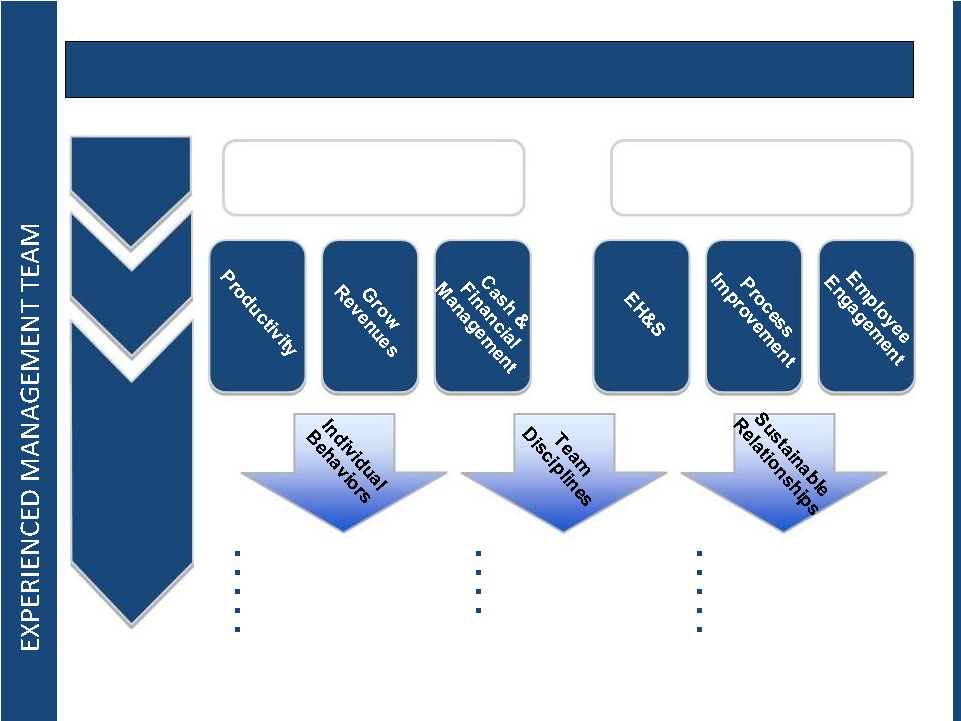 Noranda
Mission Action oriented
Ethics and Values
Drive for Results
Process Management
Safety Focus
Problem Solving
Peer Relationships
Priority Setting
Managing Through
Systems
Existing for Customers
Caring for Co-workers
Respecting Suppliers
Enriching Communities
Rewarding Investors
21
Two #1
Priorities
Sustainable
Goals
Core
Values
Get the Results
Get the Results
Do the Right Things
Do the Right Things
the Right Way
the Right Way |
 Appendices |
 Non-GAAP
Measure: Disclaimer This presentation contains non-GAAP financial measures as
defined by SEC rules. We think that these measures are helpful to investors in
measuring our financial performance and comparing our performance to our peers.
However, our non-GAAP financial measures may not be comparable to similarly titled
non-GAAP financial measures used by other companies. These non-GAAP financial
measures have limitations as an analytical tool and should not be considered in
isolation or as a substitute for GAAP financial measures. To the extent we discuss any
non-GAAP financial measures in the course of this presentation, a reconciliation
of
each
measure
to
the
most
directly
comparable
GAAP
measure
are
available
in
the
appendices that follow and are filed as an Exhibit 99 to our Current Report on Form 8-K
furnished to the SEC concurrent with the use of this presentation.
|
 Non-GAAP
Measure: LTM Segment Profit (Loss) Management has provided last twelve months
(“LTM”) segment profit because it provides investors with additional
information to measure operating performance. Using this metric, investors
are
able
to
assess
our
segment
results
for
a
full
four
quarter
operating
cycle,
current
through
the
most
recently
completed
quarter.
LTM
segment
profit
(loss)
is
positively
or
negatively impacted by LME pricing and sales volumes, seasonality in electrical contract
rates, and increases or decreases in other production related costs.
LTM segment profit is not a measure of financial performance under U.S. GAAP and may not be
comparable to similarly titled measures used by other companies.
LTM segment profit per
pound shipped has limitations as an analytical tool and you should not consider it in
isolation or as a substitute for analysis of results under U.S. GAAP.
The following table reconciles LTM segment profit for the periods presented (in
millions): 31-Mar-11
$
Prior full year Segment Profit
216.1 Less: prior year Q1 Segment
Profit
(42.9) Plus: current year Q1
Segment Profit
82.1 LTM Segment
Profit
255.3 |
 Non-GAAP
Measure: LTM Segment Profit (Loss) (Cont’d) The following tables summarize
operating results and assets of our reportable segments and a reconciliation of segment
profit (loss) to income before income taxes (in millions):
Sales:
External customers .....................................
54.9
222.8
495.9
521.3
—
—
1,294.9
Intersegment ...............................................
65.5
142.6
125.4
0.1
—
(333.6)
—
120.4
365.4
621.3
521.4
—
(333.6)
1,294.9
Segment profit (loss) .........................................
23.8
61.9
112.2
50.0
(26.9)
(4.9)
216.1
Depreciation and amortization ..........................
9.6
19.3
48.3
20.5
1.0
—
98.7
Capital expenditures ..........................................
7.7
11.1
26.4
14.3
1.8
—
61.3
Segment profit (loss) ........................................
23.8
61.9
112.2
50.0
(26.9)
(4.9)
216.1
Depreciation and amortization .........................
(9.6)
(19.3)
(48.3)
(20.5)
(1.0)
—
(98.7)
LIFO/LCM .......................................................
—
—
(6.1)
3.7
—
2.8
0.4
Loss on asset disposal.......................................
—
—
(3.3)
(0.6)
(0.1)
—
(4.0)
Non-cash pension, accretion and stock
compensation ............................................
(0.8)
(1.1)
(3.3)
(2.4)
(7.3)
—
(14.9)
Restructuring, relocation and severance ...........
(3.2)
(1.5)
(2.0)
(1.5)
(3.7)
—
(11.9)
Consulting and sponsor fees .............................
—
—
—
—
(18.9)
—
(18.9)
Cash settlements on hedging transactions ........
—
—
0.1
(2.5)
—
—
(2.4)
Other, net
.......................................................... 0.1
1.1
(0.1)
—
0.7
—
1.8
Operating income (loss) ...................................
10.3
41.1
49.2
26.2
(57.2)
(2.1)
67.5
Interest expense, net .........................................
31.1
Gain on hedging activities, net .........................
(65.6)
Loss on debt repurchase ...................................
0.1
Total other income ...........................................
34.4
Income before income taxes .............................
101.9
Year ended December 31, 2010
Bauxite
Alumina
refining
Primary
aluminum
products
Flat rolled
products
Corporate
Eliminations
Consolidated
$
$
$
$
$
$
$
Year ended December 31, 2010
Bauxite
Alumina
refining
Primary
aluminum
products
Flat rolled
products
Corporate
Eliminations
Consolidated
$
$
$
$
$
$
$ |
 Non-GAAP
Measure: LTM Segment Profit (Loss) (Cont’d) The following tables summarize
operating results and assets of our reportable segments and a reconciliation of segment
profit (loss) to income before income taxes (in millions):
Sales:
External customers .................................
14.9
53.9
106.9
125.8
—
—
301.5
Intersegment ...........................................
12.7
37.8
26.5
—
—
(77.0)
—
Total sales ...............................................
27.6
91.7
133.4
125.8
—
(77.0)
301.5
Segment profit (loss) ......................................
7.7
6.7
26.4
11.2
(6.4)
(2.7)
42.9
Depreciation and amortization .......................
3.0
5.4
12.3
5.2
0.2
—
26.1
Capital expenditures.......................................
1.5
1.6
7.6
1.8
0.5
—
13.0
Segment profit (loss) ......................................
7.7
6.7
26.4
11.2
(6.4)
(2.7)
42.9
Depreciation and amortization .......................
(3.0)
(5.4)
(12.3)
(5.2)
(0.2)
—
(26.1)
Last in, first out and lower of cost or market
inventory adjustments ...............................
—
—
0.3
(1.3)
—
1.9
0.9
Loss on disposal of assets ..............................
—
—
(1.1)
(0.4)
—
—
(1.5)
Non-cash pension, accretion and stock
compensation .............................................
(0.2)
(0.6)
(0.8)
(0.5)
(1.5)
—
(3.6)
Restructuring, relocation and severance ........
(0.1)
(1.6)
(1.9)
(1.4)
—
—
(5.0)
Consulting and sponsor fees ..........................
—
—
—
—
(1.6)
—
(1.6)
Cash settlements on hedging transactions ......
—
—
0.1
(0.5)
—
—
(0.4)
Other, net
....................................................... 0.1
2.0
(0.1)
—
—
—
2.0
Operating income (loss) .................................
4.5
1.1
10.6
1.9
(9.7)
(0.8)
7.6
Three months ended March 31, 2010
Bauxite
Alumina
refining
Primary
aluminum
products
Flat rolled
products
Corporate
Eliminations
Consolidated
$
$
$
$
$
$
$
Three months ended March 31, 2010
Bauxite
Alumina
refining
Primary
aluminum
products
Flat rolled
products
Corporate
Eliminations
Consolidated
$
$
$
$
$
$
$
Interest expense,
net................................................................
................................
................................
9.2
Gain on hedging activities, net................................
................................................................
(1.7)
Loss
on debt repurchase................................
................................
................................
................................
0.1
Total other expense
................................
................................
................................
...............................................
7.6
Income before income taxes................................
................................
................................
..................................
—
.................
................................
........ |
 Non-GAAP
Measure: LTM Segment Profit (Loss) (Cont’d) The following tables summarize
operating results and assets of our reportable segments and a reconciliation of segment
profit (loss) to income before income taxes (in millions):
Sales:
External customers ..................................
16.8
61.1
165.3
151.4
—
—
394.6
Intersegment ............................................
21.3
42.8
15.5
—
—
(79.6)
—
Total sales ...............................................
38.1
103.9
180.8
151.4
—
(79.6)
394.6
Segment profit (loss) ......................................
6.4
22.9
47.8
13.5
(6.6)
(1.9)
82.1
Depreciation and amortization .......................
1.6
5.2
11.7
4.8
0.3
—
23.6
Capital expenditures .......................................
3.1
2.3
6.1
2.0
—
—
13.5
Segment profit (loss) ......................................
6.4
22.9
47.8
13.5
(6.6)
(1.9)
82.1
Depreciation and amortization .......................
(1.6)
(5.2)
(11.7)
(4.8)
(0.3)
—
(23.6)
Last in, first out and lower of cost or market
inventory adjustments ................................
—
—
(4.8)
(5.9)
—
0.6
(10.1)
Loss on disposal of assets ...............................
—
—
(0.5)
(0.6)
—
—
(1.1)
Non-cash pension, accretion and stock
compensation ..............................................
(0.1)
(0.1)
(0.7)
(0.6)
(2.2)
—
(3.7)
Restructuring, relocation and severance .........
—
(0.1)
(0.2)
—
(0.1)
—
(0.4)
Consulting and sponsor fees ...........................
—
—
—
—
(0.3)
—
(0.3)
Cash settlements on hedging transactions ......
—
—
(0.2)
(1.0)
—
—
(1.2)
Other, net
........................................................ (0.1)
(0.2)
0.1
(0.1)
—
—
(0.3)
Operating income (loss) .................................
4.6
17.3
29.8
0.5
(9.5)
(1.3)
41.4
Three months ended March 31, 2011
Bauxite
Alumina
refining
Primary
aluminum
products
Flat rolled
products
Corporate
Eliminations
Consolidated
$
$
$
$
$
$
$
Three months ended March 31, 2011
Bauxite
Alumina
refining
Primary
aluminum
products
Flat rolled
products
Corporate
Eliminations
Consolidated
$
$
$
$
$
$
$
Interest expense, net
................................
................................
................................
................................
...............
5.7
Gain on hedging activities, net
................................
................................
................................
................................
(21.8)
Total other income................................
................................
................................
................................
.................
(16.1)
Income before income taxes
................................
................................
................................
...................................
57.5 |
 Non-GAAP
Measure: Adjusted EBITDA 31-Mar-09
31-Mar-10
31-Mar-11
$
$
$
Prior full year Adjusted EBITDA
234.9
98.3
226.1
Less: prior year Q1 Adjusted EBITDA
(84.7)
(7.6)
(57.0)
Plus: current year Q1 Adjusted EBITDA
7.6
57.0
75.7
LTM Adjusted EBITDA
157.8
147.7
244.8
Last twelve months ended
Management uses “Adjusted EBITDA” as a liquidity measure in respect of the
fixed-charge coverage ratio and the net senior secured leverage ratio, as defined
in our debt agreements. As used herein, Adjusted EBITDA means net income before income
taxes, net interest expense and depreciation and amortization, adjusted to eliminate
certain non-cash expenses, restructuring
charges, related party management fees, certain charges resulting from the use of purchase
accounting and other specified items of income or expense.
The following table reconciles last twelve months (“LTM”) adjusted EBITDA for the
periods presented (in millions): |
 Non-GAAP
Measure: Adjusted EBITDA (Cont’d) Adjusted EBITDA is not a measure of financial
performance under U.S. GAAP, and may not be comparable to similarly titled measures
used by other companies in our industry. Adjusted EBITDA has limitations as an
analytical tool and you should not consider it in isolation or as a substitute for
analysis of our results as reported under U.S. GAAP. For example, Adjusted EBITDA
excludes certain tax payments that may represent a reduction in cash available to us;
does not reflect any cash requirements for the assets being depreciated and amortized that
may have to be replaced in the future; does not reflect capital cash expenditures,
future requirements for capital expenditures or contractual commitments; does not
reflect changes in, or cash requirements for, our working capital needs; and does not
reflect the significant interest expense, or the cash requirements necessary to service
interest or principal payments, on our indebtedness. Adjusted EBITDA also includes
incremental stand-alone costs and adds back non-cash hedging gains and losses,
and certain other non-cash charges that are deducted in calculating net income.
However, these are expenses that may recur, vary greatly and are difficult
to
predict.
In
addition,
certain
of
these
expenses
can
represent
the
reduction
of
cash
that could be used for other corporate purposes.
You
should
not
consider
our
Adjusted
EBITDA
as
an
alternative
to
operating
or
net
income,
determined in accordance with U.S. GAAP, as an indicator of our operating performance, or as
an alternative to cash flows from operating activities, determined in accordance with
U.S. GAAP, as an indicator of our cash flows or as a measure of liquidity.
|
 Non-GAAP
Measure: Adjusted EBITDA (Cont’d) The following table reconciles Adjusted EBITDA to
net income (loss) for the periods presented (in millions):
Twelve months ended December 31,
2008
2009
2010
$
$
$
Adjusted EBITDA
.......................................................................
234.9
98.3
226.1
LIFO/LCM
(a)
...............................................................................
(25.0)
17.4
0.4
Loss on disposal of assets
............................................................
(8.5)
(7.3)
(4.0)
Non-cash pension, accretion and stock compensation
................ (9.8)
(10.8)
(14.9)
Restructuring, relocation and severance
...................................... (8.3)
(2.8)
(11.9)
Consulting and sponsor fees
........................................................ (10.2)
(5.8)
(18.9)
Interest rate swaps
.......................................................................
(6.0)
(11.9)
(11.0)
Gain (loss) on debt repurchases
................................................... (1.2)
211.2
(0.1)
New Madrid power outage
(b)
.......................................................
—
30.6
—
Charges/fees related to early extinguishment of derivatives
....... —
(17.9)
(9.0)
Non-cash derivative gains and losses
(c)(d)
....................................
(47.0)
86.1
73.2
Goodwill and other intangible asset impairment
......................... (25.5)
(108.0)
—
Joint venture impairment
.............................................................
—
(80.3)
—
Gain on business combination
..................................................... —
120.3
—
Joint venture EBITDA
(e)
..............................................................
(13.2)
(8.0)
—
Purchase accounting and other
(f)
.................................................
(0.9)
(11.0)
1.8
Depreciation and amortization
.................................................... (98.3)
(86.6)
(98.7)
Interest expense, net
....................................................................
(88.0)
(53.5)
(31.1)
Income tax expense (benefit)
...................................................... 32.9
(58.6)
(35.0)
Net income (loss)
........................................................................
(74.1)
101.4
66.9
|
 Non-GAAP
Measure: Adjusted EBITDA (Cont’d) The
following
table
reconciles
Adjusted
EBITDA
to
cash
flow
from
operating
activities
for
the
periods presented (in millions):
Twelve months ended December 31,
2008
2009
2010
$
$
$
Adjusted
EBITDA.........................................................................
234.9
98.3
226.1
Settlements from hedge terminations,
net..................................... —
120.8
164.6
Insurance proceeds applied to capital
expenditures....................... —
(11.5)
—
Equity in net income of investment in
affiliates............................ (7.7)
(0.7)
—
Stock Compensation
expense.........................................................
2.4
1.5
5.9
Changes in other
assets..................................................................
7.5
0.9
(10.0)
Changes in pension and other long-term
liabilities....................... 0.2
(2.9)
(0.6)
Changes in operating asset and
liabilities...................................... 28.3
21.2
(32.6)
Income
taxes..................................................................................
(40.5)
(0.9)
(20.2)
Interest expense,
net......................................................................
(82.9)
(12.1)
(7.4)
LIFO/LCM
(a)
.................................................................................
(25.0)
17.4
0.4
Non-cash pension,
accretion and stock compensation..................
(9.8)
(10.8)
(14.9)
Restructuring, relocation and
severance........................................ (8.3)
(2.8)
(11.9)
Consulting and sponsor
fees..........................................................
(10.2)
(5.8)
(18.9)
Interest rate
swaps.........................................................................
(6.0)
(11.9)
(11.0)
New
Madrid
power
outage
(b)
.........................................................
—
30.6
—
disposal of
assets....................................................................
—
8.8
—
................................................................
(13.2)
(8.0)
—
...................................................
(4.2)
(11.6)
1.4
Cash flow from operating
activities..............................................
65.5
220.5
270.9
Insurance proceeds applied to depreciation expense and loss on
Joint
venture
EBITDA
(e)
Purchase
accounting
and
other
(f) |
 Non-GAAP
Measure: Adjusted EBITDA (Cont’d) Year ended December 31,
2008
2009
2010
$
$
$
Fixed priced aluminum swaps
......................................................... 5.3
(93.1)
(24.2)
Variable price aluminum swaps and other
....................................... 8.0
23.8
(2.5)
Natural gas swaps
............................................................................
3.7
31.8
23.3
Interest rate swaps
...........................................................................
6.0
11.9
11.0
Total
................................................................................................
23.0
(25.6)
7.6
(a)
Our New Madrid smelter and our rolling mills use the LIFO method of
inventory accounting for financial reporting and tax purposes. This adjustment restates net
income to the FIFO method by eliminating LIFO expenses related to
inventory held at the New Madrid smelter and the rolling mills. Inventories at Gramercy and
St. Ann are stated at lower of weighted-average cost or market,
and are not subject to the LIFO adjustment. We also reduce inventory to the lower of cost (adjusted
for purchase accounting) or market value.
(b)
Represents the portion of the insurance settlement used for
claim-related capital expenditures. (c)
We use derivative financial instruments to mitigate effects of
fluctuations in aluminum and natural gas prices. This adjustment eliminates the non-cash gains and
losses resulting from fair market value changes of aluminum swaps, but
does not affect the following cash settlements (received)/paid (in millions):
Year ended December 31,
2008
2009
$
$
Depreciation and amortization
......................................................................................................
16.0
8.7
Net tax expense
............................................................................................................................
(2.7)
(0.7)
Interest income
.............................................................................................................................
(0.1)
—
Total joint venture EBITDA adjustments
.....................................................................................
13.2
8.0
(f)
Represents impact from inventory step-up and other adjustments
arising from adjusting assets acquired and liabilities assumed in the Joint Venture Transaction to
their fair values as well as other immaterial non-recurring items The
previous table presents fixed price aluminum swap cash settlement amounts net of early termination discounts totaling $17.9 million in 2009 and $9.0 million in
2010.
(d)
During third quarter 2010, we concluded that certain non-cash
hedge gains should be excluded for purposes of calculating Adjusted EBITDA under the credit
agreement governing our senior secured credit facilities. As such, we
excluded from the calculation of Adjusted EBITDA hedge gains totaling $53.6 million for the
year ended December 31, 2010.
(e)
Prior to the consummation of the Joint Venture Transaction on August
31, 2009, our reported Adjusted EBITDA includes 50% of the net income of Gramercy and St.
Ann. To reflect the underlying economics of the vertically
integrated upstream business, this adjustment eliminates the following components of equity income to
reflect 50% of the EBITDA of the joint ventures for the following
periods (in millions): |
 Non-GAAP
Measure: Adjusted EBITDA (Cont’d) The following table reconciles Adjusted EBITDA to
net income (loss) for the periods presented (in millions):
Three months ended
March 31, 2009
March
31, 2010
March 31, 2011
$
$
$
Adjusted EBITDA
.................................................
57.0
75.7
LIFO/LCM
(a)
........................................................
0.9
(10.1)
Loss
on disposal of assets
.....................................
(1.5)
(1.1)
Non-cash pension, accretion and stock
compensation
..................................................
(3.6)
(3.7)
Restructuring, relocation and severance
(5.0)
(0.4)
Consulting and sponsor fees
................................
(1.6)
(0.3)
Interest rate swaps
.............................................
—
—
Loss on debt repurchases
......................................
(0.1)
—
New Madrid power outage
—
—
Charges/fees related to early extinguishment
of
derivatives...................................................
(4.1)
—
Non-cash derivative gains
and
losses
(b)(c)
(8.7)
27.0
Goodwill and other intangible asset
impairment........................................................
—
—
Joint venture impairment
.....................................
—
—
Joint venture EBITDA.........................................
—
—
Other, net
(d)
...........................................................
2.0
(0.3)
Depreciation and amortization
..........................
(26.1)
(23.6)
Interest expense, net
..............................................
(9.2)
(5.7)
Income tax expense
..............................................
(0.1)
(19.2)
Net income (loss)
.................................................
(0.1)
38.3
............
7.6
4.4
(2.4)
(2.3)
(0.3)
(0.9)
—
152.2
0.8
(8.6)
36.9
(43.0)
(45.3)
(3.7)
(1.9)
(25.4)
(15.9)
(7.9)
44.3 |
 Non-GAAP
Measure: Adjusted EBITDA (Cont’d) The
following
table
reconciles
Adjusted
EBITDA
to
cash
flow
from
operating
activities
for
the
periods presented (in millions):
Three
months ended
March 31,
2009
March 31,
2010
March 31,
2011
$
$
$
Adjusted EBITDA
......................................................
7.6
57.0
75.7
Settlements from hedge terminations, net
................
50.4
58.7
—
Equity in net income of affiliates
..............................
(1.3)
—
—
Stock compensation expense
.....................................
0.4
0.4
2.0
Changes in other assets
..............................................
6.0
(0.3)
(5.8)
Changes in pension and other long-term liabilities
9.7
10.5
3.1
Changes in operating asset and liabilities
..................
15.5
(9.1)
(25.1)
Income taxes
..............................................................
7.5
—
(19.0)
Interest expense, net
...................................................
(15.2)
(8.3)
(5.0)
Non-cash pension, accretion and stock compensation
(2.3)
(3.6)
(3.7)
Restructuring, relocation and severance
.....................
(0.3)
(5.0)
(0.4)
Consulting and sponsor fees
.......................................
(0.9)
(1.6)
(0.3)
Interest rate swaps
.......................................................
—
—
—
New Madrid power ou
tage
.........................................
0.8
—
—
Joint Venture EBITDA
.................................................
(3.7)
—
—
Purchase
accounting
and
other
(d)
...............................
1.0
1.9
(0.4)
Cash flow from operating activities
............................
75.2
100.6
21.1 |
 Non-GAAP
Measure: Adjusted EBITDA (Cont’d) (a)
Our New
Madrid smelter and our rolling mills use the LIFO method of inventory
accounting for financial reporting and tax purposes. This adjustment restates net
income to the FIF
O method by eliminating LIFO expenses related to inventory held at the
NewMadrid smelter and the rolling mills. Inventories at Gramercy and
St.
Ann are stated at lower of weighted
-
average cost or market, and are not subject to the LIFO adjustment. We
also reduce inventory to the lower of cost
(adjusted for purchase accounting) or market value.
(b)
We use derivative financial instruments to mitigate effects of
fluctuations in aluminum and natural gas prices. This adjustment eliminates the non-cash
losses resulting from fair market value changes of aluminum swaps, but
does not affect the following cash settlements (received)/paid (in millions):
Three
months ended
March 31, 2009
March 31, 2010
March 31, 2011
$
$
$
Fixed priced aluminum
swaps
..................................
(26.2)
(14.0)
—
Variable price aluminum swaps and other...................
11.3
(0.5)
1.2
Natural gas swaps
......................................................
6.7
4.0
(6.4)
Interest rate swaps
................................
.....................
__
Total
................................
..........................................
(8.2)
(10.5)
(5.2)
The previous table presents fixed price aluminum swap cash settlement
amounts net of early termination discounts totaling $4. 1
million in the three months
__
__
ended March
31,
2010 and $9.0
million
in the twelve months ended December 31, 2010.
(c)
During third quarter 2010, we concluded that certain non-cash
hedge gains should be excluded for purposes of calculating Adjusted EBITDA under the credit
agreement governing our senior secured credit facilities. As such, we
excluded from the calculation of Adjusted EBITDA hedge gains totaling $53.6
the twelve months ended December
31,
2010.
(d)
Represents impact from inventory step-up and other adjustments
arising from adjusting assets acquired and liabilities assumed in the
Joint Venture Transaction to
their fair values as well as other immaterial non-recurring items.
As discussed in our 2010 Annual Report on Form 10-K, the Joint Venture Transaction closed on
August
31,
2009, whereby we became the sole owner of Gramercy and St.
Ann.
gains
and
million
for |
 Non-GAAP
Measure: Net Cash Cost of Primary Aluminum Unit
net
cash
cost
for
primary
aluminum
per
pound
represents
the
costs
of
producing
commodity grade aluminum net of value-added and Midwest premiums on primary aluminum
sales, and alumina and bauxite sales to external customers. The Company has provided
unit net cash cost per pound of aluminum shipped because it provides investors with
additional information
to
measure
operating
performance.
Using
this
metric,
investors
are
able
to
assess
the prevailing LME price plus Midwest premium per pound versus unit net costs per pound
shipped. Unit net cash cost per pound is positively or negatively impacted by changes in
primary aluminum, alumina and bauxite production and sales volumes, natural gas and oil
related costs, seasonality in electrical contract rates, and increases or decreases in
other production related costs.
Unit net cash costs is not a measure of financial performance under U.S. GAAP and may not be
comparable to similarly titled measures used by other companies.
Unit net cash costs per
pound shipped has limitations as an analytical tool and you should not consider it in
isolation or as a substitute for analysis of results under U.S. GAAP.
|
 Non-GAAP
Measure: Net Cash Cost of Primary Aluminum (Cont’d) The following table reconciles
last twelve months (“LTM”) net cash costs for the periods presented:
31-Mar-09
31-Mar-10
31-Mar-11
$
$
$
Cash Cost:
Prior full year cash costs (in millions)
$
482.5
$
271.6
$
391.2 Less: prior year Q1 cash costs
(100.6)
(75.3)
(87.3)
Plus: current year Q1 cash costs
75.3
87.3
93.8
LTM cash costs
$
457.2
$
283.6
$
397.7 Shipments:
Prior full year shipments (in millions)
589.9
351.6
560.5
Less: prior year Q1 shipments
(144.8)
(88.9)
(120.8)
Plus: current year Q1 shipments
88.9
120.8
143.0
LTM shipments
534.0
383.5
582.7
Net cash cost of primary aluminum ($/lb)
$
0.86
$
0.74
$
0.68 Last twelve
months ended |
 Non-GAAP
Measure: Net Cash Cost of Primary Aluminum (Cont’d) The following table reconciles
net cash costs for the periods presented: Year ended December
31, 2008
2009
2010
Total
primary
aluminum
cash
cost
(in
millions)
(a)
........................................................
$
482.5
$
271.6
$
391.2
Total shipments (pounds in millions)
..............................................................................
589.9
351.6
560.5
Net
primary
aluminum
cash
cost
per
pound
of
primary
aluminum
...........................
$
0.82
$
0.77
$
0.70
(a)
Total primary aluminum cash cost is calculated below (in
millions): Total primary aluminum revenue
..................................................................
$
758.5
$
340.3
$
621.3
Less fabrication premiums and other revenue
.............................................
(45.9)
(55.8)
(37.1)
Realized Midwest transaction price revenue
...............................................
712.6
284.5
584.2
Primary aluminum products segment profit
...............................................
222.7
4.9
112.2
Alumina refining segment profit (loss)
........................................................
—
(2.3)
61.9
Bauxite segment profit
..................................................................................
—
12.3
23.8
Profit eliminations
........................................................................................
7.4
(2.0)
(4.9)
Total
...............................................................................................................
230.1
12.9
193.0
Total primary aluminum cash cost (in millions)
........................................
$
482.5
$
271.6
$391.2
(b)
During 2009, we refined our cash cost calculation methodologies to
reflect an adjusted EBITDA based calculation (see the “Covenant
Compliance”
section for a full description and reconciliation of adjusted
EBITDA). As a result, 2008 figures may not tie to cash costs as
presented in 2008 filings.
(b) |
 Non-GAAP
Measure: Net Cash Cost of Primary Aluminum (Cont’d) The following table reconciles
net cash costs for the periods presented: Three months ended
March 31, 2009
March 31, 2010
March 31, 2011
Total primary aluminum cash cost (in millions)
(a)
............................
.
$
75.3
$
87.3
$
93.8
Total shipments (pounds in
millions)................................................
88.9
120.8
143.0
Net cash cost for
primary aluminum
products (per pound shipped)..
$
0.85
$
0.72
$
0.66
(a)
Total primary aluminum cash cost is calculated below (in
millions): Total primary aluminum
product sales
.............................................................
$
75.3
$
133.4
$
180.
8
Less fabrication premiums
and other revenue
................................................
(13.5
)
(8.0)
(11.8)
Realized Midwest transaction price revenue
..................................................
61.8
125.4
169.0
Primary aluminum products segment profit
....................................................
(13.5)
26.4
47.8
Alumina refining segment profit
........................................................................
-
6.7
22.9
Bauxite segment profit
........................................................................................
-
7.7
6.4
Profit
eliminations
................................................................................................
-
(2.7)
(1.9)
Total
.......................................................................................................................
(13.5)
38.1
75.2
Total primary aluminum cash cost
.....................................................................
$
75.3
$
87.3
$
93.8 |
 Non-GAAP
Measure: Net Income (Loss), Excluding Special Items
31-Mar-09
31-Mar-10
31-Mar-11
$
$
$
Prior full year net income (loss)
(74.1)
101.4
66.9 Less: prior year
Q1 net income (loss)
(17.2)
(44.3)
0.1 Plus:
current year Q1 net income (loss)
44.3
(0.1)
38.3 LTM net income
(loss)
(47.0)
57.0
105.3 Less: impact of
special items
(24.7)
(140.2)
(38.3) LTM net income (loss)
excluding special items
(71.7)
(83.2)
67.0 Last
twelve months ended “Net income (loss), excluding special items” means
net income adjusted to eliminate the impact of certain transactions and events referred
to as “special items,” as listed herein. Management has provided net income
(loss), excluding special items because the measure provides investors with additional
information with which to measure operating results. Using these metrics, investors are
able to assess the impact of certain transactions and events on earnings and to compare
net income (loss) from period to period with the impact of those transactions and
events removed from all periods. Management believes this metric is a valuable tool in
assisting investors to compare financial results from period to period.
Net income (loss), excluding special items may not be comparable to similarly titled measures
used by other companies. Net income (loss), excluding special items should not be
considered in isolation from or as an alternative to net income or any other
performance measures derived in accordance with U.S. GAAP. Net income (loss), excluding
special items has limitations as an analytical tool and you should not consider it in
isolation or as a substitute for analysis of results as reported under U.S. GAAP.
The following table reconciles last twelve months (“LTM”) net income (loss),
excluding special items for the periods presented (in millions): |
 Non-GAAP
Measure: Net Income (Loss), Excluding Special Items (Cont’d)
31-Mar-09
31-Mar-10
31-Mar-11
$
$
$
Prior full year special items
(68.3)
239.0
21.7 Less: prior year
Q1 special items
(3.7)
(96.7)
2.1 Plus:
current year Q1 special items
96.7
(2.1)
14.5 LTM special
items
24.7
140.2
38.3 Last
twelve months ended The
following
table
presents
the
impact
of
special
items
for
the
periods
presented
(in
millions):
2009
2010
2011
First
quarter
Second
quarter
Third
quarter
Fourth
quarter
First
quarter
Second
quarter
Third
quarter
Fourth
quarter
First
quarter
$
$
$
$
$
$
$
$
$
Pre
-
tax impact of specific transactions:
Insurance recoveries in excess of
losses
..............................................
—
29.2
14.3
—
—
—
—
—
—
Management agreement termination
.....
—
—
—
—
—
(12.5)
—
—
—
Modification of stock options
.................
—
—
—
—
—
(3.2)
—
—
—
Transaction related legal costs
................
—
—
—
—
(0.3)
(5.2)
—
—
—
Restructuring
...........................................
—
—
—
—
(4.4)
(3.2)
—
—
—
Executive separation agreement
.............
—
—
—
—
—
—
—
(3.3)
—
Goodwill and other intangible asset
impairment
....................................
(43.0)
—
—
(65.0)
—
—
—
—
—
Gain on hedging activities
.......................
45.1
53.2
5.9
7.6
1.7
20.6
21.
7
21.6
21.
8
Joint venture impairment
........................
(45.3)
(35.0)
—
—
—
—
—
—
—
Gain (loss) on debt repurchase
................
152.2
12.4
28.6
18.0
(0.1)
(2.5)
3.5
(1.0)
—
Gain
on business combination
...............
—
—
120.3
—
—
—
—
—
—
Income
tax impact of special items
......
(12.3
)
(19.8)
(41.7
)
14.3
1.0
2.0
(8.8)
(5.9)
(7.3)
Impact of special items on net income
(loss)...........................................................
96.7
40.0
127.4
(2
5.1
)
(2.1)
(4.0)
16
.4
11.
4
14.5 |
 Non-GAAP
Measure: Operating Cash Flow, Excluding Aluminum Hedges
31-Mar-09
31-Mar-10
31-Mar-11
$
$
$
Prior full year operating cash flow
65.5
220.5
270.9
Less: prior year Q1 operating cash flow
(78.6)
(75.2)
(100.6)
Plus: current year Q1 operating cash flow
75.2
100.6
21.1
LTM operating cash flow
62.1
245.9
191.4
Less: Aluminum hedge settlements
(67.9)
(210.1)
(116.1)
LTM Operating cash flow, excluding aluminum hedges
(5.8)
35.8
75.3
Last twelve months ended
“Operating cash flow, excluding aluminum hedges” means operating cash flow adjusted
to eliminate the impact of cash settlements related to aluminum hedges. Management has
provided operating cash flow, excluding aluminum hedges because the measure provides
investors with additional information with which to measure our operating results.
Using these metrics, investors are able to assess our cash flows from operations from
period to period with the impact of aluminum hedge settlements removed from all periods.
Management believes this metric is a valuable tool in assisting investors to compare
financial results from period to period.
Operating cash flow, excluding aluminum hedges may not be comparable to similarly titled
measures used by other companies and should not be considered in isolation from or as
an alternative to cash flow from operating activities or any other performance measures
derived in accordance with U.S. GAAP. Operating cash flow, excluding aluminum hedges
has limitations as an analytical tool and you should not consider it in isolation or as
a substitute for analysis of results as reported under U.S. GAAP.
The following table reconciles last twelve months (“LTM”) operating cash flow,
excluding aluminum hedges for the periods presented (in millions): |
 |