Attached files
| file | filename |
|---|---|
| 8-K - FORM 8-K - ABERCROMBIE & FITCH CO /DE/ | c17756e8vk.htm |
| EX-99.2 - EXHIBIT 99.2 - ABERCROMBIE & FITCH CO /DE/ | c17756exv99w2.htm |
| EX-99.4 - EXHIBIT 99.4 - ABERCROMBIE & FITCH CO /DE/ | c17756exv99w4.htm |
| EX-99.1 - EXHIBIT 99.1 - ABERCROMBIE & FITCH CO /DE/ | c17756exv99w1.htm |
Exhibit 99.3

| Investor Presentation 2011 First Quarter |
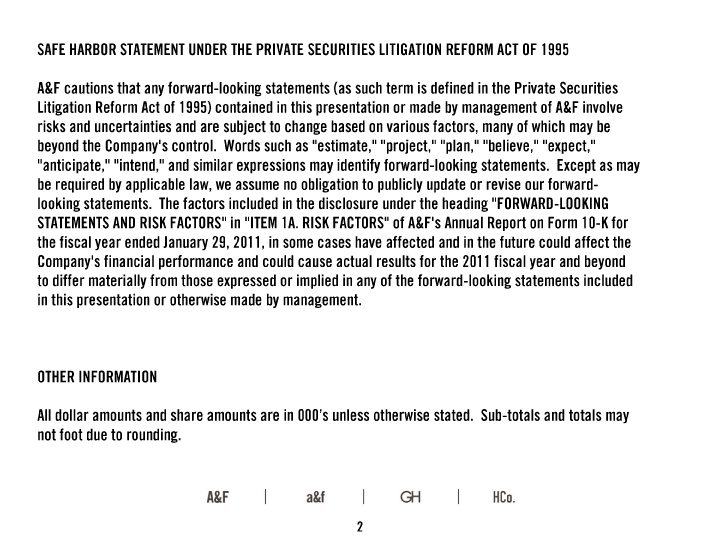
| SAFE HARBOR STATEMENT UNDER THE PRIVATE SECURITIES LITIGATION REFORM ACT OF 1995 A&F cautions that any forward-looking statements (as such term is defined in the Private Securities Litigation Reform Act of 1995) contained in this presentation or made by management of A&F involve risks and uncertainties and are subject to change based on various factors, many of which may be beyond the Company's control. Words such as "estimate," "project," "plan," "believe," "expect," "anticipate," "intend," and similar expressions may identify forward-looking statements. Except as may be required by applicable law, we assume no obligation to publicly update or revise our forward-looking statements. The factors included in the disclosure under the heading "FORWARD-LOOKING STATEMENTS AND RISK FACTORS" in "ITEM 1A. RISK FACTORS" of A&F's Annual Report on Form 10-K for the fiscal year ended January 29, 2011, in some cases have affected and in the future could affect the Company's financial performance and could cause actual results for the 2011 fiscal year and beyond to differ materially from those expressed or implied in any of the forward-looking statements included in this presentation or otherwise made by management. OTHER INFORMATION All dollar amounts and share amounts are in 000's unless otherwise stated. Sub- totals and totals may not foot due to rounding. |
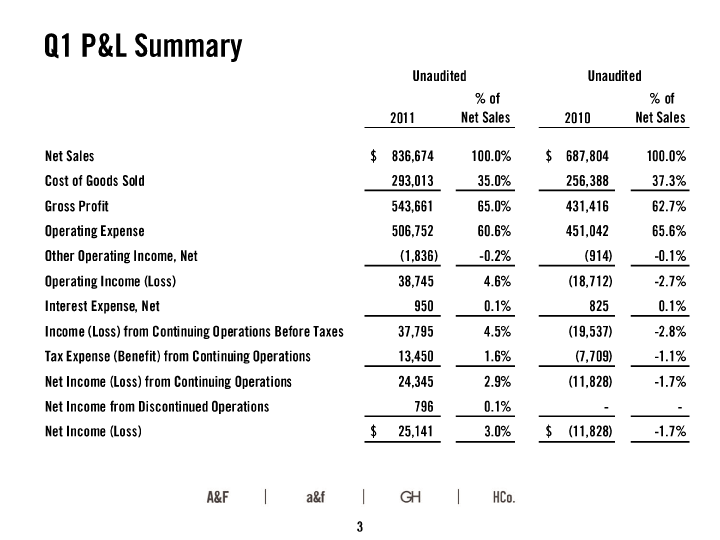
| Q1 P&L Summary |
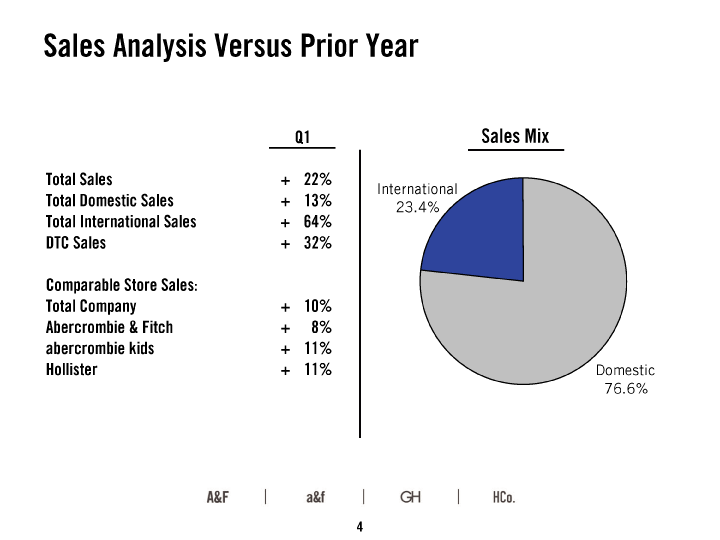
| Sales Analysis Versus Prior Year Sales Mix |
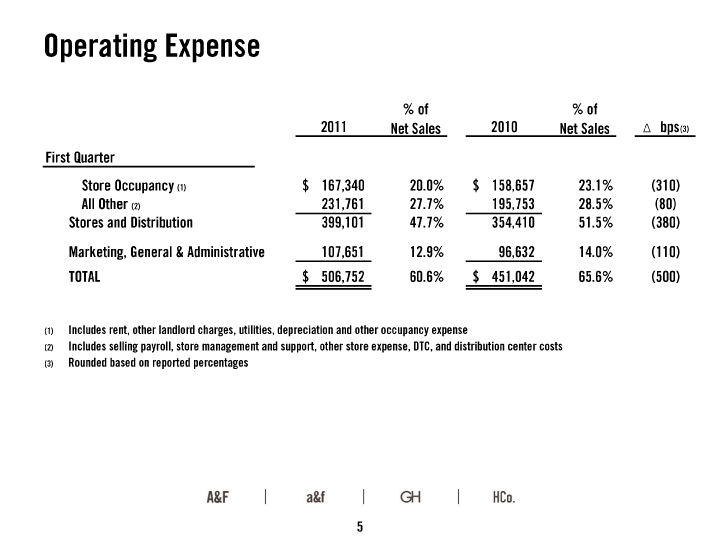
| Operating Expense |
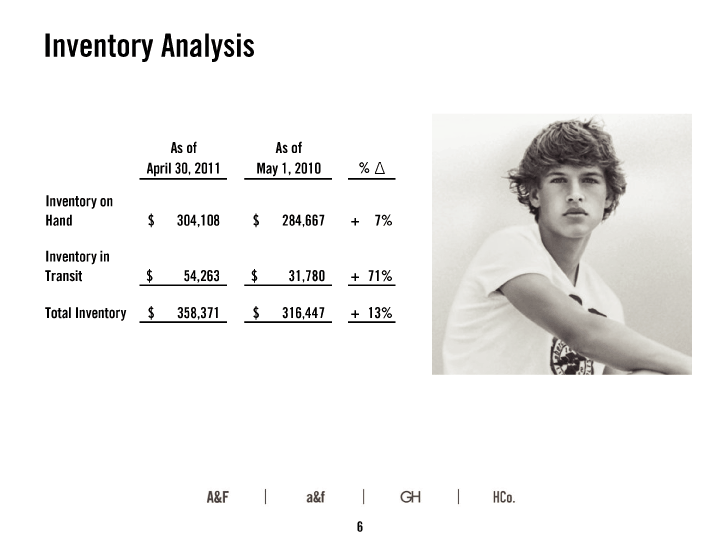
| Inventory Analysis |
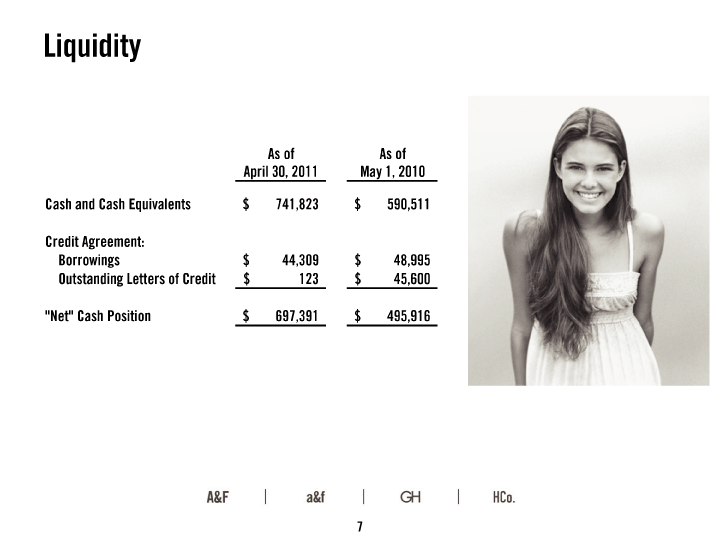
| Liquidity |
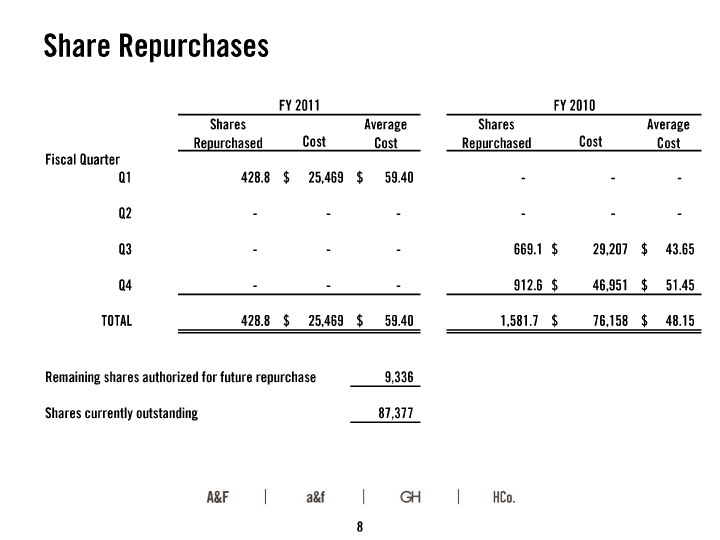
| Share Repurchases |
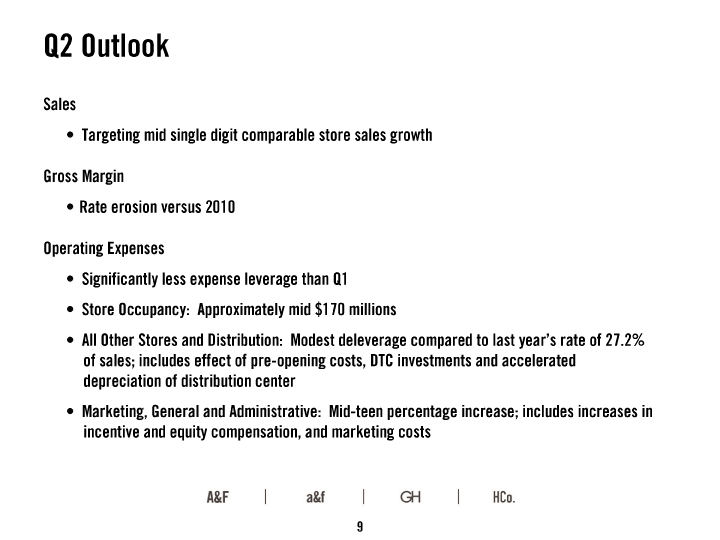
| Q2 Outlook Gross Margin Rate erosion versus 2010 Sales Targeting mid single digit comparable store sales growth Operating Expenses Significantly less expense leverage than Q1 Store Occupancy: Approximately mid $170 millions All Other Stores and Distribution: Modest deleverage compared to last year's rate of 27.2% of sales; includes effect of pre-opening costs, DTC investments and accelerated depreciation of distribution center Marketing, General and Administrative: Mid-teen percentage increase; includes increases in incentive and equity compensation, and marketing costs |
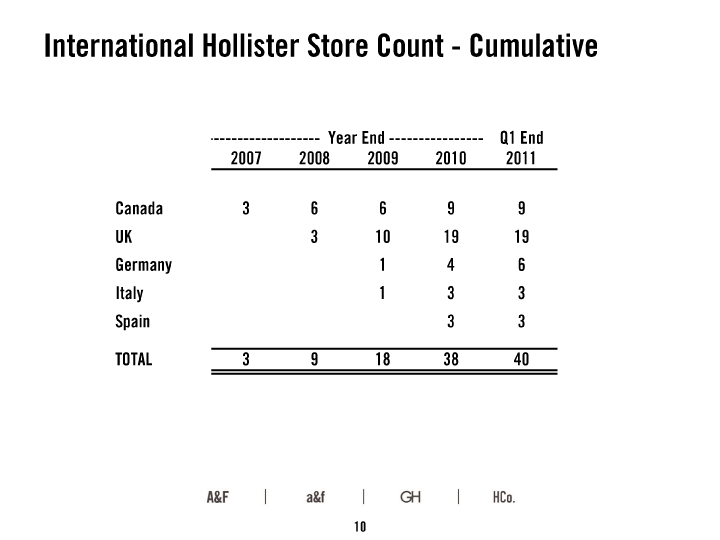
| International Hollister Store Count - Cumulative |
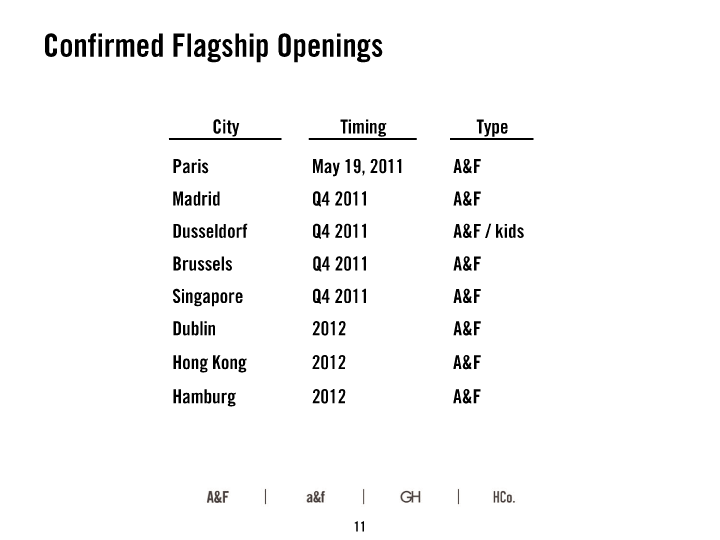
| Confirmed Flagship Openings |
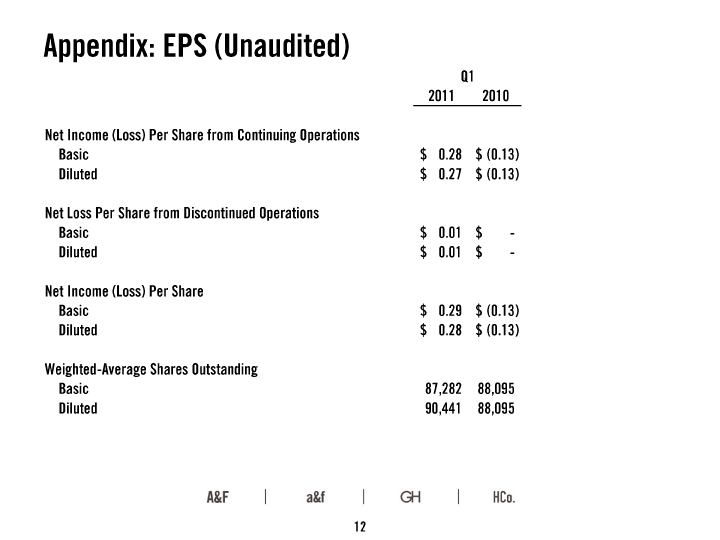
| Appendix: EPS (Unaudited) |
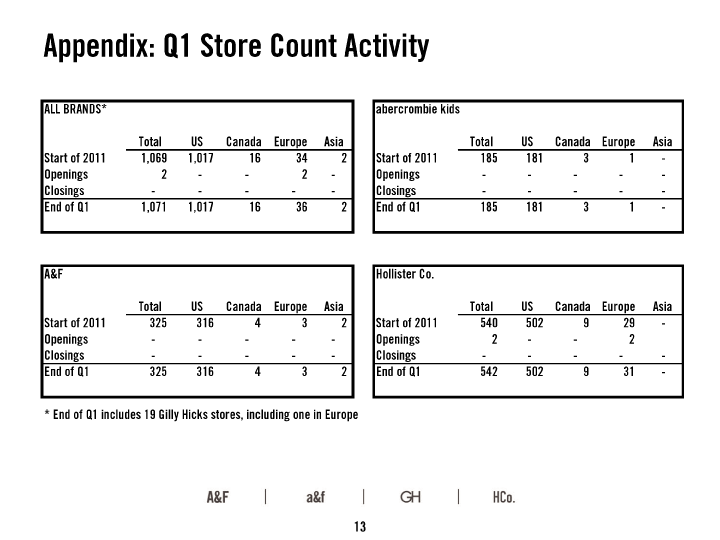
| Appendix: Q1 Store Count Activity Store Count - By Brand and Region |
| Appendix: Accounting for Share- Based Compensation |
| Equity vs. Liability Classified Awards Equity - fair value is determined and fixed on the date of grant and is expensed over the award's vesting period Liability - For liability classified awards, fair value is determined on the date of grant and re-measured each reporting date thereafter, until the award is settled, and is expensed over the award's vesting period, with a current period adjustment to earnings to reflect changes in fair value for the portion of the vesting period already served Refer to FASB ASC 718-20-55-124 through 133 for an example on accounting for awards reclassified from equity to liability |
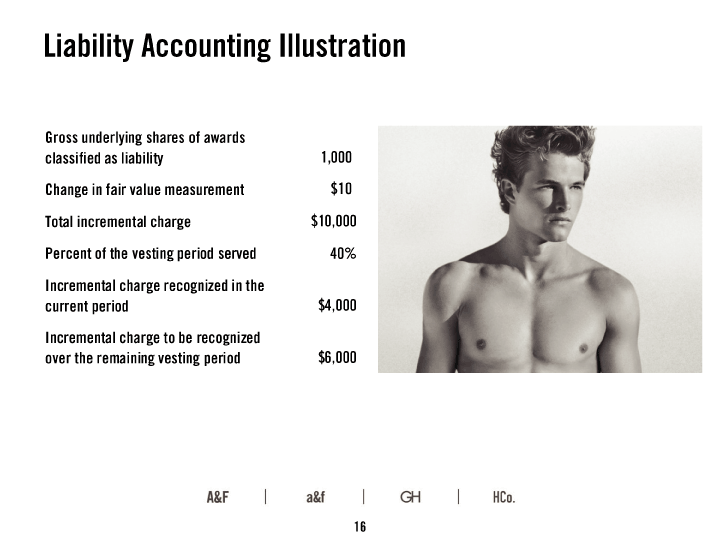
| Liability Accounting Illustration |
| Amendment and Restatement of 2007 LTIP Will be asking shareholders to approve an additional 3,000,000 shares at our 2011 Annual Shareholder Meeting Allow for continued granting equity-based compensation to associates Significantly reduce the potential for liability accounting |
