Attached files
| file | filename |
|---|---|
| 8-K - CURRENT REPORT ON FORM 8-K - DELTA AIR LINES, INC. | delta_8k-051911.htm |
Exhibit 99.1

Delta: Building a Better Airline
2011 Global Transportation Conference
May 19, 2011

1
1
Safe Harbor
This presentation contains various projections and other forward-looking statements which
represent Delta’s estimates or expectations regarding future events. All forward-looking
statements involve a number of assumptions, risks and uncertainties, many of which are
beyond Delta’s control, that could cause the actual results to differ materially from the
projected results. Factors which could cause such differences include, without limitation,
business, economic, competitive, industry, regulatory, market and financial uncertainties
and contingencies, as well as the “Risk Factors” discussed in Delta’s Form 10-K for the year
ended December 31, 2010. Caution should be taken not to place undue reliance on Delta’s
forward-looking statements, which represent Delta’s views only as of the date of this
presentation, and which Delta has no current intention to update.
In this presentation, we will discuss certain non-GAAP financial measures. You can find the
reconciliations of those measures to comparable GAAP measures on our website at
delta.com.
reconciliations of those measures to comparable GAAP measures on our website at
delta.com.

2
2
Delta: Building a Better Airline
Significant pressure on the business from rising
fuel prices, impact of events in Japan, and
Transatlantic weakness
fuel prices, impact of events in Japan, and
Transatlantic weakness
Adjusting to the New Fuel
Environment
Environment
Strong operating cash flows with limited capital
requirements allow for considerable free cash
flow generation and continued delevering of the
balance sheet
requirements allow for considerable free cash
flow generation and continued delevering of the
balance sheet
Aligning revenue, capacity and cost structure
to build a sustainable business model at $3+
per gallon jet fuel
to build a sustainable business model at $3+
per gallon jet fuel
Position Delta for long-term
success
success
Challenging March Quarter
3
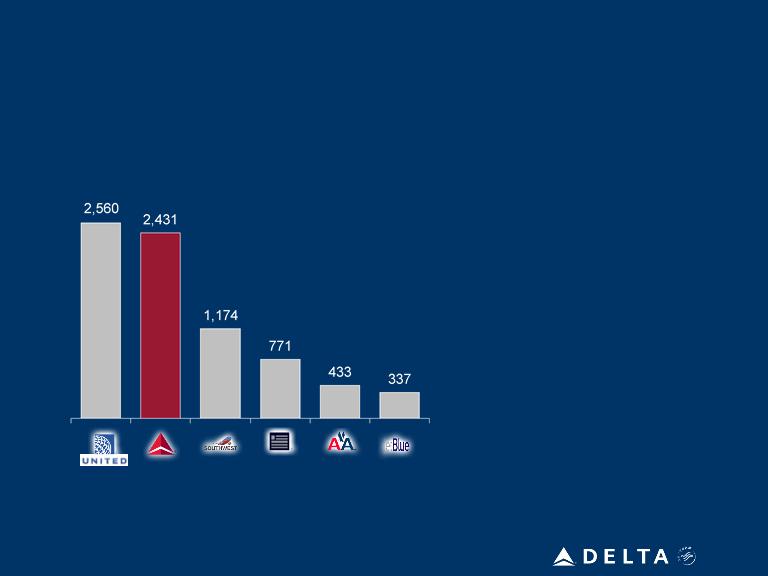
Results Show Delta’s Solid Foundation
LTM March 2011 Operating Income ($M)
March Quarter Highlights:
• Increased revenues by 13%
• Generated $450 million in free
cash flow
cash flow
• Refinanced Delta’s exit facility
with a new $2.6 billion credit
facility in April
with a new $2.6 billion credit
facility in April
• Reduced adjusted net debt to
$14.5 billion
$14.5 billion
• Ended the quarter with $5.5
billion in unrestricted liquidity
billion in unrestricted liquidity
• Generated 9.5% return on
invested capital for prior 12
months
invested capital for prior 12
months
Operating
Margin
Margin
7.4%
8.6%
1.9%
6.3%
9.3%
7.4%

4
Current Trends Are Positive
• Strong yields drove April RASM up
7%, with May up 12%
7%, with May up 12%
• Corporate revenue up 25% in 2011,
from new accounts and increased
share
from new accounts and increased
share
• Domestic showing strong yields and
load factors
load factors
• Double digit yields for Latin,
Transatlantic and Pacific
Transatlantic and Pacific
• Japan continues to rebound
• June quarter all-in fuel price now
forecasted at $3.20
forecasted at $3.20
– Quarter only partially benefits due to
timing of fuel price decline
timing of fuel price decline
• September quarter reflects current
impact of price decline, which results in
an expected all-in price of $3.10
impact of price decline, which results in
an expected all-in price of $3.10
Continued revenue strength…
…and moderating fuel prices
5
High Fuel Prices are the Norm for the Industry
• 17 successful pricing actions in 2011, coupled with
international fuel surcharges, resulting in double
digit yield improvements across all entities
international fuel surcharges, resulting in double
digit yield improvements across all entities
Higher Revenues
Reduce Capacity
Flat Non-Fuel Cost
Fuel Management
• Resizing the airline to achieve flat ex-fuel unit costs
by the end of the year, including reduction of 140
aircraft over next 18 months
by the end of the year, including reduction of 140
aircraft over next 18 months
• Reducing post-Labor Day capacity 4%, with a focus
on markets where revenue has not kept pace with
higher fuel costs
on markets where revenue has not kept pace with
higher fuel costs
• Reshaping hedge portfolio into Brent and
heating oil cashless collars, while also retiring
least fuel-efficient aircraft
heating oil cashless collars, while also retiring
least fuel-efficient aircraft
Actively managing through revenue, capacity and cost adjustments
6
Need to Size Airline to Ensure It Can Cover Higher
Fuel Costs
Fuel Costs
Revenue increases must keep pace with rising cost of operating flights
March Quarter 2011 YOY Change
|
Entity
|
Unit Revenue
|
Unit Cost
|
|
Domestic
|
Up 9%
|
Up 12%
|
|
Latin
|
Up 16%
|
Up 11%
|
|
Pacific
|
Up 11%
|
Up 7%
|
|
Atlantic
|
Down 1%
|
Up 11%
|
|
System
|
Up 7%
|
Up 11%
|

7
Reducing Delta’s Post-Labor Day Capacity by 4%
Targeted reductions where revenue not keeping pace with costs
|
Domestic
|
(1-3%)
|
• Reducing Memphis hub departures
by 25% • Right-size domestic network for high
fuel environment, continued progress on 140 aircraft reduction |
|
|
Atlantic
|
(10-12%)
|
• Market cancellations and frequency
reductions, in conjunction with JV partners |
|
|
Latin
|
2-4%
|
• Thinning of Caribbean markets for off
-season, offset by build-up of Mexico and profitable deep South America flying |
|
|
Pacific
|
(1-3%)
|
• Frequency reductions and
downgauging of Haneda service |
|
|
System
|
(4%)
|
|
|
Region
YOY Capacity Change
Capacity Actions
8
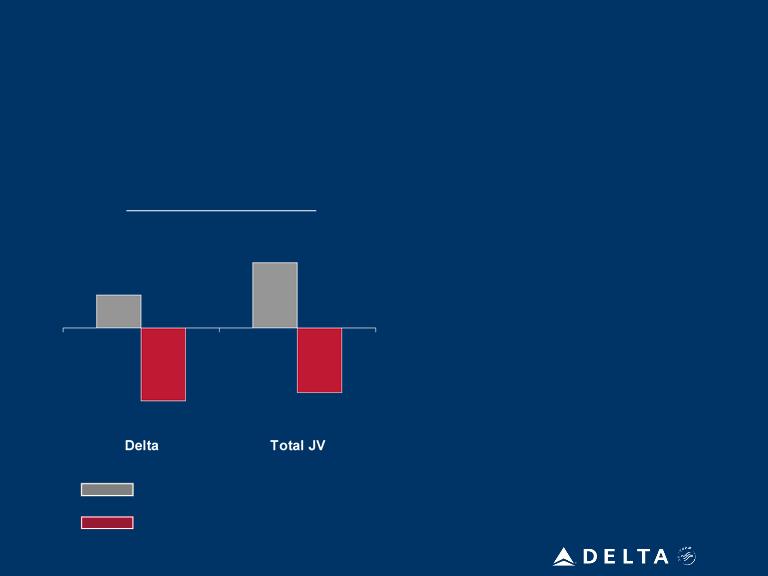
SkyTeam JV Partners Working Together to Address
Transatlantic Capacity
Transatlantic Capacity
Transatlantic Winter
YOY Capacity Change
YOY Capacity Change
(10-12%)
(7-9%)
3-4%
7-8%
Original Plan
Revised Plan
• All carriers are significantly
reducing post-Labor Day
capacity from prior plans
reducing post-Labor Day
capacity from prior plans
• Total JV capacity down ~15
points from plan
points from plan
• Capacity reductions
accomplished through:
accomplished through:
– Market cancellations
– Reduced frequencies
– Market downgauges
JV will reduce planned winter capacity by 15 points
Note: Transatlantic flying defined as US to Europe/Middle East/Africa and Amsterdam to India for Delta; and US and Canada to Europe for JV
9
9
Targeting Incremental Revenue of $1 Billion by 2013
New revenue streams expected to deliver $150-200 million this year
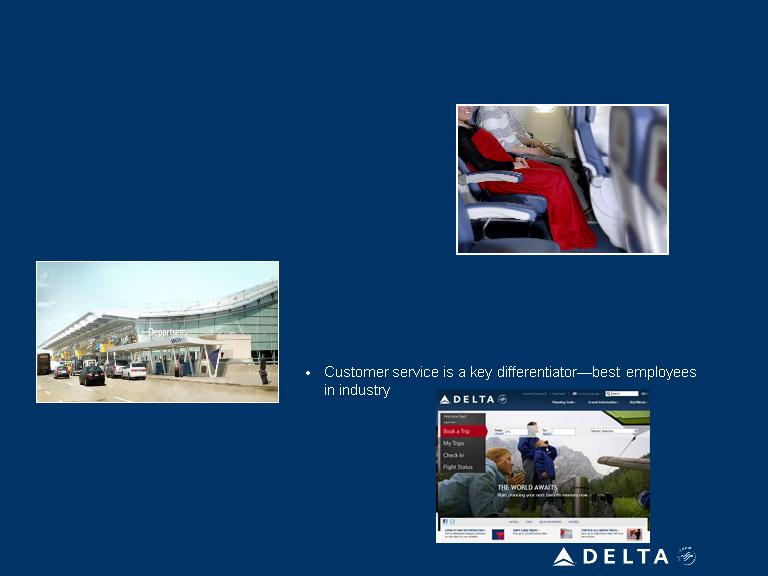
Deliver a Consistent, Quality Experience for Customers
• Improved seat experience with flat-beds, Economy
Comfort and more domestic first class seats
Comfort and more domestic first class seats
• State of the art facilities in JFK and Atlanta
Offer New Products and Services Customers Value
• Seat-related products (e.g. Economy Comfort)
• SkyPriority recognizes our highest-value customers
• Ancillary products to improve the travel experience (e.g.,
hotels, SkyClub passes, Wi-Fi)
hotels, SkyClub passes, Wi-Fi)
Invest in Technology To Sustain Innovation
• Revamped eCommerce platforms enable revenue
innovation
innovation
• Improved revenue management from stronger pricing
tools
tools
JFK Terminal 4
10
Selling and Other
Expenses
Expenses
Headcount
Reductions
Reductions
Maintenance
Savings
Savings
• Reduced distribution costs
• Technology-driven
productivity (i.e. kiosk
auction for voluntary
“bumping”)
productivity (i.e. kiosk
auction for voluntary
“bumping”)
• Full corporate review of
discretionary expenses
discretionary expenses
• Announced company-wide
voluntary exit program, with
55,000 employees eligible
voluntary exit program, with
55,000 employees eligible
• Flexible workforce provides
opportunities for improved
efficiency
opportunities for improved
efficiency
• Reducing aircraft count by
140 shells over next 18
months
140 shells over next 18
months
• Remove fleet-associated
costs (maintenance, parts
inventory, insurance)
costs (maintenance, parts
inventory, insurance)
• Maintenance savings from
reduced average age of
fleet
reduced average age of
fleet
• Forecast maintenance
costs for 2H11 are $250
million lower than 1H11
costs for 2H11 are $250
million lower than 1H11
Targeting Flat Ex-Fuel Unit Costs by End of Year
Actions underway to reduce cost base as airline is resized

11
11
Moderating Fuel Offsets Other Cost Pressures
|
|
|
June quarter 2011
|
|
|
|
Operating margin
|
7 - 9%
|
|
|
|
|
Fuel price
|
$3.20
|
|
|
|
|
Total unrestricted liquidity
|
$5.7 billion
|
|
|
|
|
|
|
|
|
|
|
|
|
June quarter 2011 vs.
June quarter 2010 |
|
|
|
Consolidated non-fuel
unit cost
|
Up 3 - 5%
|
|
|
|
|
|
|
|
|
|
|
System capacity
|
Up 1 - 3%
|
|
|
|
|
|
Domestic
|
Flat to down 2%
|
|
|
|
|
International
|
Up 6 - 8%
|
|
|
Note: Unit costs exclude profit sharing
12
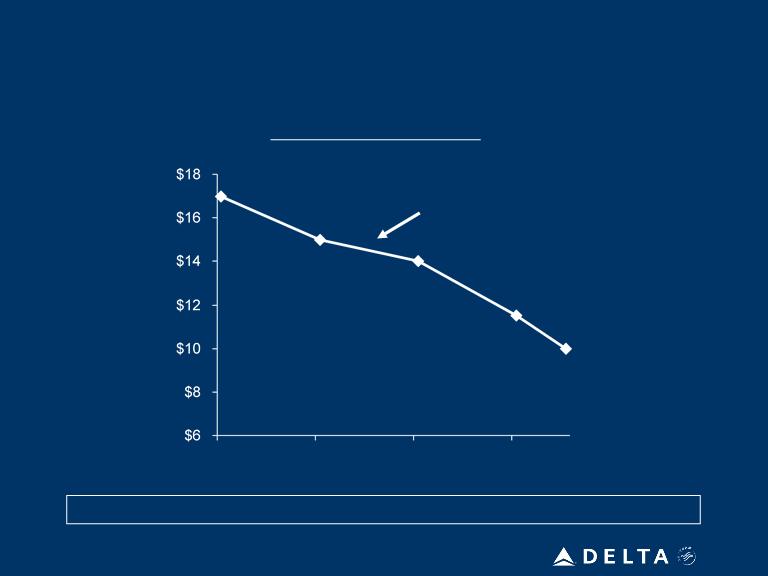
Commitment to Debt Reduction Remains Intact
Adjusted Net Debt
12/31/09
Mid-2013
6/30/11
$13.8 billion
$13.8 billion
$17 billion
$10 billion
Expect to generate $700 million in free cash flow in June quarter
13
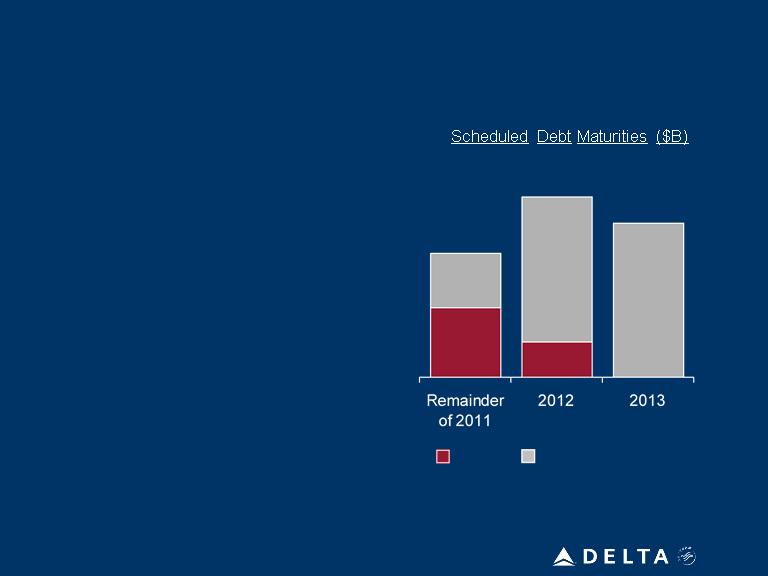
Near-Term Debt Maturities are Manageable
$1.6
$1.3
$1.9
EETC
Other debt / capital leases
• Maintaining solid liquidity position through
free cash flow generation and proactive
management of near-term debt maturities
free cash flow generation and proactive
management of near-term debt maturities
• Taking advantage of market opportunities
to proactively address future maturities
and reduce cost of debt
to proactively address future maturities
and reduce cost of debt
• Closed on a new $2.6 billion credit facility
to refinance Delta’s exit facility
to refinance Delta’s exit facility
– New $1.2 billion revolver brings
total undrawn credit lines to $1.8
billion
total undrawn credit lines to $1.8
billion
– Effective interest rate of 3.67% for
five years
five years
Plan in place to maintain minimum $5 billion in liquidity

14
Plan to Maintain Annual CapEx at $1.2 to $1.4 Billion
Annual Capital Spending Levels (billions)
Prudent capital management enables sustainable annual free cash flows
14
2008 2009 2010 2011 2012 2013 2014+
$2.2 $1.3 $1.3 $1.2 $1.2 $1.4 $1.3
Merger
Integration
International
Product &
Facilities
Product &
Facilities
Domestic
Narrowbody
Replacement
Narrowbody
Replacement

15
15
Path To Improving Shareholder Returns
10 - 12% operating margin
$5 billion EBITDAR
Minimize capital reinvestment
requirements
requirements
Use cash to delever the balance
sheet
sheet
Generate sustainable 10%+ return on invested capital
16
|
Non-GAAP Financial Measures
|
||||||||||
|
We sometimes use information that is derived from our Condensed Consolidated Financial Statements, but that is not presented in accordance with accounting principles generally accepted in the U.S. (“GAAP”). Certain of this information is considered “non-GAAP financial measures” under the U.S. Securities and Exchange Commission rules. The non-GAAP financial measures should be considered in addition to results prepared in accordance with GAAP, but should not be considered a substitute for or superior to GAAP results.
|
||||||||||
|
Delta is unable to reconcile certain forward-looking projections to GAAP, including projected consolidated unit cost, as the nature or amount of special items cannot be estimated at this time.
|
||||||||||
|
Delta excludes special items because management believes the exclusion of these items is helpful to investors to evaluate the company’s recurring operational performance.
|
||||||||||
|
Delta excludes non-cash mark-to-market (MTM) adjustments related to fuel hedges settling in future periods in order to evaluate the company’s financial results related to operations in the period shown.
|
||||||||||
|
Delta uses adjusted total debt, including aircraft rent, in addition to long-term adjusted debt and capital leases, to present estimated financial obligations. Delta reduces adjusted total debt by cash, cash equivalents and short-term investments, resulting in adjusted net debt, to present the amount of additional assets needed to satisfy the debt.
|
||||||||||
|
Delta presents free cash flow because management believes this metric is helpful to investors to evaluate the company’s ability to generate cash.
|
||||||||||
|
Delta presents consolidated unit cost excluding ancillary businesses not associated with the generation of a seat mile. These businesses include aircraft maintenance and staffing services Delta provides to third parties and Delta’s vacation wholesale operations.
|
||||||||||
|
Delta presents return on invested capital (ROIC) as management believes it is helpful to investors in assessing the company's ability to generate returns using its invested capital. ROIC represents operating income excluding special items divided by the sum of market value of equity and average adjusted net debt.
|
||||||||||
|
Operating Income
|
||||
|
(in millions)
|
Last Twelve Months Ended
March 31, 2011
|
|||
|
Operating income
|
$ | 2,057 | ||
|
Items excluded:
|
||||
|
MTM adjustments for fuel hedges settling in future periods
|
(29 | ) | ||
|
Restructuring and other items
|
403 | |||
|
Operating income excluding special items
|
$ | 2,431 | ||
|
Operating Margin
|
||||
|
Last Twelve Months Ended
March 31, 2011
|
||||
|
Operating margin
|
6.3 | % | ||
|
Items excluded:
|
||||
|
MTM adjustments for fuel hedges settling in future periods
|
-0.1 | % | ||
|
Restructuring and other items
|
1.2 | % | ||
|
Operating margin excluding special items
|
7.4 | % | ||
|
Adjusted Net Debt
|
||||||||||||||||||||||||||||||||||||||||||||||||
|
(in billions)
|
March 31, 2011
|
December 31, 2010
|
September 30, 2010
|
June 30, 2010
|
March 31, 2010
|
December 31, 2009
|
||||||||||||||||||||||||||||||||||||||||||
|
Debt and capital lease obligations
|
$ | 15.2 | $ | 15.3 | $ | 15.4 | $ | 15.8 | $ | 16.9 | $ | 17.2 | ||||||||||||||||||||||||||||||||||||
|
Plus: unamortized discount, net from purchase accounting and fresh start reporting
|
0.6 | 0.6 | 0.7 | 1.0 | 1.1 | 1.1 | ||||||||||||||||||||||||||||||||||||||||||
|
Adjusted debt and capital lease obligations
|
$ | 15.8 | $ | 15.9 | $ | 16.1 | $ | 16.8 | $ | 18.0 | $ | 18.3 | ||||||||||||||||||||||||||||||||||||
|
Plus: 7x last twelve months' aircraft rent
|
2.5 | 2.7 | 3.0 | 3.2 | 3.3 | 3.4 | ||||||||||||||||||||||||||||||||||||||||||
|
Adjusted total debt
|
18.3 | 18.6 | 19.1 | 20.0 | 21.3 | 21.7 | ||||||||||||||||||||||||||||||||||||||||||
|
Less: cash, cash equivalents and short-term investments
|
(3.8 | ) | (3.6 | ) | (3.9 | ) | (4.4 | ) | (4.9 | ) | (4.7 | ) | ||||||||||||||||||||||||||||||||||||
|
Adjusted net debt
|
$ | 14.5 | $ | 15.0 | $ | 15.2 | $ | 15.6 | $ | 16.4 | $ | 17.0 | ||||||||||||||||||||||||||||||||||||
|
Free Cash Flow
|
||||||||
|
(in millions)
|
Three Months Ended March 31, 2011
|
|||||||
|
Net cash provided by operating activities (GAAP)
|
$ | 788 | ||||||
|
Net cash used in investing activities (GAAP)
|
$ | (576 | ) | |||||
|
Adjustment:
|
||||||||
|
Purchase of short-term investments
|
240 | |||||||
|
Cash used in investing
|
(336 | ) | ||||||
|
Total free cash flow
|
$ | 452 | ||||||
|
Unit Cost
|
||||||||
|
Three Months Ended March 31,
|
||||||||
|
2011
|
2010
|
|||||||
|
Unit cost
|
13.94 | ¢ | 12.72 | ¢ | ||||
|
Items excluded:
|
||||||||
|
Ancillary businesses
|
(0.30 | ) | (0.26 | ) | ||||
|
Restructuring and other items
|
(0.01 | ) | (0.10 | ) | ||||
|
MTM adjustments for fuel hedges settling in future periods
|
0.05 | - | ||||||
|
Unit cost excluding special items
|
13.68 | ¢ | 12.36 | ¢ | ||||
|
March quarter 2011 YOY change
|
11% | |||||||
|
Capital Expenditures
|
||||||||
|
(in billions)
|
2009
|
2008
|
||||||
|
Delta property and equipment additions (GAAP)
|
$ | 1.2 | $ | 1.5 | ||||
|
Northwest property and equipment additions (GAAP) for the period from January 1 to October 29, 2008
|
- | 1.1 | ||||||
|
Other
|
0.1 | (0.4 | ) | |||||
|
Total capital expenditures
|
$ | 1.3 | $ | 2.2 | ||||
|
ROIC
|
||||
|
(in billions, except % return)
|
Last Twelve Months Ended March 31, 2011
|
|||
|
Operating income excluding special items
|
$ | 2.4 | ||
|
Market value of equity (assuming $12.60/ share)
|
$ | 10.7 | ||
|
Average adjusted net debt
|
$ | 15.0 | ||
|
Total invested capital
|
$ | 25.7 | ||
|
Return on invested capital
|
9.5% | |||