Attached files
| file | filename |
|---|---|
| 8-K - 8-K - LendingTree, Inc. | a11-12164_18k.htm |
Exhibit 99.1

TREE.COM REPORTS FIRST QUARTER 2011 RESULTS
CHARLOTTE, N.C., May 12, 2011 — Tree.com, Inc. (NASDAQ: TREE) today announced for the quarter ended March 31, 2011, Adjusted EBITDA loss of $15.4 million, excluding discontinued operations. This is a reduction of $16.7 million from the prior quarter and a $17.3 million decrease from first quarter 2010. First quarter 2011 revenue was $33.4 million, down from $49.2 million in the fourth quarter 2010 and $44.7 million in the first quarter 2010. Tree.com reported a net loss of $39.5 million, or $3.63 per share, compared to the $12.5 million net loss, or $1.12 per share, in the fourth quarter 2010. This is also a decline from the $6.1 million net loss, or $0.56 per share, in the first quarter 2010.
Doug Lebda, Chairman and CEO of Tree.com stated, “In order to better understand the Q1 results, we have to put them into context of the investments and strategic decisions we made during the quarter that affected our bottom line. Among these were the acquisition and integration of Surepoint Lending, which is expected to provide enhanced capability to monetize lower quality leads, continued testing in marketing and product, particularly new form types and volume sources, and the continued build-out of the Tree.com site and functionality. Had we curtailed or eliminated these initiatives, I expect that we would have seen a stronger quarter, but we believe that these decisions will pay off in the long run. Additionally, in March 2011, we made the decision to discontinue the operations of our company-owned real estate brokerage business, RealEstate.com REALTORS®. We saw growth in both the mortgage and non-mortgage exchanges, even in the face of a market where mortgage applications are declining. This is a good sign, because now by exiting the real estate brokerage business and with the agreement to sell the assets of LendingTree Loans to Discover Financial that we announced today, we are getting back to our roots as a lead generation company across multiple verticals.”
Tree.com SVP Tamara Kotronis added, “As expected in this higher rate environment, margins at LendingTree Loans compressed during the quarter, putting downward pressure on revenue in that segment. By contrast, our Exchanges segment grew revenue as lender demand increased. Additionally in the quarter, marketing expense was 67% of revenue, up from 37% in the prior quarter, but we have taken steps to eliminate unprofitable ad placements going forward and expect this metric to normalize. In all, the quarter started with a challenging January, but we showed bottom-line improvement each month and we are pushing towards profitability. Our commitment to long-term investments in marketing, product, and our emerging non-mortgage Exchange businesses means we will likely lose money again in the second quarter, but we are confident that those investments will pay off, especially in a pure lead gen environment.”
Tree.com Summary Financial Results
$s in millions (except per share amounts)
|
|
|
|
|
|
|
Q/Q |
|
|
|
Y/Y |
| |||
|
|
|
Q1 2011 |
|
Q4 2010 |
|
% Change |
|
Q1 2010 |
|
% Change |
| |||
|
Revenue |
|
$ |
33.4 |
|
$ |
49.2 |
|
(32 |
)% |
$ |
44.7 |
|
(25 |
)% |
|
|
|
|
|
|
|
|
|
|
|
|
| |||
|
Cost of Revenue * |
|
$ |
12.1 |
|
$ |
14.8 |
|
(18 |
)% |
$ |
11.7 |
|
3 |
% |
|
|
|
|
|
|
|
|
|
|
|
|
| |||
|
Operating Expenses* |
|
$ |
36.7 |
|
$ |
33.1 |
|
11 |
% |
$ |
31.1 |
|
18 |
% |
|
|
|
|
|
|
|
|
|
|
|
|
| |||
|
Adjusted EBITDA ** |
|
$ |
(15.4 |
) |
$ |
1.3 |
|
NM |
|
$ |
1.9 |
|
NM |
|
|
|
|
|
|
|
|
|
|
|
|
|
| |||
|
EBITDA ** |
|
$ |
(26.6 |
) |
$ |
(2.2 |
) |
(1084 |
)% |
$ |
(1.8 |
) |
(1340 |
)% |
|
|
|
|
|
|
|
|
|
|
|
|
| |||
|
Net Income/(Loss) from Continuing Ops |
|
$ |
(28.8 |
) |
$ |
(2.3 |
) |
(1132 |
)% |
$ |
(4.9 |
) |
(492 |
)% |
|
Net Income/(Loss) from Discontinued Ops |
|
$ |
(10.7 |
) |
$ |
(10.1 |
) |
(5 |
)% |
$ |
(1.3 |
) |
(733 |
)% |
|
Net Income/(Loss) |
|
$ |
(39.5 |
) |
$ |
(12.5 |
) |
(217 |
)% |
$ |
(6.1 |
) |
(543 |
)% |
|
|
|
|
|
|
|
|
|
|
|
|
| |||
|
Net Income/(Loss) Per Share |
|
$ |
(3.63 |
) |
$ |
(1.12 |
) |
(224 |
)% |
$ |
(0.56 |
) |
(548 |
)% |
|
Diluted Net Income/(Loss) Per Share |
|
$ |
(3.63 |
) |
$ |
(1.12 |
) |
(224 |
)% |
$ |
(0.56 |
) |
(548 |
)% |
NM = Not Meaningful
* Does not include non-cash compensation, depreciation, gain/loss on disposal of assets, restructuring, amortization, impairment, or litigation settlements and contingencies.
** See separate reconciliation of Adjusted EBITDA and EBITDA to GAAP Net Income/Loss.
Information Regarding Q1 Results
· First quarter 2011 revenue was down $15.8 million, or 32%, quarter-over-quarter. The LendingTree Loans segment revenue declined 48% as a result of 36% fewer closed loans combined with 20% lower average revenue per loan. By contrast, revenue for the Exchanges segment grew $2.0 million, or 16%, as both the mortgage and non-mortgage Exchange businesses grew over the fourth quarter 2010.
· Year-over-year, revenue was down $11.4 million, or 25%, from the first quarter 2010. This year-over-year decline in total revenue is due to declines in both LendingTree Loans and the Exchanges. In LendingTree Loans, we saw 15% fewer closed mortgage loans, while in the Exchanges we saw 30% fewer transmitted mortgage loan requests compared to the first quarter 2010.
· First quarter 2011 Adjusted EBITDA was down $16.7 million from the fourth quarter 2010, with the results primarily driven by lower revenue and $4.4 million higher marketing expense, which was primarily due to higher interest rates resulting in fewer consumers coming to the market to refinance. Marketing expense as percent of revenue increased to 67% in the first quarter, compared to 37% in the fourth quarter 2010.
· First quarter 2011 Adjusted EBITDA was $17.3 million lower than the first quarter 2010, driven by lower revenue year-over-year. The bottom-line decrease was compounded by higher marketing expense, which was 16% higher than the first quarter 2010.
· First quarter 2011 net loss of $39.5 million includes $10.7 million of net loss from discontinued operations, specifically the shutdown of the company-owned real-estate brokerage business. The net loss from discontinued operations was mostly comprised of an $8.0 million charge related to disposal of goodwill and $1.9 million in restructuring costs related to the shutdown. The $39.5 million net loss also includes impairment charges of $5.0 million associated with intangible assets and property and equipment in the continuing lead generation operations of our business, plus a $4.5 million charge related to the settlement of previously pending legal matters.
Average 30-Year Fixed Mortgage Rate Recent Trends
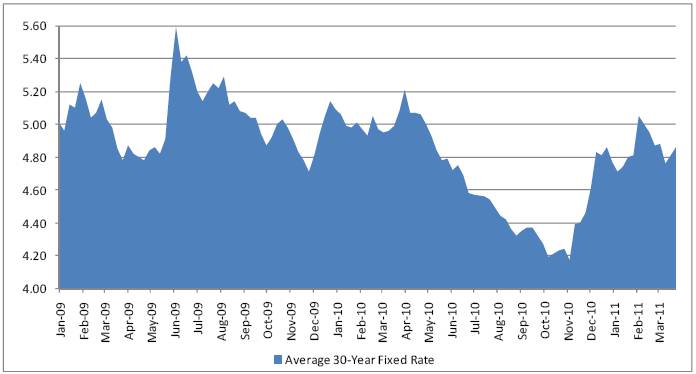
Source: Freddie Mac: Primary Mortgage Market Survey
Freddie Mac’s Primary Mortgage Market Survey consists of the average of 125 lenders’ rates who contributed rates to Freddie Mac. The rates are based on 30-year fixed rate mortgage with 20% down and 80% finance over the life of the loan.
Information Regarding Segment Reporting
During the first quarter 2011, Tree.com changed its segment reporting structure to reflect the discontinuance of the company-owned real estate brokerage operations. This change impacts the segment results only and does not impact the consolidated financial results of Tree.com.
The overall concept that Tree.com employs in determining its reportable segments and related financial information is to present them in a manner consistent with how the chief operating decision maker and executive management view the Tree.com businesses, how the businesses are organized as to segment management, and the focus of the Tree.com businesses with regards to the types of products or services offered or the target market.
In connection with exiting the RealEstate.com, REALTORS® business, Tree.com re-evaluated its reporting segments based on its continuing operations. In prior periods, the segments “LendingTree Loans”, “Exchanges”, “Real Estate” and “Unallocated-Corporate” were presented. Beginning first quarter 2011, the reporting segments have been changed to “LendingTree Loans” and “Exchanges”. The “Exchanges” segment now includes the continuing operations of “Real Estate” and “Unallocated-Corporate”. Segment results for prior periods have been restated to conform to the new presentation.
Business Unit Discussion
LENDINGTREE LOANS SEGMENT
LendingTree Loans Segment Results
$s in millions
|
|
|
|
|
|
|
Q/Q |
|
|
|
Y/Y |
| |||
|
|
|
Q1 2011 |
|
Q4 2010 |
|
% Change |
|
Q1 2010 |
|
% Change |
| |||
|
Revenue |
|
|
|
|
|
|
|
|
|
|
| |||
|
Origination and Sale of Loans |
|
$ |
17.3 |
|
$ |
34.1 |
|
(49 |
)% |
$ |
23.4 |
|
(26 |
)% |
|
Other |
|
$ |
2.0 |
|
$ |
2.9 |
|
(33 |
)% |
$ |
2.3 |
|
(17 |
)% |
|
Total Revenue |
|
$ |
19.3 |
|
$ |
37.0 |
|
(48 |
)% |
$ |
25.7 |
|
(25 |
)% |
|
|
|
|
|
|
|
|
|
|
|
|
| |||
|
Cost of Revenue * |
|
$ |
10.8 |
|
$ |
13.3 |
|
(19 |
)% |
$ |
10.3 |
|
5 |
% |
|
|
|
|
|
|
|
|
|
|
|
|
| |||
|
Operating Expenses* |
|
$ |
15.0 |
|
$ |
15.4 |
|
(3 |
)% |
$ |
9.6 |
|
55 |
% |
|
|
|
|
|
|
|
|
|
|
|
|
| |||
|
Adjusted EBITDA ** |
|
$ |
(6.5 |
) |
$ |
8.3 |
|
(178 |
)% |
$ |
5.8 |
|
(212 |
)% |
|
|
|
|
|
|
|
|
|
|
|
|
| |||
|
EBITDA ** |
|
$ |
(6.9 |
) |
$ |
8.2 |
|
(184 |
)% |
$ |
5.6 |
|
(223 |
)% |
|
|
|
|
|
|
|
|
|
|
|
|
| |||
|
Operating Income |
|
$ |
(7.3 |
) |
$ |
7.8 |
|
(194 |
)% |
$ |
5.1 |
|
(243 |
)% |
|
|
|
|
|
|
|
|
|
|
|
|
| |||
|
Metrics |
|
|
|
|
|
|
|
|
|
|
| |||
|
Purchased loan requests (000s) |
|
114.4 |
|
74.6 |
|
53 |
% |
59.2 |
|
93 |
% | |||
|
Closed - units (000s) |
|
2.3 |
|
3.7 |
|
(36 |
)% |
2.7 |
|
(15 |
)% | |||
|
Closed - units (dollars) |
|
$ |
497.1 |
|
$ |
850.4 |
|
(42 |
)% |
$ |
608.6 |
|
(18 |
)% |
NM = Not Meaningful
* Does not include non-cash compensation, depreciation, gain/loss on disposal of assets, restructuring, amortization, impairment, or litigation settlements and contingencies.
** See separate reconciliation of Adjusted EBITDA and EBITDA to Operating Income/(Loss) by Segment.
LendingTree Loans
First quarter 2011 revenue decreased 48% quarter-over-quarter driven by 36% fewer closed loans. Also during the quarter, the average revenue generated per closed unit decreased 20%, which is the result of both lower loan amounts and revenue margin compression due to higher interest rates. First quarter revenue decreased 25% from the same period last year on 15% fewer closed loans and a 13% decrease in the revenue generated per loan.
During the first quarter 2011, we completed the acquisition of assets of Surepoint Lending, which added to the team an additional 315 licensed loan officers located in Louisville, KY, Tampa, FL, Indianapolis, IN, and Nashville, TN. As a result, the number of licensed loan officers employed by LendingTree Loans grew 121% over the fourth quarter 2010 and was 177% higher than the end of the first quarter 2010. This acquisition provides LendingTree Loans with expanded production capacity, a broader geographical footprint for talent acquisition, and a proven expertise in converting different leads sources like the LendingTree short form and third party aggregators.
Operating expenses were $0.5 million, or 3%, lower quarter-over-quarter and $5.2 million, or 54%, higher year-over-year. Looking at the quarter-over-quarter decrease, the integration of Surepoint brought with it approximately $1.1 million higher operating expenses versus the fourth quarter 2010, but these were offset by personnel-related expense savings in others areas within LendingTree Loans. The year-over-year increase was partially due to Surepoint-related integration expenses of approximately $1.3 million in the first quarter 2011. The year-over-year increase was also the result of higher marketing costs and higher personnel-related expenses resulting from employee growth as the business expanded production capacity versus the first quarter 2010. With higher interest rates than one year ago, greater marketing expense was required to maintain lead volume.
In all, including personnel-related cost of revenue and all other operating expenses in the first quarter 2011, the integration of Surepoint resulted in approximately $2.2 million of additional expense in the quarter.
EXCHANGES SEGMENT
Exchanges Segment Results
$s in millions
|
|
|
|
|
|
|
Q/Q |
|
|
|
Y/Y |
| |||
|
|
|
Q1 2011 |
|
Q4 2010 |
|
% Change |
|
Q1 2010 |
|
% Change |
| |||
|
Revenue |
|
|
|
|
|
|
|
|
|
|
| |||
|
Match Fees |
|
$ |
12.6 |
|
$ |
9.8 |
|
29 |
% |
$ |
14.2 |
|
(11 |
)% |
|
Closed Loan Fees |
|
$ |
1.0 |
|
$ |
1.7 |
|
(41 |
)% |
$ |
3.8 |
|
(73 |
)% |
|
Other |
|
$ |
0.5 |
|
$ |
0.7 |
|
(25 |
)% |
$ |
1.0 |
|
(50 |
)% |
|
Total Revenue |
|
$ |
14.1 |
|
$ |
12.2 |
|
16 |
% |
$ |
19.0 |
|
(26 |
)% |
|
|
|
|
|
|
|
|
|
|
|
|
| |||
|
Cost of Revenue * |
|
$ |
1.3 |
|
$ |
1.5 |
|
(8 |
)% |
$ |
1.5 |
|
(9 |
)% |
|
|
|
|
|
|
|
|
|
|
|
|
| |||
|
Operating Expenses* |
|
$ |
21.8 |
|
$ |
17.7 |
|
23 |
% |
$ |
21.4 |
|
2 |
% |
|
|
|
|
|
|
|
|
|
|
|
|
| |||
|
Adjusted EBITDA ** |
|
$ |
(9.0 |
) |
$ |
(7.0 |
) |
(27 |
)% |
$ |
(3.9 |
) |
(131 |
)% |
|
|
|
|
|
|
|
|
|
|
|
|
| |||
|
EBITDA ** |
|
$ |
(19.7 |
) |
$ |
(10.4 |
) |
(89 |
)% |
$ |
(7.4 |
) |
(165 |
)% |
|
|
|
|
|
|
|
|
|
|
|
|
| |||
|
Operating Income(Loss) |
|
$ |
(21.2 |
) |
$ |
(11.8 |
) |
(79 |
)% |
$ |
(9.3 |
) |
(128 |
)% |
|
|
|
|
|
|
|
|
|
|
|
|
| |||
|
Metrics |
|
|
|
|
|
|
|
|
|
|
| |||
|
Matched requests (000s) |
|
318.9 |
|
268.8 |
|
19 |
% |
406.7 |
|
(22 |
)% | |||
|
Closing - units (000s) |
|
6.3 |
|
9.2 |
|
(32 |
)% |
9.5 |
|
(34 |
)% | |||
|
Closing - units (dollars) |
|
$ |
774.9 |
|
$ |
1,602.2 |
|
(52 |
)% |
$ |
1,710.2 |
|
(55 |
)% |
NM = Not Meaningful
* Does not include non-cash compensation, depreciation, gain/loss on disposal of assets, restructuring, amortization, impairment, or litigation settlements and contingencies.
** See separate reconciliation of Adjusted EBITDA and EBITDA to Operating Income/(Loss) by Segment.
Exchanges
Exchanges revenue in the first quarter 2011 increased 16% quarter-over-quarter and dropped 26% year-over-year. The quarter-over-quarter increase was driven primarily by higher match fee revenue in both the mortgage and non-mortgage businesses, resulting from 21% more matched mortgage loan requests and 15% more matched non-mortgage requests. As a result of continued higher interest rates through the first quarter 2011, lender demand increased, as evidenced by a 10% increase in the number of lenders matching to our refinance consumers and increasing match fees during the quarter. The decline in revenue from the first quarter 2010 was due primarily to a combination of lower match and closing revenue on the lending exchange. The decline in closing revenue was largely by design as previously disclosed pricing actions that we instituted placed a greater emphasis on match fee revenue. However, match fee revenue was also lower year-over-year driven by lower refinance activity. For the fifth consecutive quarter, non-mortgage consumer services such as Education, Insurance, Auto and Home Services accounted for more than 50% of our total matched consumer requests.
Operating expenses increased $4.0 million quarter-over-quarter. The increase was driven primarily by higher marketing expenses, which were required to drive volume and revenue in a higher interest rate environment.
Liquidity and Capital Resources
As of March 31, 2011, Tree.com had $53.5 million in unrestricted cash and cash equivalents, compared to $68.8 million as of December 31, 2010. During the first quarter 2011, Tree.com did not purchase any shares under its previously announced $10 million share repurchase program. The program began in February 2010 and has approximately $4.3 million of share repurchase authorization remaining.
As of March 31, 2011, LendingTree Loans had two committed lines of credit totaling $150 million of borrowing capacity, plus an additional $25 million of uncommitted capacity. The $50 million committed line of credit, which also includes the additional $25 million uncommitted line, is scheduled to expire June 29, 2011. The second line of credit in the amount of $100 million is scheduled to expire October 28, 2011. Borrowings under these lines of credit are used to fund, and are secured by, consumer residential loans that are held for sale. Loans under these lines of credit are repaid from proceeds from the sales of loans held for sale by LendingTree Loans. We expect to renew these lines. The loans held for sale and warehouse lines of credit balances as of March 31, 2011, were $73.3 million and $66.5 million, respectively.
Recent Strategic Development
Tree.com announced today in a separate press release that it signed a definitive agreement to sell its LendingTree Loans business to Discover Financial Services, headquartered in Riverwoods, Illinois, for up to $55.9 million. The sale is expected to close by the end of 2011.
Additional Information and Where to Find It
This release may be deemed to be solicitation material in respect of the proposed transaction discussed above. In connection with the proposed transaction, we plan to file a proxy statement with the Securities and Exchange Commission. STOCKHOLDERS ARE ADVISED TO READ THE PROXY STATEMENT AND ANY OTHER RELEVANT DOCUMENTS FILED WITH THE SEC WHEN THEY BECOME AVAILABLE BECAUSE THOSE DOCUMENTS WILL CONTAIN IMPORTANT INFORMATION ABOUT THE PROPOSED TRANSACTION. The final proxy statement will be mailed to our stockholders. Stockholders may obtain a free copy of the proxy statement when it becomes available, and other documents filed by us with the SEC, at the SEC’s web site at http://www.sec.gov. Free copies of the proxy statement, when it becomes available, and our other filings with the SEC may also be obtained from us. Free copies of our filings may be obtained by directing a request to Tree.com, Inc., 11115 Rushmore Drive, Charlotte, North Carolina 28277, Attention: Secretary.
Conference Call
Tree.com will audio cast its conference call with investors and analysts discussing Tree.com’s first quarter financial results and certain other matters described herein on Thursday, May 12, 2011 at 4:30 p.m. Eastern Time (ET). This call will include the disclosure of certain information, including forward-looking information, which may be material to an investor’s understanding of Tree.com’s business. The live audio cast is open to the public at http://investor-relations.tree.com/.
|
Conference call |
|
Dial in #: 800-946-0713 |
|
719-325-2449 outside the United States/Canada |
|
|
|
To listen to a replay of the call |
|
Toll free #: 888-203-1112 |
|
719-457-0820 from outside the United States/Canada |
|
Replay Passcode: 5978119 |
|
Replay will be available beginning at 6:30 p.m. Eastern Time on Thursday, May 12 until 11:59 p.m. on Thursday, June 9, 2011. |
QUARTERLY FINANCIALS
TREE.COM, INC. AND SUBSIDIARIES
CONSOLIDATED STATEMENTS OF OPERATIONS
(Unaudited)
|
|
|
Three Months |
| ||||
|
|
|
2011 |
|
2010 |
| ||
|
|
|
(In thousands, except |
| ||||
|
Revenue |
|
|
|
|
| ||
|
LendingTree Loans |
|
$ |
19,250 |
|
$ |
25,738 |
|
|
Exchanges |
|
14,124 |
|
18,986 |
| ||
|
Total revenue |
|
33,374 |
|
44,724 |
| ||
|
Cost of revenue |
|
|
|
|
| ||
|
LendingTree Loans |
|
10,764 |
|
10,274 |
| ||
|
Exchanges |
|
1,348 |
|
1,474 |
| ||
|
Total cost of revenue (exclusive of depreciation shown separately below) |
|
12,112 |
|
11,748 |
| ||
|
Gross margin |
|
21,262 |
|
32,976 |
| ||
|
Operating expenses |
|
|
|
|
| ||
|
Selling and marketing expense |
|
23,333 |
|
19,559 |
| ||
|
General and administrative expense |
|
13,103 |
|
11,398 |
| ||
|
Product development |
|
1,535 |
|
1,241 |
| ||
|
Litigation settlements and contingencies |
|
4,502 |
|
16 |
| ||
|
Restructuring expense |
|
389 |
|
2,610 |
| ||
|
Amortization of intangibles |
|
307 |
|
943 |
| ||
|
Depreciation |
|
1,576 |
|
1,374 |
| ||
|
Asset impairments |
|
5,007 |
|
— |
| ||
|
Total operating expenses |
|
49,752 |
|
37,141 |
| ||
|
Operating loss |
|
(28,490 |
) |
(4,165 |
) | ||
|
Other income (expense) |
|
|
|
|
| ||
|
Interest income |
|
— |
|
7 |
| ||
|
Interest expense |
|
(80 |
) |
(166 |
) | ||
|
Total other expense, net |
|
(80 |
) |
(159 |
) | ||
|
Loss before income taxes |
|
(28,570 |
) |
(4,324 |
) | ||
|
Income tax provision |
|
(265 |
) |
(543 |
) | ||
|
Net loss from continuing operations |
|
(28,835 |
) |
(4,867 |
) | ||
|
|
|
|
|
|
| ||
|
Loss from discontinued operations, net of tax |
|
(10,660 |
) |
(1,279 |
) | ||
|
Net loss available to common shareholders |
|
$ |
(39,495 |
) |
$ |
(6,146 |
) |
|
|
|
|
|
|
| ||
|
Weighted average common shares outstanding |
|
10,882 |
|
10,960 |
| ||
|
Weighted average diluted shares outstanding |
|
10,882 |
|
10,960 |
| ||
|
Net loss per share from continuing operations |
|
|
|
|
| ||
|
Basic |
|
$ |
(2.65 |
) |
$ |
(0.44 |
) |
|
Diluted |
|
$ |
(2.65 |
) |
$ |
(0.44 |
) |
|
Net loss per share available to common shareholders |
|
|
|
|
| ||
|
Basic |
|
$ |
(3.63 |
) |
$ |
(0.56 |
) |
|
Diluted |
|
$ |
(3.63 |
) |
$ |
(0.56 |
) |
TREE.COM, INC. AND SUBSIDIARIES
CONSOLIDATED BALANCE SHEETS
|
|
|
March 31, 2011 |
|
December 31, 2010 |
| ||
|
|
|
(unaudited) |
|
|
| ||
|
|
|
(In thousands, except par value and |
| ||||
|
ASSETS: |
|
|
|
|
| ||
|
Cash and cash equivalents |
|
$ |
53,520 |
|
$ |
68,819 |
|
|
Restricted cash and cash equivalents |
|
9,933 |
|
10,549 |
| ||
|
Accounts receivable, net of allowance of $160 and $213, respectively |
|
6,893 |
|
4,264 |
| ||
|
Loans held for sale ($72,697 and $115,908 measured at fair value, respectively) |
|
73,296 |
|
116,681 |
| ||
|
Prepaid and other current assets |
|
11,313 |
|
11,750 |
| ||
|
Current assets of discontinued operations |
|
232 |
|
219 |
| ||
|
Total current assets |
|
155,187 |
|
212,282 |
| ||
|
Property and equipment, net |
|
12,594 |
|
11,580 |
| ||
|
Goodwill |
|
10,741 |
|
3,632 |
| ||
|
Intangible assets, net |
|
41,013 |
|
45,419 |
| ||
|
Other non-current assets |
|
650 |
|
521 |
| ||
|
Non-current assets of discontinued operations |
|
171 |
|
9,368 |
| ||
|
Total assets |
|
$ |
220,356 |
|
$ |
282,802 |
|
|
LIABILITIES: |
|
|
|
|
| ||
|
Warehouse lines of credit |
|
$ |
66,472 |
|
$ |
100,623 |
|
|
Accounts payable, trade |
|
14,451 |
|
7,042 |
| ||
|
Deferred revenue |
|
257 |
|
1,540 |
| ||
|
Deferred income taxes |
|
2,358 |
|
2,358 |
| ||
|
Accrued expenses and other current liabilities |
|
39,069 |
|
39,008 |
| ||
|
Current liabilities of discontinued operations |
|
2,183 |
|
762 |
| ||
|
Total current liabilities |
|
124,790 |
|
151,333 |
| ||
|
Income taxes payable |
|
99 |
|
96 |
| ||
|
Other long-term liabilities |
|
17,322 |
|
15,302 |
| ||
|
Deferred income taxes |
|
14,211 |
|
13,962 |
| ||
|
Non-current liabilities of discontinued operations |
|
282 |
|
288 |
| ||
|
Total liabilities |
|
156,704 |
|
180,981 |
| ||
|
Commitments and contingencies |
|
|
|
|
| ||
|
SHAREHOLDERS’ EQUITY: |
|
|
|
|
| ||
|
Preferred stock $.01 par value; authorized 5,000,000 shares; none issued or outstanding |
|
— |
|
— |
| ||
|
Common stock $.01 par value; authorized 50,000,000 shares; issued 12,111,999 and 11,893,468 shares, respectively, and outstanding 10,988,738 and 10,770,207 shares, respectively |
|
121 |
|
118 |
| ||
|
Additional paid-in capital |
|
910,160 |
|
908,837 |
| ||
|
Accumulated deficit |
|
(838,097 |
) |
(798,602 |
) | ||
|
Treasury stock 1,123,261 shares |
|
(8,532 |
) |
(8,532 |
) | ||
|
Total shareholders’ equity |
|
63,652 |
|
101,821 |
| ||
|
Total liabilities and shareholders’ equity |
|
$ |
220,356 |
|
$ |
282,802 |
|
TREE.COM, INC. AND SUBSIDIARIES
CONSOLIDATED STATEMENTS OF CASH FLOWS
(Unaudited)
|
|
|
Three Months Ended |
| ||||
|
|
|
2011 |
|
2010 |
| ||
|
|
|
(In thousands) |
| ||||
|
Cash flows from operating activities attributable to continuing operations: |
|
|
|
|
| ||
|
Net loss |
|
$ |
(39,495 |
) |
$ |
(6,146 |
) |
|
Less loss from discontinued operations, net of tax |
|
10,660 |
|
1,279 |
| ||
|
Loss from continuing operations |
|
(28,835 |
) |
(4,867 |
) | ||
|
Adjustments to reconcile net loss from continuing operations to net cash provided by (used in) operating activities attributable to continuing operations: |
|
|
|
|
| ||
|
Loss on disposal of fixed assets |
|
— |
|
4 |
| ||
|
Amortization of intangibles |
|
307 |
|
943 |
| ||
|
Depreciation |
|
1,576 |
|
1,374 |
| ||
|
Intangible impairment |
|
4,100 |
|
— |
| ||
|
Property and equipment impairment |
|
907 |
|
— |
| ||
|
Non-cash compensation expense |
|
1,301 |
|
1,094 |
| ||
|
Non-cash restructuring expense |
|
— |
|
93 |
| ||
|
Deferred income taxes |
|
249 |
|
530 |
| ||
|
Gain on origination and sale of loans |
|
(17,309 |
) |
(23,400 |
) | ||
|
Loss on impaired loans not sold |
|
84 |
|
— |
| ||
|
(Gain) loss on sale of real estate acquired in satisfaction of loans |
|
(19 |
) |
368 |
| ||
|
Bad debt expense |
|
(15 |
) |
75 |
| ||
|
Changes in current assets and liabilities: |
|
|
|
|
| ||
|
Accounts receivable |
|
(2,565 |
) |
(386 |
) | ||
|
Origination of loans |
|
(497,233 |
) |
(608,365 |
) | ||
|
Proceeds from sales of loans |
|
562,952 |
|
626,226 |
| ||
|
Principal payments received on loans |
|
274 |
|
180 |
| ||
|
Payments to investors for loan repurchases and early payoff obligations |
|
(164 |
) |
(2,236 |
) | ||
|
Prepaid and other current assets |
|
(1,533 |
) |
(175 |
) | ||
|
Accounts payable and other current liabilities |
|
5,120 |
|
(8,093 |
) | ||
|
Income taxes payable |
|
(3 |
) |
59 |
| ||
|
Deferred revenue |
|
(65 |
) |
(36 |
) | ||
|
Other, net |
|
1,060 |
|
2,588 |
| ||
|
Net cash provided by (used in) operating activities attributable to continuing operations |
|
30,189 |
|
(14,024 |
) | ||
|
Cash flows from investing activities attributable to continuing operations: |
|
|
|
|
| ||
|
Acquisitions, net of cash acquired |
|
(7,804 |
) |
— |
| ||
|
Capital expenditures |
|
(3,498 |
) |
(1,428 |
) | ||
|
Other, net |
|
— |
|
259 |
| ||
|
Net cash used in investing activities attributable to continuing operations |
|
(11,302 |
) |
(1,169 |
) | ||
|
Cash flows from financing activities attributable to continuing operations: |
|
|
|
|
| ||
|
Borrowing under warehouse lines of credit |
|
138,500 |
|
551,088 |
| ||
|
Repayments of warehouse lines of credit |
|
(172,651 |
) |
(546,070 |
) | ||
|
Issuance of common stock, net of withholding taxes |
|
25 |
|
(539 |
) | ||
|
Purchase of treasury stock |
|
— |
|
(667 |
) | ||
|
Increase in restricted cash |
|
— |
|
(600 |
) | ||
|
Net cash provided by (used in) financing activities attributable to continuing operations |
|
(34,126 |
) |
3,212 |
| ||
|
Total cash used in continuing operations |
|
(15,239 |
) |
(11,981 |
) | ||
|
Net cash used in operating activities attributable to discontinued operations |
|
(60 |
) |
(880 |
) | ||
|
Net cash used in investing activities attributable to discontinued operations |
|
— |
|
(181 |
) | ||
|
Total cash used in discontinued operations |
|
(60 |
) |
(1,061 |
) | ||
|
Net decrease in cash and cash equivalents |
|
(15,299 |
) |
(13,042 |
) | ||
|
Cash and cash equivalents at beginning of period |
|
68,819 |
|
86,093 |
| ||
|
Cash and cash equivalents at end of period |
|
$ |
53,520 |
|
$ |
73,051 |
|
TREE.COM RECONCILIATION OF SEGMENT RESULTS TO GAAP ($ in thousands):
|
|
|
For the Three Months Ended March 31, 2011 |
| |||||||
|
|
|
LendingTree |
|
Exchanges |
|
Total |
| |||
|
Revenue |
|
$ |
19,250 |
|
$ |
14,124 |
|
$ |
33,374 |
|
|
Cost of revenue (exclusive of depreciation shown separately below) |
|
10,764 |
|
1,348 |
|
12,112 |
| |||
|
Gross margin |
|
8,486 |
|
12,776 |
|
21,262 |
| |||
|
Operating expenses: |
|
|
|
|
|
|
| |||
|
Selling and marketing expense |
|
7,703 |
|
15,630 |
|
23,333 |
| |||
|
General and administrative expense |
|
7,145 |
|
5,958 |
|
13,103 |
| |||
|
Product development |
|
246 |
|
1,289 |
|
1,535 |
| |||
|
Litigation settlements and contingencies |
|
2 |
|
4,500 |
|
4,502 |
| |||
|
Restructuring expense |
|
295 |
|
94 |
|
389 |
| |||
|
Amortization of intangibles |
|
— |
|
307 |
|
307 |
| |||
|
Depreciation |
|
397 |
|
1,179 |
|
1,576 |
| |||
|
Asset impairments |
|
— |
|
5,007 |
|
5,007 |
| |||
|
Total operating expenses |
|
15,788 |
|
33,964 |
|
49,752 |
| |||
|
Operating loss |
|
(7,302 |
) |
(21,188 |
) |
(28,490 |
) | |||
|
Adjustments to reconcile to EBITDA and Adjusted EBITDA: |
|
|
|
|
|
|
| |||
|
Amortization of intangibles |
|
— |
|
307 |
|
307 |
| |||
|
Depreciation |
|
397 |
|
1,179 |
|
1,576 |
| |||
|
EBITDA from continuing operations |
|
(6,905 |
) |
(19,702 |
) |
(26,607 |
) | |||
|
Restructuring expense |
|
295 |
|
94 |
|
389 |
| |||
|
Non-cash compensation |
|
153 |
|
1,148 |
|
1,301 |
| |||
|
Litigation settlements and contingencies |
|
2 |
|
4,500 |
|
4,502 |
| |||
|
Asset impairments |
|
— |
|
5,007 |
|
5,007 |
| |||
|
Adjusted EBITDA from continuing operations |
|
$ |
(6,455 |
) |
$ |
(8,953 |
) |
$ |
(15,408 |
) |
|
|
|
|
|
|
|
|
| |||
|
Reconciliation to net loss in total: |
|
|
|
|
|
|
| |||
|
Operating loss per above |
|
|
|
|
|
$ |
(28,490 |
) | ||
|
Other expense, net |
|
|
|
|
|
(80 |
) | |||
|
Loss before income taxes |
|
|
|
|
|
(28,570 |
) | |||
|
Income tax provision |
|
|
|
|
|
(265 |
) | |||
|
Net loss from continuing operations |
|
|
|
|
|
(28,835 |
) | |||
|
Loss from discontinued operations, net of tax |
|
|
|
|
|
(10,660 |
) | |||
|
Net loss |
|
|
|
|
|
$ |
(39,495 |
) | ||
TREE.COM RECONCILIATION OF SEGMENT RESULTS TO GAAP ($ in thousands):
|
|
|
For the Three Months Ended December 31, 2010 |
| |||||||
|
|
|
LendingTree |
|
Exchanges |
|
Total |
| |||
|
Revenue |
|
$ |
37,033 |
|
$ |
12,158 |
|
$ |
49,191 |
|
|
Cost of revenue (exclusive of depreciation shown separately below) |
|
13,304 |
|
1,468 |
|
14,772 |
| |||
|
Gross margin |
|
23,729 |
|
10,690 |
|
34,419 |
| |||
|
Operating expenses: |
|
|
|
|
|
|
| |||
|
Selling and marketing expense |
|
7,551 |
|
11,261 |
|
18,812 |
| |||
|
General and administrative expense |
|
7,807 |
|
6,434 |
|
14,241 |
| |||
|
Product development |
|
197 |
|
977 |
|
1,174 |
| |||
|
Litigation settlements and contingencies |
|
— |
|
520 |
|
520 |
| |||
|
Restructuring expense |
|
— |
|
62 |
|
62 |
| |||
|
Amortization of intangibles |
|
— |
|
311 |
|
311 |
| |||
|
Depreciation |
|
391 |
|
1,099 |
|
1,490 |
| |||
|
Asset impairments |
|
— |
|
1,857 |
|
1,857 |
| |||
|
Total operating expenses |
|
15,946 |
|
22,521 |
|
38,467 |
| |||
|
Operating income (loss) |
|
7,783 |
|
(11,831 |
) |
(4,048 |
) | |||
|
Adjustments to reconcile to EBITDA and Adjusted EBITDA: |
|
|
|
|
|
|
| |||
|
Amortization of intangibles |
|
— |
|
311 |
|
311 |
| |||
|
Depreciation |
|
391 |
|
1,099 |
|
1,490 |
| |||
|
EBITDA from continuing operations |
|
8,174 |
|
(10,421 |
) |
(2,247 |
) | |||
|
Restructuring expense |
|
— |
|
62 |
|
62 |
| |||
|
Asset impairments |
|
— |
|
1,857 |
|
1,857 |
| |||
|
Loss on disposal of assets |
|
56 |
|
291 |
|
347 |
| |||
|
Non-cash compensation |
|
79 |
|
721 |
|
800 |
| |||
|
Litigation settlements and contingencies |
|
— |
|
520 |
|
520 |
| |||
|
Post acquisition adjustments |
|
— |
|
(79 |
) |
(79 |
) | |||
|
Adjusted EBITDA from continuing operations |
|
$ |
8,309 |
|
$ |
(7,049 |
) |
$ |
1,260 |
|
|
|
|
|
|
|
|
|
| |||
|
Reconciliation to net loss in total: |
|
|
|
|
|
|
| |||
|
Operating loss per above |
|
|
|
|
|
$ |
(4,048 |
) | ||
|
Other expense, net |
|
|
|
|
|
(78 |
) | |||
|
Loss before income taxes |
|
|
|
|
|
(4,126 |
) | |||
|
Income tax benefit |
|
|
|
|
|
1,786 |
| |||
|
Net loss from continuing operations |
|
|
|
|
|
(2,340 |
) | |||
|
Loss from discontinued operations, net of tax |
|
|
|
|
|
(10,119 |
) | |||
|
Net loss |
|
|
|
|
|
$ |
(12,459 |
) | ||
TREE.COM RECONCILIATION OF SEGMENT RESULTS TO GAAP ($ in thousands):
|
|
|
For the Three Months Ended March 31, 2010 |
| |||||||
|
|
|
LendingTree |
|
Exchanges |
|
Total |
| |||
|
Revenue |
|
$ |
25,738 |
|
$ |
18,986 |
|
$ |
44,724 |
|
|
Cost of revenue (exclusive of depreciation shown separately below) |
|
10,274 |
|
1,474 |
|
11,748 |
| |||
|
Gross margin |
|
15,464 |
|
17,512 |
|
32,976 |
| |||
|
Operating expenses: |
|
|
|
|
|
|
| |||
|
Selling and marketing expense |
|
4,895 |
|
14,664 |
|
19,559 |
| |||
|
General and administrative expense |
|
4,816 |
|
6,582 |
|
11,398 |
| |||
|
Product development |
|
131 |
|
1,110 |
|
1,241 |
| |||
|
Litigation settlements and contingencies |
|
16 |
|
— |
|
16 |
| |||
|
Restructuring expense |
|
7 |
|
2,603 |
|
2,610 |
| |||
|
Amortization of intangibles |
|
— |
|
943 |
|
943 |
| |||
|
Depreciation |
|
490 |
|
884 |
|
1,374 |
| |||
|
Total operating expenses |
|
10,355 |
|
26,786 |
|
37,141 |
| |||
|
Operating income (loss) |
|
5,109 |
|
(9,274 |
) |
(4,165 |
) | |||
|
Adjustments to reconcile to EBITDA and Adjusted EBITDA: |
|
|
|
|
|
|
| |||
|
Amortization of intangibles |
|
— |
|
943 |
|
943 |
| |||
|
Depreciation |
|
490 |
|
884 |
|
1,374 |
| |||
|
EBITDA from continuing operations |
|
5,599 |
|
(7,447 |
) |
(1,848 |
) | |||
|
Restructuring expense |
|
7 |
|
2,603 |
|
2,610 |
| |||
|
Non-cash compensation |
|
131 |
|
963 |
|
1,094 |
| |||
|
Loss on disposal of assets |
|
— |
|
4 |
|
4 |
| |||
|
Litigation settlements and contingencies |
|
16 |
|
— |
|
16 |
| |||
|
Adjusted EBITDA from continuing operations |
|
$ |
5,753 |
|
$ |
(3,877 |
) |
$ |
1,876 |
|
|
|
|
|
|
|
|
|
| |||
|
Reconciliation to net loss in total: |
|
|
|
|
|
|
| |||
|
Operating loss per above |
|
|
|
|
|
$ |
(4,165 |
) | ||
|
Other expense, net |
|
|
|
|
|
(159 |
) | |||
|
Loss before income taxes |
|
|
|
|
|
(4,324 |
) | |||
|
Income tax provision |
|
|
|
|
|
(543 |
) | |||
|
Net loss from continuing operations |
|
|
|
|
|
(4,867 |
) | |||
|
Loss from discontinued operations, net of tax |
|
|
|
|
|
(1,279 |
) | |||
|
Net loss |
|
|
|
|
|
$ |
(6,146 |
) | ||
About Tree.com, Inc.
Tree.com, Inc. (NASDAQ: TREE) is the parent of several brands and businesses that provide information, tools, advice, products and services for critical transactions in our customers’ lives. Our family of brands includes: LendingTree.com®, GetSmart.com®, RealEstate.com®, DegreeTree.comSM, HealthTree.comSM, LendingTreeAutos.com, DoneRight.com®, and InsuranceTree.comSM. Together, these brands serve as an ally for consumers who are looking to comparison shop for loans, real estate and other services from multiple businesses and professionals who will compete for their business.
Tree.com, Inc. is the parent company of wholly owned operating subsidiaries: LendingTree, LLC and Home Loan Center, Inc.
Tree.com, Inc. is headquartered in Charlotte, N.C. and maintains operations solely in the United States. For more information, please visit www.tree.com.
TREE.COM’S PRINCIPLES OF FINANCIAL REPORTING
Tree.com reports Earnings Before Interest, Taxes, Depreciation and Amortization (“EBITDA”), and adjusted for certain items discussed below (“Adjusted EBITDA”), as supplemental measures to GAAP. These measures are two of the primary metrics by which Tree.com evaluates the performance of its businesses, on which its internal budgets are based and by which management is compensated. Tree.com believes that investors should have access to the same set of tools that it uses in analyzing its results. These non-GAAP measures should be considered in addition to results prepared in accordance with GAAP, but should not be considered a substitute for or superior to GAAP results. Tree.com provides and encourages investors to examine the reconciling adjustments between the GAAP and non-GAAP measure which are discussed below.
Definition of Tree.com’s Non-GAAP Measures
Adjusted EBITDA is defined as EBITDA excluding (1) non-cash compensation expense, (2) non-cash intangible asset impairment charges, (3) gain/loss on disposal of assets, (4) restructuring expenses, (5) litigation loss contingencies and settlements, (6) pro forma adjustments for significant acquisitions, and (7) one-time items. Adjusted EBITDA has certain limitations in that it does not take into account the impact to Tree.com’s statement of operations of certain expenses, including depreciation, non-cash compensation and acquisition related accounting. Tree.com endeavors to compensate for the limitations of the non-GAAP measure presented by also providing the comparable GAAP measure with equal or greater prominence and descriptions of the reconciling items, including quantifying such items, to derive the non-GAAP measure.
Pro Forma Results
Tree.com will only present EBITDA and Adjusted EBITDA on a pro forma basis if it views a particular transaction as significant in size or transformational in nature. For the periods presented in this report, there are no transactions that Tree.com has included on a pro forma basis.
One-Time Items
EBITDA and Adjusted EBITDA are presented before one-time items, if applicable. These items are truly one-time in nature and non-recurring, infrequent or unusual, and have not occurred in the past two years or are not expected to recur in the next two years, in accordance with SEC rules. For the periods presented in this report, there are no one-time items.
Non-Cash Expenses That Are Excluded From Tree.com’s Non-GAAP Measures
Non-cash compensation expense consists principally of expense associated with the grants of restricted stock units and stock options. These expenses are not paid in cash, and Tree.com will include the related shares in its future calculations of fully diluted shares outstanding. Upon vesting of restricted stock units and the exercise of certain stock options, the awards will be settled, at Tree.com’s discretion, on a net basis, with Tree.com remitting the required tax withholding amount from its current funds.
Amortization and impairment of intangibles are non-cash expenses relating primarily to acquisitions. At the time of an acquisition, the intangible assets of the acquired company, such as purchase agreements, technology and customer relationships, are valued and amortized over their estimated lives.
Other
REALTORS®—a registered collective membership mark that identifies a real estate professional who is a member of the National Association of REALTORS® and subscribes to its strict Code of Ethics.
Safe Harbor Statement Under the Private Securities Litigation Reform Act of 1995
The matters contained in the discussion above may be considered to be “forward-looking statements” within the meaning of the Securities Act of 1933 and the Securities Exchange Act of 1934, as amended by the Private Securities Litigation Reform Act of 1995. Those statements include statements regarding the intent, belief or current expectations or anticipations of Tree.com and members of our management team. Factors currently known to management that could cause actual results to differ materially from those in forward-looking statements include the following: our ability to operate effectively as a separate public entity following our spin-off from IAC in August 2008; additional costs associated with operating as an independent company; volatility in our stock price and trading volume; our ability to obtain financing on acceptable terms; limitations on our ability to enter into transactions due to spin-related restrictions; adverse conditions in the primary and secondary mortgage markets and in the economy; adverse conditions in our industries; adverse conditions in the credit markets and the inability to renew or replace warehouse lines of credit; seasonality in our businesses; potential liabilities to secondary market purchasers; changes in our relationships with network lenders, real estate professionals, credit providers and secondary market purchasers; breaches of our network security or the misappropriation or misuse of personal consumer information; our failure to provide competitive service; our failure to maintain brand recognition; our ability to attract and retain customers in a cost-effective manner; our ability to develop new products and services and enhance existing ones; competition from our network lenders and affiliated real estate professionals; our failure to comply with existing or changing laws, rules or regulations, or to obtain and maintain required licenses; failure of our network lenders or other affiliated parties to comply with regulatory requirements; failure to maintain the integrity of our systems and infrastructure; liabilities as a result of privacy regulations; failure to adequately protect our intellectual property rights or allegations of infringement of intellectual property rights; changes in our management; deficiencies in our disclosure controls and procedures and internal control over financial reporting; and uncertainties surrounding the potential sale transaction related to the assets of our LendingTree Loans business, including: the uncertainty as to the timing of the closing, whether stockholders will approve the sale transaction, the possibility that competing offers for the assets will be made, the possibility that various closing conditions for the transaction may not be satisfied or waived, and the effects of disruption from the transaction making it more difficult to maintain relationships with employees, customers and other business partners. These and additional factors to be considered are set forth under “Risk Factors” in our Annual Report on Form 10-K for the period ended December 31, 2010, and in our other filings with the Securities and Exchange Commission. We undertake no obligation to update or revise forward-looking statements to reflect changed assumptions, the occurrence of unanticipated events or changes to future operating results or expectations.
Contacts:
Investor Relations
877-640-4856
tree.com-investor.relations@tree.com