Attached files
| file | filename |
|---|---|
| EX-32.2 - EXHIBIT 32.2 - LendingTree, Inc. | tree-2017331x10qexx322.htm |
| EX-32.1 - EXHIBIT 32.1 - LendingTree, Inc. | tree-2017331x10qexx321.htm |
| EX-31.2 - EXHIBIT 31.2 - LendingTree, Inc. | tree-2017331x10qexx312.htm |
| EX-31.1 - EXHIBIT 31.1 - LendingTree, Inc. | tree-2017331x10qexx311.htm |
UNITED STATES
SECURITIES AND EXCHANGE COMMISSION
Washington, D.C. 20549
FORM 10-Q
ý | QUARTERLY REPORT PURSUANT TO SECTION 13 OR 15(d) OF THE SECURITIES EXCHANGE ACT OF 1934 |
For the Quarterly Period Ended March 31, 2017
Or
o | TRANSITION REPORT PURSUANT TO SECTION 13 OR 15(d) OF THE SECURITIES EXCHANGE ACT OF 1934 |
For the transition period from to
Commission File No. 001-34063

LendingTree, Inc.
(Exact name of Registrant as specified in its charter)
Delaware (State or other jurisdiction of incorporation or organization) | 26-2414818 (I.R.S. Employer Identification No.) | |
11115 Rushmore Drive, Charlotte, North Carolina 28277
(Address of principal executive offices)
(704) 541-5351
(Registrant's telephone number, including area code)
Indicate by check mark whether the Registrant (1) has filed all reports required to be filed by Section 13 or 15(d) of the Securities Exchange Act of 1934 during the preceding 12 months (or for such shorter period that the registrant was required to file such reports), and (2) has been subject to such filing requirements for the past 90 days. Yes ý No o
Indicate by check mark whether the Registrant has submitted electronically and posted on its corporate Web site, if any, every Interactive Data File required to be submitted and posted pursuant to Rule 405 of Regulation S-T (§232.405 of this chapter) during the preceding 12 months (or for such shorter period that the Registrant was required to submit and post such files). Yes ý No o
Indicate by check mark whether the Registrant is a large accelerated filer, an accelerated filer, a non-accelerated filer or a smaller reporting company. See the definitions of "large accelerated filer," "accelerated filer" and "smaller reporting company" in Rule 12b-2 of the Exchange Act.
Large accelerated filer o | Accelerated filer x | |
Non-accelerated filer o | Smaller reporting company o | |
(Do not check if a smaller reporting company) | ||
Emerging growth company o | ||
If an emerging growth company, indicate by check mark if the registrant has elected not to use the extended transition period for complying with any new or revised financial accounting standards provided pursuant to Section 13(a) of the Exchange Act. o
Indicate by check mark whether the Registrant is a shell company (as defined in Rule 12b-2 of the Exchange Act). Yes o No ý
As of April 24, 2017, there were 11,943,085 shares of the Registrant's common stock, par value $.01 per share, outstanding, excluding treasury shares.
TABLE OF CONTENTS
Page Number | ||
Management's Discussion and Analysis of Financial Condition and Results of Operations | ||
2
Item 1. Financial Statements
LENDINGTREE, INC. AND SUBSIDIARIES
CONSOLIDATED STATEMENTS OF OPERATIONS AND COMPREHENSIVE INCOME
(Unaudited)
Three Months Ended March 31, | |||||||
2017 | 2016 | ||||||
(in thousands, except per share amounts) | |||||||
Revenue | $ | 132,515 | $ | 94,713 | |||
Costs and expenses: | |||||||
Cost of revenue (exclusive of depreciation and amortization shown separately below) | 3,591 | 3,473 | |||||
Selling and marketing expense | 93,251 | 65,059 | |||||
General and administrative expense | 11,547 | 9,259 | |||||
Product development | 3,623 | 3,885 | |||||
Depreciation | 1,703 | 998 | |||||
Amortization of intangibles | 2,609 | 25 | |||||
Change in fair value of contingent consideration | 8,746 | — | |||||
Severance | 157 | — | |||||
Litigation settlements and contingencies | 404 | 169 | |||||
Total costs and expenses | 125,631 | 82,868 | |||||
Operating income | 6,884 | 11,845 | |||||
Other income (expense), net: | |||||||
Interest expense | (165 | ) | (142 | ) | |||
Income before income taxes | 6,719 | 11,703 | |||||
Income tax benefit (expense) | 1,079 | (4,798 | ) | ||||
Net income from continuing operations | 7,798 | 6,905 | |||||
Loss from discontinued operations, net of tax | (932 | ) | (1,203 | ) | |||
Net income and comprehensive income | $ | 6,866 | $ | 5,702 | |||
Weighted average shares outstanding: | |||||||
Basic | 11,827 | 11,931 | |||||
Diluted | 13,477 | 12,873 | |||||
Income per share from continuing operations: | |||||||
Basic | $ | 0.66 | $ | 0.58 | |||
Diluted | $ | 0.58 | $ | 0.54 | |||
Loss per share from discontinued operations: | |||||||
Basic | $ | (0.08 | ) | $ | (0.10 | ) | |
Diluted | $ | (0.07 | ) | $ | (0.09 | ) | |
Net income per share: | |||||||
Basic | $ | 0.58 | $ | 0.48 | |||
Diluted | $ | 0.51 | $ | 0.44 | |||
The accompanying notes to consolidated financial statements are an integral part of these statements.
3
LENDINGTREE, INC. AND SUBSIDIARIES
CONSOLIDATED BALANCE SHEETS
(Unaudited)
March 31, 2017 | December 31, 2016 | ||||||
(in thousands, except par value and share amounts) | |||||||
ASSETS: | |||||||
Cash and cash equivalents | $ | 105,442 | $ | 91,131 | |||
Restricted cash and cash equivalents | 4,080 | 4,089 | |||||
Accounts receivable (net of allowance of $1,215 and $1,059, respectively) | 52,414 | 41,382 | |||||
Prepaid and other current assets | 4,177 | 4,021 | |||||
Total current assets | 166,113 | 140,623 | |||||
Property and equipment (net of accumulated depreciation of $11,050 and $9,739, respectively) | 35,205 | 35,462 | |||||
Goodwill | 56,457 | 56,457 | |||||
Intangible assets, net | 68,889 | 71,684 | |||||
Deferred income tax assets | 18,901 | 14,610 | |||||
Other non-current assets | 865 | 810 | |||||
Non-current assets of discontinued operations | 3,781 | 3,781 | |||||
Total assets | $ | 350,211 | $ | 323,427 | |||
LIABILITIES: | |||||||
Accounts payable, trade | $ | 4,307 | $ | 5,593 | |||
Accrued expenses and other current liabilities | 58,264 | 49,403 | |||||
Current contingent consideration | 19,399 | — | |||||
Current liabilities of discontinued operations (Note 14) | 12,255 | 11,711 | |||||
Total current liabilities | 94,225 | 66,707 | |||||
Non-current contingent consideration | 12,947 | 23,600 | |||||
Other non-current liabilities | 1,617 | 1,685 | |||||
Total liabilities | 108,789 | 91,992 | |||||
Commitments and contingencies (Note 11) | |||||||
SHAREHOLDERS' EQUITY: | |||||||
Preferred stock $.01 par value; 5,000,000 shares authorized; none issued or outstanding | — | — | |||||
Common stock $.01 par value; 50,000,000 shares authorized; 14,067,306 and 13,955,378 shares issued, respectively, and 11,903,561 and 11,791,633 shares outstanding, respectively | 141 | 140 | |||||
Additional paid-in capital | 1,022,432 | 1,018,010 | |||||
Accumulated deficit | (717,066 | ) | (722,630 | ) | |||
Treasury stock 2,163,745 and 2,163,745 shares, respectively | (64,085 | ) | (64,085 | ) | |||
Total shareholders' equity | 241,422 | 231,435 | |||||
Total liabilities and shareholders' equity | $ | 350,211 | $ | 323,427 | |||
The accompanying notes to consolidated financial statements are an integral part of these statements.
4
LENDINGTREE, INC. AND SUBSIDIARIES
CONSOLIDATED STATEMENT OF SHAREHOLDERS' EQUITY
(Unaudited)
Common Stock | Treasury Stock | ||||||||||||||||||||||||
Total | Number of Shares | Amount | Additional Paid-in Capital | Accumulated Deficit | Number of Shares | Amount | |||||||||||||||||||
(in thousands) | |||||||||||||||||||||||||
Balance as of December 31, 2016 | $ | 231,435 | 13,955 | $ | 140 | $ | 1,018,010 | $ | (722,630 | ) | 2,164 | $ | (64,085 | ) | |||||||||||
Net income and comprehensive income | 6,866 | — | — | — | 6,866 | — | — | ||||||||||||||||||
Non-cash compensation | 2,230 | — | — | 2,230 | — | — | — | ||||||||||||||||||
Purchase of treasury stock | — | — | — | — | — | — | — | ||||||||||||||||||
Issuance of common stock for stock options, restricted stock awards and restricted stock units, net of withholding taxes | (94 | ) | 112 | 1 | (95 | ) | — | — | — | ||||||||||||||||
Cumulative effect adjustment due to ASU 2016-09 | 985 | — | — | 2,287 | (1,302 | ) | — | — | |||||||||||||||||
Balance as of March 31, 2017 | $ | 241,422 | 14,067 | $ | 141 | $ | 1,022,432 | $ | (717,066 | ) | 2,164 | $ | (64,085 | ) | |||||||||||
The accompanying notes to consolidated financial statements are an integral part of these statements.
5
LENDINGTREE, INC. AND SUBSIDIARIES
CONSOLIDATED STATEMENTS OF CASH FLOWS
(Unaudited)
Three Months Ended March 31, | |||||||
2017 | 2016 | ||||||
(in thousands) | |||||||
Cash flows from operating activities attributable to continuing operations: | |||||||
Net income and comprehensive income | $ | 6,866 | $ | 5,702 | |||
Less: Loss from discontinued operations, net of tax | 932 | 1,203 | |||||
Income from continuing operations | 7,798 | 6,905 | |||||
Adjustments to reconcile income from continuing operations to net cash provided by operating activities attributable to continuing operations: | |||||||
Loss on disposal of fixed assets | 273 | 127 | |||||
Amortization of intangibles | 2,609 | 25 | |||||
Depreciation | 1,703 | 998 | |||||
Rental amortization of intangibles and depreciation | 262 | — | |||||
Non-cash compensation expense | 2,230 | 2,633 | |||||
Deferred income taxes | (3,307 | ) | — | ||||
Change in fair value of contingent consideration | 8,746 | — | |||||
Bad debt expense | 157 | 255 | |||||
Amortization of debt issuance costs | 61 | 61 | |||||
Changes in current assets and liabilities: | |||||||
Accounts receivable | (11,132 | ) | (7,148 | ) | |||
Prepaid and other current assets | (269 | ) | (1,153 | ) | |||
Accounts payable, accrued expenses and other current liabilities | 6,086 | 2,906 | |||||
Income taxes payable | 2,143 | 4,762 | |||||
Other, net | (176 | ) | — | ||||
Net cash provided by operating activities attributable to continuing operations | 17,184 | 10,371 | |||||
Cash flows from investing activities attributable to continuing operations: | |||||||
Capital expenditures | (1,896 | ) | (2,154 | ) | |||
Decrease in restricted cash | 9 | 2,457 | |||||
Net cash (used in) provided by investing activities attributable to continuing operations | (1,887 | ) | 303 | ||||
Cash flows from financing activities attributable to continuing operations: | |||||||
Payments related to net-share settlement of stock-based compensation, net of proceeds from exercise of stock options | (95 | ) | (2,585 | ) | |||
Payment of equity offering costs | — | (23 | ) | ||||
Payment of debt issuance costs | — | (8 | ) | ||||
Purchase of treasury stock | — | (40,499 | ) | ||||
Net cash used in financing activities attributable to continuing operations | (95 | ) | (43,115 | ) | |||
Total cash provided by (used in) continuing operations | 15,202 | (32,441 | ) | ||||
Net cash used in operating activities attributable to discontinued operations | (891 | ) | (308 | ) | |||
Total cash used in discontinued operations | (891 | ) | (308 | ) | |||
Net increase (decrease) in cash and cash equivalents | 14,311 | (32,749 | ) | ||||
Cash and cash equivalents at beginning of period | 91,131 | 206,975 | |||||
Cash and cash equivalents at end of period | $ | 105,442 | $ | 174,226 | |||
The accompanying notes to consolidated financial statements are an integral part of these statements.
6
LENDINGTREE, INC. AND SUBSIDIARIES
NOTES TO CONSOLIDATED FINANCIAL STATEMENTS
(Unaudited)
NOTE 1—ORGANIZATION
Company Overview
LendingTree, Inc. ("LendingTree" or the "Company"), is the parent of LendingTree, LLC and several companies owned by LendingTree, LLC.
LendingTree operates what it believes to be the leading online loan marketplace for consumers seeking loans and other credit-based offerings. The Company offers consumers tools and resources, including free credit scores, that facilitate comparison-shopping for mortgage loans, home equity loans, reverse mortgage loans, auto loans, credit cards, personal loans, student loans, small business loans and other related offerings. The Company primarily seeks to match in-market consumers with multiple lenders on its marketplace who can provide them with competing quotes for the loans or credit-based offerings they are seeking. The Company also serves as a valued partner to lenders seeking an efficient, scalable and flexible source of customer acquisition with directly measurable benefits, by matching the consumer loan inquiries it generates with these lenders.
The consolidated financial statements include the accounts of LendingTree and all its wholly-owned entities. Intercompany transactions and accounts have been eliminated.
Discontinued Operations
The LendingTree Loans business is presented as discontinued operations in the accompanying consolidated balance sheets, consolidated statements of operations and comprehensive income and consolidated cash flows for all periods presented. The notes accompanying these consolidated financial statements reflect the Company's continuing operations and, unless otherwise noted, exclude information related to the discontinued operations. See Note 14 —Discontinued Operations for additional information.
Basis of Presentation
The accompanying unaudited interim consolidated financial statements as of March 31, 2017 and for the three months ended March 31, 2017 and 2016, respectively, have been prepared in accordance with accounting principles generally accepted in the United States of America ("GAAP") for interim financial information and pursuant to the rules and regulations of the U.S. Securities and Exchange Commission ("SEC"). In the opinion of management, the unaudited interim consolidated financial statements have been prepared on the same basis as the audited financial statements, and include all adjustments, consisting only of normal recurring adjustments, necessary for the fair presentation of the Company's financial position for the periods presented. The results for the three months ended March 31, 2017 are not necessarily indicative of the results to be expected for the year ending December 31, 2017, or any other period. The accompanying consolidated balance sheet as of December 31, 2016 was derived from audited financial statements included in the Company's annual report on Form 10-K for the year ended December 31, 2016 (the "2016 Annual Report"). The accompanying consolidated financial statements do not include all of the information and footnotes required by GAAP for annual financial statements. Accordingly, they should be read in conjunction with the audited financial statements and notes thereto included in the 2016 Annual Report.
NOTE 2—SIGNIFICANT ACCOUNTING POLICIES
Accounting Estimates
Management is required to make certain estimates and assumptions during the preparation of the consolidated financial statements in accordance with GAAP. These estimates and assumptions impact the reported amount of assets and liabilities and disclosures of contingent assets and liabilities as of the date of the consolidated financial statements. They also impact the reported amount of net earnings during any period. Actual results could differ from those estimates.
Significant estimates underlying the accompanying consolidated financial statements, including discontinued operations, include: loan loss obligations; the recoverability of long-lived assets, goodwill and intangible assets; the determination of income taxes payable and deferred income taxes, including related valuation allowances; contingent consideration related to business combinations; litigation accruals; various other allowances, reserves and accruals; and assumptions related to the determination of stock-based compensation.
7
LENDINGTREE, INC. AND SUBSIDIARIES
NOTES TO CONSOLIDATED FINANCIAL STATEMENTS (Continued)
Certain Risks and Concentrations
LendingTree's business is subject to certain risks and concentrations including dependence on third-party technology providers, exposure to risks associated with online commerce security and credit card fraud.
Financial instruments, which potentially subject the Company to concentration of credit risk at March 31, 2017, consist primarily of cash and cash equivalents and accounts receivable, as disclosed in the consolidated balance sheet. Cash and cash equivalents are in excess of Federal Deposit Insurance Corporation insurance limits, but are maintained with quality financial institutions of high credit. The Company generally requires certain network lenders to maintain security deposits with the Company, which in the event of non-payment, would be applied against any accounts receivable outstanding.
Due to the nature of the mortgage lending industry, interest rate fluctuations may negatively impact future revenue from the Company's lender marketplace.
Lenders participating on the Company's marketplace can offer their products directly to consumers through brokers, mass marketing campaigns or through other traditional methods of credit distribution. These lenders can also offer their products online, either directly to prospective borrowers, through one or more online competitors, or both. If a significant number of potential consumers are able to obtain loans from participating lenders without utilizing the Company's services, its ability to generate revenue may be limited. Because the Company does not have exclusive relationships with the lenders whose loan offerings are offered on its online marketplace, consumers may obtain offers and loans from these lenders without using its service.
The Company maintains operations solely in the United States.
Litigation Settlements and Contingencies
Litigation settlements and contingencies consists of expenses related to actual or anticipated litigation settlements, in addition to legal fees incurred in connection with various patent litigation claims the Company pursues against others.
Recent Accounting Pronouncements
In January 2017, the Financial Accounting Standards Board ("FASB") issued Accounting Standards Update ("ASU") 2017-04 which eliminates the requirement to calculate the implied fair value of goodwill to measure a goodwill impairment charge (Step 2 of the goodwill impairment test). Instead, an impairment charge will be based on the excess of the carrying amount over the fair value. This ASU is effective for annual and interim impairment tests performed in periods beginning after December 15, 2019. Early adoption is permitted for annual and interim goodwill impairment testing dates after January 1, 2017. The Company is evaluating the impact this ASU will have on its consolidated financial statements and whether to early adopt.
In November 2016, the FASB issued ASU 2016-18 which is intended to reduce the diversity in the classification and presentation of changes in restricted cash in the statement of cash flows, by requiring entities to combine the changes in cash and cash equivalents and restricted cash in one line. As a result, entities will no longer present transfers between cash and cash equivalents and restricted cash in the statement of cash flows. In addition, if more than one line item is recorded on the balance sheet for cash and cash equivalents and restricted cash, a reconciliation between the statement of cash flows and balance sheet is required. This ASU is effective for annual and interim reporting periods beginning after December 15, 2017, with early adoption permitted. The retrospective transition method, requiring adjustment to all comparative periods presented, is required. The Company is evaluating the impact this ASU will have on its consolidated financial statements and whether to early adopt.
In August 2016, the FASB issued ASU 2016-15 which addresses eight cash flow classification issues, eliminating the diversity in practice. This ASU is effective for annual and interim reporting periods beginning after December 15, 2017, with early adoption permitted. The retrospective transition method, requiring adjustment to all comparative periods presented, is required unless it is impracticable for some of the amendments, in which case those amendments would be prospectively applied as of the earliest date practicable. The Company is evaluating the impact this ASU will have on its consolidated financial statements and whether to early adopt.
In March 2016, the FASB issued ASU 2016-09 which simplifies various aspects related to how share-based payments are accounted for and presented in the financial statements, including the income tax consequences, classification of awards as either equity or liabilities, forfeitures and classification of excess tax benefits on the statement of cash flows. This ASU was effective for annual and interim reporting periods beginning after December 15, 2016, with early adoption permitted. Upon adoption, any adjustments are to be reflected as of the beginning of the fiscal year of adoption. The Company adopted this ASU during the first quarter of 2017.
8
LENDINGTREE, INC. AND SUBSIDIARIES
NOTES TO CONSOLIDATED FINANCIAL STATEMENTS (Continued)
The new standard requires excess tax benefits and deficiencies, which arise due to the difference in the measure of stock compensation and the amount deductible for tax purposes, to be recorded in earnings in income tax expense. These excess tax benefits and deficiencies were generally previously recorded in additional paid-in capital and had no impact on net income. The standard required prospective adoption for this portion of the new guidance. During the first quarter of 2017, the Company recognized $3.8 million of excess tax benefit in income tax expense in the accompanying consolidated statements of operations and comprehensive income. Additionally, the new standard requires the excess tax benefits and deficiencies to be classified as an operating activity in the accompanying consolidated statements of cash flows. These excess tax benefits and deficiencies were previously recorded as a financing activity in the statement of cash flows. The standard allowed for either prospective or retrospective adoption for the change in presentation in the statement of cash flows. The Company elected to retrospectively adopt the classification change in the statement of cash flows. Accordingly, prior periods have been adjusted, which increased the cash provided by operating activities and decreased the cash provided by financing activities by $2.3 million in the first quarter of 2016 in the accompanying consolidated statements of cash flows. The standard also allows for an election by the Company to either estimate forfeitures, as required under previous guidance, or recognize forfeitures when they occur. The Company elected to recognize forfeitures of stock awards as they occur, with the modified retrospective transition method required. Accordingly, the Company recognized a $1.4 million cumulative-effect adjustment to retained earnings as of January 1, 2017.
In February 2016, the FASB issued ASU 2016-02 related to leases. This ASU requires the recognition of a right-of-use lease asset and a lease liability by lessees for all leases greater than one year in duration. This ASU is effective for annual and interim reporting periods beginning after December 15, 2018, with early adoption permitted. The guidance must be adopted using a modified retrospective transition. The Company is evaluating the impact this ASU will have on its consolidated financial statements and whether to early adopt.
In May 2014, the FASB issued ASU 2014-09 related to revenue recognition. This ASU was initiated as a joint project between the FASB and the International Accounting Standards Board ("IASB") to clarify the principles for recognizing revenue and to develop a common revenue standard for GAAP and international financial reporting standards ("IFRS"). This guidance will supersede the existing revenue recognition requirements in Accounting Standards Codification ("ASC") Topic 605, Revenue Recognition and was set to be effective for annual reporting periods beginning after December 15, 2016. However, in July 2015, the FASB deferred the effective date by one year, such that the standard will be effective for annual reporting periods beginning after December 15, 2017. Early adoption is permitted as of the original effective date of December 15, 2016. The ASU can be applied (i) retrospectively to each prior period presented or (ii) retrospectively with the cumulative effect of initially adopting the ASU recognized at the date of initial application. In March 2016, the FASB issued ASU 2016-08, which clarifies the principal versus agent guidance under ASU 2014-09. In April 2016, the FASB issued ASU 2016-10, which clarifies the identification of distinct performance obligations in a contract. In May 2016, the FASB issued ASU 2016-12, which clarifies the guidance on assessing collectability, presenting sales taxes, measuring noncash consideration and certain other transition matters. The clarification ASU's must be adopted concurrently with the adoption of ASU 2014-09. The Company is evaluating the impact these ASU's will have on its consolidated financial statements and which implementation method to apply.
NOTE 3—RESTRICTED CASH
Restricted cash and cash equivalents consists of the following (in thousands):
March 31, 2017 | December 31, 2016 | ||||||
Cash in escrow from sale of LendingTree Loans (a) | $ | 4,032 | $ | 4,032 | |||
Other | 48 | 57 | |||||
Total restricted cash and cash equivalents | $ | 4,080 | $ | 4,089 | |||
(a) | Home Loan Center, Inc. ("HLC"), a subsidiary of the Company, continues to be liable for certain indemnification obligations, repurchase obligations and premium repayment obligations following the sale of substantially all of the operating assets of its LendingTree Loans business in the second quarter of 2012. |
9
LENDINGTREE, INC. AND SUBSIDIARIES
NOTES TO CONSOLIDATED FINANCIAL STATEMENTS (Continued)
NOTE 4—GOODWILL AND INTANGIBLE ASSETS
The balance of goodwill and intangible assets, net is as follows (in thousands):
March 31, 2017 | December 31, 2016 | ||||||
Goodwill | $ | 539,545 | $ | 539,545 | |||
Accumulated impairment losses | (483,088 | ) | (483,088 | ) | |||
Net goodwill | $ | 56,457 | $ | 56,457 | |||
Intangible assets with indefinite lives | $ | 10,142 | $ | 10,142 | |||
Intangible assets with definite lives, net | 58,747 | 61,542 | |||||
Total intangible assets, net | $ | 68,889 | $ | 71,684 | |||
Goodwill and Indefinite-Lived Intangible Assets
The Company's goodwill is associated with its one reportable segment. Intangible assets with indefinite lives relate to the Company's trademarks.
Intangible Assets with Definite Lives
Intangible assets with definite lives relate to the following (in thousands):
Cost | Accumulated Amortization | Net | |||||||||
Technology | $ | 28,300 | $ | (2,436 | ) | $ | 25,864 | ||||
Customer lists | 28,100 | (1,245 | ) | 26,855 | |||||||
Trademarks and tradenames | 5,342 | (1,162 | ) | 4,180 | |||||||
Tenant leases | 2,030 | (187 | ) | 1,843 | |||||||
Other | 251 | (246 | ) | 5 | |||||||
Balance at March 31, 2017 | $ | 64,023 | $ | (5,276 | ) | $ | 58,747 | ||||
Cost | Accumulated Amortization | Net | |||||||||
Technology | $ | 28,300 | $ | (659 | ) | $ | 27,641 | ||||
Customer lists | 28,100 | (639 | ) | 27,461 | |||||||
Trademarks and tradenames | 5,342 | (937 | ) | 4,405 | |||||||
Tenant leases | 2,030 | — | 2,030 | ||||||||
Other | 250 | (245 | ) | 5 | |||||||
Balance at December 31, 2016 | $ | 64,022 | $ | (2,480 | ) | $ | 61,542 | ||||
10
LENDINGTREE, INC. AND SUBSIDIARIES
NOTES TO CONSOLIDATED FINANCIAL STATEMENTS (Continued)
Amortization of intangible assets with definite lives is computed on a straight-line basis and, based on balances as of March 31, 2017, future amortization is estimated to be as follows (in thousands):
Amortization Expense | |||
Remainder of current year | $ | 8,380 | |
Year ending December 31, 2018 | 11,037 | ||
Year ending December 31, 2019 | 10,783 | ||
Year ending December 31, 2020 | 9,935 | ||
Year ending December 31, 2021 | 3,270 | ||
Thereafter | 15,342 | ||
Total intangible assets with definite lives, net | $ | 58,747 | |
NOTE 5—BUSINESS ACQUISITION
On November 16, 2016, the Company acquired all of the membership interests of Iron Horse Holdings, LLC, which does business under the name CompareCards ("CompareCards"). CompareCards is an online marketing platform for credit cards, which the Company plans to use to grow its existing credit card business. The Company paid $80.7 million in initial cash consideration and will make two earnout payments, each ranging from zero to $22.5 million, based on the amount of earnings before interest, taxes, depreciation and amortization CompareCards generates during the periods of January 1, 2017 through December 31, 2017 and January 1, 2018 through December 31, 2018, or up to $45.0 million in aggregate payments (the “Earnout Payments”). The purchase price for the acquisition is $103.8 million comprised of an upfront cash payment of $80.7 million on November 16, 2016 and $23.1 million for the estimated fair value of the Earnout Payments at the time of closing the acquisition.
The estimated fair value of the Earnout Payments is determined using an option pricing model. The estimated value of the Earnout Payments is based upon available information and certain assumptions, known at the time of this report, which management believes are reasonable. Any differences in the actual Earnout Payments from the current estimated fair value of the Earnout Payments will be recorded in operating income (expense) in the consolidated statements of operations. As of March 31, 2017, the estimated fair value of the Earnout Payments totaled $31.8 million, $19.4 million of which is included in current contingent consideration and $12.4 million of which is included in non-current contingent consideration in the accompanying consolidated balance sheet. During the first quarter of 2017, the Company recorded $8.7 million of contingent consideration expense in the consolidated statement of operations and comprehensive income due to the change in estimated fair value of the Earnout Payments.
The acquisition has been accounted for as a business combination. During the quarter ended March 31, 2017, the Company completed the determination of the final allocation of the purchase price with respect to the assets acquired and liabilities assumed as follows (in thousands):
Fair Value | |||
Accounts receivable | $ | 3,538 | |
Total intangible assets with definite lives, net | 55,400 | ||
Goodwill | 52,450 | ||
Accounts payable and accrued liabilities | (7,638 | ) | |
Total purchase price | $ | 103,750 | |
Acquisition-related costs in the first quarter of 2017 of $0.1 million are included in general and administrative expense in the accompanying consolidated statement of operations and comprehensive income.
The unaudited pro forma financial results for the first quarter of 2016 combines the consolidated results of the Company and CompareCards giving effect to the acquisition as if it had been completed on January 1, 2015. This unaudited pro forma financial information is presented for informational purposes only and is not indicative of future operations or results had the acquisition been completed as of January 1, 2015, or any other date.
The unaudited pro forma financial results include adjustments for additional amortization expense based on the fair value of the intangible assets with definite lives and their estimated useful lives. The provision for income taxes from continuing operations
11
LENDINGTREE, INC. AND SUBSIDIARIES
NOTES TO CONSOLIDATED FINANCIAL STATEMENTS (Continued)
has also been adjusted to reflect the results of operations of CompareCards and the adjustment to historical results. CompareCards did not pay taxes at the entity level as it was a limited liability company whose members elected for it to be taxed as a partnership.
Three Months Ended March 31, 2016 | |||
(in thousands) | |||
Pro forma revenue | $ | 110,293 | |
Pro forma net income from continuing operations | $ | 5,445 | |
NOTE 6—ACCRUED EXPENSES AND OTHER CURRENT LIABILITIES
Accrued expenses and other current liabilities consist of the following (in thousands):
March 31, 2017 | December 31, 2016 | ||||||
Accrued litigation liabilities | $ | 1,005 | $ | 736 | |||
Accrued advertising expense | 32,021 | 26,976 | |||||
Accrued compensation and benefits | 3,846 | 5,626 | |||||
Accrued professional fees | 1,156 | 1,411 | |||||
Customer deposits and escrows | 5,083 | 5,041 | |||||
Other | 15,153 | 9,613 | |||||
Total accrued expenses and other current liabilities | $ | 58,264 | $ | 49,403 | |||
NOTE 7—SHAREHOLDERS' EQUITY
Basic and diluted income per share was determined based on the following share data (in thousands):
Three Months Ended March 31, | |||||
2017 | 2016 | ||||
Weighted average basic common shares | 11,827 | 11,931 | |||
Effect of stock options | 1,553 | 840 | |||
Effect of dilutive share awards | 97 | 102 | |||
Weighted average diluted common shares | 13,477 | 12,873 | |||
No shares related to potentially dilutive securities were excluded from the calculation of diluted income per share for the three months ended March 31, 2017 and 2016.
Common Stock Repurchases
In each of January 2010, May 2014, January 2016 and February 2016, the board of directors authorized and the Company announced the repurchase of up to $10.0 million, $10.0 million, $50.0 million and $40.0 million, respectively, of LendingTree's common stock. During the three months ended March 31, 2016, the Company purchased 580,014 shares of its common stock pursuant to this stock repurchase program. At March 31, 2017, approximately $48.7 million of the previous authorizations to repurchase common stock remain available for the Company to purchase its common stock.
12
LENDINGTREE, INC. AND SUBSIDIARIES
NOTES TO CONSOLIDATED FINANCIAL STATEMENTS (Continued)
NOTE 8—STOCK-BASED COMPENSATION
Non-cash compensation related to equity awards is included in the following line items in the accompanying consolidated statements of operations and comprehensive income (in thousands):
Three Months Ended March 31, | |||||||
2017 | 2016 | ||||||
Cost of revenue | $ | 43 | $ | 41 | |||
Selling and marketing expense | 485 | 726 | |||||
General and administrative expense | 1,219 | 1,310 | |||||
Product development | 483 | 556 | |||||
Total non-cash compensation | $ | 2,230 | $ | 2,633 | |||
Stock Options
A summary of changes in outstanding stock options is as follows:
Number of Options | Weighted Average Exercise Price | Weighted Average Remaining Contractual Term | Aggregate Intrinsic Value(a) | |||||||||
(per option) | (in years) | (in thousands) | ||||||||||
Options outstanding at January 1, 2017 | 1,991,802 | $ | 21.23 | |||||||||
Granted (b) | 4,079 | 112.99 | ||||||||||
Exercised | (78,838 | ) | 31.40 | |||||||||
Forfeited | (20,001 | ) | 71.04 | |||||||||
Expired | — | — | ||||||||||
Options outstanding at March 31, 2017 | 1,897,042 | 20.48 | 4.88 | $ | 198,952 | |||||||
Options exercisable at March 31, 2017 | 1,148,052 | $ | 12.93 | 3.18 | $ | 129,061 | ||||||
(a) | The aggregate intrinsic value represents the total pre-tax intrinsic value (the difference between the Company's closing stock price of $125.35 on the last trading day of the quarter ended March 31, 2017 and the exercise price, multiplied by the number of shares covered by in-the-money options) that would have been received by the option holders had all option holders exercised their options on March 31, 2017. The intrinsic value changes based on the market value of the Company's common stock. |
(b) | During the three months ended March 31, 2017, the Company granted stock options to certain employees and new members of the board of directors with a weighted average grant date fair value per share of $57.24, calculated using the Black-Scholes option pricing model, which vesting periods include (a) three years from the grant date and (b) two years from the grant date. |
For purposes of determining stock-based compensation expense, the weighted average grant date fair value per share of the stock options was estimated using the Black-Scholes option pricing model, which requires the use of various key assumptions. The weighted average assumptions used are as follows:
Expected term (1) | 5.75 - 6.00 years | |
Expected dividend (2) | — | |
Expected volatility (3) | 52% | |
Risk-free interest rate (4) | 2.08% - 2.17% | |
(1) | The expected term of stock options granted was calculated using the 'Simplified Method', which utilizes the midpoint between the weighted average time of vesting and the end of the contractual term. This method was utilized for the stock options due to a lack of historical exercise behavior by the Company's employees. |
13
LENDINGTREE, INC. AND SUBSIDIARIES
NOTES TO CONSOLIDATED FINANCIAL STATEMENTS (Continued)
(2) | For all stock options granted in 2017, no dividends are expected to be paid over the contractual term of the stock options, resulting in a zero expected dividend rate. |
(3) | The expected volatility rate is based on the historical volatility of the Company's common stock. |
(4) | The risk-free interest rate is specific to the date of grant. The risk-free interest rate is based on U.S. Treasury yields for notes with comparable expected terms as the awards, in effect at the grant date. |
Restricted Stock Units and Restricted Stock
A summary of the changes in outstanding nonvested restricted stock units ("RSUs") and restricted stock is as follows:
RSUs | ||||||
Number of Units | Weighted Average Grant Date Fair Value | |||||
(per unit) | ||||||
Nonvested at January 1, 2017 | 152,374 | $ | 65.64 | |||
Granted | 45,626 | 112.20 | ||||
Vested | (54,792 | ) | 49.71 | |||
Forfeited | (5,647 | ) | 76.27 | |||
Nonvested at March 31, 2017 | 137,561 | $ | 87.17 | |||
Restricted Stock | ||||||
Number of Shares | Weighted Average Grant Date Fair Value | |||||
(per share) | ||||||
Nonvested at January 1, 2017 | 14,464 | $ | 25.14 | |||
Granted | — | — | ||||
Vested | — | — | ||||
Forfeited | — | — | ||||
Nonvested at March 31, 2017 | 14,464 | $ | 25.14 | |||
Restricted Stock Units with Performance Conditions
A summary of the changes in outstanding nonvested RSUs with performance conditions is as follows:
RSUs with Performance Conditions | ||||||
Number of Units | Weighted Average Grant Date Fair Value | |||||
(per unit) | ||||||
Nonvested at January 1, 2017 | 44,509 | $ | 88.28 | |||
Granted | — | — | ||||
Vested | — | — | ||||
Forfeited | — | — | ||||
Nonvested at March 31, 2017 | 44,509 | $ | 88.28 | |||
14
LENDINGTREE, INC. AND SUBSIDIARIES
NOTES TO CONSOLIDATED FINANCIAL STATEMENTS (Continued)
NOTE 9—INCOME TAXES
Three Months Ended March 31, | |||||||
2017 | 2016 | ||||||
(in thousands, except percentages) | |||||||
Income tax benefit (expense) | $ | 1,079 | $ | (4,798 | ) | ||
Effective tax rate | (16.1 | )% | 41.0 | % | |||
For the three months ended March 31, 2017, the effective tax rate varied from the federal statutory rate of 35% primarily due to a tax benefit of $3.8 million recognized for excess tax benefits due to employee exercises of stock options and vesting of restricted stock in accordance with ASU 2016-09. See Note 2 —Significant Accounting Policies —Recent Accounting Pronouncements for additional information.
For the three months ended March 31, 2016, the effective tax rate varied from the federal statutory rate of 35% primarily due to state taxes.
Three Months Ended March 31, | |||||||
2017 | 2016 | ||||||
(in thousands, except percentages) | |||||||
Income tax expense - excluding excess tax benefit on stock compensation | $ | (2,683 | ) | $ | (4,798 | ) | |
Excess tax benefit on stock compensation | 3,762 | — | |||||
Income tax benefit (expense) | $ | 1,079 | $ | (4,798 | ) | ||
NOTE 10—REVOLVING CREDIT FACILITY
Senior Secured Revolving Credit Facility
On October 22, 2015, the Company's wholly-owned subsidiary, LendingTree, LLC, entered into a $125.0 million five-year senior secured revolving credit facility which matures on October 22, 2020 (the “Revolving Credit Facility”). The proceeds of the Revolving Credit Facility can be used to finance the working capital needs, capital expenditures and general corporate purposes, including to finance permitted acquisitions. As of March 31, 2017, the Company does not have any borrowings outstanding under the Revolving Credit Facility.
Up to $10.0 million of the Revolving Credit Facility will be available for short-term loans, referred to as swingline loans. Additionally, up to $10.0 million of the Revolving Credit Facility will be available for the issuance of letters of credit. Under certain conditions, the Company will be permitted to add one or more term loans and/or increase revolving commitments under the Revolving Credit Facility up to an aggregate amount of $50.0 million.
The Company’s borrowings under the Revolving Credit Facility bear interest at annual rates that, at the Company’s option, will be either:
• | a base rate generally defined as the sum of (i) the greater of (a) the prime rate of SunTrust Bank, (b) the federal funds effective rate plus 0.5% and (c) the LIBO rate (defined below) on a daily basis applicable for an interest period of one month plus 1.0% and (ii) an applicable percentage of 1.0% to 2.0% based on the funded debt to consolidated EBITDA ratio; or |
• | a LIBO rate generally defined as the sum of (i) the rate for Eurodollar deposits in the applicable currency and (ii) an applicable percentage of 2.0% to 3.0% based on the funded debt to consolidated EBITDA ratio. |
All swingline loans bear interest at the base rate defined above. Interest on the Company’s borrowings are payable quarterly in arrears for base rate loans and on the last day of each interest rate period (but not less often than three months) for LIBO rate loans.
15
LENDINGTREE, INC. AND SUBSIDIARIES
NOTES TO CONSOLIDATED FINANCIAL STATEMENTS (Continued)
The Revolving Credit Facility contains certain restrictive financial covenants, which include a funded debt to consolidated EBITDA ratio and a consolidated EBITDA to interest expense ratio. In addition, the Revolving Credit Facility contains customary affirmative and negative covenants in addition to events of default for a transaction of this type that, among other things, restrict additional indebtedness, liens, mergers or certain fundamental changes, asset dispositions, dividends, stock repurchases and other restricted payments, transactions with affiliates, sale-leaseback transactions, hedging transactions, loans and investments and other matters customarily restricted in such agreements. The Company was in compliance with all covenants at March 31, 2017.
The Revolving Credit Facility requires LendingTree, LLC to pledge as collateral, subject to certain customary exclusions, 100% of its assets, including 100% of its equity in all of its subsidiaries. The obligations under this facility are unconditionally guaranteed on a senior basis by LendingTree, Inc. and specific subsidiaries of LendingTree, LLC, which guaranties are secured by a pledge as collateral, subject to certain customary exclusions, of 100% of each of such guarantor's assets, including 100% of its equity in all of its subsidiaries.
The Company is required to pay an unused commitment fee quarterly in arrears on the difference between committed amounts and amounts actually borrowed under the Revolving Credit Facility equal to an applicable percentage of 0.25% to 0.5% per annum based on a funded debt to consolidated EBITDA ratio. The Company is required to pay a letter of credit participation fee and a letter of credit fronting fee quarterly in arrears. The letter of credit participation fee is based upon the aggregate face amount of outstanding letters of credit at an applicable percentage of 2.0% to 3.0% based on the funded debt to consolidated EBITDA ratio. The letter of credit fronting fee is .125% per annum on the face amount of each letter of credit.
The Company incurred debt issuance costs of $1.2 million for the Revolving Credit Facility, which is included in prepaid and other current assets and other non-current assets in the Company's consolidated balance sheet and is being amortized to interest expense over the life of the Revolving Credit Facility of five years.
NOTE 11—CONTINGENCIES
Overview
LendingTree is involved in legal proceedings on an ongoing basis. In assessing the materiality of a legal proceeding, the Company evaluates, among other factors, the amount of monetary damages claimed, as well as the potential impact of non-monetary remedies sought by plaintiffs (e.g., injunctive relief) that may require it to change its business practices in a manner that could have a material and adverse impact on the business. With respect to the matters disclosed in this Note 11, unless otherwise indicated, the Company is unable to estimate the possible loss or range of losses that could potentially result from the application of such non-monetary remedies.
As of March 31, 2017 and December 31, 2016, the Company had a litigation settlement accrual of $1.0 million and $0.7 million, respectively, in continuing operations and $4.0 million and $4.0 million, respectively, in discontinued operations. The litigation settlement accrual relates to litigation matters that were either settled or a firm offer for settlement was extended, thereby establishing an accrual amount that is both probable and reasonably estimable.
Specific Matters
Intellectual Property Litigation
Zillow
LendingTree v. Zillow, Inc., et al. Civil Action No. 3:10-cv-439. On September 8, 2010, the Company filed an action for patent infringement in the US District Court for the Western District of North Carolina against Zillow, Inc., NexTag, Inc., Quinstreet, Inc., Quinstreet Media, Inc. and Adchemy, Inc. The complaint was amended to include Leadpoint, Inc. d/b/a Securerights on September 24, 2010. The complaint alleged that each of the defendants infringed one or both of the Company's patents-U.S. Patent No. 6,385,594, entitled "Method and Computer Network for Co-Ordinating a Loan over the Internet," and U.S. Patent No. 6,611,816, entitled "Method and Computer Network for Co-Ordinating a Loan over the Internet." The defendants in this action asserted various defenses and counterclaims against the Company, including the assertion by certain of the defendants of counterclaims alleging illegal monopolization via the Company's maintenance of the asserted patents. Defendant NexTag asserted defenses of laches and equitable estoppel. In July 2011, the Company reached a settlement agreement with Leadpoint, Inc., pursuant to which all claims against Leadpoint, Inc. and all counterclaims against the Company by Leadpoint, Inc. were dismissed. In November 2012, the Company reached a settlement agreement with Quinstreet, Inc. and Quinstreet Media, Inc. (collectively, the
16
LENDINGTREE, INC. AND SUBSIDIARIES
NOTES TO CONSOLIDATED FINANCIAL STATEMENTS (Continued)
"Quinstreet Parties"), pursuant to which all claims against the Quinstreet Parties and all counterclaims against the Company by the Quinstreet Parties were dismissed. After an unsuccessful attempt to reach settlement through mediation with the remaining parties, this matter went to trial beginning in February 2014, and on March 12, 2014, the jury returned a verdict. The jury found that the defendants Zillow, Inc., Adchemy, Inc. and NexTag, Inc. did not infringe the two patents referenced above and determined that those patents are invalid due to an inventorship defect, and the court found that NexTag was entitled to defense of laches and equitable estoppel. The jury found in the Company's favor on the defendants' counterclaims alleging inequitable conduct and antitrust violations. Judgment was entered on March 31, 2014. After the court entered judgment, on May 27, 2014, the Company reached a settlement agreement with defendant Adchemy, Inc., including an agreement to dismiss and withdraw all claims, counterclaims, and motions between the Company and Adchemy, Inc. As a result, a joint and voluntary dismissal was filed June 12, 2014 with respect to claims between the Company and Adchemy. The parties filed various post-trial motions; in particular, defendants collectively sought up to $9.7 million in fees and costs. On October 9, 2014, the court denied the Company's post-trial motion for judgment as a matter of law and denied Zillow's post-trial motions for sanctions and attorneys' fees. The court also denied in part and granted in part NexTag's post-trial motion for attorneys' fees, awarding NexTag a portion of its attorney's fees and costs totaling $2.3 million, plus interest.
In November 2014, the Company filed a notice of appeal to the U.S. Court of Appeals for the Federal Circuit with respect to the jury verdict concerning Zillow, Inc. and NexTag, Inc. and the award of attorneys' fees. In March 2015, the U.S. Court of Appeals for the Federal Circuit granted the Company's motion to stay appellate briefing pending an en banc review by such court of the laches defense in an unrelated patent infringement matter and ruled in favor of Zillow, Inc. on an immaterial amount of costs related to the trial process. In June 2015, the Company reached a settlement agreement for $1.1 million with defendant NexTag pursuant to which the Company dismissed its appeal of the jury verdict and the award of attorney's fees concerning NexTag, and NexTag dismissed its cross-appeal and claims relating to the jury verdict and the award of attorneys' fees. In July 2015, the stay was lifted on the Company's appeal with respect to the jury verdict concerning Zillow, Inc. The appeal was heard by the U.S. Court of Appeals for the Federal Circuit in June 2016, and in July 2016 the Court determined that certain of the claims of the two patents referenced above were directed to ineligible subject matter and thus such claims were invalid under 35 U.S.C. Section 101. With respect to the remaining claims that the Court did not hold were ineligible, the Court granted a remand to the federal district court to allow LendingTree to file a motion to vacate the judgment of invalidity for incorrect inventorship.
Legal Matters
Next Advisor, Inc.
Next Advisor, Inc. v. LendingTree, Inc. and LendingTree, LLC, No. 15-cvs-20775 (N.C. Super. Ct.). On November 6, 2015, the plaintiff filed this action against LendingTree, Inc. and LendingTree, LLC (together "LendingTree"). The plaintiff generally alleges that LendingTree breached a non-disclosure agreement and misappropriated trade secrets in the context of a potential business acquisition of the plaintiff by LendingTree. Based upon these allegations, the plaintiff asserts claims for breach of contract, misappropriation of trade secrets and violation of North Carolina Unfair and Deceptive Trade Practices Act. The plaintiff seeks damages, attorneys' fees and injunctive relief.
On December 16, 2015, LendingTree filed its answer to the plaintiff's complaint, denying the material allegations and asserting numerous defenses thereto. In June 2016, the Court granted plaintiff's motion for preliminary injunction and ordered that LendingTree cease any utilization of confidential and trade secret information of plaintiff and cease marketing its credit card product via certain third party content marketing platforms until the judge finally determines the facts in this matter and the appropriate relief, if any, to be granted with respect thereto. Discovery is ongoing in this matter. LendingTree believes that the plaintiff's allegations lack merit and intends to vigorously defend this action. In July 2016, LendingTree filed a notice of interlocutory appeal with respect to the order granting plaintiff's motion for preliminary injunction to the North Carolina Supreme Court; the interlocutory appeal was dismissed in December 2016. In February 2017, LendingTree filed a motion for partial summary judgment. An estimated liability of $0.5 million for this matter is included in the accompanying consolidated balance sheet as of March 31, 2017.
Massachusetts Division of Banks
On February 11, 2011, the Massachusetts Division of Banks (the "Division") delivered a Report of Examination/Inspection to LendingTree, LLC, which identified various alleged violations of Massachusetts and federal laws, including the alleged insufficient delivery by LendingTree, LLC of various disclosures to its customers. On October 14, 2011, the Division provided a proposed Consent Agreement and Order to settle the Division's allegations, which the Division had shared with other state mortgage
17
LENDINGTREE, INC. AND SUBSIDIARIES
NOTES TO CONSOLIDATED FINANCIAL STATEMENTS (Continued)
lending regulators. Thirty-four of such state mortgage lending regulators (the "Joining Regulators") indicated that if LendingTree, LLC would enter into the Consent Agreement and Order, they would agree not to pursue any analogous allegations that they otherwise might assert. None of the Joining Regulators have asserted any such allegations.
The proposed Consent Agreement and Order calls for a fine to be allocated among the Division and the Joining Regulators and for LendingTree, LLC to adopt various new procedures and practices. The Company has commenced negotiations toward an acceptable Consent Agreement and Order. It does not believe its mortgage marketplace business violated any federal or state mortgage lending laws; nor does it believe that any past operations of the mortgage business have resulted in a material violation of any such laws. Should the Division or any Joining Regulator bring any actions relating to the matters alleged in the February 2011 Report of Examination/Inspection, the Company intends to defend against such actions vigorously. The range of possible loss is estimated to be between $0.5 million and $6.5 million, and an estimated liability of $0.5 million has been established for this matter in the accompanying consolidated balance sheet as of March 31, 2017.
Litigation Related to Discontinued Operations
Residential Funding Company
Residential Funding Company, LLC v Home Loan Center, Inc., No. 13-cv-3451 (U.S. Dist. Ct., Minn.). On or about December 16, 2013, Home Loan Center, Inc. was served in the above captioned matter. Generally, Residential Funding Company, LLC ("RFC") seeks damages for breach of contract and indemnification for certain residential mortgage loans as well as residential mortgage-backed securitizations ("RMBS") containing mortgage loans. RFC asserts that, beginning in 2008, RFC faced massive repurchase demands and lawsuits from purchasers or insurers of the loans and RMBS that RFC had sold. RFC filed for bankruptcy protection in May 2012. Plaintiff alleges that, after RFC filed for Chapter 11 protection, hundreds of proofs of claim were filed, many of which mirrored the litigation filed against RFC prior to its bankruptcy.
In December 2013, the United States Bankruptcy Court for the Southern District of New York entered an Order confirming the Second Amended Joint Chapter 11 Plan Proposed by Residential Capital, LLC et al. and the Official Committee of Unsecured Creditors. Plaintiff then began filing substantially similar complaints against approximately 80 of the loan originators from whom RFC had purchased loans, including Home Loan Center, in federal and state courts in Minnesota and New York. In each case, Plaintiff claims that the defendant is liable for a portion of the global settlement in RFC’s bankruptcy.
Plaintiff asserts two claims against HLC: (1) breach of contract based on HLC’s alleged breach of representations and warranties concerning the quality and characteristics of the mortgage loans it sold to RFC (Count One); and (2) contractual indemnification for alleged liabilities, losses, and damages incurred by RFC arising out of purported defects in loans that RFC purchased from HSBC and sold to third parties (Count Two). Plaintiff alleges that the “types of defects” contained in the loans it purchased from HLC included “income misrepresentation, employment misrepresentation, appraisal misrepresentations or inaccuracies, undisclosed debt, and missing or inaccurate documents.”
HLC filed a Motion to Dismiss under Rule 12(b)(6) of the Federal Rules of Civil Procedure or, in the alternative, a Motion for More Definite Statement under Rule 12(e). On June 25, 2015 the judge denied HLC's motion.
On July 9, 2015, HLC filed its answer to RFC’s complaint, denying the material allegations of the complaint and asserting numerous defenses thereto. Discovery is ongoing in this matter. HLC intends to vigorously defend this action. An estimated liability of $3.0 million for this matter is included in the accompanying consolidated balance sheet as of March 31, 2017.
Lehman Brothers Holdings, Inc.
Lehman Brothers Holdings Inc. v. 1st Advantage Mortgage, LLC et al., Case No. 08-13555 (SCC), Adversary Proceeding No. 16-01342 (SCC) (Bankr. S.D.N.Y.). In February 2016, Lehman Brothers Holdings, Inc. (“LBHI”) filed an Adversary Complaint against Home Loan Center and approximately 149 other defendants (the "Complaint"). The Complaint generally seeks (1) a declaratory judgment that the settlements entered into by LBHI with Fannie Mae and Freddie Mac as part of LBHI's bankruptcy proceedings gave rise to LBHI's contractual indemnification claims against defendants alleged in the Complaint; (2) indemnification from HLC and the other defendants for losses allegedly incurred by LBHI in respect of defective mortgage loans sold by defendants to LBHI or its affiliates; and (3) interest, attorneys' fees and costs incurred by LBHI in the litigation. On March 31, 2017, HLC filed an omnibus motion to dismiss with other defendants. HLC intends to defend this action vigorously. HLC had previously received a demand letter (the "Letter") from LBHI in December 2014 with respect to 64 loans (the “Loans”) that LBHI alleges were sold by HLC to Lehman Brothers Bank, FSB (“LBB”) between 2004 and 2008 pursuant to a loan purchase agreement (the “LPA”) between HLC and LBB. The Letter generally sought indemnification from HLC in accordance with the LPA for certain
18
LENDINGTREE, INC. AND SUBSIDIARIES
NOTES TO CONSOLIDATED FINANCIAL STATEMENTS (Continued)
claims that LBHI alleged it allowed in its bankruptcy with respect to the Loans. An estimated liability of $1.0 million for this matter is included in the accompanying consolidated balance sheet as of March 31, 2017.
NOTE 12—FAIR VALUE MEASUREMENTS
The carrying amounts of the Company's financial instruments are equal to fair value at March 31, 2017.
Contingent consideration payments related to acquisitions are measured at fair value each reporting period using Level 3 unobservable inputs. The changes in the fair value of the Company's Level 3 liabilities during the three months ended March 31, 2017 are as follows (in thousands):
Contingent Consideration | |||
Balance at December 31, 2016 | $ | 23,100 | |
Transfers into Level 3 | — | ||
Transfers out of Level 3 | — | ||
Total net gains (losses) included in earnings (realized and unrealized) | 8,746 | ||
Purchases, sales and settlements: | |||
Additions | — | ||
Payments | — | ||
Balance at March 31, 2017 | $ | 31,846 | |
The contingent consideration liability at March 31, 2017 is the estimated fair value of the Earnout Payments of the CompareCards acquisition. The Company will make Earnout Payments ranging from zero to $45.0 million based on the achievement of certain defined earnings targets. See Note 5—Business Acquisition for additional information on the contingent consideration of the CompareCards acquisition. The significant unobservable inputs used to calculate the fair value of the contingent consideration are estimated future cash flows for CompareCards and the discount rate. Actual results will differ from the projected results and could have a significant impact on the estimated fair value of the contingent consideration. Additionally, as the liability is stated at present value, the passage of time alone will increase the estimated fair value of the liability each reporting period. Any changes in fair value will be recorded in operating income (expense) in the consolidated statements of operations and comprehensive income.
NOTE 13—SEGMENT INFORMATION
The Company has one reportable segment.
Mortgage and non-mortgage product revenue is as follows (in thousands):
Three Months Ended March 31, | ||||||
2017 | 2016 | |||||
Mortgage products | $ | 62,938 | $ | 55,016 | ||
Non-mortgage products | 69,577 | 39,697 | ||||
Total revenue | $ | 132,515 | $ | 94,713 | ||
19
LENDINGTREE, INC. AND SUBSIDIARIES
NOTES TO CONSOLIDATED FINANCIAL STATEMENTS (Continued)
NOTE 14—DISCONTINUED OPERATIONS
The revenue and net loss reported as discontinued operations in the accompanying consolidated statements of operations and comprehensive income are as follows (in thousands):
Three Months Ended March 31, | |||||||
2017 | 2016 | ||||||
Revenue | $ | (750 | ) | $ | 1 | ||
Loss before income taxes | $ | (1,435 | ) | $ | (1,850 | ) | |
Income tax benefit | 503 | 647 | |||||
Net loss | $ | (932 | ) | $ | (1,203 | ) | |
LendingTree Loans
On June 6, 2012, the Company sold substantially all of the operating assets of its LendingTree Loans business for $55.9 million in cash to a wholly-owned subsidiary of Discover Financial Services ("Discover"). Discover generally did not assume liabilities of the LendingTree Loans business that arose before the closing date, except for certain liabilities directly related to assets Discover acquired. Of the purchase price paid, as of March 31, 2017, $4.0 million is being held in escrow in accordance with the agreement with Discover for certain loan loss obligations that remain with the Company following the sale. The escrowed amount is recorded as restricted cash as of March 31, 2017.
Significant Assets and Liabilities of LendingTree Loans
Upon closing of the sale of substantially all of the operating assets of the LendingTree Loans business on June 6, 2012, LendingTree Loans ceased to originate consumer loans. Liability for losses on previously sold loans will remain with LendingTree Loans and are discussed below.
Loan Loss Obligations
LendingTree Loans sold loans it originated to investors on a servicing-released basis, so the risk of loss or default by the borrower was generally transferred to the investor. However, LendingTree Loans was required by these investors to make certain representations and warranties relating to credit information, loan documentation and collateral. These representations and warranties may extend through the contractual life of the loan. Subsequent to the loan sale, if underwriting deficiencies, borrower fraud or documentation defects are discovered in individual loans, LendingTree Loans may be obligated to repurchase the respective loan or indemnify the investors for any losses from borrower defaults if such deficiency or defect cannot be cured within the specified period following discovery. In the case of early loan payoffs and early defaults on certain loans, LendingTree Loans may be required to repay all or a portion of the premium initially paid by the investor.
HLC, a subsidiary of the Company, continues to be liable for these indemnification obligations, repurchase obligations and premium repayment obligations following the sale of substantially all of the operating assets of its LendingTree Loans business in the second quarter of 2012.
The following table represents the aggregate loans sold, subsequent settlements and remaining unsettled loans.
Number of Loans | Original Issue Balance | |||||
(in thousands) | (in billions) | |||||
Loans sold by HLC | 234 | $ | 38.9 | |||
Subsequent settlements | (172 | ) | (28.8 | ) | ||
Remaining unsettled loans as of March 31, 2017 | 62 | $ | 10.1 | |||
During the fourth quarter of 2015, LendingTree Loans completed a settlement agreement for $0.6 million with one of the investors to which it had sold loans. This investor accounted for approximately 10% of the total number of loans sold and 12% of the original issue balance. This settlement related to all existing and future losses on loans sold to this investor.
20
LENDINGTREE, INC. AND SUBSIDIARIES
NOTES TO CONSOLIDATED FINANCIAL STATEMENTS (Continued)
During the fourth quarter of 2014, LendingTree Loans completed a settlement agreement for $5.4 million with the largest investor to which it had sold loans. This investor accounted for approximately 40% of both the total number of loans sold and the original issue balance. This settlement related to all existing and future losses on loans sold to this investor.
In the second quarter of 2014, LendingTree Loans completed settlements with two buyers of previously purchased loans.
The Company has been negotiating with certain of the remaining secondary market purchasers to settle any existing and future contingent liabilities, but it may not be able to complete such negotiations on acceptable terms, or at all. Because LendingTree Loans does not service the loans it sold, it does not maintain nor generally have access to the current balances and loan performance data with respect to the individual loans previously sold to investors. Accordingly, LendingTree Loans is unable to determine, with precision, its maximum exposure for breaches of the representations and warranties it made to the investors that purchased such loans.
The Company uses a settlement discount framework for evaluating the adequacy of the reserve for loan losses. This model estimates lifetime losses on the population of remaining loans originated and sold by LendingTree Loans using actual defaults for loans with similar characteristics and projected future defaults. It also considers the likelihood of claims expected due to alleged breaches of representations and warranties made by LendingTree Loans and the percentage of those claims investors estimate LendingTree Loans may agree to repurchase. A settlement discount factor is then applied to the result of the foregoing to reflect publicly-announced bulk settlements for similar loan types and vintages, as well as LendingTree Loans' non-operating status, in order to estimate a range of potential obligation.
The estimated range of remaining loan losses using this settlement discount framework was determined to be $4.3 million to $7.8 million at March 31, 2017. The reserve balance recorded as of March 31, 2017 was $7.6 million. Management has considered both objective and subjective factors in the estimation process, but given current general industry trends in mortgage loans as well as housing prices and market expectations, actual losses related to LendingTree Loans' obligations could vary significantly from the obligation recorded as of the balance sheet date or the range estimated above.
Additionally, LendingTree has guaranteed certain loans sold to two investors in the event that LendingTree Loans is unable to satisfy its repurchase and warranty obligations related to such loans.
Based on historical experience, it is anticipated that LendingTree Loans will continue to receive repurchase requests and incur losses on loans sold in prior years.
The activity related to loss reserves on previously sold loans is as follows (in thousands):
Three Months Ended March 31, | |||||||
2017 | 2016 | ||||||
Loan loss reserve, beginning of period | $ | 6,804 | $ | 8,127 | |||
Provisions | 750 | — | |||||
Charge-offs to reserves | — | — | |||||
Loan loss reserve, end of period | $ | 7,554 | $ | 8,127 | |||
The liability for losses on previously sold loans is presented as current liabilities of discontinued operations in the accompanying consolidated balance sheet as of March 31, 2017 and December 31, 2016.
21
Item 2. Management's Discussion and Analysis of Financial Condition and Results of Operations
Cautionary Statement Regarding Forward-Looking Information
This report contains "forward-looking statements" within the meaning of the Securities Act of 1933 and the Securities Exchange Act of 1934, as amended by the Private Securities Litigation Reform Act of 1995. These forward-looking statements also include statements related to our anticipated financial performance, business prospects and strategy; anticipated trends and prospects in the various industries in which our businesses operate; new products, services and related strategies; and other similar matters. These forward-looking statements are based on management's current expectations and assumptions about future events, which are inherently subject to uncertainties, risks and changes in circumstances that are difficult to predict. The use of words such as "anticipates," "estimates," "expects," "projects," "intends," "plans" and "believes," among others, generally identify forward-looking statements.
Actual results could differ materially from those contained in the forward-looking statements. Factors currently known to management that could cause actual results to differ materially from those in forward-looking statements include those matters discussed or referenced in Part II, Item 1A. Risk Factors included elsewhere in this quarterly report and Part I, Item 1A. Risk Factors of the 2016 Annual Report.
Other unknown or unpredictable factors that could also adversely affect our business, financial condition and results of operations may arise from time to time. In light of these risks and uncertainties, the forward-looking statements discussed in this report may not prove to be accurate. Accordingly, you should not place undue reliance on these forward-looking statements, which only reflect the views of LendingTree management as of the date of this report. We undertake no obligation to update or revise forward-looking statements to reflect changed assumptions, the occurrence of unanticipated events or changes to future operating results or expectations, except as required by law.
Company Overview
LendingTree, Inc., is the parent of LendingTree, LLC and several companies owned by LendingTree, LLC.
LendingTree operates what we believe to be the leading online loan marketplace for consumers seeking loans and other credit-based offerings. Our online marketplace provides consumers with access to product offerings from our Network Lenders, including mortgage loans, home equity loans and lines of credit, reverse mortgage loans, auto loans, credit cards, personal loans, student loans, small business loans and other related offerings. In addition, we offer tools and resources, including free credit scores, that facilitate comparison shopping for these loan and other credit-based offerings. We seek to match consumers with multiple lenders, who can provide them with competing quotes for the product they are seeking. We also serve as a valued partner to lenders seeking an efficient, scalable and flexible source of customer acquisition with directly measurable benefits, by matching the consumer inquiries we generate with these lenders.
Our My LendingTree platform offers a personalized loan comparison-shopping experience by providing free credit scores and credit score analysis. This platform enables us to observe consumers' credit profiles and then identify and alert them to loan and other credit-based opportunities on our marketplace that may be more favorable than the loans they may have at a given point in time. This is designed to provide consumers with measurable savings opportunities over their lifetimes.
In addition to operating our core mortgage business, we are focused on growing our non-mortgage lending businesses and developing new product offerings and enhancements to improve the experiences that consumers and lenders have as they interact with us. By expanding our portfolio of loan and credit-based offerings, we are growing and diversifying our business and sources of revenue. We intend to capitalize on our expertise in performance marketing, product development and technology, and to leverage the widespread recognition of the LendingTree brand to effect this strategy.
We believe the consumer and small business financial services industry is in the early stages of a fundamental shift to online product offerings, similar to the shift that started in retail and travel many years ago and is now well established. We believe that like retail and travel, as consumers continue to move towards online shopping and transactions for financial services, suppliers will increasingly shift their product offerings and advertising budgets toward the online channel. We believe the strength of our brands and of our lender network place us in a strong position to continue to benefit from this market shift.
The LendingTree Loans business is presented as discontinued operations in the accompanying consolidated balance sheets, consolidated statements of operations and comprehensive income and consolidated cash flows for all periods presented. Except for the discussion under the heading "Discontinued operations," the analysis within Management's Discussion and Analysis of Financial Condition and Results of Operations reflects our continuing operations.
22
Acquisition of CompareCards
On November 16, 2016, we acquired Iron Horse Holdings, LLC, which does business under the name CompareCards for $80.7 million in cash at closing and contingent consideration payments of up to $22.5 million in each of 2017 and 2018, subject to achieving specific growth targets. CompareCards is a leading online source for side-by-side credit card comparison shopping. CompareCards provides consumers with one centralized location for pertinent credit card information needed to find the best card for their needs. The acquisition continues our diversification strategy.
Acquisition of North Carolina Office Properties
In December 2016, we completed the acquisition of two office buildings in Charlotte, North Carolina, for $23.5 million in cash. We intend to utilize one or both buildings in the future as our principal executive offices, and any unused space will continue to be occupied by tenants.
Seasonality
Revenue in our lending business is subject to cyclical and seasonal trends. Home sales (and purchase mortgages) typically rise during the spring and summer months and decline during the fall and winter months, while refinancing and home equity activity is principally driven by mortgage interest rates as well as real estate values.
We anticipate revenue in our newer products to be cyclical as well; however, we have limited historical data to predict the nature and magnitude of this cyclicality. Based on industry data, we anticipate as our personal loan product matures we will experience less consumer demand during the fourth and first quarters of each year. Other factors affecting our business include macro factors such as credit availability in the market, the strength of the economy and employment.
Recent Mortgage Interest Rate Trends
Interest rate and market risks can be substantial in the mortgage lead generation business. Short-term fluctuations in mortgage interest rates primarily affect consumer demand for mortgage refinancings, while long-term fluctuations in mortgage interest rates, coupled with the U.S. real estate market, affect consumer demand for new mortgages. Consumer demand, in turn, affects lender demand for mortgage leads from third-party sources. Typically, a decline in mortgage interest rates will lead to reduced lender demand, as there are more consumers in the marketplace seeking financing and, accordingly, lenders receive more organic lead volume. Conversely, an increase in mortgage interest rates will typically lead to an increase in lender demand, as there are fewer consumers in the marketplace and, accordingly, the supply of organic mortgage lead volume decreases.
According to Freddie Mac, 30-year mortgage interest rates have started to rise, to a monthly average of 4.20% in March 2017. On a quarterly basis, 30-year mortgage interest rates in the first quarter of 2017 averaged 4.17%, as compared to 3.74% in the first quarter of 2016 and 3.81% in the fourth quarter of 2016.
23
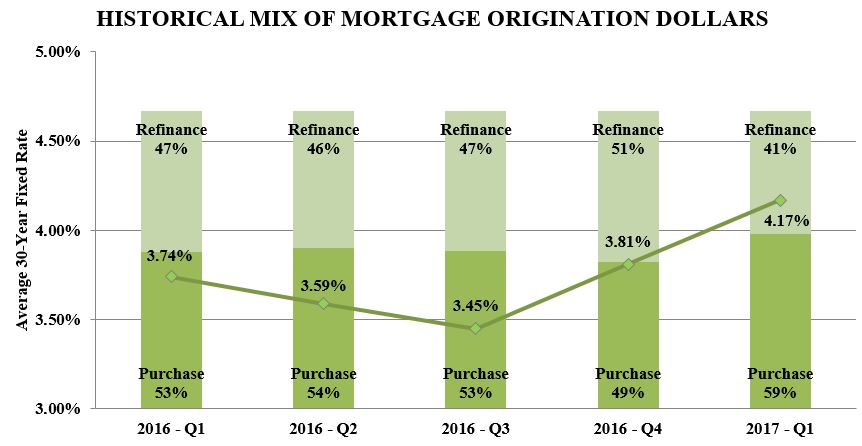
Typically, as mortgage interest rates rise, there are fewer consumers in the marketplace seeking refinancings and, accordingly, the mix of mortgage origination dollars moves towards purchase mortgages. According to Mortgage Bankers Association ("MBA") data, total refinance origination dollars decreased to 41% of total mortgage origination dollars, while purchase origination dollars increased to 59% in the first quarter of 2017 over the fourth quarter of 2016.
Looking forward, MBA is projecting 30-year mortgage interest rates to increase through the end of the year. According to MBA projections, as interest rates climb, the mix of mortgage origination dollars will move towards purchase mortgages with the refinance share representing just 31% for 2017.
The U.S. Real Estate Market
The health of the U.S. real estate market and interest rate levels are the primary drivers of consumer demand for new mortgages. Consumer demand, in turn, affects lender demand for purchase mortgage leads from third-party sources. Typically, a strong real estate market will lead to reduced lender demand for leads, as there are more consumers in the marketplace seeking financing and, accordingly, lenders receive more organic lead volume. Conversely, a weaker real estate market will typically lead to an increase in lender demand, as there are fewer consumers in the marketplace seeking mortgages.
According to the National Association of Realtors ("NAR"), 2017 started with the fastest pace of existing home sales in almost a decade. Existing home sales slowed in February 2017 due to limited supply, but continues to remain above last year's sales levels. The NAR expects inventory to remain low for 2017, but forecasts an increase of 2.3% in existing home sales from 2016.
24
Results of Operations for the Three Months ended March 31, 2017 and 2016
Three Months Ended March 31, | |||||||||||
2017 | 2016 | $ Change | % Change | ||||||||
(Dollars in thousands) | |||||||||||
Mortgage products | $ | 62,938 | $ | 55,016 | $ | 7,922 | 14 | % | |||
Non-mortgage products | 69,577 | 39,697 | 29,880 | 75 | % | ||||||
Revenue | 132,515 | 94,713 | 37,802 | 40 | % | ||||||
Costs and expenses: | |||||||||||
Cost of revenue (exclusive of depreciation and amortization shown separately below) | 3,591 | 3,473 | 118 | 3 | % | ||||||
Selling and marketing expense | 93,251 | 65,059 | 28,192 | 43 | % | ||||||
General and administrative expense | 11,547 | 9,259 | 2,288 | 25 | % | ||||||
Product development | 3,623 | 3,885 | (262 | ) | (7 | )% | |||||
Depreciation | 1,703 | 998 | 705 | 71 | % | ||||||
Amortization of intangibles | 2,609 | 25 | 2,584 | 10,336 | % | ||||||
Change in fair value of contingent consideration | 8,746 | — | 8,746 | N/A | |||||||
Severance | 157 | — | 157 | N/A | |||||||
Litigation settlements and contingencies | 404 | 169 | 235 | 139 | % | ||||||
Total costs and expenses | 125,631 | 82,868 | 42,763 | 52 | % | ||||||
Operating income | 6,884 | 11,845 | (4,961 | ) | (42 | )% | |||||
Other income (expense), net: | |||||||||||
Interest expense | (165 | ) | (142 | ) | 23 | 16 | % | ||||
Income before income taxes | 6,719 | 11,703 | (4,984 | ) | (43 | )% | |||||
Income tax benefit (expense) | 1,079 | (4,798 | ) | 5,877 | 122 | % | |||||
Net income from continuing operations | 7,798 | 6,905 | 893 | 13 | % | ||||||
Loss from discontinued operations, net of tax | (932 | ) | (1,203 | ) | (271 | ) | (23 | )% | |||
Net income and comprehensive income | $ | 6,866 | $ | 5,702 | $ | 1,164 | 20 | % | |||
Revenue
Revenue increased in the first quarter of 2017 compared to the first quarter of 2016 due to increases in our non-mortgage products of $29.9 million and in our mortgage products of $7.9 million.
Our non-mortgage products include the following non-mortgage lending products: personal loans, credit cards, home equity loans and lines of credit, reverse mortgage loans, auto loans, small business loans and student loans. Our non-mortgage products also include home improvement referrals and other credit products such as credit repair and debt settlement. Many of our non-mortgage products are not individually significant to revenue. The increase in revenue from our non-mortgage products in the first quarter of 2017 from the first quarter of 2016 is primarily due to a business acquisition in credit cards.
Revenue from our credit cards product increased $24.6 million to $33.8 million in the first quarter of 2017 from $9.2 million in the first quarter of 2016, or 269%, primarily due to the contribution from the CompareCards acquisition, completed on November 16, 2016.
Revenue from our personal loans product decreased $0.6 million to $17.0 million in the first quarter of 2017 from $17.6 million in the first quarter of 2016, or 3%, primarily due to decreases in revenue earned per consumer, partially offset by increases in the number of consumers completing request forms. Certain of our online personal loan lenders experienced well-publicized challenges in 2016, in particular, general unavailability of capital, increased pricing demanded by investors of personal loans, which in some cases led to reductions in marketing spend and tightening in underwriting standards. We expect revenue from our personal loan product to increase in each remaining quarter of 2017 compared to the corresponding 2016 quarter.
25
For the periods presented, no other non-mortgage product represented more than 10% of revenue, however certain other non-mortgage products experienced notable increases. Revenue from our home equity product increased by $4.7 million in the first quarter of 2017 compared to the first quarter of 2016 due to increases in lender coverage, revenue earned per consumer, and the number of consumers completing request forms, combined with increased marketing efforts.
The increase in revenue from our mortgage products in the first quarter of 2017 compared to the first quarter of 2016 is primarily due to an increase in revenue from our purchase product, although revenue from our refinance product also increased. The revenue from our purchase product increased $6.2 million in the first quarter of 2017 from the first quarter of 2016, primarily due to an increase in lender demand and an increase in marketing efforts. The revenue earned per consumer from our mortgage products increased in the first quarter of 2017 compared to the first quarter of 2016, while the number of consumers completing a request form for mortgage products remained relatively consistent.
Cost of revenue
Cost of revenue consists primarily of costs associated with compensation and other employee-related costs (including stock-based compensation) relating to internally-operated customer call centers, third-party customer call center fees, credit scoring fees, credit card fees, website network hosting and server fees.
Cost of revenue increased in the first quarter of 2017 from the first quarter of 2016, primarily due to increases of $0.4 million in compensation and benefits as a result of increases in headcount, partially offset by decreases of $0.1 million in credit card processing fees and $0.1 million in customer service fees.
Cost of revenue as a percentage of revenue decreased from 4% for the first quarter of 2016 to 3% for the first quarter of 2017.
Selling and marketing expense
Selling and marketing expense consists primarily of advertising and promotional expenditures, fees paid for consumer inquiries and compensation and other employee-related costs (including stock-based compensation) for personnel engaged in sales or marketing functions. Advertising and promotional expenditures primarily include online marketing, as well as television, print and radio spending. Advertising production costs are expensed in the period the related ad is first run.
The increases in selling and marketing expense in the first quarter of 2017 compared to the first quarter of 2016 were primarily due to increases in advertising and promotional expense of $28.4 million as discussed below.
Advertising and promotional expense is the largest component of selling and marketing expense, and is comprised of the following:
Three Months Ended March 31, | ||||||||||||||
2017 | 2016 | $ Change | % Change | |||||||||||
(Dollars in thousands) | ||||||||||||||
Online | $ | 80,660 | $ | 50,528 | $ | 30,132 | 60 | % | ||||||
Broadcast | 7,232 | 8,716 | (1,484 | ) | (17 | )% | ||||||||
Other | 1,110 | 1,337 | (227 | ) | (17 | )% | ||||||||
Total advertising expense | $ | 89,002 | $ | 60,581 | $ | 28,421 | 47 | % | ||||||
We increased our advertising expenditures in the first quarter of 2017 compared to the first quarter of 2016 in order to generate additional consumer inquiries to meet the increased demand of lenders on our marketplace.
We will continue to adjust selling and marketing expenditures dynamically in relation to anticipated revenue opportunities.
General and administrative expense
General and administrative expense consists primarily of compensation and other employee-related costs (including stock-based compensation) for personnel engaged in finance, legal, tax, corporate information technology, human resources and executive management functions, as well as facilities and infrastructure costs and fees for professional services.
26
General and administrative expense increased in the first quarter of 2017 from the first quarter of 2016, primarily due to increases in compensation and benefits of $1.4 million as a result of increases in headcount and increases in professional fees of $0.5 million.
General and administrative expense as a percentage of revenue decreased to 9% in the first quarter of 2017 from 10% in the first quarter of 2016.
Contingent consideration
During the first quarter of 2017, we recorded $8.7 million of contingent consideration expense due to an adjustment in the estimated fair value of the earnout payments related to the CompareCards acquisition.
Product development
Product development expense consists primarily of compensation and other employee-related costs (including stock-based compensation) and third-party labor costs that are not capitalized, for employees and consultants engaged in the design, development, testing and enhancement of technology.
Product development expense remained relatively consistent in the first quarter of 2017 compared to the first quarter of 2016, as we continued to invest in internal development of new and enhanced features, functionality and business opportunities that we believe will enable us to better and more fully serve consumers and lenders. Product development expenses are comprised primarily of compensation and other employee-related costs.
Income tax expense
For the first quarter of 2017, the effective tax rate varied from the federal statutory rate of 35% primarily due to a tax benefit of $3.8 million recognized for excess tax benefits due to employee exercises of stock options and vesting of restricted stock in accordance with ASU 2016-09. See Note 2 —Significant Accounting Policies in Part I, Item 1. Financial Statements for additional information.
For the first quarter of 2016, the effective tax rate varied from the federal statutory rate of 35% primarily due to state taxes.
There have been no changes to our valuation allowance assessment for the first quarter of 2017.
Discontinued operations
Losses from discontinued operations are attributable to losses associated with the LendingTree Loans business, the sale of which was completed on June 6, 2012. Losses from discontinued operations were primarily due to litigation settlements and contingencies and legal fees associated with ongoing legal proceedings.
Adjusted EBITDA
We report Adjusted EBITDA as a supplemental measure to GAAP. This measure is the primary metric by which we evaluate the performance of our businesses, on which our marketing expenditures and internal budgets are based and by which management and many employees are compensated. We believe that investors should have access to the same set of tools that we use in analyzing our results. This non-GAAP measure should be considered in addition to results prepared in accordance with GAAP, but should not be considered a substitute for or superior to GAAP results. We provide and encourage investors to examine the reconciling adjustments between the GAAP and non-GAAP measures discussed below.
Definition of Adjusted EBITDA
We report Adjusted EBITDA as net income from continuing operations adjusted to exclude interest, income tax, amortization of intangibles and depreciation, and to further exclude (1) non-cash compensation expense, (2) non-cash impairment charges, (3) gain/loss on disposal of assets, (4) restructuring and severance expenses, (5) litigation settlements and contingencies and legal fees for certain patent litigation, (6) acquisitions and dispositions income or expense (including with respect to changes in fair value of contingent consideration) and (7) one-time items. Adjusted EBITDA has certain limitations in that it does not take into account the impact to our statement of operations of certain expenses, including depreciation, non-cash compensation and acquisition-related accounting. We endeavor to compensate for the limitations of the non-GAAP measures presented by also
27
providing the comparable GAAP measures with equal or greater prominence and descriptions of the reconciling items, including quantifying such items, to derive the non-GAAP measures. These non-GAAP measures may not be comparable to similarly titled measures used by other companies.
One-Time Items
Adjusted EBITDA is adjusted for one-time items, if applicable. Items are considered one-time in nature if they are non-recurring, infrequent or unusual and have not occurred in the past two years or are not expected to recur in the next two years, in accordance with SEC rules. For the periods presented in this report, there are no adjustments for one-time items.
Non-Cash Expenses that are Excluded from Adjusted EBITDA
Non-cash compensation expense consists principally of expense associated with grants of restricted stock, restricted stock units and stock options. These expenses are not paid in cash, and we include the related shares in our calculations of fully diluted shares outstanding. Upon settlement of restricted stock units, exercise of certain stock options or vesting of restricted stock awards, the awards may be settled, on a net basis, with us remitting the required tax withholding amount from our current funds.
Amortization of intangibles are non-cash expenses relating primarily to intangible assets acquired through acquisitions. At the time of an acquisition, the intangible assets of the acquired company, such as purchase agreements, technology and customer relationships, are valued and amortized over their estimated lives.
The following table is a reconciliation of net income from continuing operations to Adjusted EBITDA (in thousands).
Three Months Ended March 31, | |||||||
2017 | 2016 | ||||||
Net income from continuing operations | $ | 7,798 | $ | 6,905 | |||
Adjustments to reconcile to Adjusted EBITDA: | |||||||
Amortization of intangibles | 2,609 | 25 | |||||
Depreciation | 1,703 | 998 | |||||
Severance | 157 | — | |||||
Loss on disposal of assets | 273 | 127 | |||||
Non-cash compensation | 2,230 | 2,633 | |||||
Change in fair value of contingent consideration | 8,746 | — | |||||
Acquisition expense | 549 | — | |||||
Litigation settlements and contingencies | 404 | 169 | |||||
Interest expense, net | 165 | 142 | |||||
Rental depreciation and amortization of intangibles | 262 | — | |||||
Income tax (benefit) expense | (1,079 | ) | 4,798 | ||||
Adjusted EBITDA | $ | 23,817 | $ | 15,797 | |||
Financial Position, Liquidity and Capital Resources
General
As of March 31, 2017, we had $105.4 million of cash and cash equivalents and $4.1 million of restricted cash and cash equivalents, compared to $91.1 million of cash and cash equivalents and $4.1 million of restricted cash and cash equivalents as of December 31, 2016.
In November 2016, we acquired CompareCards for $80.7 million cash at closing and potential future contingent consideration payments of up to $22.5 million for each of 2017 and 2018, subject to achieving specified targets. See Note 5—Business Acquisitions in the notes to the consolidated financial statements included elsewhere in this report for additional information.
We expect our cash and cash equivalents and cash flows from operations to be sufficient to fund our operating needs for the next twelve months and beyond. Our revolving credit facility described below is an additional potential source of liquidity.
28
Senior Secured Revolving Credit Facility
On October 22, 2015, we established a $125.0 million five-year Senior Secured Revolving Credit Facility which matures on October 22, 2020 (the “Revolving Credit Facility”). The proceeds of the Revolving Credit Facility can be used to finance working capital needs, capital expenditures and general corporate purposes, including to finance permitted acquisitions. As of April 28, 2017, we do not have any borrowings outstanding under the Revolving Credit Facility.
For additional information on the Revolving Credit Facility, see Note 10—Revolving Credit Facility, in the notes to the consolidated financial statements included elsewhere in this report.
Cash Flows from Continuing Operations
Our cash flows attributable to continuing operations are as follows:
Three Months Ended March 31, | |||||||
2017 | 2016 | ||||||
(in thousands) | |||||||
Net cash provided by operating activities | $ | 17,184 | $ | 10,371 | |||
Net cash (used in) provided by investing activities | (1,887 | ) | 303 | ||||
Net cash used in financing activities | (95 | ) | (43,115 | ) | |||
Cash Flows from Operating Activities
Our largest source of cash provided by our operating activities is revenues generated by our mortgage and non-mortgage products. Our primary uses of cash from our operating activities include advertising and promotional payments and fees paid for consumer inquiries. In addition, our uses of cash from operating activities include compensation and other employee-related costs, other general corporate expenditures, litigation settlements and contingencies and income taxes.
Net cash provided by operating activities attributable to continuing operations increased in the first three months of 2017 from the first three months of 2016 primarily due to an increase in revenue, partially offset by an increase in selling and marketing expense. Additionally, there was a net decrease in cash from changes in working capital primarily driven by changes in accounts receivable, income taxes payable and accounts payable, accrued expenses and other current liabilities.
Cash Flows from Investing Activities
Net cash used in investing activities attributable to continuing operations in the first three months of 2017 of $1.9 million consisted primarily of capital expenditures related to internally developed software.
Net cash provided by investing activities attributable to continuing operations in the first three months of 2016 of $0.3 million consisted primarily of a $2.5 million decrease in restricted cash due to the release of funds in escrow for the surety bonds due to a reduction in collateral requirements, partially offset by capital expenditures of $2.2 million primarily related to internally developed software.
Cash Flows from Financing Activities
Net cash used in financing activities attributable to continuing operations in the first three months of 2017 of $0.1 million consisted of payments of withholding taxes upon surrender of shares to satisfy obligations on equity awards, net of proceeds from the exercise of stock options.
Net cash used in financing activities attributable to continuing operations in the first three months of 2016 of $43.1 million consisted primarily of the repurchase of our stock of $40.5 million and $2.6 million in withholding taxes paid by us upon surrender of shares to satisfy obligations on equity awards.
29
Off-Balance Sheet Arrangements
We have no off-balance sheet arrangements other than our operating lease obligations and funding commitments pursuant to our surety bonds, none of which have or are reasonably likely to have a current or future effect on our financial condition, changes in financial condition, revenues or expenses, results of operations, liquidity, capital expenditures or capital resources that is material to investors.
New Accounting Pronouncements
For information regarding new accounting pronouncements, see Note 2- Significant Accounting Policies, in Part I, Item 1 Financial Statements.
Item 3. Quantitative and Qualitative Disclosures about Market Risk
Other than our Revolving Credit Facility, which currently has no borrowings outstanding, we do not have any financial instruments that are exposed to significant market risk. We maintain our cash and cash equivalents in bank deposits and short-term, highly liquid money market investments. A hypothetical 100-basis point increase or decrease in market interest rates would not have a material impact on the fair value of our cash equivalents securities, or our earnings on such cash equivalents, but would have an effect on the interest paid on borrowings under the Revolving Credit Facility, if any. As of April 28, 2017, there were no borrowings under the Revolving Credit Facility.
Fluctuations in interest rates affect consumer demand for new mortgages and the level of refinancing activity which, in turn, affects lender demand for mortgage leads. Typically, a decline in mortgage interest rates will lead to reduced lender demand for leads from third-party sources, as there are more consumers in the marketplace seeking refinancings and, accordingly, lenders receive more organic lead volume. Conversely, an increase in mortgage interest rates will typically lead to an increase in lender demand for third-party leads, as there are fewer consumers in the marketplace and, accordingly, the supply of organic mortgage lead volume decreases.
Item 4. Controls and Procedures
Evaluation of Disclosure Controls and Procedures
As required by Rule 13a-15(b) of the Securities Exchange Act of 1934, as amended (the "Exchange Act"), management, with the participation of our principal executive officer (our Chief Executive Officer) and principal financial officer (our Chief Financial Officer), evaluated, as of the end of the period covered by this report, the effectiveness of our disclosure controls and procedures as defined in Exchange Act Rule 13a-15(e). Based upon that evaluation, our Chief Executive Officer and Chief Financial Officer concluded that our disclosure controls and procedures are effective, as of March 31, 2017, to reasonably ensure that information required to be disclosed and filed under the Exchange Act is recorded, processed, summarized and reported within the time periods specified, and that management will be timely alerted to material information required to be included in our periodic reports filed with the Securities and Exchange Commission.
Changes in Internal Control Over Financial Reporting
There was no change in our internal control over financial reporting that occurred during the quarter ended March 31, 2017 that has materially affected, or is reasonably likely to materially affect, our internal controls over financial reporting.
30
PART II—OTHER INFORMATION
Item 1. Legal Proceedings
In the ordinary course of business, we are party to litigation involving property, contract, intellectual property and a variety of other claims. The amounts that may be recovered in such matters may be subject to insurance coverage. We have provided information about certain legal proceedings in which we are involved in Part I, Item 3 Legal Proceedings of our 2016 Annual Report and updated that information in Note 11—Contingencies to the consolidated financial statements included elsewhere in this report.
Item 1A. Risk Factors
There have been no material changes to the risk factors included in Part I, Item 1A. Risk Factors of our 2016 Annual Report.
Item 2. Unregistered Sales of Equity Securities and Use of Proceeds
Issuer Purchases of Equity Securities
In each of January 2010, May 2014, January 2016 and February 2016, the board of directors authorized and we announced a stock repurchase program which allowed for the repurchase of up to $10.0 million, $10.0 million, $50.0 million and $40.0 million, respectively, of our common stock. At March 31, 2017, approximately $48.7 million remains authorized for share repurchase under this program. Under this program, we can repurchase stock in the open market or through privately-negotiated transactions. We have used available cash to finance these repurchases. We will determine the timing and amount of any additional repurchases based on our evaluation of market conditions, applicable SEC guidelines and regulations, and other factors. This program may be suspended or discontinued at any time at the discretion of our board of directors. No shares of common stock were repurchased under the stock repurchase program during the quarter ended March 31, 2017. As of April 28, 2017, approximately $48.7 million remains authorized for share repurchase.
Additionally, the LendingTree Fourth Amended and Restated 2008 Stock and Award Incentive Plan allows employees to forfeit shares of our common stock to satisfy federal and state withholding obligations upon the exercise of stock options, the settlement of restricted stock unit awards and the vesting of restricted stock awards granted to those individuals under this plan. During the quarter ended March 31, 2017, 21,702 shares were purchased related to these obligations under the LendingTree Fourth Amended and Restated 2008 Stock and Award Incentive Plan. The withholding of those shares does not affect the dollar amount or number of shares that may be purchased under the stock repurchase program described above.
The following table provides information about the company's purchases of equity securities during the quarter ended March 31, 2017.
Period | Total Number of Shares Purchased (1) | Average Price Paid per Share | Total Number of Shares Purchased as Part of Publicly Announced Plans or Programs (2) | Approximate Dollar Value of Shares that May Yet be Purchased Under the Plans or Programs | ||||||||||
(in thousands) | ||||||||||||||
1/1/17 - 1/31/17 | 231 | $ | 101.45 | — | $ | 48,748 | ||||||||
2/1/17 - 2/28/17 | 21,041 | $ | 118.55 | — | $ | 48,748 | ||||||||
3/1/17 - 3/31/17 | 430 | $ | 119.46 | — | $ | 48,748 | ||||||||
Total | 21,702 | $ | 118.39 | — | $ | 48,748 | ||||||||
(1) | During January 2017, February 2017 and March 2017, 231 shares, 21,041 shares and 430 shares, respectively (totaling 21,702 shares), were purchased to satisfy federal and state withholding obligations of our employees upon the settlement of restricted stock unit awards, all in accordance with our Fourth Amended and Restated 2008 Stock and Award Incentive Plan, as described above. |
(2) | See the narrative disclosure above the table for further description of our publicly announced stock repurchase program. |
31
Item 5. Other Information
None.
Item 6. Exhibits
Exhibit | Description | Location | |||
3.1 | Amended and Restated Certificate of Incorporation of LendingTree, Inc. | Exhibit 3.1 to the Registrant's Current Report on Form 8-K filed August 25, 2008 | |||
3.2 | Third Amended and Restated By-laws of LendingTree, Inc. | Exhibit 3.2 to the Registrant's Current Report on Form 8-K filed December 31, 2014 | |||
31.1 | Certification of the Chief Executive Officer pursuant to Rule 13a-14(a) or Rule 15d-14(a) of the Securities Exchange Act of 1934 as adopted pursuant to Section 302 of the Sarbanes-Oxley Act of 2002. | † | |||
31.2 | Certification of the Chief Financial Officer pursuant to Rule 13a-14(a) or Rule 15d-14(a) of the Securities Exchange Act of 1934 as adopted pursuant to Section 302 of the Sarbanes-Oxley Act of 2002. | † | |||
32.1 | Certification of the Chief Executive Officer pursuant to 18 U.S.C. Section 1350 as adopted pursuant to Section 906 of the Sarbanes-Oxley Act of 2002. | †† | |||
32.2 | Certification of the Chief Financial Officer pursuant to 18 U.S.C. Section 1350 as adopted pursuant to Section 906 of the Sarbanes-Oxley Act of 2002. | †† | |||
101.INS | XBRL Instance Document | ††† | |||
101.SCH | XBRL Taxonomy Extension Schema Document | ††† | |||
101.CAL | XBRL Taxonomy Extension Calculation Linkbase Document | ††† | |||
101.DEF | XBRL Taxonomy Extension Definition Linkbase Document | ††† | |||
101.LAB | XBRL Taxonomy Extension Label Linkbase Document | ††† | |||
101.PRE | XBRL Taxonomy Extension Presentation Linkbase Document | ††† | |||
________________________________________________________________________________________________________________________________
† Filed herewith
†† This certification is being furnished solely to accompany this report pursuant to 18 U.S.C. 1350, and is not being filed for purposes of Section 18 of the Securities Exchange Act of 1934 and is not to be incorporated by reference into any filing of the registrant, whether made before or after the date hereof, regardless of any general incorporation language in such filing.
††† Furnished herewith. Pursuant to Rule 406T of Regulation S-T, the Interactive Data Files on Exhibit 101 hereto are deemed not filed or part of a registration statement or prospectus for purposes of Sections 11 or 12 of the Securities Act of 1933, as amended, are deemed not filed for purposes of Section 18 of the Securities Exchange Act of 1934, as amended, and otherwise are not subject to liability under those sections.
32
SIGNATURE
Pursuant to the requirements of the Securities Exchange Act of 1934, the registrant has duly caused this report to be signed on its behalf by the undersigned thereunto duly authorized.
Date: April 28, 2017
LENDINGTREE, INC. | ||
By: | /s/ GABRIEL DALPORTO | |
Gabriel Dalporto | ||
Chief Financial Officer | ||
(principal financial officer and duly authorized officer) | ||
33