Attached files
| file | filename |
|---|---|
| 8-K - FORM 8-K - Wendy's Co | form8-k_05102011slides.htm |

First Quarter 2011
Earnings Call
Earnings Call
May 10, 2011
Opening
Comments
Comments
John Barker
SVP and Chief Communications Officer

3
Agenda
|
Business Highlights
•Update on Arby’s strategic alternatives
•Key first quarter 2011 results
|
Roland Smith
|
|
Financial Results and Outlook
•First quarter 2011 financial overview
•Cash flow and debt capitalization
•Dividends and share repurchases
•2011 Outlook
|
Steve Hare
|
|
Wendy’s Key Initiatives and Global Expansion
|
Roland Smith
|
|
Q&A
|
|

4
Forward-Looking Statements and Regulation G
This presentation, and certain information that management may discuss in connection with this
presentation, may contain statements that are not historical facts, including, importantly,
information concerning possible or assumed future results of our operations. Those statements
constitute “forward-looking statements” within the meaning of the Private Securities Litigation
Reform Act of 1995 (the “Reform Act”). For all our forward-looking statements, we claim the
protection of the safe harbor for forward-looking statements contained in the Reform Act.
Many important factors could affect our future results and could cause those results to differ
materially from those expressed in or implied by our forward-looking statements. Such factors,
all of which are difficult or impossible to predict accurately, and many of which are beyond our
control, include but are not limited to those identified under the caption “Forward-Looking
Statements” in our most recent earnings press release and in the “Special Note Regarding
Forward-Looking Statements and Projections” and “Risk Factors” sections of our most recent
Form 10-K and subsequent Form 10-Qs.
In addition, this presentation and certain information management may discuss in connection
with this presentation reference non-GAAP financial measures, such as earnings before interest,
taxes, depreciation and amortization, or EBITDA. Reconciliations of non-GAAP financial measures
to the most directly comparable GAAP financial measure are in the Appendix to this
presentation, and are included in the earnings release and posted on the Investor Relations
section of our website.
Business
Highlights
Highlights
Roland Smith
President & Chief Executive Officer

6
Strategic Alternatives Update
• In January 2011, announced exploring strategic
alternatives for Arby’s, including a sale of the brand
alternatives for Arby’s, including a sale of the brand
• Potential bidders interested and active
• Focused on completing process as quickly as possible
• Benefits of the potential sale
– Focus resources on Wendy’s
– Deleverage the balance sheet

7
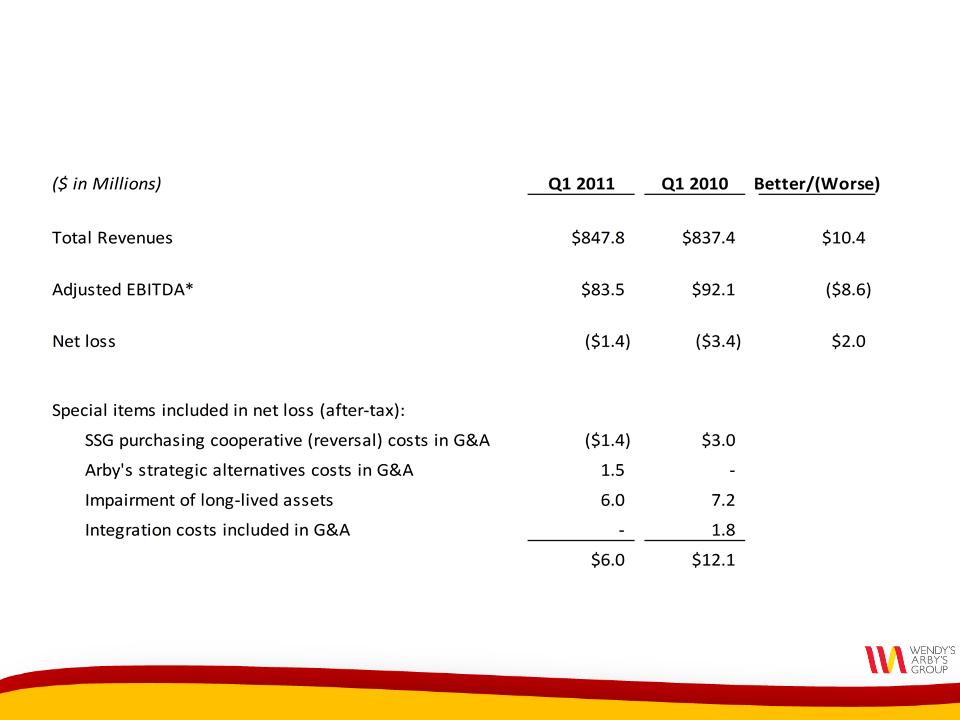
Q1 2011 Business Overview
• Revenues grew 1.2% to $848 million
• Adjusted EBITDA*, including Arby’s, was $83.5 million
– Performance met Company’s expectations
– Includes significant increase in commodities versus
prior year
prior year
– Includes incremental advertising for Wendy’s breakfast
expansion in new markets
expansion in new markets
* See Appendix
8
Q1 2011 N.A. Same-Store Sales
Systemwide* 0.0%
Company-owned -0.9%
Franchise +0.3%
Company Restaurant Margin
Q1 2011 13.4%
Q1 2010 15.4%
-200 bps
Margin Variances
-110 bps New breakfast advertising
-80 bps Increased commodities
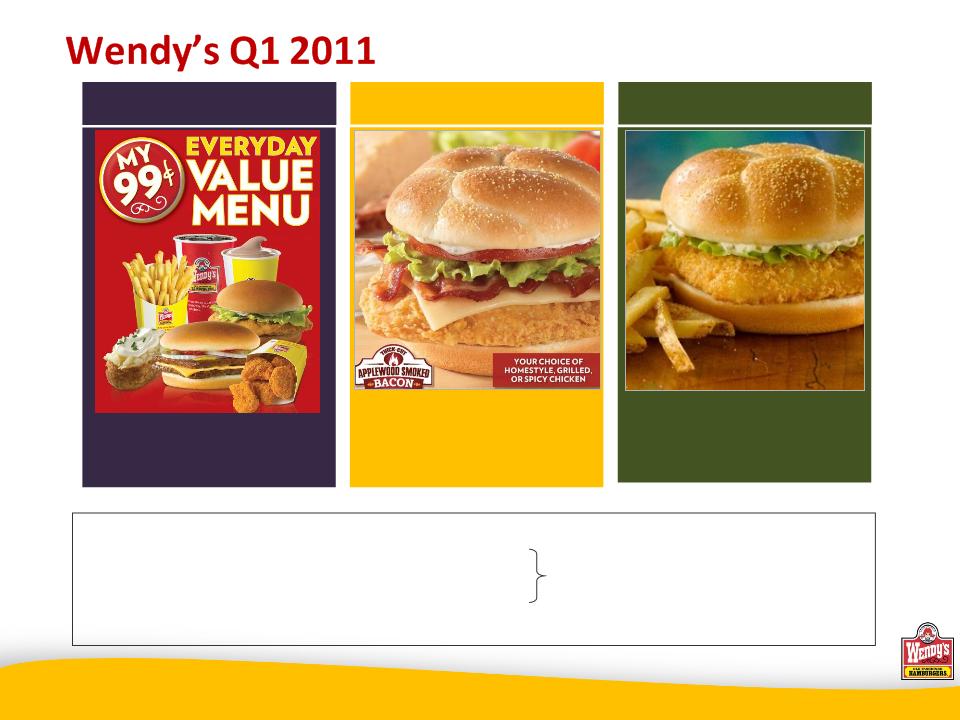
March
February
January
99¢ Everyday
99¢ Everyday
Value Menu
Value Menu
Asiago Ranch
Asiago Ranch
Chicken Club
Chicken Club
Fish & Chips
Fish & Chips
* Q1 2011 U.S. Systemwide same-store sales were +0.3%
9
Q1 2011 N.A. Same-Store Sales
Systemwide +5.5%
Company-owned +6.8%
Franchise +4.8%
Company Restaurant Margin
Q1 2011 10.6%
Q1 2010 10.8%
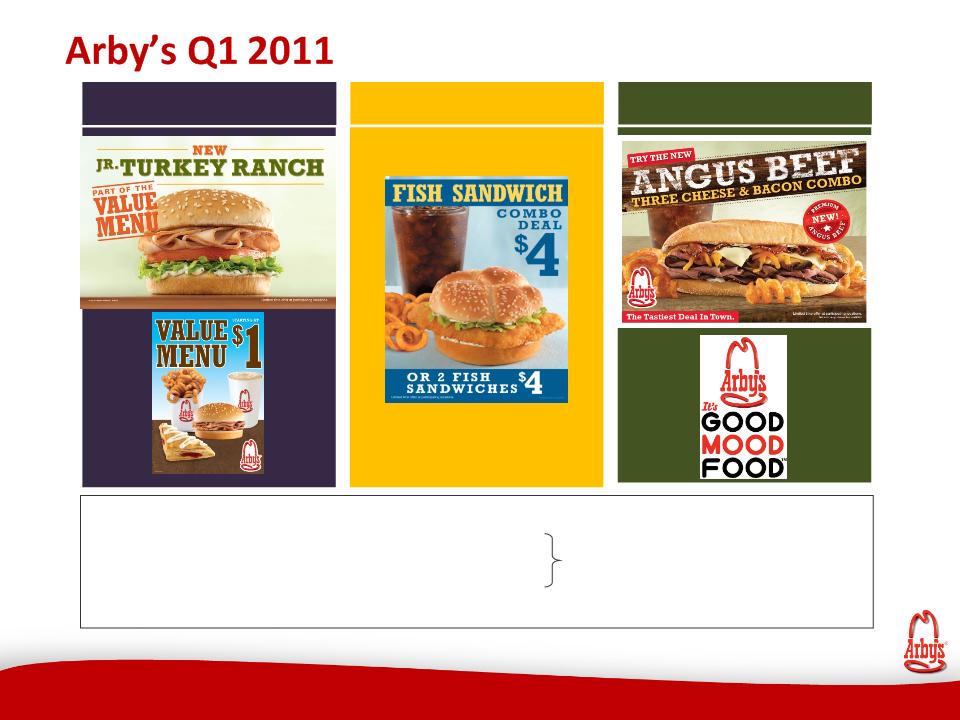
March
February
January
Margin Variances
-160 bps Increased commodities
-20 bps

Q1 2011 Results
and
Full-Year Outlook
and
Full-Year Outlook
Steve Hare
Chief Financial Officer
11
Q1 2011 Results
*See Appendix.

12
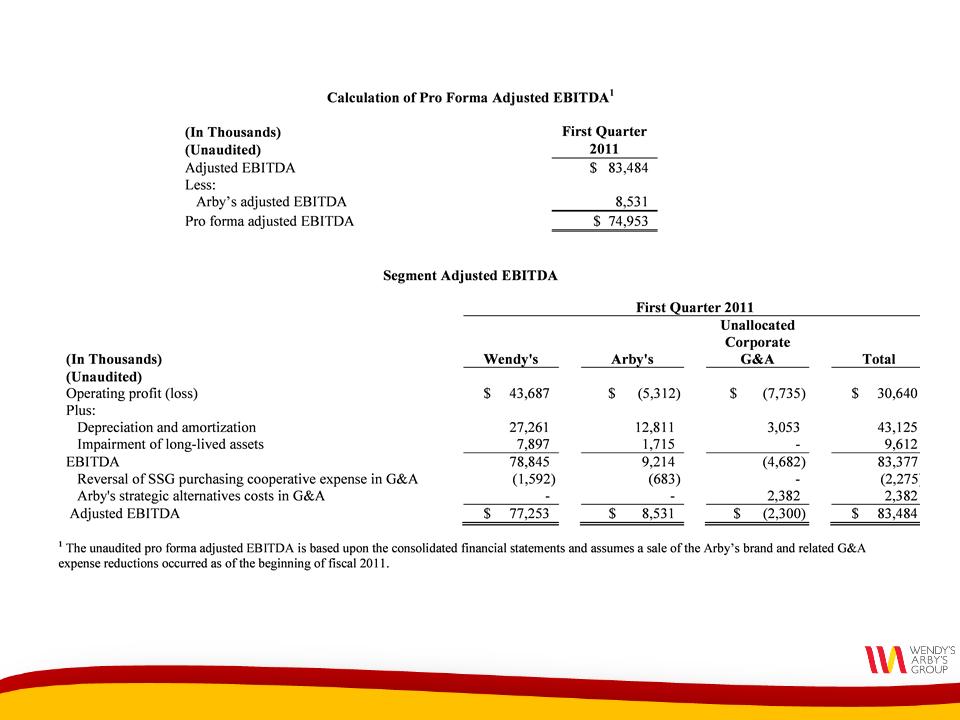
Pro Forma Adjusted EBITDA
*See Appendix.
• Q1 2011 pro forma adjusted EBITDA* was
$75 million
$75 million
− Excludes Arby’s adjusted EBITDA* of $8.5 million
• Arby’s adjusted EBITDA includes brand G&A and an
allocation of corporate G&A
allocation of corporate G&A
− Arby’s portion of the allocation of corporate G&A in Q1
2011 was $8.8 million, which is equivalent to the
expected pro forma amount of corporate G&A savings
2011 was $8.8 million, which is equivalent to the
expected pro forma amount of corporate G&A savings
13
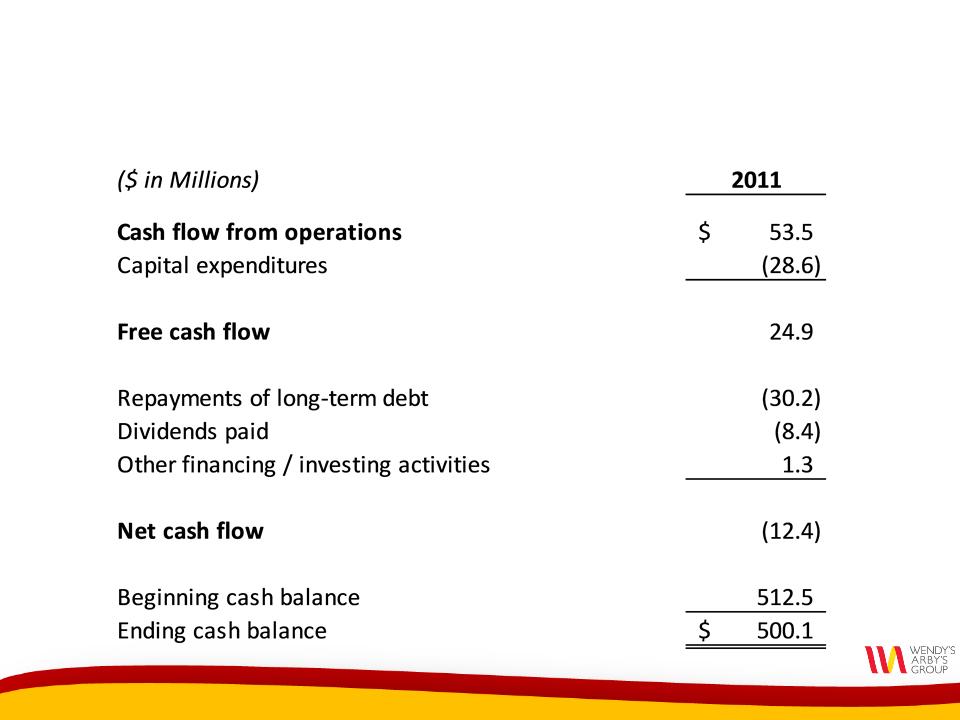
Cash Flow Q1 2011
14
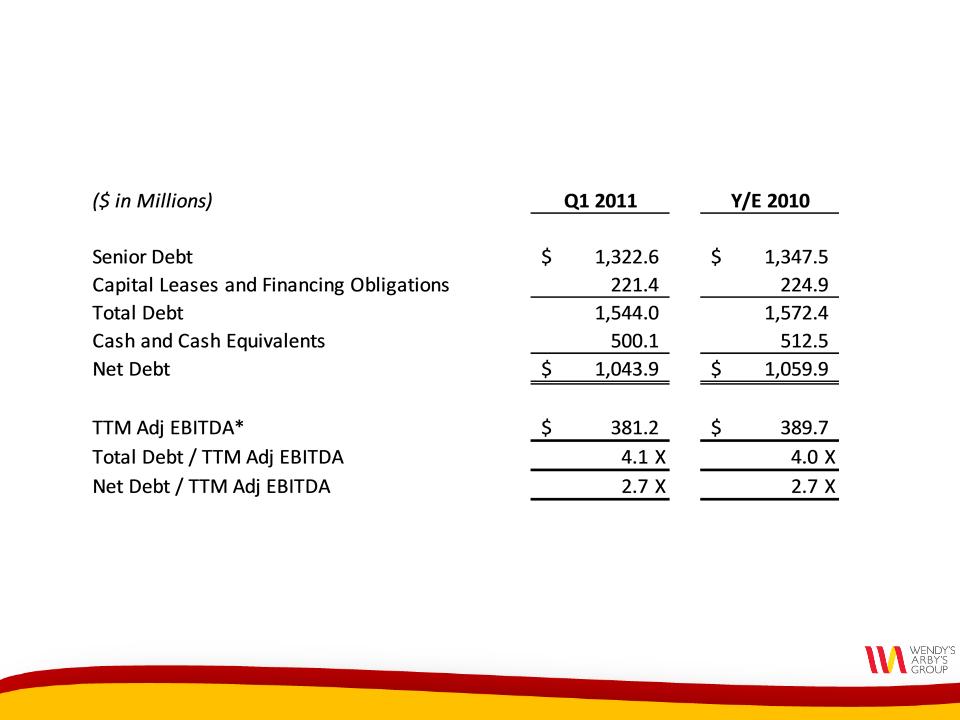
Consolidated Debt
*See Appendix.

15
• Quarterly Cash Dividend
− $0.02 per share
− Payable on June 15, 2011 to stockholders of record as
of June 1, 2011
of June 1, 2011
• Stock Repurchases
− Total amount authorized and available is $250 million
− No repurchases during the first quarter due to Arby’s
strategic alternatives process
strategic alternatives process
Dividends and Stock Repurchases
16
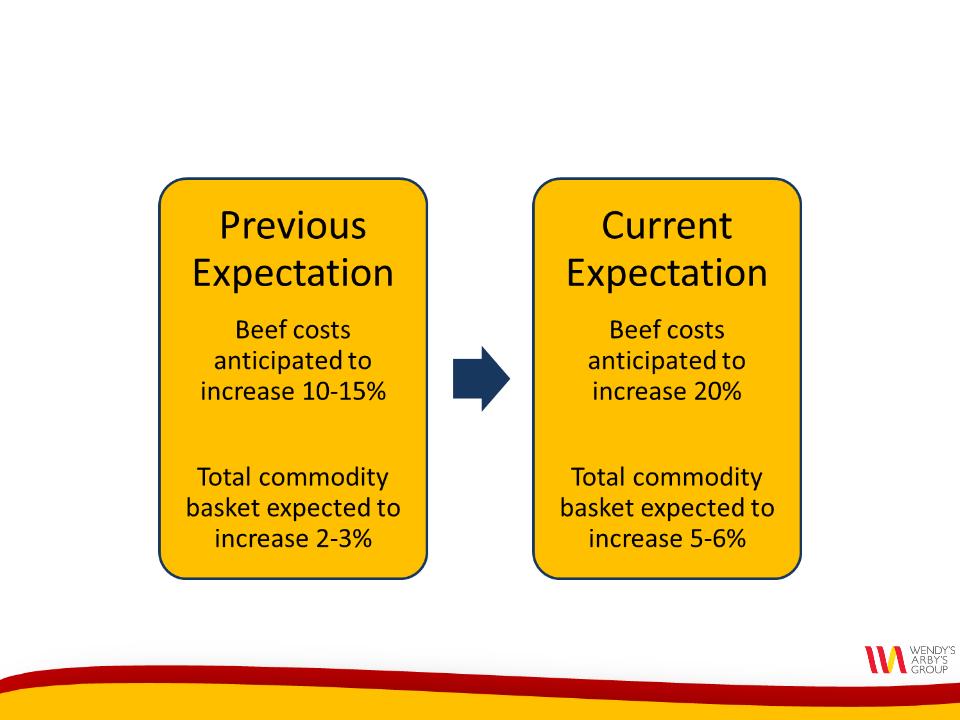
Commodity Prices Increasing Significantly in 2011

17
Revised 2011 Outlook
• Expect $330-340 million pro forma adjusted EBITDA1
• Key Assumptions:
– Wendy’s same-store sales growth +1% to +3%
– Flat to slightly negative Wendy’s company-operated
restaurant margin2
restaurant margin2
– Capital expenditures of $145 million
1 Assumes sale of Arby’s and related G&A reductions occurred as of the beginning of 2011.
2 Includes incremental new breakfast advertising expense in 2010 and 2011.
Wendy’s Initiatives
& Global Expansion
& Global Expansion
Roland Smith
President & Chief Executive Officer
19
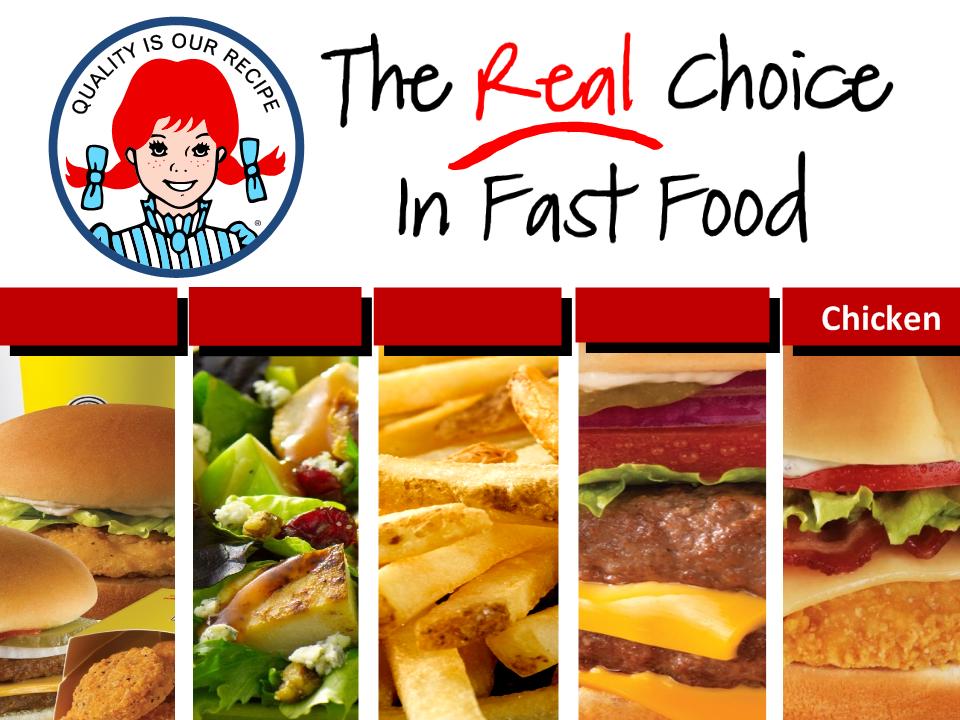
Value
Hamburgers
Salads
Fries

20
Wendy’s Q2 2011 Marketing Calendar
June
May
April
Natural-Cut Fries
with Sea Salt
with Sea Salt
Natural-Cut Fries
with Sea Salt
with Sea Salt
Flavor
Flavor
Dipped
Dipped
Chicken
Chicken
Bacon
Bacon
Mushroom
Mushroom
Melt
Melt
Coming in July:
Fresh Berry Frosty

21
Wendy’s #1 in Salad Category
Share of QSR/Fast Casual Entrée Salads
Share of QSR/Fast Casual Entrée Salads
Source: Third Party Research, for 3 month period ended January 2011
1st
2nd
3rd

22
Dave’s Hot ‘N Juicy Cheeseburgers

23
Enhanced Chicken Menu
Asiago Ranch Q1 2011
Gold Chicken Q4 2011
Enhanced Filet Q3 2010

24
Strategic Pricing
• Strategic pricing model provides information on
demand elasticity for pricing actions
demand elasticity for pricing actions
• Wendy’s implementing selective price increases in
2011
2011
• Objective is to partially offset commodity increases
while protecting transactions and market share
while protecting transactions and market share
25
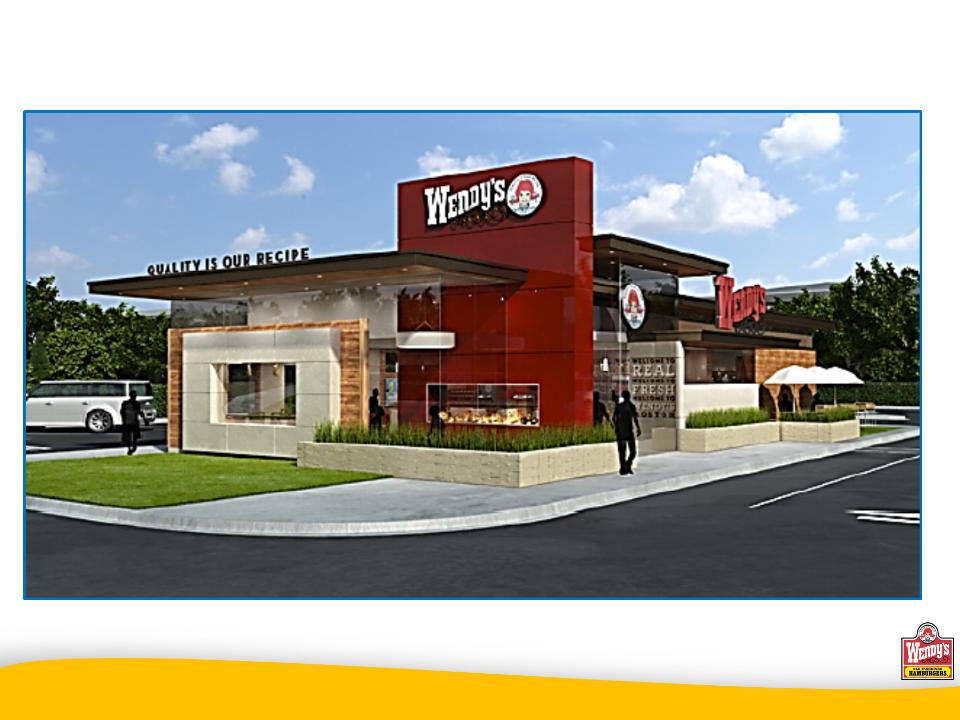
Wendy’s Facility Remodels
Artist rendering of a Wendy’s facility remodel.

26
QSR Annual Sales:
Hamburger Category
Hamburger Category
Source: industry reports
QSR Breakfast Opportunity
$7 bil
Late Night
$42 bil
Core
$13 bil
Breakfast

27
Wendy’s Breakfast Update
• Awareness, trial and repeat rates improving
• Sales trends growing
• Annualized average weekly sales meeting incremental
breakfast sales target of $150,000
breakfast sales target of $150,000
– 10% sales lift to $1.4 million average unit volumes
28
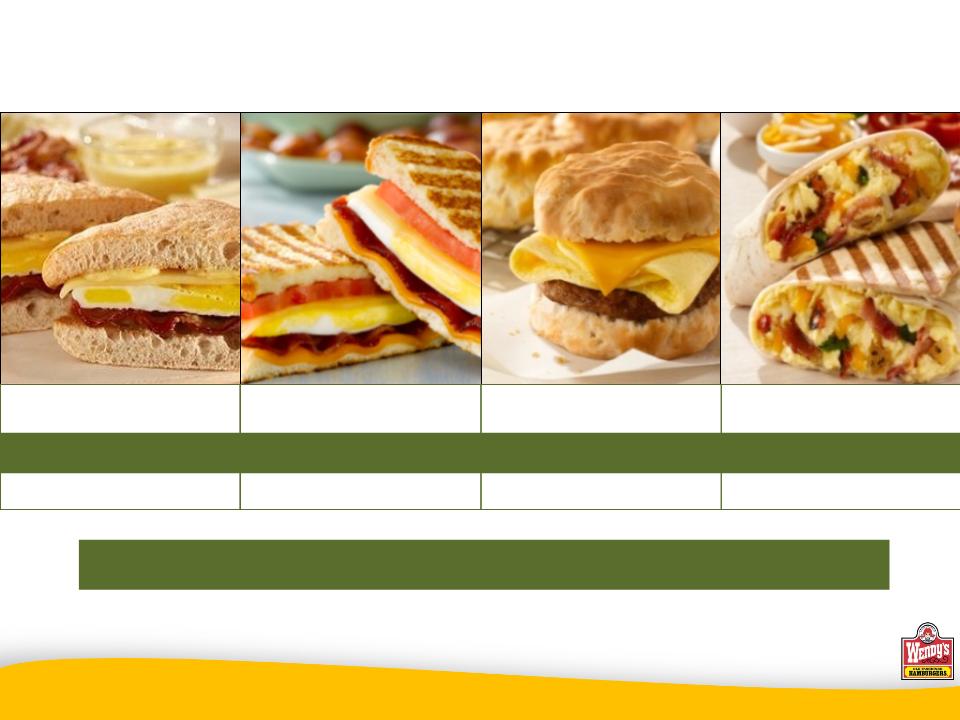
Breakfast Products Score High with Consumers
Artisan Egg Sandwich
9.2 out of 10.0
Mornin’ Melt Panini
9.1 out of 10.0
Biscuit Sandwich
9.1 out of 10.0
Fire Roasted Burrito
9.0 out of 10.0
All Top-2 Box scores of 95% or higher
Average Attribute Score:

29
2011 Breakfast Expansion Timeline
Q4
2011
2011
Q2
2011
2011
Q3
2011
2011
Q1
2011
2011
2010
1,000
STORES
YE
2011
2011
CONVERT 300 OLD MENU
STORES
STORES
NEW
MENU
LAUNCH
MENU
LAUNCH
LOUISVILLE &
SAN ANTONIO
SAN ANTONIO
ADDITIONAL
MARKETS
MARKETS
• Kansas City
• Phoenix
• Pittsburgh
• Shreveport

30
Wendy’s/Arby’s International
Development Since the Merger
Development Since the Merger
Singapore
35 restaurants
Middle East
79 restaurants
Turkey
100 restaurants
Russia
180 restaurants
Eastern Caribbean
24 restaurants
Argentina
50 restaurants
Japan
joint venture
• Six long-term development agreements covering 23 countries
• Joint venture agreement with Higa Industries Co., Ltd. to develop
restaurants in Japan
restaurants in Japan

31
Russia Restaurant Openings
• First two restaurants in Moscow to open this month
– Mall food court at Capitoly Vernadskogo
– Arbat area of Moscow
• Openings part of the development agreement
announced in August 2010 with Wenrus Restaurant
Group Limited
announced in August 2010 with Wenrus Restaurant
Group Limited
– 180 restaurants in Russia over the next 10 years

32
• Working on the strategic alternatives process for
Arby’s, including a potential sale
Arby’s, including a potential sale
• Focusing our resources on the Wendy’s brand for
future growth
future growth
2011: Transition Year

33
Wendy’s Growth Initiatives - Summary
• Deliver “Real” brand positioning
• Improve core menu
• Introduce exciting, new products
• Expand breakfast
• Modernize our facilities
• Pursue global expansion
Average annual EBITDA growth of 10-15%, beginning in 2012

Q&A
Appendix

36
37