Attached files
| file | filename |
|---|---|
| 8-K - FORM 8-K - S&T BANCORP INC | d8k.htm |
 First Quarter 2011
Exhibit 99.1 |
 Todd
Brice President and
Chief Executive Officer
Mark Kochvar
Sr. EVP and
Chief Financial Officer |
 3
Forward Looking Statement
and Risk Factor
•
This presentation contains certain forward-looking statements within the
meaning of Section 27A of the Securities Act of 1933 and Section 21E of the
Securities Exchange Act of 1934. Forward- looking statements
include, among others, statements regarding trends, strategies, plans, beliefs,
intentions, expectations, goals and opportunities. Forward looking
statements are typically identified by words or phrases such as believe,
expect, anticipate, intend, estimate, assume, strategy, plan, outlook,
outcome, continue, remain, trend and variations of such words and similar
expressions,
or
future
or
conditional
verbs
such
as
will,
would,
should,
could,
may
or
similar
expressions. Actual results and performance could differ materially from
those anticipated by these forward-looking statements. Factors
that could cause such a difference include, but are not limited to, general
economic conditions, changes in interest rates, deposit flows, loan demand,
asset quality, including real estate and other collateral values, and
competition. •
S&T cautions that these forward-looking statements are subject to numerous
assumptions, risks and uncertainties, which change over time. These
forward-looking statements speak only as of the date hereof, and
S&T assumes no duty to update forward-looking statements. Subsequent
written
or
oral
statements
attributable
to
S&T
or
persons
acting
on
its
behalf
are
expressly
qualified in their entirety by the cautionary statements contained herein and
those in S&T’s reports previously and subsequently filed with the
Securities and Exchange Commission. |
 4
S&T Bancorp Corporate Profile |
 Investor Highlights
•
Historically High Performing Bank
•
Experienced Management Team
•
Relationship Banking Model
•
Well-Positioned for Growth
5 |
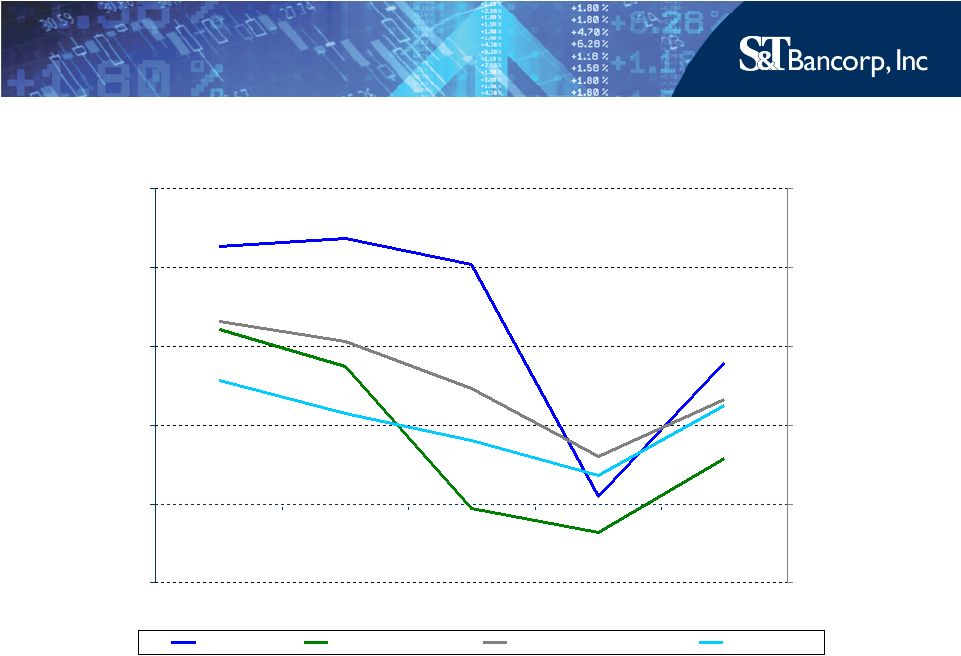 6
*
2011 peer banks per 2011 proxy statement
Return on Assets
-0.5%
0.0%
0.5%
1.0%
1.5%
2.0%
2006
2007
2008
2009
2010
-0.5%
0.0%
0.5%
1.0%
1.5%
2.0%
STBA
BHC $3-10 B
Peer
Bank
Median
*
PA Banks |
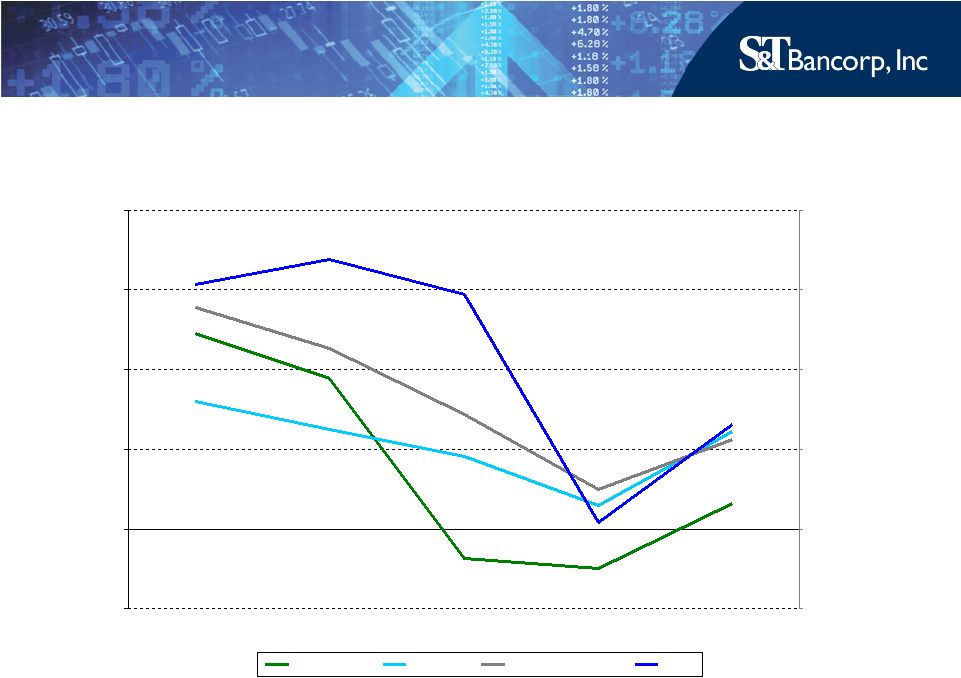 7
Return on Equity
*
2011 peer banks per 2011 proxy statement
-5%
0%
5%
10%
15%
20%
2006
2007
2008
2009
2010
-5%
0%
5%
10%
15%
20%
BHC $3-10 B
PA Banks
Peer
Bank
Median
*
STBA |
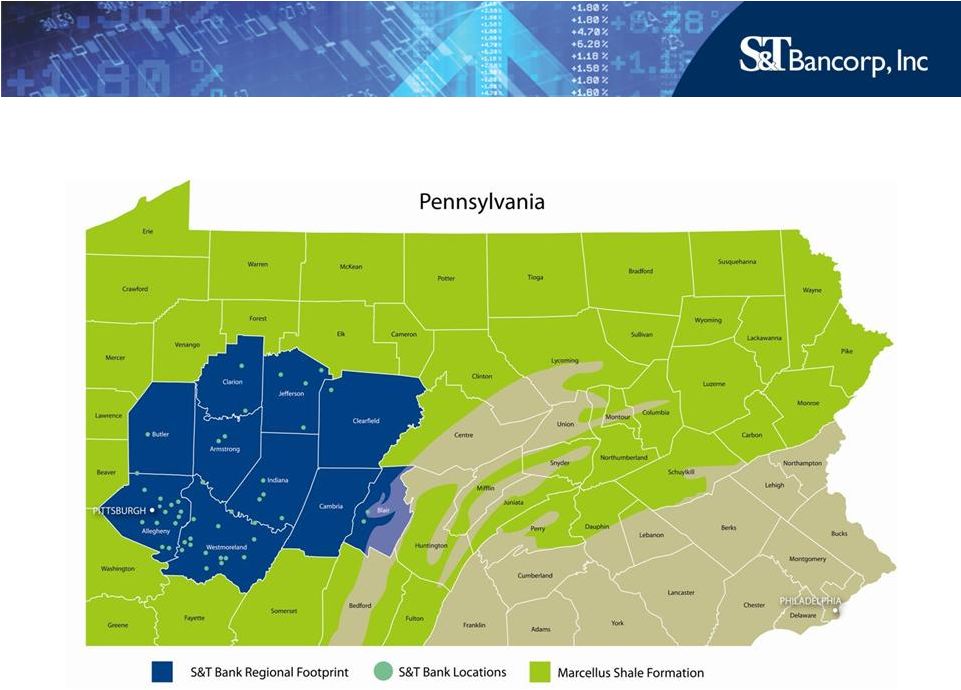 8
Marcellus Shale Distribution |
 9
|
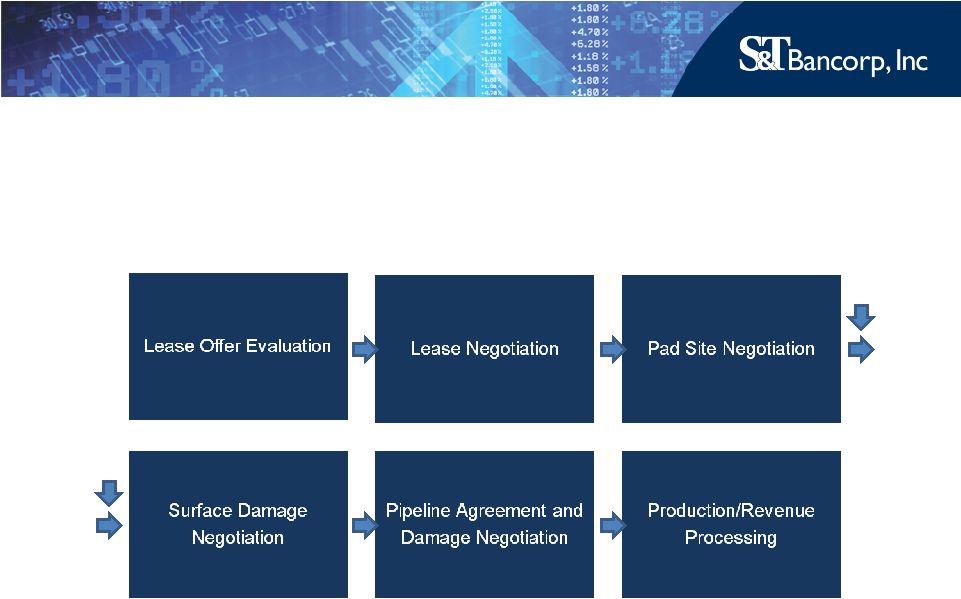 Mineral Management Process
10 |
 We
are here to… •
Provide access to well-informed industry professionals with the
knowledge and experience in the oil and gas industry.
–
Lease Negotiations
–
Pipeline
–
Right-of-Ways
–
Well Pads
–
Frac Water Ponds
–
Royalty Accounting
–
Production Verifications
11 |
 12
12
Quarterly Summary
2011
2010
2010
First
Quarter
Fourth
Quarter
First
Quarter
Net Income
$4.7
$8.7
$9.8
Diluted Common Earnings per Share
$0.17
$0.31
$0.35
Common
Return
on
Average
Assets
*
0.47%
0.84%
0.96%
Common
Return
on
Average
Equity
*
3.31%
6.00%
7.12%
Dollars in millions
*
Annualized |
 13
13
Income Statement
Dollars in millions
2011
2010
2010
First
Quarter
Fourth
Quarter
First
Quarter
Net Interest Income –
FTE
$35.9
$37.4
$37.1
Noninterest Income
11.0
12.0
11.2
Total Revenue
46.9
49.4
48.3
Noninterest Expense
(27.5)
(27.0)
(27.9)
Security Gains (Losses)
-
-
0.1
Provision for Loan Losses
(10.6)
(7.7)
(4.4)
Net Income Before Taxes
8.8
14.7
16.1
Taxes
(2.5)
(4.4)
(4.8)
Preferred Stock Dividends
(1.6)
(1.6)
(1.5)
Net Income Available to Common
Shareholders
$ 4.7
$8.7
$9.8
Diluted Common Earnings per Share
$0.17
$0.31
$0.35 |
 14
14
Balance Sheet
Dollars in millions
Mar. 31,
2011
Dec. 31,
2010
Mar. 31,
2010
Securities
$353
$310
$352
Loans, Net
3,243
3,313
3,335
Other
494
491
449
Total Assets
$4,090
$4,114
$4,136
Deposits
$3,306
$3,317
$3,346
Borrowings
158
161
184
Other
46
57
45
Equity
580
579
561
Total Liabilities & Equity
$4,090
$4,114
$4,136 |
 15
15
Loan Portfolio
Dollars in millions
Mar. 31,
2011
Dec. 31,
2010
Mar. 31,
2010
Consumer
Home Equity
$436
$441
$457
Residential Mortgage
345
368
360
Consumer
71
75
77
Construction
4
4
9
Total Consumer
$856
$888
$903
Commercial
Commercial Real Estate
$1,489
$1,494
$1,423
Commercial & Industrial
714
722
715
Construction
245
260
357
Total Commercial
$2,448
$2,476
$2,495
Total Loans
$3,304
$3,364
$3,398 |
 16
16
Asset Quality
*
YTD March 31, 2011 Annualized
Mar. 31,
December 31,
2011
2010
2009
2008
2007
Nonperforming Loans / Total Loans
2.45%
1.90%
2.67%
1.19%
0.60%
Nonperforming Assets / Total Loans Plus
OREO
2.67
2.07
2.80
1.21
0.62
Net
Charge-offs
/
Average
Loans
*
0.04
1.48
1.60
0.31
0.17
Loan Loss Reserve / Total Loans
1.87
1.53
1.75
1.20
1.23
Loan Loss Reserve / Nonperforming Loans
76
80
66
101
204 |
 17
Nonperforming Loans
91
3.01
$ 73.6
Total Commercial
9
3.00
7.3
Construction
11
1.27
9.1
Commercial & Industrial
71
3.84
$ 57.2
Commercial Real Estate
Commercial
9
0.84
$ 7.2
Total Consumer
-
-
-
Construction
-
-
-
Consumer Installment
7
1.55
5.3
Residential Mortgage
2
0.43
$ 1.9
Home Equity
% of
Total NPL
Consumer
% NPL
March 31,
2011
Total Nonperforming Loans
100
2.45
$ 80.8
Nonperforming
Loans
(NPL)
are
loans
where
collection
of
interest
or
principal
is
doubtful
or
generally
when
interest
or
principal
payments are 90 days or more past due.
Dollars in millions
Specific reserves $8.6
USDA Guarantee $6.8
17 |
 18
Construction & CRE by Type
Type
March 31,
2011
% of Total
March 31,
2010
Change
Retail/Strip Malls
$ 297
17
$ 295
$2
Miscellaneous
264
15
253
11
Residential Rental Properties
238
14
285
(47)
Offices
226
13
240
(14)
Hotels
195
11
176
19
Manuf/Industrial/Warehouse
118
7
132
(14)
Flex/Mixed Use
113
7
107
6
Healthcare/Education
108
6
100
8
RE Develop –
CL
93
5
108
(15)
RE Develop –
Residential
82
5
84
(2)
Total
$1,734
100
$1,780
($ 46)
18
Dollars in millions |
 19
Construction & CRE –
NPL by Type
Type
March 31,
2011
% NPL
% of
Total NPL
Retail/Strip Malls
$ 3.0
1.02
5
Miscellaneous
15.3
5.83
24
Residential Rental Properties
11.0
4.61
17
Offices
2.8
1.22
4
Hotels
13.5
6.98
21
Manuf/Industrial/Warehouse
3.6
3.05
6
Flex/Mixed Use
2.4
2.10
4
Healthcare/Education
0.8
0.75
1
RE Develop –
CL
6.0
6.40
9
RE Develop –
Residential
6.1
7.41
9
Total
$64.5
3.72
100
19
Dollars in millions |
 20
Net Interest Margin
2011
2010
2010
First
Quarter
Fourth
Quarter
First
Quarter
Securities -
FTE
3.02%
3.77%
4.06%
Loans -
FTE
4.92
5.02
5.12
Total Earning Assets
4.72
4.92
5.02
Deposits
0.97
1.03
1.21
Borrowings
3.14
3.00
2.49
Total Costing Liabilities
1.10
1.15
1.34
Net Interest Margin -
FTE
3.92
4.06
4.00 |
 21
Noninterest Income
Dollars in millions
2011
2010
2010
First
Quarter
Fourth
Quarter
First
Quarter
Community Banking
$ 5.6
$ 5.8
$ 5.5
Wealth Management
2.1
2.0
2.0
Insurance
2.1
1.8
2.4
Letters of Credit / Loan
0.5
0.8
0.6
Mortgage Banking
0.6
1.3
0.4
Other
0.1
0.3
0.3
Total
$11.0
$12.0
$11.2 |
 22
Securities
Mar. 31,
2011
Dec. 31,
2010
Mar. 31,
2010
Agencies
$125
$126
$118
Agency CMO
74
41
55
Agency MBS
59
44
58
Municipals
62
66
86
Equities
12
11
12
FHLB Stock
21
22
23
Total
$353
$310
$352
All securities are classified as available-for sale
Dollars in millions |
 23
Deposits
Dollars in millions
Mar. 31,
2011
Dec. 31,
2010
Mar. 31,
2010
Noninterest-bearing Demand
$ 803
$ 766
$ 709
Interest-bearing Demand
286
295
253
Money Market
241
262
251
Savings
755
754
753
Certificates of Deposit < $100K
781
788
878
Certificates Of Deposit > $100K
440
452
502
Total
$3,306
$3,317
$3,346 |
 24
24
Capital Ratios
Mar. 31
2011
Dec. 31
2010
Mar. 31
2010
Well-
Capitalized
Leverage
*
11.19%
11.07%
10.51%
5.00%
Tier 1 –
Risk-Based Capital
*
13.54
13.28
12.40
6.00
Total –
Risk-Based Capital
*
16.99
16.68
15.75
10.00
Tangible Common Equity /
Tangible Assets
7.70
7.61
7.09
NA
*
Includes CPP of $108.7 million |
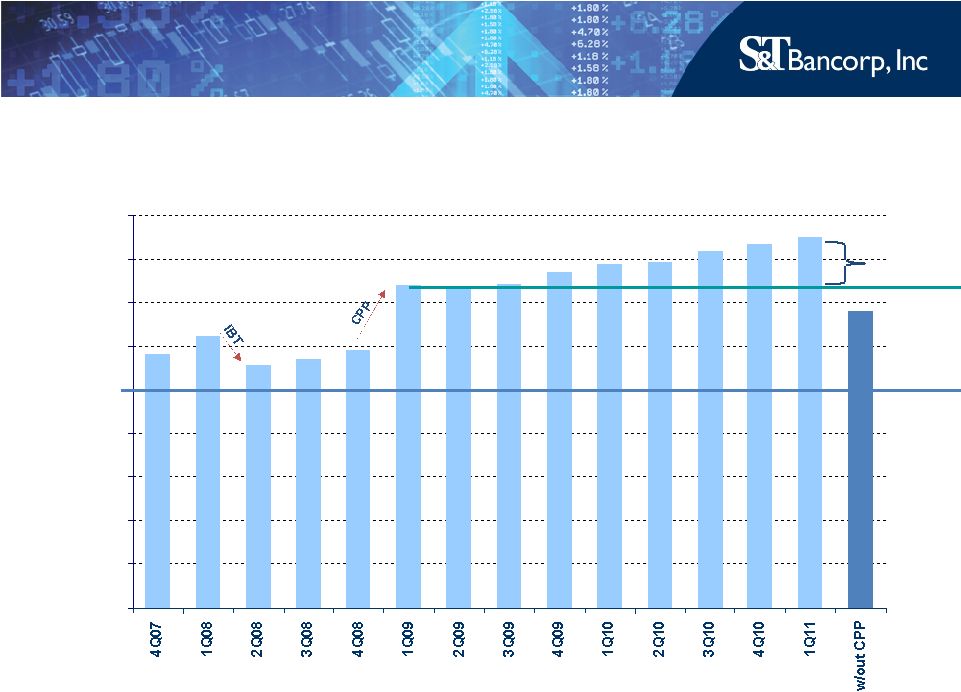 25
S&T
Bancorp
Capital
*
0%
2%
4%
6%
8%
10%
12%
14%
16%
18%
Well Capitalized
+2.19%
*
Total Risk-Based Capital |
 26
|
 First Quarter 2011 |