Attached files
| file | filename |
|---|---|
| 8-K - Maiden Holdings, Ltd. | v221700_8k.htm |
Maiden Holdings JMP Securities 10th Annual Research Conference May 10, 2011
Forward Looking Statements This presentation contains “forward-looking statements” which are made pursuant to the safe harbor provisions of the Private Securities Litigation Reform Act of 1995. The forward-looking statements are based on the Company’s current expectations and beliefs concerning future developments and their potential effects on the Company. There can be no assurance that actual developments will be those anticipated by the Company. Actual results may differ materially from those projected as a result of significant risks and uncertainties, including non-receipt of expected payments, changes in interest rates, effect of the performance of financial markets on investment income and fair values of investments, developments of claims and the effect on loss reserves, decreases in existing and new client projected premiums, accuracy in projecting loss reserves, the impact of competition and pricing environments, changes in the demand for the Company’s products, the effect of general economic conditions, adverse state and federal legislation, regulations and regulatory investigations into industry practices, developments relating to existing agreements, heightened competition, changes in pricing environments and changes in asset valuations. The Company undertakes no obligation to publicly update any forward-looking statements, except as may be required by law. Additional information about these risks and uncertainties, as well as others that many cause actual results to differ materially from those projected is contained in Item 1A. Risk Factors in the Company’s Annual Report on Form 10-K for the year ended December 31, 2010.
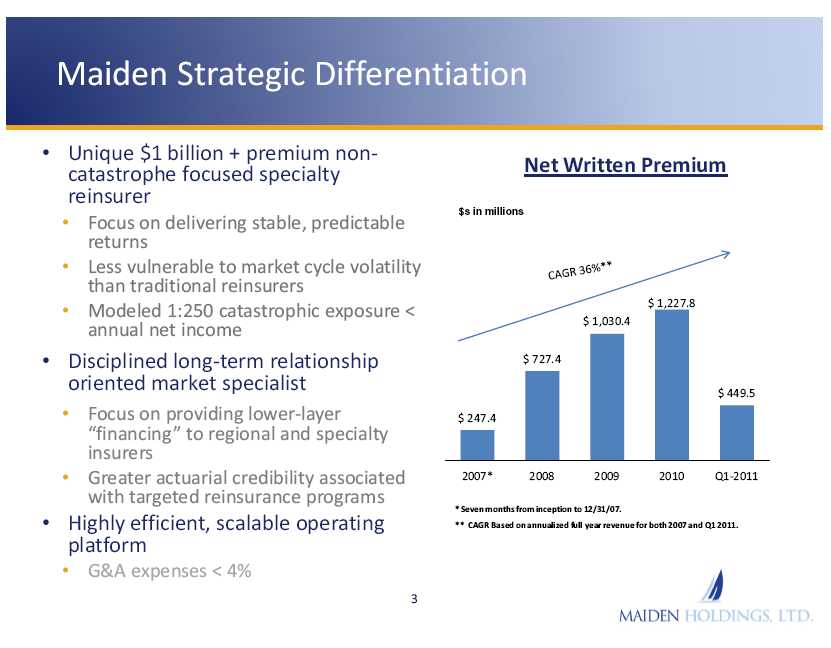
Maiden Strategic Differentiation • Unique $1 billion + premium non-catastrophe focused specialty reinsurer • Focus on delivering stable, predictable returns • Less vulnerable to market cycle volatility than traditional reinsurers • Modeled 1:250 catastrophic exposure < annual net income • Disciplined long-term relationship oriented market specialist • Focus on providing lower-layer “financing” to regional and specialty insurers • Greater actuarial credibility associated with targeted reinsurance programs • Highly efficient, scalable operating platform • G&A expenses < 4% Net Written Premium $s in millions CAGR 36% $247.4 $727.4 $1,030.4 $1,227.8 $449.5 2007* 2008 2009 2010 Q1-2011 * Seven months from inception to 12/31/07. ** CAGR Based on annualized full year revenue for both 2007 and Q1 2011.
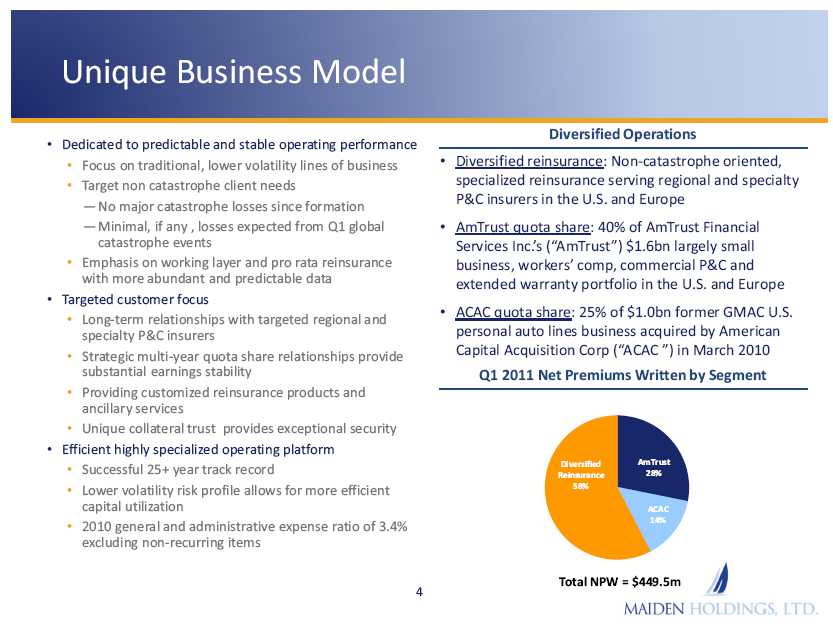
Unique Business Model • Dedicated to predictable and stable operating performance • Focus on traditional, lower volatility lines of business • Target non catastrophe client needs — No major catastrophe losses since formation — Minimal, if any, losses expected from Q1 global catastrophe events • Emphasis on working layer and pro rata reinsurance with more abundant and predictable data • Targeted customer focus • Long-term relationships with targeted regional and specialty P&C insurers • Strategic multi-year quota share relationships provide substantial earnings stability • Providing customized reinsurance products and ancillary services • Unique collateral trust provides exceptional security • Efficient highly specialized operating platform • Successful 25+ year track record • Lower volatility risk profile allows for more efficient capital utilization • 2010 general and administrative expense ratio of 3.4% excluding non-recurring items Diversified Operations • Diversified reinsurance: Non-catastrophe oriented, specialized reinsurance serving regional and specialty P&C insurers in the U.S. and Europe • AmTrust quota share: 40% of AmTrust Financial Services Inc.’s (“AmTrust”) $1.6bn largely small business, workers’ comp, commercial P&C and extended warranty portfolio in the U.S. and Europe • ACAC quota share: 25% of $1.0bn former GMAC U.S. personal auto lines business acquired by American Capital Acquisition Corp (“ACAC ”) in March 2010 Q1 2011 Net Premiums Written by Segment Diversified Reinsurance 58% AmTrust 28% ACAC 14% Total NPW = $449.5m
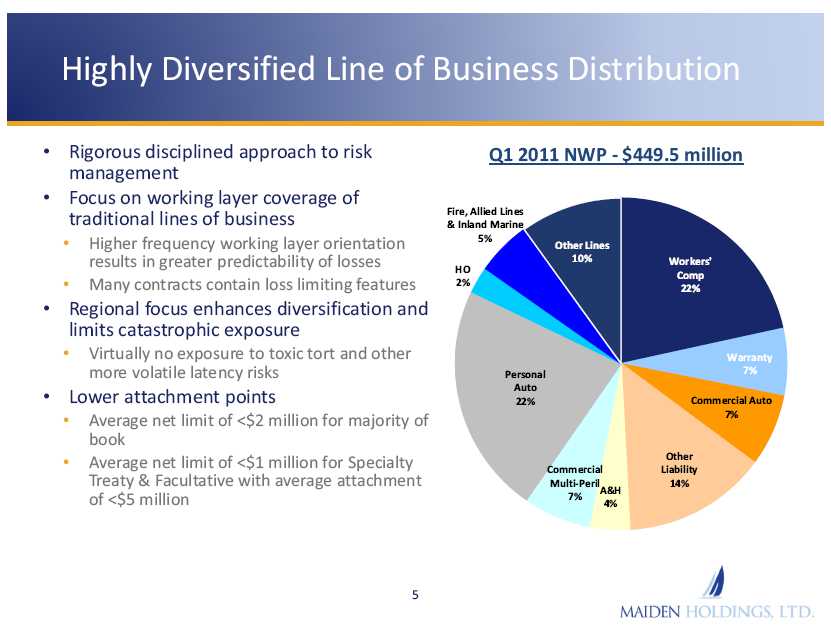
Highly Diversified Line of Business Distribution • Rigorous disciplined approach to risk management • Focus on working layer coverage of traditional lines of business • Higher frequency working layer orientation results in greater predictability of losses • Many contracts contain loss limiting features • Regional focus enhances diversification and limits catastrophic exposure • Virtually no exposure to toxic tort and other more volatile latency risks • Lower attachment points • Average net limit of <$2 million for majority of book • Average net limit of <$1 million for Specialty Treaty & Facultative with average attachment of <$5 million Q1 2011 NWP - $449.5 million Fire, Allied Lines & Inland Marine 5% HO 2% Personal Auto 22% Commercial Multi-Peril 7% A&H 4% Other Liability 14% Commercial Auto 7% Warranty 7% Workers’ Comp 22%
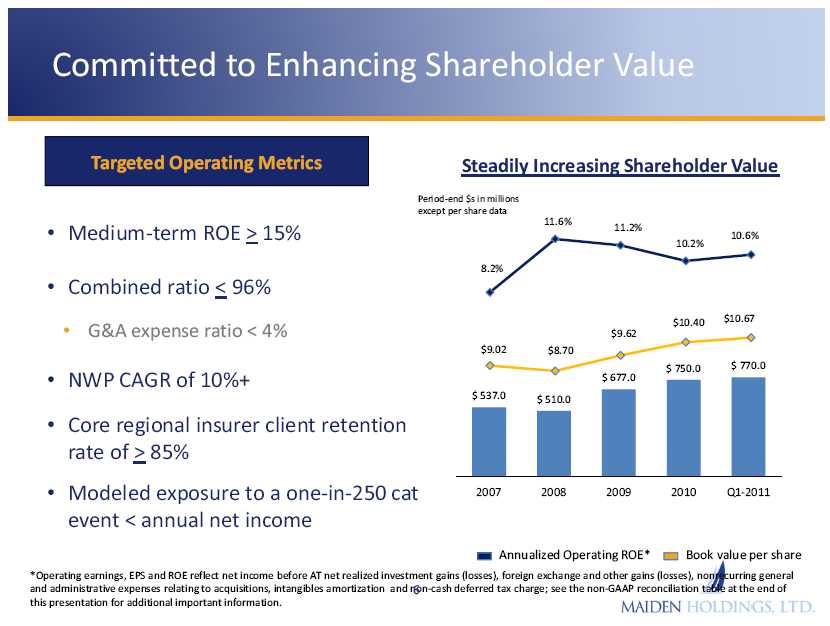
Committed to Enhancing Shareholder Value Targeted Operating Metrics Steadily Increasing Shareholder Value • Medium-term ROE > 15% • Combined ratio < 96% • G&A expense ratio < 4% • NWP CAGR of 10%+ • Core regional insurer client retention rate of > 85% • Modeled exposure to a one ] in] 250 cat event < annual net income Steadily Increasing Shareholder Value Period-end $s in millions except per share data 8.2% 11.6% 11.2% 10.2% 10.6% $9.02 $8.70 $9.62 $10.40 $10.67 $537.0 $510.0 $677.0 $750.0 $770.0 2007 2008 2009 2010 Q1-2011 Annualized Operating ROE* Book value per share *Operating earnings, EPS and ROE reflect net income before AT net realized investment gains (losses), foreign exchange and other gains (losses), nonrecurring general and administrative expenses relating to acquisitions, intangibles amortization and non-cash deferred tax charge; see the non-GAAP reconciliation table at the end of this presentation for additional important information .
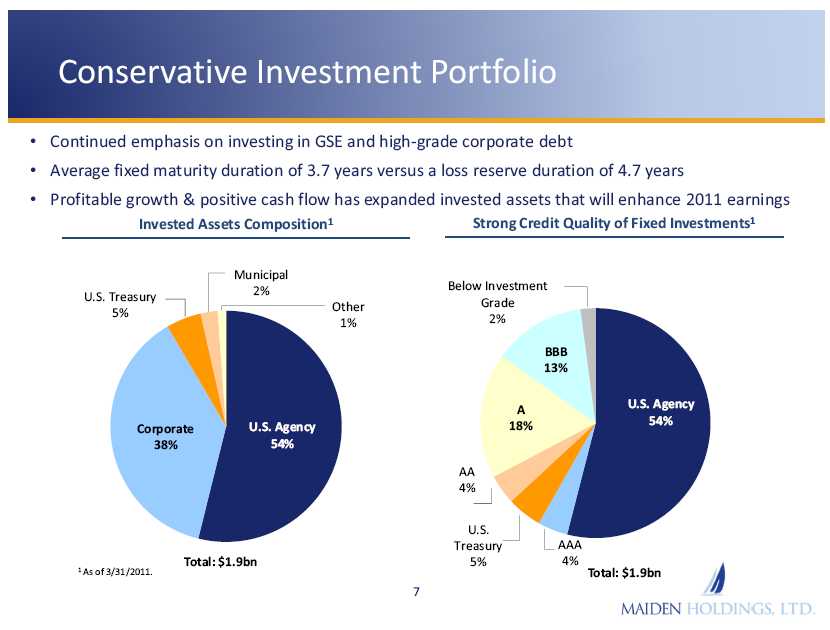
Conservative Investment Portfolio • Continued emphasis on investing in GSE and high] grade corporate debt • Average fixed maturity duration of 3.7 years versus a loss reserve duration of 4.7 years • Profitable growth & positive cash flow has expanded invested assets that will enhance 2011 earnings Invested Assets Composition1 U.S Treasury 5% Corporate 38% U.S. Agency 54% Other 1% Municipal 2% Total: $1.9bn Strong Credit Quality of Fixed Investments1 Below Investment Grade 2% BBB 13% A 18% AA 4% U.S. Treasury 5% AAA 4% U.S. Agency 54% Total: $1.9bn 1 As of 3/31/2011.
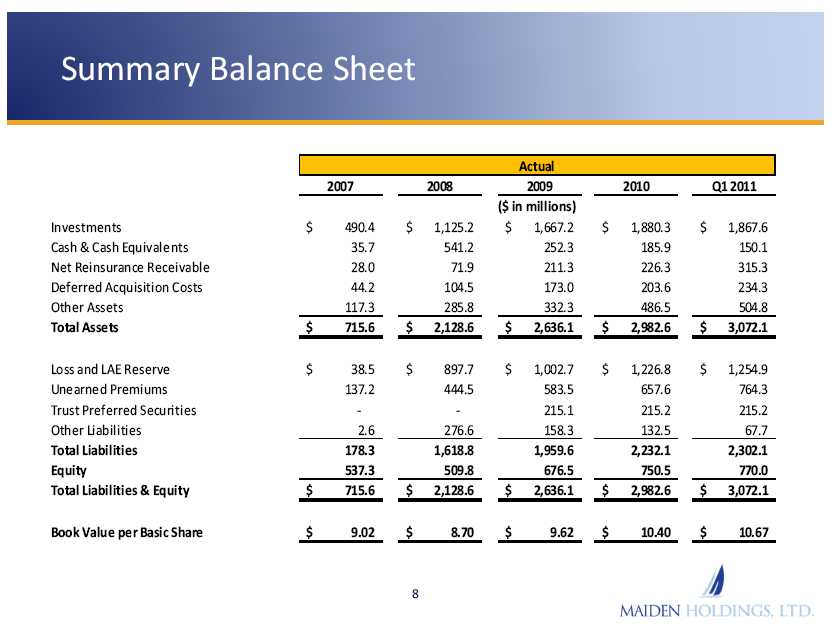
Summary Balance Sheet Actual 2007 2008 2009 2010 Q1 2011 ($ in millions) Investments $490.4 $1,125.2 $1,667.2 $1,880.3 $1,867.6 Cash & Cash Equivalents 35.7 541.2 252.3 185.9 150.1 Net Reinsurance Receivable 28.0 71.9 211.3 226.3 315.3 Deferred Acquisition Costs 44.2 104.5 173.0 203.6 234.3 Other Assets 117.3 285.8 332.3 486.5 504.8 Total Assets $715.6 $2,128.6 $2,636.1 $2,982.6 $3,072.1 Loss and LAE Reserve $38.5 $897.7 $1,002.7 $1,226.8 $1,254.9 Unearned Premiums 137.2 444.5 583.5 657.6 764.3 Trust Preferred Securities - - 215.1 215.2 215.2 Other Liabilities 2.6 276.6 158.3 132.5 67.7 Total Liabilities 178.3 1,618.8 1,959.6 2,232.1 2,302.1 Equity 537.3 509.8 676.5 750.5 770.0 Total Liabilities & Equity $715.6 $2,128.6 $2,636.1 $2,982.6 $3,072.1 Book Value per Basic Share $9.02 $8.70 $9.62 $10.40 $10.67
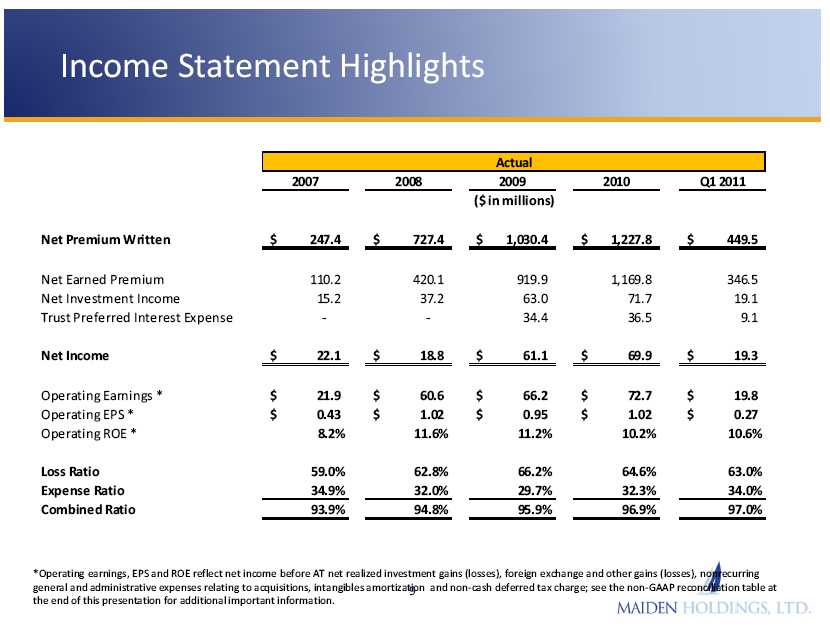
Income Statement Highlights Actual 2007 2008 2009 2010 Q1 2011 ($ in millions) Net Premium Written $247.4 $727.4 $1,030.4 $1,227.8 $449.5 Net Earned Premium 110.2 420.1 919.9 1,169.8 346.5 Net Investment Income 15.2 37.2 63.0 71.7 19.1 Trust Preferred Interest Expense - - 34.4 36.5 9.1 Net Income $22.1 $18.8 $61.1 $69.9 $19.3 Operating Earnings * $21.9 $60.6 $66.2 $72.7 $19.8 Operating EPS * $0.43 $1.02 $0.95 $1.02 $0.27 Operating ROE * 8.2% 11.6% 11.2% 10.2% 10.6% Loss Ratio 59.0% 62.8% 66.2% 64.6% 63.0% Expense Ratio 34.9% 32.0% 29.7% 32.3% 34.0% Combined Ratio 93.9% 94.8% 95.9% 96.9% 97.0% *Operating earnings, EPS and ROE reflect net income before AT net realized investment gains (losses), foreign exchange and other gains (losses), nonrecurring general and administrative expenses relating to acquisitions, intangibles amortization and non-cash deferred tax charge; see the non-GAAP reconciliation table at the end of this presentation for additional important information .
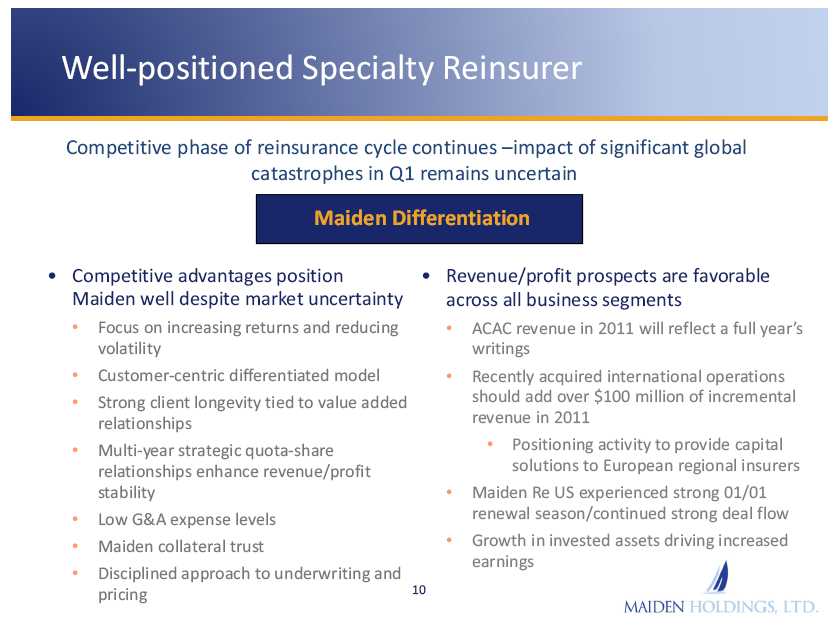
Well-positioned Specialty Reinsurer Competitive phase of reinsurance cycle continues –impact of significant global catastrophes in Q1 remains uncertain Maiden Differentiation • Competitive advantages position Maiden well despite market uncertainty • Focus on increasing returns and reducing volatility • Customer-centric differentiated model • Strong client longevity tied to value added relationships • Multi-year strategic quota-share relationships enhance revenue/profit stability • Low G&A expense levels • Maiden collateral trust • Disciplined approach to underwriting and pricing • Revenue/profit prospects are favorable across all business segments • ACAC revenue in 2011 will reflect a full year’s writings • Recently acquired international operations should add over $100 million of incremental revenue in 2011 • Positioning activity to provide capital solutions to European regional insurers • Maiden Re US experienced strong 01/01 renewal season/continued strong deal flow • Growth in invested assets driving increased earnings
Non-GAAP Financial Measures • In presenting the Company’s results, management has included and discussed in this presentation certain non generally accepted accounting principles (“non-GAAP”) financial measures within the meaning of Regulation G as promulgated by the U.S. Securities and Exchange Commission. Management believes that these non-GAAP measures, which may be defined differently by other companies, better explain the company’s results of operations in a manner that allows for a more complete understanding of the underlying trends in the Company’s business. However, these measures should not be viewed as a substitute for those determined in accordance with generally accepted accounting principles (“U.S. GAAP”). • Operating Earnings and Operating Earnings per Share: In addition to presenting net income determined in accordance with GAAP, we believe that showing operating earnings enables investors, analysts, rating agencies and other users of our financial information to more easily analyze our results of operations in a manner similar to how management analyzes our underlying business performance. Operating earnings should not be viewed as a substitute for U.S. GAAP net income. Operating earnings are an internal performance measure used in the management of our operations and represents operating results excluding, as applicable, realized investment gains or losses, foreign exchange gain or loss, the amortization of intangible assets and non-cash deferred tax expenses. We exclude net realized investment gains or losses and foreign exchange gain or loss as we believe that both are heavily influenced in part by market opportunities and other factors. We do not believe amortization of intangible assets are representative of our ongoing business. We believe all of these amounts are largely independent of our business and underwriting process and including them distorts the analysis of trends in our operations. • Operating Return on Equity ("Operating ROE"): Management uses operating return on average shareholders' equity as a measure of profitability that focuses on the return to common shareholders. It is calculated using operating earnings available to common shareholders (realized gains or losses on investments, foreign exchange gains and losses, amortization of intangibles, and amortization of intangible assets) divided by average common shareholders' equity. In calculating and presenting Operating ROE, amounts for 2011 are annualized as follows: the operating earnings for the period as defined above is multiplied by the number of such periods in a calendar year in order to arrive at annualized operating earnings. Management has set as a target a long-term average of 15% Operating ROE, which management believes provides an attractive return to shareholders for the risk assumed. • See slide 12 for a reconciliation of non-GAAP measures used in this presentation to their most directly comparable GAAP measures.
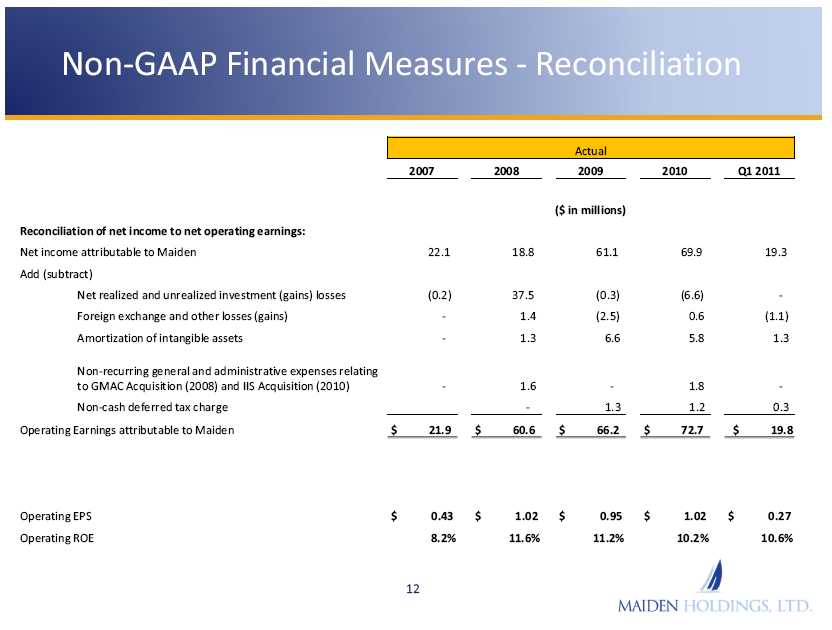
Non-GAAP Financial Measures – Reconciliation Actual 2007 2008 2009 2010 Q1 2011 ($ in millions) Reconciliation of net income to net operating earnings: Net income attributable to Maiden 22.1 18.8 61.1 69.9 19.3 Add (subtract) Net realized and unrealized investment (gains) losses (0.2) 37.5 (0.3) (6.6) - Foreign exchange and other losses (gains) - 1.4 (2.5) 0.6 (1.1) Amortization of intangible assets - 1.3 6.6 5.8 1.3 Non-recurring general and administrative expenses relating to GMAC Acquisition (2008) and IIS Acquisition (2010) - 1.6 - 1.8 – Non-cash deferred tax charge - 1.3 1.2 0.3 Operating Earnings attributable to Maiden $21.9 $60.6 $66.2 $72.7 $19.8 Operating EPS $0.43 $1.02 $0.95 $1.02 $0.27 Operating ROE 8.2% 11.6% 11.2% 10.2% 10.6%