Attached files
| file | filename |
|---|---|
| EX-21.1 - EXHIBIT 21.1 - Maiden Holdings, Ltd. | a10k2015exhibit-211.htm |
| EX-31.2 - EXHIBIT 31.2 - Maiden Holdings, Ltd. | a10k2015exhibit-312.htm |
| EX-23.1 - EXHIBIT 23.1 - Maiden Holdings, Ltd. | a10k2015exhibit-231.htm |
| EX-31.1 - EXHIBIT 31.1 - Maiden Holdings, Ltd. | a10k2015exhibit-311.htm |
| EX-32.1 - EXHIBIT 32.1 - Maiden Holdings, Ltd. | a10k2015exhibit-321.htm |
| EX-32.2 - EXHIBIT 32.2 - Maiden Holdings, Ltd. | a10k2015exhibit-322.htm |
UNITED STATES
SECURITIES AND EXCHANGE COMMISSION
Washington, D.C. 20549
SECURITIES AND EXCHANGE COMMISSION
Washington, D.C. 20549
FORM 10-K
x | ANNUAL REPORT PURSUANT TO SECTION 13 OR 15(d) OF THE SECURITIES EXCHANGE ACT OF 1934 |
For the Fiscal Year Ended December 31, 2015
OR
o | TRANSITION REPORT PURSUANT TO SECTION 13 OR 15(d) OF THE SECURITIES EXCHANGE ACT OF 1934 |
For the Transition Period from to
Commission File Number: 001-34042
MAIDEN HOLDINGS, LTD.
(Exact Name of Registrant As Specified in Its Charter)
Bermuda | 98-0570192 |
(State or Other Jurisdiction of Incorporation or Organization) | (I.R.S. Employer Identification No.) |
131 Front Street
Hamilton HM 12, Bermuda
Hamilton HM 12, Bermuda
(Address of Principal Executive Offices and Zip Code)
(441) 298-4900
(Registrant’s Telephone Number, Including Area Code)
Securities registered pursuant to Section 12(b) of the Act:
Title of Each Class | Name of Each Exchange on Which Registered | |
Common Shares, par value $0.01 per share | NASDAQ Global Select Market | |
Series A Preference Shares, par value $0.01 per share | New York Stock Exchange, Inc. | |
Series B Mandatory Convertible Preference Shares, par value $0.01 per share | NASDAQ Global Select Market | |
Series C Preference Shares, par value $0.01 per share | New York Stock Exchange, Inc | |
Securities registered pursuant to Section 12(g) of the Act: None
Indicate by check mark if the registrant is a well-known seasoned issuer, as defined in Rule 405 of the Securities Act. Yes o No x
Indicate by check mark if the registrant is not required to file reports pursuant to Section 13 or Section 15(d) of the Act. Yes o No x
Indicate by check mark whether the registrant (1) has filed all reports required to be filed by Section 13 or 15(d) of the Securities Exchange Act of 1934 during the preceding 12 months (or for such shorter period that the registrant was required to file such reports), and (2) has been subject to such filing requirements for the past 90 days. Yes x No o
Indicate by check mark whether the registrant has submitted electronically and posted on its corporate Web site, if any, every Interactive Data File required to be submitted and posted pursuant to Rule 405 of Regulation S-T during the preceding 12 months (or for such shorter period that the registrant was required to submit and post such files). Yes x No o
Indicate by check mark if disclosure of delinquent filers pursuant to Item 405 of Regulation S-K is not contained herein, and will not be contained, to the best of the registrant’s knowledge, in the definitive proxy or information statements incorporated by reference in Part III of this Form 10-K or any amendment to this Form 10-K. x
Indicate by check mark whether the registrant is a large accelerated filer, an accelerated filer, a non-accelerated filer, or a smaller reporting company. See the definitions of "large accelerated filer", "accelerated filer" and "smaller reporting company" in Rule 12b-2 of the Exchange Act. (Check one):
Large Accelerated Filer x | Accelerated Filer o | Non-Accelerated Filer o | Smaller Reporting Company o |
(Do not check if a smaller reporting company) | |||
Indicate by check mark whether the registrant is a shell company (as defined in Rule 12b-2 of the Act). Yes o No x
The aggregate market value of voting and non-voting common shares held by non-affiliates of the registrant as of June 30, 2015 (the last business day of the registrant’s most recently completed second fiscal quarter) was approximately $931.1 million based on the closing sale price of the registrant’s common shares on the NASDAQ Global Select Market on that date. As of February 19, 2016, 73,862,441 common shares were outstanding.
DOCUMENTS INCORPORATED BY REFERENCE
Portions of the registrant’s definitive proxy statement to be filed with the Securities and Exchange Commission pursuant to Regulation 14A with respect to the annual general meeting of the shareholders of the registrant scheduled to be held on May 4, 2016 are incorporated by reference into Part III of this Annual Report on Form 10-K.
MAIDEN HOLDINGS, LTD.
TABLE OF CONTENTS
TABLE OF CONTENTS
Page | ||
PART I | ||
PART II | ||
PART III | ||
PART IV | ||
Ex-21.1 | Subsidiaries of the Registrant | |
Ex-23.1 | Consent of BDO USA, LLP | |
Ex-31.1 | Section 302 Certification of CEO | |
Ex-31.2 | Section 302 Certification of CFO | |
Ex-32.1 | Section 906 Certification of CEO | |
Ex-32.2 | Section 906 Certification of CFO | |
i
PART I
Special Note About Forward-Looking Statements
Certain statements in this Annual Report on Form 10-K, other than purely historical information, including estimates, projections, statements relating to our business plans, objectives and expected operating results and the assumptions upon which those statements are based are forward-looking statements within the meaning of the Private Securities Litigation Reform Act of 1995, Section 27A of the Securities Act of 1933, as amended, and Section 21E of the Securities Exchange Act of 1934, as amended. These forward-looking statements include general statements both with respect to us and the insurance industry and generally are identified with the words "anticipate", "believe", "expect", "predict", "estimate", "intend", "plan", "project", "seek", "potential", "possible", "could", "might", "may", "should", "will", "would", "will be", "will continue", "will likely result" and similar expressions. In light of the risks and uncertainties inherent in all forward-looking statements, the inclusion of such statements in this Annual Report on Form 10-K should not be considered as a representation by us or any other person that our objectives or plans or other matters described in any forward-looking statement will be achieved. These statements are based on current plans, estimates, assumptions and expectations. Actual results may differ materially from those projected in such forward-looking statements and therefore, you should not place undue reliance on them. Important factors that could cause actual results to differ materially from those in such forward-looking statements are set forth in Item 1A "Risk Factors" in this Annual Report on Form 10-K.
We caution that the list of important risk factors is not intended to be and is not exhaustive. We undertake no obligation to update or revise publicly any forward-looking statements, whether as a result of new information, future events or otherwise, except as may be required by law, and all subsequent written and oral forward-looking statements attributable to us or individuals acting on our behalf are expressly qualified in their entirety by this paragraph. If one or more risks or uncertainties materialize, or if our underlying assumptions prove to be incorrect, our actual results may vary materially from what we projected. Any forward-looking statements in this Annual Report on Form 10-K reflect our current view with respect to future events and are subject to these and other risks, uncertainties and assumptions relating to our operations, results of operations, growth, strategy and liquidity. Readers are cautioned not to place undue reliance on the forward-looking statements which speak only as of the dates of the documents in which such statements were made.
References in this Annual Report on Form 10-K to the terms "we","us","our","the Company" or other similar terms mean the consolidated operations of Maiden Holdings, Ltd. and our consolidated subsidiaries, unless the context requires otherwise. References in this Annual Report on Form 10-K to the term "Maiden Holdings" or "Maiden" means Maiden Holdings, Ltd. only. References in this Annual Report on Form 10-K to $ are to the lawful currency of the United States, unless otherwise indicated. Any discrepancies in the tables included herein between the amounts listed and the totals thereof are due to rounding.
1
Item 1. Business.
General Overview
We are a Bermuda-based holding company, primarily focused on serving the needs of regional and specialty insurers in the United States, Europe and select other global markets by providing innovative reinsurance solutions designed to support their capital needs. We specialize in reinsurance solutions that optimize financing and risk management by providing coverage within the more predictable and actuarially credible lower layers of coverage and/or reinsuring risks that are believed to be lower hazard, more predictable and generally not susceptible to catastrophe claims. Our tailored solutions include a variety of value added services focused on helping our clients grow and prosper. Our principal operating subsidiaries are rated "A-" (Excellent) with a positive outlook by A.M. Best Company ("A.M. Best"), which rating is the fourth highest of sixteen rating levels, and "BBB+" (Good) with a stable outlook by Standard & Poor's ("S&P"), which is the eighth highest of twenty-two rating levels. Our common shares trade on the NASDAQ Global Select Market ("NASDAQ") under the symbol "MHLD".
We provide reinsurance through our wholly owned subsidiaries, Maiden Reinsurance Ltd. ("Maiden Bermuda") and Maiden Reinsurance North America, Inc. ("Maiden US"). Internationally, we provide insurance sales and distribution services through Maiden Global Holdings, Ltd. ("Maiden Global") and its subsidiaries. Maiden Global primarily focuses on providing branded auto and credit life insurance products through insurer partners to retail clients in the European Union ("EU") and other global markets. These products also produce reinsurance programs which are underwritten by Maiden Bermuda. Certain international credit life business is written on a primary basis by Maiden Life Försäkrings AB ("Maiden LF").
Since our founding in 2007, we have entered into a series of strategic transactions that have significantly transformed the scope and scale of our business while maintaining our our low volatility, non-catastrophe oriented risk profile. These transactions have increased our gross premiums written to an amount in excess of $2.6 billion. These strategic transactions include the following:
• | Entering into a quota share reinsurance agreement (the "Reinsurance Agreement" or "AmTrust Quota Share") with a Bermuda subsidiary of AmTrust Financial Services, Inc. ("AmTrust"), AmTrust International Insurance, Ltd. ("AII"), in 2007 and a quota share reinsurance agreement (the "European Hospital Liability Quota Share") with AmTrust Europe Limited ("AEL") and AmTrust International Underwriters Limited ("AIUL") in 2011; |
• | Acquiring the reinsurance operations of GMAC Insurance (the "GMAC Acquisition") in 2008 and the GMAC International Insurance Services (the "IIS Acquisition") in 2010; |
• | Entering into a quota share reinsurance agreement with a subsidiary of National General Holdings Corporation ("NGHC") in 2010 (the "NGHC Quota Share"). This agreement was terminated on a run-off basis effective August 1, 2013; |
• | Substantially reducing our net exposure to natural hazard events by selling, on May 1, 2013, the primary insurance business written on a surplus lines basis by Maiden Specialty Insurance Company ("Maiden Specialty"), a wholly owned subsidiary of Maiden US, to Brit Insurance. Maiden Specialty provided non-catastrophe inland marine and property coverages. On November 4, 2015, Maiden US finalized the sale of Maiden Specialty to Clear Blue Financial Holdings, LLC ("Clear Blue"); and |
• | During 2015, we acquired Regulatory Capital Limited, trading as Insurance Regulatory Capital ("IRC"), a licensed asset manager in Ireland. IRC offers solutions designed to meet the capital and risk management needs of mid-sized insurance companies. |
We have also entered into a series of capital transactions that have enabled us to support our growing reinsurance operations while significantly enhancing our capital position to over $1.7 billion at December 31, 2015 and lowering our cost of capital. These capital transactions include:
• | Private placement of Trust Preferred Securities (the "TRUPS Offering"), the proceeds from which were used to finance the issuance of subordinated debenture (the "Junior Subordinated Debt") resulting in gross proceeds of $260.1 million in January 2009. The net proceeds of this transaction were used as working capital for Maiden US and Maiden Specialty in conjunction with the GMAC Acquisition. The outstanding Junior Subordinated Debt was fully repurchased on January 15, 2014; |
• | Public debt offering of $107.5 million in June 2011 ("2011 Senior Notes") and repurchasing a like amount of our Junior Subordinated Debt in July 2011. The 2011 Senior Notes trade on the New York Stock Exchange ("NYSE") under the symbol "MHNA"; |
• | Public debt offering of $100.0 million in March 2012 ("2012 Senior Notes"). The 2012 Senior Notes trade on NYSE under the symbol "MHNB". The net proceeds of $96.6 million were used for working capital and general corporate purposes; |
• | Public offering of $150.0 million Preference Shares - Series A ("Preference Shares - Series A") in August 2012. We received net proceeds of $145.0 million from the offering. The Preference Shares - Series A trade on NYSE under the |
2
symbol "MHPRA". The net proceeds from the offering were used for continued support and development of our reinsurance business and for other general corporate purposes;
• | Public offering of $165.0 million Mandatory Convertible Preference Shares - Series B ("Preference Shares - Series B") in October 2013. The Preference Shares - Series B trade on NASDAQ under the symbol "MHLDO". We received net proceeds of $159.7 million from the offering. The net proceeds from the offering were used for general corporate purposes, primarily to support the continuing growth of our reinsurance operations; |
• | Public debt offering of $152.5 million in November 2013 ("2013 Senior Notes"). The 2013 Senior Notes trade on NYSE under the symbol "MHNC". The net proceeds of $147.4 million, as well as cash on hand, were used to repurchase all of the remaining portion of our outstanding Junior Subordinated Debt, with a face value of $152.5 million, on January 15, 2014, which substantially lowered our cost of capital; and |
• | Public offering of $165.0 million Preference Shares - Series C ("Preference Shares - Series C") in November 2015. The Preference Shares - Series C trade on NYSE under the symbol "MHPRC". We received net proceeds of $159.6 million from the offering. We expect to use the net proceeds of this offering for continued support and development of our reinsurance business and for other general corporate purposes. |
The 2011 Senior Notes, 2012 Senior Notes and 2013 Senior Notes may also collectively be referred to as the "Senior Note Offerings". These transactions, along with other unusual or non-recurring events, should be considered when evaluating year-to-year comparability or when comparing our performance with other companies considered our peers and with whom we compete on a regular basis.
Business Strategy
Our goal is to leverage the competitive strengths of our organization and capital structure to generate stable long term operating returns on common equity in excess of 15%. We seek to accomplish this by becoming a premier global preferred provider of customized reinsurance and capital products and services to regional and specialty insurance companies. To achieve this goal, we have adopted the following strategies:
• | Dedication to Predictable and Stable Results — we execute this strategy in two ways: (1) focusing on traditional, lower volatility lines of business that are more predictable and thus, produce more stable long-term operating results and require less capital to achieve those results; and (2) placing emphasis on working layer and pro rata reinsurance participations where data is more abundant and results are more predictable; |
• | Targeted Customer Focus — we execute this strategy by developing significant and long term reinsurance relationships with targeted regional and specialty insurance companies for which reinsurance plays a critical element of their capital structure and supporting the long term needs of these companies by providing differentiated products as well as an array of support services; and |
• | Efficient Operating Platform — recognizing the mature nature of the reinsurance market, we are focused on maintaining operating expense ratios within the top quartile of the industry. Efficiency is a critical component of maintaining a disciplined underwriting approach. |
To date, despite achieving operating returns on common equity generally in excess of our industry peers, we have not yet attained our targeted returns. We believe our efficient balance sheet and low volatility business are the primary reasons our returns have generally exceeded industry averages, despite a declining investment yield environment since our founding. Our ability to achieve our targeted returns were initially impacted by a significantly higher cost of capital. Our capital management strategy in recent years has appreciably lowered our cost of capital and improved our returns on common equity. More recently, higher than targeted combined ratios have affected our underwriting profitability and limited our progress toward our objective. We believe however, that the underwriting initiatives we have implemented will enable us to make progress toward our long term operating return on common equity target during the next 12 to 24 months.
Our future results, and our ability to generate our targeted return on capital, may be additionally impacted by risks and trends set forth in Item 1A, "Risk Factors", and elsewhere in this Annual Report on Form 10-K.
Our Principal Operating Subsidiaries
Maiden Bermuda, a wholly owned subsidiary of Maiden Holdings, is a registered Class 3B Bermuda reinsurance company that began operations in June 2007. Senior management and all of the staff of Maiden Bermuda operate from and are based in our Bermuda headquarters.
Maiden Holdings North America, Ltd. ("Maiden NA") is our wholly owned U.S. holding company and is domiciled in the state of Delaware. Maiden US, a wholly owned subsidiary of Maiden NA, is a licensed property and casualty insurance company domiciled in the state of Missouri. Maiden Re Insurance Services, LLC ("Maiden Re"), a wholly owned subsidiary of Maiden NA, is a limited liability company organized in the state of Delaware in January 2008. Maiden Re operates as a managing general agent and underwriter for Maiden US.
3
Maiden Global, a wholly owned subsidiary of Maiden Holdings, operates as a reinsurance services and holding company. Maiden Global is organized under the laws of England and Wales. Opel Händler VersicherungsService GmbH ("OVS"), organized under the laws of Germany, operates as an insurance producer in Germany and is a 90% owned indirect subsidiary of Maiden Global.
Maiden LF, a wholly owned subsidiary of Maiden Holdings, is a life insurer organized under the laws of Sweden and writes credit life insurance on a primary basis in support of Maiden Global’s business development efforts.
IRC, a 66.7% owned subsidiary of Maiden Holdings, is a licensed asset manager offering solutions designed to meet the capital and risk management needs of mid-sized insurance companies.
Our Reportable Segments
Our business consists of two reportable segments: Diversified Reinsurance and AmTrust Reinsurance. Our Diversified Reinsurance segment consists of a portfolio of predominantly property and casualty reinsurance business focusing on regional and specialty property and casualty insurance companies located, primarily in the U.S. and Europe. Our AmTrust Reinsurance segment includes all business ceded by AmTrust to Maiden Bermuda, primarily the AmTrust Quota Share and the European Hospital Liability Quota Share.
In addition to our reportable segments, the results of operations of the former NGHC Quota Share segment and the remnants of the U.S. excess and surplus ("E&S") business have been separated and included in a category captioned "Other". Financial data relating to our two segments is included in Item 7. "Management’s Discussion and Analysis of Financial Condition and Results of Operations" and in "Notes to Consolidated Financial Statements Note 3. Segment Information" included under Item 8 "Financial Statements and Supplementary Data" of this Form 10-K.
The tables below compare net premiums written and earned, by reportable segment, reconciled to the total net premiums written and earned, for the years ended December 31, 2015, 2014 and 2013:
For the Year Ended December 31, | 2015 | 2014 | 2013 | ||||||||||||||||||
Net Premiums Written | % of Total | Net Premiums Written | % of Total | Net Premiums Written | % of Total | ||||||||||||||||
($ in Millions) | ($ in Millions) | ($ in Millions) | |||||||||||||||||||
Diversified Reinsurance | $ | 734.8 | 29.2 | % | $ | 850.0 | 34.6 | % | $ | 763.4 | 36.4 | % | |||||||||
AmTrust Reinsurance | 1,779.3 | 70.8 | % | 1,610.5 | 65.5 | % | 1,169.9 | 55.8 | % | ||||||||||||
Total - reportable segments | 2,514.1 | 100.0 | % | 2,460.5 | 100.1 | % | 1,933.3 | 92.2 | % | ||||||||||||
Other | — | — | % | (2.4 | ) | (0.1 | )% | 163.0 | 7.8 | % | |||||||||||
Total | $ | 2,514.1 | 100.0 | % | $ | 2,458.1 | 100.0 | % | $ | 2,096.3 | 100.0 | % | |||||||||
For the Year Ended December 31, | 2015 | 2014 | 2013 | ||||||||||||||||||
Net Premiums Earned | % of Total | Net Premiums Earned | % of Total | Net Premiums Earned | % of Total | ||||||||||||||||
($ in Millions) | ($ in Millions) | ($ in Millions) | |||||||||||||||||||
Diversified Reinsurance | $ | 744.9 | 30.7 | % | $ | 854.0 | 37.9 | % | $ | 753.2 | 37.6 | % | |||||||||
AmTrust Reinsurance | 1,684.2 | 69.3 | % | 1,378.3 | 61.2 | % | 988.9 | 49.4 | % | ||||||||||||
Total - reportable segments | 2,429.1 | 100.0 | % | 2,232.3 | 99.1 | % | 1,742.1 | 87.0 | % | ||||||||||||
Other | — | — | % | 19.4 | 0.9 | % | 258.8 | 13.0 | % | ||||||||||||
Total | $ | 2,429.1 | 100.0 | % | $ | 2,251.7 | 100.0 | % | $ | 2,000.9 | 100.0 | % | |||||||||
The majority of our gross premiums written is generated by quota share reinsurance contracts. For the years ended December 31, 2015, 2014 and 2013, 91.0%, 88.2% and 83.1% respectively, of our consolidated gross premiums written was derived from quota share reinsurance contracts. This significant concentration of quota share reinsurance, combined with our focus on lines of business which are inherently less volatile, results in a less capital intensive business which enables the Company to target higher returns on equity for its shareholders.
Financial data relating to the geographical areas in which we operate and relating to our principal products may be found in "Notes to Consolidated Financial Statements Note 3. Segment Information" included under Item 8 "Financial Statements and Supplementary Data" of this Form 10-K.
4
In a quota share reinsurance arrangement (also known as pro-rata reinsurance, proportional reinsurance or participating reinsurance), the reinsurer shares a proportional part of the original premiums of the reinsured. In return, the reinsurer assumes a proportional share of the losses incurred by the cedant. The reinsurer pays the company a ceding commission, which is generally based on the ceding company’s cost of acquiring the business being reinsured (including broker commissions, premium taxes, assessments and miscellaneous administrative expenses) and may also include a profit sharing arrangement. Under quota share arrangements, ceding commission can be adjustable based upon loss experience which potentially reduces earnings volatility under such arrangements.
Excess of loss (or non-proportional) reinsurance indemnifies the reinsured against all or a specified portion of losses on underlying insurance policies in excess of a specified amount, which is called a level, retention or attachment point. Excess of loss business is written in layers and a reinsurer or group of reinsurers accepts a band of coverage up to a specified amount. The total coverage purchased by the cedant is referred to as a program.
Facultative reinsurance (proportional or non-proportional) is the reinsurance of individual risks. The reinsurer separately rates and underwrites each risk rather than assuming all or a portion of a class of risks as in the case of treaty reinsurance.
Diversified Reinsurance
General
Maiden US writes treaties, on a quota share or excess of loss basis, and facultative risks, marketed through third-party intermediaries and on a direct basis. Maiden Bermuda also provides quota share reinsurance support to Maiden US and Maiden LF through intercompany reinsurance arrangements. The net premiums written under the Diversified Reinsurance segment by our operating subsidiaries, after intercompany reinsurance, for the years ended December 31, 2015, 2014 and 2013 were as follows:
For the Year Ended December 31, | 2015 | 2014 | 2013 | ||||||||||||||||||
Net Premiums Written | % of Total | Net Premiums Written | % of Total | Net Premiums Written | % of Total | ||||||||||||||||
($ in Millions) | ($ in Millions) | ($ in Millions) | |||||||||||||||||||
Maiden US | $ | 416.4 | 56.7 | % | $ | 438.7 | 51.6 | % | $ | 387.9 | 50.8 | % | |||||||||
Maiden Bermuda | 312.4 | 42.5 | % | 403.9 | 47.6 | % | 365.7 | 47.9 | % | ||||||||||||
Maiden LF | 6.0 | 0.8 | % | 8.0 | 0.9 | % | 8.1 | 1.1 | % | ||||||||||||
Maiden Specialty | — | — | % | (0.6 | ) | (0.1 | )% | 1.7 | 0.2 | % | |||||||||||
Total | $ | 734.8 | 100.0 | % | $ | 850.0 | 100.0 | % | $ | 763.4 | 100.0 | % | |||||||||
The net premiums written were impacted by the Company entering into a retrocessional quota share agreement with a highly rated global insurer entered into effective January 1, 2015. There was no such retrocessional quota share agreement in force during 2014.
A combination of general market and competitive conditions, along with their underlying financial performance and capital levels including those considered by rating agencies and regulators, often influence reinsurance purchasing decisions of individual ceding companies. Historically, Maiden US has written greater amounts of quota share business than excess of loss business reflecting the needs of its clients. Please refer to Item 7. "Management’s Discussion and Analysis of Financial Condition and Results of Operations" for a discussion on the performance of our Diversified Reinsurance segment, of which Maiden US is the most significant component, for the years ended December 31, 2015, 2014 and 2013.
Maiden US began operating in 1983 through Maiden Re and since its inception, the business has focused on developing a portfolio of assumed reinsurance with an emphasis on relatively predictable reinsurance with low limits of participation on both a treaty and facultative basis. By design, the underwriting portfolio was developed to mitigate volatility and generate stable operating performance. Our underwriting strategy has de-emphasized property catastrophe reinsurance and participations in more volatile U.S. casualty lines such as Directors and Officers ("D&O") and Professional Liability.
Regional and specialty oriented property and casualty treaty reinsurance business represents the bulk of the portfolio, but accident and health and facultative are also important product offerings. In recent years we have added enhanced automation to the facultative platform and have added a turn-key Umbrella Liability product offering for our core regional customers.
We employ sophisticated risk management, disciplined actuarially-based pricing and strong technical underwriting in developing and maintaining these portfolios. We use both proprietary and vendor developed technology systems to administer and manage the portfolio. The business has been carefully developed under the active management of multi-functional underwriting teams with performance accountability.
5
For most U.S. clients, we provide enhanced security in the form of an internally developed dedicated trust agreement for the reinsurance balances payable to that client. We believe this reinsurance security provides us with a sustainable competitive advantage that is both attractive to new clients and improves retention of existing ones. The trust accounts are funded on an individual client basis with cash and other fixed maturity securities. We can actively manage the cash and investments in the trust accounts and the interest earned is ours. The balances are adjusted regularly to correspond to the liabilities owed to the client, including individually computed Incurred But Not Reported ("IBNR") reserves. Our clients can withdraw assets from the trusts under contractually limited circumstances. At December 31, 2015, we had cash and fixed maturity securities totaling $980.0 million in these trusts, which is part of the $3.7 billion restricted assets disclosed in "Notes to Consolidated Financial Statements Note 4. Investments" included under Item 8 "Financial Statements and Supplementary Data" of this Form 10-K.
The business associated with the IIS Acquisition ("IIS business") consists of quota share contracts, which are underwritten and reinsured by Maiden Bermuda, with the exception of business written through Maiden LF, which is underwritten on a primary basis. This business is marketed primarily through Maiden Global’s business development teams who partner with automobile manufacturers and local primary insurers to design and implement point of sale insurance programs which generate revenue for the auto manufacturer and insurance premiums for the primary insurer. Typically the primary insurer agrees to reinsure an agreed upon percentage of the underlying business to Maiden Bermuda as part of the overall arrangement. Maiden Bermuda is generally not obligated to underwrite the original equipment automobile manufacturers' (the "OEM's") programs that Maiden Global designs. Traditionally, security is provided to clients in the form of letters of credit for IIS business, however, for new international clients, Maiden Bermuda provides enhanced security in the form of an internally developed dedicated trust agreement for the reinsurance balances payable to that client. At December 31, 2015, we had cash and fixed maturity securities totaling $29.7 million in these trusts, which is part of the $3.7 billion restricted assets disclosed in "Notes to Consolidated Financial Statements Note 4. Investments" included under Item 8 "Financial Statements and Supplementary Data" of this Form 10-K.
Net premiums written for the IIS business were written in the following countries:
For the Year Ended December 31, | 2015 | 2014 | 2013 | ||||||||||||||||||
Net Premiums Written | % of Total | Net Premiums Written | % of Total | Net Premiums Written | % of Total | ||||||||||||||||
($ in Millions) | ($ in Millions) | ($ in Millions) | |||||||||||||||||||
Germany | $ | 35.0 | 47.2 | % | $ | 46.4 | 40.2 | % | $ | 47.0 | 43.2 | % | |||||||||
United Kingdom | 12.5 | 16.9 | % | 19.7 | 17.1 | % | 15.0 | 13.7 | % | ||||||||||||
Australia | 10.3 | 13.8 | % | 7.6 | 6.6 | % | 7.0 | 6.4 | % | ||||||||||||
Canada | 5.6 | 7.6 | % | 6.4 | 5.6 | % | 5.9 | 5.4 | % | ||||||||||||
Sweden | 3.4 | 4.5 | % | 5.6 | 4.8 | % | 5.5 | 5.0 | % | ||||||||||||
All other | 7.3 | 10.0 | % | 29.7 | 25.7 | % | 28.6 | 26.3 | % | ||||||||||||
Total | $ | 74.1 | 100.0 | % | $ | 115.4 | 100.0 | % | $ | 109.0 | 100.0 | % | |||||||||
The breakdown of IIS business by line of business was as follows:
For the Year Ended December 31, | 2015 | 2014 | 2013 | ||||||||||||||||||
Net Premiums Written | % of Total | Net Premiums Written | % of Total | Net Premiums Written | % of Total | ||||||||||||||||
($ in Millions) | ($ in Millions) | ($ in Millions) | |||||||||||||||||||
Personal Auto | $ | 61.6 | 83.1 | % | $ | 81.4 | 70.6 | % | $ | 71.8 | 65.9 | % | |||||||||
Credit Life | 12.5 | 16.9 | % | 34.0 | 29.4 | % | 37.2 | 34.1 | % | ||||||||||||
Total | $ | 74.1 | 100.0 | % | $ | 115.4 | 100.0 | % | $ | 109.0 | 100.0 | % | |||||||||
We also generate fee income when Maiden Global participates in transactions and collects a fee for designing and facilitating the sale of insurance programs. Our fee income is primarily generated by OVS in Germany and Austria through its point of sale producers in select OEM's dealerships. We seek to expand these fee generating arrangements through the Maiden Global business development teams' contacts with automobile manufacturers globally. For the years ended December 31, 2015, 2014 and 2013, the fee income was earned in the following locations:
6
For the Year Ended December 31, | 2015 | 2014 | 2013 | ||||||||||||||||||
Fee Income | % of Total | Fee Income | % of Total | Fee Income | % of Total | ||||||||||||||||
($ in Millions) | ($ in Millions) | ($ in Millions) | |||||||||||||||||||
Germany | $ | 8.9 | 77.1 | % | $ | 8.8 | 66.0 | % | $ | 9.1 | 64.3 | % | |||||||||
Australia | 0.8 | 7.3 | % | 0.9 | 7.0 | % | 0.1 | 0.4 | % | ||||||||||||
Russia | 0.7 | 5.8 | % | 1.9 | 14.2 | % | 2.8 | 19.9 | % | ||||||||||||
Other | 1.1 | 9.8 | % | 1.8 | 12.8 | % | 2.2 | 15.4 | % | ||||||||||||
Total | $ | 11.5 | 100.0 | % | $ | 13.4 | 100.0 | % | $ | 14.2 | 100.0 | % | |||||||||
Strategy
Maiden Bermuda and Maiden US are specialty reinsurers with an efficient operating platform that target lines of business and types of contracts that are more predictable than the market as a whole, allowing stability of earnings over time. Most business is written as reinsurance which is insurance of other insurance companies. We offer reinsurance on both a quota share and excess of loss basis. Our primary focus is regional and specialty clients who rely on reinsurance for capital support and/or to reduce their risk. The majority of our clients are regional or super-regional insurance companies or specialty insurers. With these customers, we believe it is possible to develop long term relationships which not only survive insurance market cycles, but provide benefits to both reinsurer and customer during turbulent times. We also utilize a partnership concept developed over Maiden Re's thirty two year operating history to develop long-term customer relationships. This concept entails the offer to our clients of our expertise in underwriting, claims, actuarial, marketing and accounting, through tailored services which support their businesses and goals.
In our Diversified Reinsurance segment, we reinsure property and casualty lines of business, but de-emphasize lines of business such as professional liability, which we consider more volatile, and we do not offer traditional catastrophe reinsurance on a stand-alone basis. We occasionally provide limited catastrophe coverage to clients that purchase other reinsurance from us.
We are primarily a lead reinsurer, meaning that we develop our own terms rather than accepting a small share of another reinsurer’s program in a subscription market. We prefer to be the primary, if not sole, reinsurer for our clients. Our pricing and underwriting of this business considers the economics of the individual customer and therefore is less susceptible to large increases and decreases following market cycles. We are able to attract preferred clients because we offer a secure product and an emphasis on client service. By maintaining significant relationships with clients, we are able to develop strong economies of scale and maintain highly competitive operating efficiencies, a critical element of our business strategy.
We believe that our policy of providing our clients security for our reinsurance obligations through collateral trusts gives us a competitive advantage. In the current economic climate, we also believe that reinsurance brokers and insurers, as well as rating agencies, are scrutinizing the credit-worthiness of reinsurers more closely than in the recent past and recognize that our collateral trust product offers a high level of security.
AmTrust Reinsurance
General
AmTrust is our largest client and is a multinational specialty property and casualty insurance holding company with operations in the U.S., Europe and Bermuda. AmTrust’s principal operating subsidiaries are rated "A" (Excellent) with a stable outlook by A.M. Best, which rating is the third highest of 16 rating levels.
Michael Karfunkel, George Karfunkel and Barry Zyskind are our Founding Shareholders. Michael Karfunkel is the non-executive chairman of the board of AmTrust, George Karfunkel is a director of AmTrust, and Barry Zyskind is the president, chief executive officer and director of AmTrust. The Founding Shareholders, including Leah Karfunkel (wife of Michael Karfunkel), own or control approximately 47.9% of the outstanding voting shares of AmTrust.
Through our reinsurance agreements with AmTrust, we reinsure specific lines of business within the following AmTrust business segments:
• | Small commercial business insurance, which includes U.S. workers’ compensation, commercial package and other property and casualty insurance products; |
• | Specialty risk and extended warranty coverage for consumer and commercial goods and custom designed coverages, such as accidental damage plans and payment protection plans offered in connection with the sale of consumer and commercial goods, in the U.S., United Kingdom ("U.K.") and certain other European countries, European Hospital Liability; and |
• | Specialty program which includes package products, general liability, commercial auto liability, excess and surplus lines programs and other specialty commercial property and casualty insurance to a narrowly defined, homogeneous group of small and middle market companies. |
7
Reinsurance Agreement
Under our Reinsurance Agreement with AmTrust’s Bermuda reinsurance subsidiary, AII, effective July 1, 2007, we reinsure 40% of AmTrust’s written premium, net of commissions, in the case of AmTrust’s U.K. subsidiary, and net of reinsurance with unaffiliated reinsurers, relating to all lines of business that existed on the effective date. We also have the option to reinsure additional programs, in addition to the original lines of business entered into by AmTrust since the effective date of the Reinsurance Agreement. As AmTrust has expanded into new lines of business, pursuant to the terms of the Reinsurance Agreement, we have selectively added some of those lines and opted not to participate in others. Consequently our share of AmTrust's overall gross premiums written has declined below 40% over time.
Maiden and AII entered into an agreement to commute certain lines of business as of December 31, 2015. The commuted reserve value of $107 million represents full and final settlement of all liabilities related to this business and as a result of this agreement, this business will be excluded prospectively.
European Hospital Liability Quota Share
On April 1, 2011, as amended on January 1, 2012, Maiden Bermuda entered into the European Hospital Liability Quota Share with AEL and AIUL, respectively, to cover those entities' medical liability business in Europe, in particular, Italy and France. Maiden Bermuda pays a ceding commission of 5.0%. The European Hospital Liability Quota Share has a term of one year and automatically renews for further one year terms thereafter, unless either party notifies the other of its election in writing not to renew not less than four months prior to the end of any such term. Effective January 1, 2012, the Company's maximum limit of liability is 40% of €10 million, previously 40% of €5 million, per original claim for any one original policy.
Risk Management
General
Central to the reinsurance business is the assumption and management of risk. Our risk management discipline therefore focuses on both quantitative and qualitative elements as the means to reduce volatility of shareholder returns through a balanced analysis and assessment of these elements. The quantitative aspect of our risk management practice focuses on understanding and controlling a broad array of risk parameters in order to achieve desired returns. Our business model further mitigates the risk inherent in our business by focusing on lines of business which are less volatile and thus, require less capital to support the exposures generated by those lines of business. The qualitative aspect of our risk management practice focuses on identifying and assessing risks, and taking the necessary steps to reduce or mitigate risks that could threaten the achievement of our business objectives.
We believe that we have developed a strong risk management culture within Maiden through the establishment of various processes and controls which focus on our risk exposures. We are continually reviewing and enhancing these processes and developing additional processes that may be necessary to achieve our business strategies and objectives within our risk management practice.
Our Enterprise Risk Management (“ERM”) Committee monitors and oversees the risk environment and provides direction to mitigate, to an acceptable level, the most significant and material risks that may adversely affect the Company’s ability to achieve its goals. The Committee facilitates a culture of continuous improvement of the Company’s capabilities around managing its strategic risks. The ERM Committee establishes appropriate risk parameters and tolerances, performs risk assessments, continually reviews factors that may impact our organizational risk and develops and implements strategies and action plans to mitigate key risks.
Maiden’s ERM program is designed to achieve the following:
•Establish a process to assess strategies and business decisions on a risk/reward basis;
•Establish a risk governance structure with clearly defined roles and responsibilities;
•Identify and assess all material risks from internal and external sources;
•Manage risks within Maiden’s risk appetite; and
•Effective review and reporting of major loss events.
Specific risk management practices that have been or are being developed to meet our risk management goals include:
•Scenario/stress testing to assess the level of a specific risk and mitigation effects;
•Setting risk tolerances that we use to monitor and limit risk;
•Tracking expected portfolio volatility over time;
8
•Identifying risk mitigation opportunities and implementing them as appropriate;
•Understanding the capital required to support the underwriting portfolio and individual contracts;
•Monitoring and managing exposure by line of business and geographic concentration;
•Monitoring and limiting catastrophe aggregates and concentrations;
•Monitoring and limiting terrorism aggregates and concentrations;
•Monitoring and managing operational risks across the organization;
•Monitoring and managing the Company's exposure to cyber threats; and
•Identifying, monitoring and managing emerging risks as they develop.
Maiden’s ERM framework reflects the ‘three lines of defense’ approach to risk management, which involves risk owners having responsibility for identifying and managing risks, the ERM Committee providing global tools and policies, and internal audit performing independent reviews. The Maiden Board of Directors has overall responsibility for oversight of the ERM program.
Maiden has a strong risk management culture set by the tone at the top, the Chief Executive Officer ("CEO"), which is then established entity wide through various processes and controls which focus on our risk exposures. Maiden continually develops, reviews, and enhances these processes which we believe to be necessary to achieve our business strategies and objectives within our risk management practice.
There is involvement from all Maiden employees and risk owners are required to assist with the identification of risks, creation of appropriate responses to risks, and maintain them within the risk appetite and tolerances that the ERM Committee believes are necessary to achieve our business strategies and objectives.
The ERM Committee focuses primarily on identifying interactions among our primary categories of risk, developing metrics to assess our overall risk appetite, establishing appropriate risk parameters and tolerances, monitoring those tolerances, establishing and determining actions, if deemed necessary, in the event of a tolerance breach, performing ongoing risk assessment and continually reviewing factors that may impact our organizational risk. Maiden’s internal audit department assesses the adequacy and effectiveness of our risk management framework and mitigating controls and coordinates risk-based audits to evaluate and address risk within targeted areas of our business.
This risk governance structure is complemented by our internal audit department. The core functions of this department are 1) assess the adequacy and effectiveness of our internal control systems; 2)coordinates risk-based audits and compliance reviews; and 3) carry out other initiatives to evaluate and address risk within targeted areas of our business. Our ERM is dynamic and constantly evolving to reflect changes to our organizational processes, global economic environment as well as implementing the latest industry standards.
Our management’s internal ERM efforts are overseen by the Company's Audit Committee. This Committee, comprised solely of independent directors, assesses whether management is addressing risk issues in a timely and appropriate manner. Internal controls and ERM can provide a reasonable but not absolute assurance that our control objectives will be met. The possibility of material financial loss remains in spite of our ERM efforts.
Underwriting Risk Management
Internal underwriting controls are established by our underwriting executives who are the Chief Underwriting Officer of Maiden Bermuda, and the President of Maiden US, working in close coordination with our CEO, our Chief Financial Officer ("CFO") and the President of Maiden Bermuda. Underwriting authority is delegated to the managers in each business segment and to underwrite in accordance with prudent practice and an understanding of each underwriter’s capabilities. In accordance with our underwriting guidelines, underwriting authorities are delegated to underwriting teams as well as individual underwriters. Our targeted performance goals and guidelines are regularly reviewed by management to reflect changes in market conditions, interest rates, capital requirements and market-expected returns.
We have a disciplined approach to underwriting and risk management that relies heavily upon the collective underwriting expertise of our management and staff. This expertise is in turn guided by the following underwriting principles:
• | we will underwrite and accept only those risks we know and understand; |
• | we will perform our own independent pricing and risk review on all risks we accept; and |
• | we will accept only those risks that are expected to earn an appropriate risk-adjusted return on capital. |
Before developing a reinsurance proposal, we consider the appropriateness of the client, including the quality of its management, its financial stability and its risk management strategy. In addition, we require each program to include significant information on
9
the nature of the perils to be included and detailed exposure and loss information, including rate changes and changes in underwriting and claims handling guidelines over time. Whenever possible, we conduct an on-site audit of the client’s operations prior to quoting. If the customer and business meets our underwriting criteria, we then develop a proposal which contemplates the prospective client’s needs, that account’s risk/reward profile, as well as our corporate risk objectives. We have fully integrated our internal claims, underwriting and actuarial pricing staff into the underwriting and decision making process. We use in-depth actuarial, claims and exposure analyses to evaluate contracts prior to quoting. We underwrite and accept property and casualty reinsurance business, accident and health reinsurance business and credit life insurance business. In general, we underwrite reinsurance business that historically is lower in volatility and more predictable than other classes of reinsurance business such as catastrophe reinsurance, which we generally avoid. As part of our risk management process, we track exposures that we believe are most likely to deliver excessive accumulations to a particular type of event.
In addition to the above technical and analytical practices, our underwriters use a variety of means, including specific contract terms, to manage our exposure to loss. Specific terms include occurrence limits, adjustable ceding commissions and premiums, aggregate limits, reinstatement provisions and other loss sensitive features. Additionally, our underwriters use appropriate exclusions, terms and conditions to further eliminate or reduce particular risks or exposures that our underwriting teams deem to be outside of the intent of the coverage we are willing to offer.
In limited cases, the risks assumed by us are partially reinsured with other third party reinsurers. Reinsurance ceded varies by segment and line of business based on a number of factors, including market conditions. The benefits of ceding risks include reducing exposure on individual risks and/or enhancing our capital position. Reinsurance ceded does not relieve the Company of its obligations to the policyholders. We remain liable to the extent that any reinsurance company fails to meet its obligations. In the event that one or more of the reinsurers are unable to meet their obligations under these reinsurance agreements, the Company would not realize the full value of the reinsurance recoverable balances.
Maiden’s risk appetite and tolerances have been formally approved by our Audit Committee. Our Audit Committee also reviews the Group Solvency Self-Assessment ("GSSA") which is required to be filed with the Bermuda Monetary Authority ("BMA") and used to understand current and prospective risks and the associated capital requirements. The GSSA is an integral part of our risk management framework and reflects our risk tolerance and overall business strategy. The GSSA documents our internal self-assessment of capital which is determined using our internal model. Our internal model quantifies the level of capital needed to meet our liabilities within our specified confidence level. The major risks are insurance related - both premium risk and reserve risk, reflecting the possibility that our pricing may be too low and/or our reserving levels may not be sufficient.
Catastrophe Risk Management
While we generally avoid catastrophe exposed reinsurance risks, certain risks we reinsure are exposed to catastrophic loss events. Our tolerance is that our modeled one-in-250 year catastrophe occurrence loss must be less than 50% of our operating income and our aggregate loss must be less than 75% of our operating income. At December 31, 2015, our one-in-250 year catastrophe exposure on a per occurrence and aggregate basis is $36.4 million and $77.8 million, respectively, within these stated tolerances.
To achieve our catastrophe risk management objectives, we utilize commercially available modeling tools to quantify and monitor the various risks we accept. We have licensed catastrophe modeling software from one of the principal modeling firms, Applied Insurance Research ("AIR"). These software tools use exposure data provided by our ceding company clients to simulate catastrophic losses. We take an active role in the evaluation of these commercial catastrophe models, providing feedback to AIR to improve the efficiencies and accuracy of their models. We use modeling not only for the underwriting of individual transactions but also to optimize the total return and risk of our underwriting portfolio. We have high standards for the quality and levels of detailed exposure data provided by our clients and have an expressed preference for the most detailed location information available, including data at the zip code or postal code level or finer. Data output from the software described above is incorporated into our proprietary pricing models. Our proprietary systems include those for modeling risks associated with property catastrophe, property and U.S. workers’ compensation business, various casualty and specialty pricing models. These systems allow us to monitor our pricing and risk on a contract by contract basis in each of our segments and business lines.
Retrocessions
We use retrocessional agreements to mitigate volatility and to reduce our exposure on certain specialty reinsurance risks and to provide capital support. We remain liable to our cedants to the extent that the retrocessionaires do not meet their obligations under retrocessional agreements, so we retain credit risk in all cases and to aggregate loss limits in certain cases. We maintain a credit risk review process that identifies authorized acceptable reinsurers and retrocessionaires and have no impaired balances. At December 31, 2015, we had approximately $71.2 million of reinsurance recoverable under such agreements, of which $35.0 million or 49.2% relates to reinsurance claims from Superstorm Sandy.
Competition
The reinsurance industry is mature and highly competitive. Reinsurance companies compete on the basis of many factors, including premium rates, company and underwriter relationships, general reputation and perceived financial strength, the terms and conditions of the products offered, ratings assigned by independent rating agencies, speed of claims payments, reputation and experience in risks underwritten, capacity and coverages offered and various other factors. These factors operate at the individual market participant level and generally in the aggregate across the reinsurance industry. In addition, underlying economic conditions
10
and variations in the reinsurance buying practices of ceding companies, by participant and in the aggregate, contribute to cyclical movements in rates, terms and conditions and may impact industry aggregate results and subsequently the level of completion in the reinsurance industry.
Both Maiden US and Maiden Bermuda compete with a wide variety of major reinsurers including those based in Bermuda. In our Diversified Reinsurance segment, we compete with reinsurers that provide property and casualty-based lines of reinsurance such as: General Reinsurance Corporation, Hannover Re Group, Munich Reinsurance America, Inc., PartnerRe Ltd., Swiss Reinsurance Company Ltd., and Transatlantic Reinsurance Company.
Many of these entities have significantly more capital, higher ratings from rating agencies and more employees than we do; in addition, these entities have established long-term and continuing business relationships throughout the industry, which can be significant competitive advantages. However, we believe the enhanced security that we offer our clients through collateral trusts, our niche specialist orientation, our operating efficiency and our careful relationship management capabilities help offset these advantages and allow us to effectively compete for profitable business.
In addition, in recent years, significant increases in the use of risk-linked securities and derivative and other non-traditional risk transfer mechanisms and vehicles are being developed and offered by other parties, including entities other than insurance and reinsurance companies. The availability of both these non-traditional products and sources of capital could reduce the demand for traditional insurance and reinsurance.
A number of new, proposed or potential industry or legislative developments could also further increase competition in our industry. New competition from these developments may result in fewer contracts written, lower premium rates, increased expenses for customer acquisition and retention and less favorable policy terms and conditions, which could have a material adverse impact on our growth and profitability.
More recently, January 1, 2016 reinsurance renewals show competitive pricing conditions. While these conditions have been most pronounced in severity related placements, particularly in property catastrophe contracts which are more acutely feeling the impact of capital inflows, we also see an elevated level of competition in our higher frequency/lower severity business as well. While the business we write as part of our business model is somewhat more insulated from these competitive conditions, we are experiencing some pricing pressures as a result of broader industry conditions.
As market conditions continue to develop, we continue to maintain our adherence to disciplined underwriting by declining business when pricing terms and conditions do not meet our underwriting standards. We believe that we are well positioned to take advantage of market conditions should the pricing environment become more favorable.
Our Financial Strength Ratings
Ratings are an important factor in establishing the competitive position of insurance and reinsurance companies and are important to our ability to market and sell our products. We believe that the primary users of such ratings include brokers, ceding companies and investors. Periodically, rating agencies evaluate us to confirm that we continue to meet their criteria for the ratings assigned to us by them.
A.M. Best and S&P have each developed a rating system to provide an opinion of an insurer’s or reinsurer’s financial strength and ability to meet ongoing obligations to its policyholders. Each rating reflects that rating agency’s independent opinion of the capitalization, management and sponsorship of the entity to which it relates, and is neither an evaluation directed to investors in our common shares nor a recommendation to buy, sell or hold our common shares. A.M. Best maintains a letter scale rating system ranging from "A++" (Superior) to "F" (In Liquidation). S&P maintains a letter scale rating system ranging from "AAA" (Extremely Strong) to "R" (Under Regulatory Supervision).
Our subsidiaries, Maiden Bermuda and Maiden US, each currently has a financial strength rating of "A-" (Excellent, the fourth highest out of sixteen rating levels) with a positive outlook from A.M. Best, and "BBB+" (Good, the eighth highest out of twenty-two rating levels) with a stable outlook from S&P.
Distribution of Our Reinsurance Products
We market our Diversified Reinsurance segment through third party intermediaries, as well as directly through our own marketing efforts. Our direct marketing activities are generally focused on insurers with a demonstrated preference and propensity to utilize direct distribution reinsurers. We believe this combination affords us flexibility and efficiency.
In the years ended December 31, 2015, 2014 and 2013, the sources of gross premiums written in our Diversified Reinsurance segment were as follows:
11
% of Gross Premiums Written for the Year Ended December 31, | 2015 | 2014 | 2013 | ||||||
Brokers | 54.6 | % | 57.1 | % | 57.7 | % | |||
Direct | 45.4 | % | 42.9 | % | 42.3 | % | |||
Total | 100.0 | % | 100.0 | % | 100.0 | % | |||
In the years ended December 31, 2015, 2014 and 2013, our top three brokers represented approximately 36.9%, 31.6% and 29.9%, respectively, of gross premiums written in our Diversified Reinsurance segment. A further breakdown of the gross premiums written by our Diversified Reinsurance segment by broker for December 31, 2015, 2014 and 2013 were as follows:
% of Gross Premiums Written for the Year Ended December 31, | 2015 | 2014 | 2013 | ||||||
Broker | |||||||||
Aon Benfield Inc. | 17.3 | % | 15.8 | % | 11.9 | % | |||
Marsh & McLennan Companies (including Guy Carpenter) | 12.2 | % | 12.0 | % | 12.6 | % | |||
U.S. RE Corporation | 7.4 | % | 1.4 | % | 1.0 | % | |||
Risk & Insurance Services Consulting, LLC | 4.6 | % | 2.7 | % | 3.2 | % | |||
All Other Brokers | 13.1 | % | 25.2 | % | 29.0 | % | |||
Total Broker | 54.6 | % | 57.1 | % | 57.7 | % | |||
Direct | 45.4 | % | 42.9 | % | 42.3 | % | |||
Total | 100.0 | % | 100.0 | % | 100.0 | % | |||
Reserve for Loss and Loss Adjustment Expenses
General
We are required by applicable insurance laws and regulations in Bermuda, the U.S., Sweden and by U.S. GAAP to establish loss reserves to cover our estimated liability for the payment of all loss and loss adjustment expenses ("LAE") incurred with respect to premiums earned on the policies and treaties that we write. These reserves are balance sheet liabilities representing estimates of loss and LAE which we are ultimately required to pay for insured or reinsured claims that have occurred as of or before the balance sheet date. It is our policy to establish these losses and LAE reserves using prudent actuarial methods after reviewing all information known to us at the date they are recorded.
These amounts include case reserves and provisions for IBNR reserves. Case reserves are established for losses that have been reported to us, and not yet paid. IBNR reserves represent the estimated cost of losses that have occurred but have not been reported to us and include a provision for additional development on case reserves. We establish case reserves based on information from the ceding company, reinsurance intermediaries, and when appropriate, consultations with independent legal counsel. The IBNR reserves are established by management based on reported losses and LAE and actuarially determined estimates of ultimate loss and LAE.
A variety of standard actuarial methods are calculated to estimate ultimate loss and LAE. The majority of our business is reserved individually by cedant and line of business, with the remainder reserved in homogeneous groupings. Ultimate loss selections are accumulated across the reserve segments, and appropriate actuarial judgment is applied to determine the final selection of estimated ultimate losses. Ultimate losses are converted to IBNR reserves by subtracting inception to date paid losses and case reserves from those amounts. The combined total of case and IBNR results in indicated reserves which are the basis for the carried reserves for financial statements. Ultimate losses are also used to estimate premium and commission accruals for accounts with adjustable features.
Loss reserves do not represent an exact calculation of liability; rather, loss reserves are estimates of what we expect the ultimate resolution and administration of claims will cost. These estimates are based on actuarial and statistical projections and on our assessment of currently available data, as well as estimates of trends in claims severity and frequency, judicial theories of liability and other factors. Loss reserve estimates are refined as experience develops and as claims are reported and resolved. Establishing an appropriate level of loss reserves is an inherently uncertain process. In addition, the relatively long reporting periods between when a loss occurs and when it may be reported to our claims department for our casualty lines of business also increase the uncertainties of our reserve estimates in such lines. To assist us in establishing appropriate reserves for loss and LAE, we analyze a significant amount of internal data and external insurance industry information with respect to the pricing environment and loss settlement patterns. In combination with our individual account pricing analyses and our internal loss settlement patterns, this industry information is used to guide our loss and LAE estimates. These estimates are reviewed quarterly, at a high level of detail, and any adjustments are reflected in earnings in the periods in which they are determined.
12
Analysis of Consolidated Loss Reserves Development
The following table shows the development of gross and net reserves for unpaid loss and LAE for our business for calendar years 2013 through 2015. The table does not present accident or policy year development data. The table begins by showing the initial reported year-end gross and net reserves, including IBNR reserves, recorded at the balance sheet date for each of the three years presented.
For the Year Ended December 31, | 2015 | 2014 | 2013 | |||||||||
($ in Millions) | ||||||||||||
Gross unpaid loss and LAE reserves - January 1 | $ | 2,271.3 | $ | 1,957.8 | $ | 1,740.3 | ||||||
Less: reinsurance recoverable - January 1 | 75.9 | 84.0 | 110.9 | |||||||||
Net loss and LAE reserves - January 1 | 2,195.4 | 1,873.8 | 1,629.4 | |||||||||
Net incurred losses related to: | ||||||||||||
Current year | 1,558.7 | 1,479.4 | 1,351.0 | |||||||||
Prior years | 74.9 | 18.8 | (1.4 | ) | ||||||||
1,633.6 | 1,498.2 | 1,349.6 | ||||||||||
Net paid losses related to: | ||||||||||||
Current year | (457.5 | ) | (430.4 | ) | (517.6 | ) | ||||||
Prior years | (892.9 | ) | (705.4 | ) | (598.5 | ) | ||||||
(1,350.4 | ) | (1,135.8 | ) | (1,116.1 | ) | |||||||
Effect of foreign exchange movement | (39.7 | ) | (40.8 | ) | 10.9 | |||||||
Net loss and LAE reserves - December 31 | 2,438.9 | 2,195.4 | 1,873.8 | |||||||||
Reinsurance recoverable - December 31 | 71.2 | 75.9 | 84.0 | |||||||||
Gross unpaid loss and LAE reserves - December 31 | $ | 2,510.1 | $ | 2,271.3 | $ | 1,957.8 | ||||||
During 2015, the Company recorded estimated net adverse development, primarily from U.S. commercial auto business, on prior year loss reserves of $74.9 million or 3.3% of prior year net loss and LAE reserves compared to net unfavorable development $18.8 million or 1.0% in 2014 and net favorable development of $1.4 million or 0.1% in 2013.
Due to loss sensitive features of certain contracts, favorable (or unfavorable) loss reserve development does not necessarily result in a commensurate amount of additional (or reduced) underwriting income as ceding commission may be adjusted proportionally to the amount of loss development, pursuant to the terms of the individual contracts.
Analysis of Gross and Net Unpaid Losses and Loss Adjustment Expenses and Net Re-estimated Liability
The tables below show the re-estimated amount of the initial reported gross and net reserves for up to seven subsequent years, based on experience at the end of each subsequent year. The re-estimated gross and net liabilities reflect additional information, received from cedants or obtained through reviews of industry trends, regarding claims incurred prior to the end of the preceding financial year. A (redundancy) or deficiency arises when the re-estimation of reserves is (lower) or greater than its estimation at the preceding year-end. The cumulative redundancies (or deficiencies) reflect cumulative differences between the initial reported net reserves and the currently re-estimated net reserves. Annual changes in the estimates are reflected in the income statement for each year as the liabilities are re-estimated.
The lower section of the tables shows the portion of the initial year-end net reserves that was paid as of the end of subsequent years. This section of the tables provides an indication of the portion of the re-estimated gross and net liability that is settled and is unlikely to develop in the future.
13
Development of Reserve for Loss and LAE - Gross
For the Year Ended December 31, | 2007 | 2008(1) | 2009 | 2010(1) | 2011 | 2012 | 2013 | 2014 | 2015 | |||||||||||||||||||||||||||
Gross | ($ in Millions) | |||||||||||||||||||||||||||||||||||
As originally estimated | $ | 38.5 | $ | 897.7 | $ | 1,002.7 | $ | 1,226.8 | $ | 1,398.4 | $ | 1,740.3 | $ | 1,957.8 | $ | 2,271.3 | $ | 2,510.1 | ||||||||||||||||||
Liability re-estimated: | ||||||||||||||||||||||||||||||||||||
One Year later | $ | 36.7 | $ | 886.3 | $ | 963.1 | $ | 1,238.9 | $ | 1,426.5 | $ | 1,750.0 | $ | 1,944.6 | $ | 2,326.0 | ||||||||||||||||||||
Two Years later | 37.3 | 869.8 | 972.1 | 1,247.3 | 1,424.9 | 1,812.2 | 2,001.8 | |||||||||||||||||||||||||||||
Three Years later | 37.9 | 852.9 | 975.9 | 1,242.0 | 1,454.3 | 1,846.0 | ||||||||||||||||||||||||||||||
Four Years later | 41.3 | 842.6 | 975.1 | 1,255.5 | 1,479.7 | |||||||||||||||||||||||||||||||
Five Years later | 40.5 | 838.5 | 985.0 | 1,272.9 | ||||||||||||||||||||||||||||||||
Six Years later | 40.5 | 842.7 | 992.4 | |||||||||||||||||||||||||||||||||
Seven Years later | 44.0 | 847.1 | ||||||||||||||||||||||||||||||||||
Eight Years later | 45.3 | |||||||||||||||||||||||||||||||||||
Cumulative deficiency (redundancy) | $ | 6.8 | $ | (50.6 | ) | $ | (10.3 | ) | $ | 46.1 | $ | 81.3 | $ | 105.7 | $ | 44.0 | $ | 54.7 | ||||||||||||||||||
Less: Cumulative deficiency (redundancy) due to foreign exchange | — | — | — | (7.3 | ) | (5.4 | ) | (14.8 | ) | (45.5 | ) | (25.4 | ) | |||||||||||||||||||||||
Cumulative deficiency (redundancy) excluding the impact of foreign exchange | $ | 6.8 | $ | (50.6 | ) | $ | (10.3 | ) | $ | 53.4 | $ | 86.7 | $ | 120.5 | $ | 89.5 | $ | 80.1 | ||||||||||||||||||
Cumulative claims paid: | ||||||||||||||||||||||||||||||||||||
One Year later | $ | 16.6 | $ | 303.2 | $ | 266.0 | $ | 452.7 | $ | 592.8 | $ | 672.8 | $ | 712.9 | $ | 883.4 | ||||||||||||||||||||
Two Years later | 33.7 | 402.4 | 457.8 | 746.1 | 914.7 | 1,127.2 | 1,074.8 | |||||||||||||||||||||||||||||
Three Years later | 34.1 | 542.2 | 607.0 | 940.7 | 1,146.7 | 1,325.5 | ||||||||||||||||||||||||||||||
Four Years later | 37.6 | 665.0 | 703.4 | 1,066.3 | 1,272.9 | |||||||||||||||||||||||||||||||
Five Years later | 38.0 | 725.2 | 753.6 | 1,152.7 | ||||||||||||||||||||||||||||||||
Six Years later | 40.2 | 764.9 | 805.1 | |||||||||||||||||||||||||||||||||
Seven Years later | 42.8 | 797.0 | ||||||||||||||||||||||||||||||||||
Eight Years later | 45.2 | |||||||||||||||||||||||||||||||||||
Liability re-estimated: | ||||||||||||||||||||||||||||||||||||
One Year later | 95.4 | % | 98.7 | % | 96.0 | % | 101.0 | % | 102.0 | % | 100.6 | % | 99.3 | % | 102.4 | % | ||||||||||||||||||||
Two Years later | 96.8 | % | 96.9 | % | 96.9 | % | 101.7 | % | 101.9 | % | 104.1 | % | 102.2 | % | ||||||||||||||||||||||
Three Years later | 98.5 | % | 95.0 | % | 97.3 | % | 101.2 | % | 104.0 | % | 106.1 | % | ||||||||||||||||||||||||
Four Years later | 107.2 | % | 93.9 | % | 97.2 | % | 102.3 | % | 105.8 | % | ||||||||||||||||||||||||||
Five Years later | 105.3 | % | 93.4 | % | 98.2 | % | 103.8 | % | ||||||||||||||||||||||||||||
Six Years later | 105.2 | % | 93.9 | % | 99.0 | % | ||||||||||||||||||||||||||||||
Seven Years later | 114.3 | % | 94.4 | % | ||||||||||||||||||||||||||||||||
Eight Years later | 117.7 | % | ||||||||||||||||||||||||||||||||||
Cumulative deficiency (redundancy) | 17.7 | % | (5.6 | )% | (1.0 | )% | 3.8 | % | 5.8 | % | 6.1 | % | 2.2 | % | 2.4 | % | ||||||||||||||||||||
Less: Cumulative deficiency (redundancy) due to foreign exchange | — | % | — | % | — | % | (0.6 | )% | (0.4 | )% | (0.9 | )% | (2.3 | )% | (1.1 | )% | ||||||||||||||||||||
Cumulative deficiency (redundancy) excluding the impact of foreign exchange | 17.7 | % | (5.6 | )% | (1.0 | )% | 4.4 | % | 6.2 | % | 7.0 | % | 4.5 | % | 3.5 | % | ||||||||||||||||||||
Gross loss and LAE cumulative paid as a percentage of originally estimated liability | ||||||||||||||||||||||||||||||||||||
One Year later | 43.1 | % | 33.8 | % | 26.5 | % | 36.9 | % | 42.4 | % | 38.7 | % | 36.4 | % | 38.9 | % | ||||||||||||||||||||
Two Years later | 87.6 | % | 44.8 | % | 45.7 | % | 60.8 | % | 65.4 | % | 64.8 | % | 54.9 | % | ||||||||||||||||||||||
Three Years later | 88.6 | % | 60.4 | % | 60.5 | % | 76.7 | % | 82.0 | % | 76.2 | % | ||||||||||||||||||||||||
Four Years later | 97.7 | % | 74.1 | % | 70.2 | % | 86.9 | % | 91.0 | % | ||||||||||||||||||||||||||
Five Years later | 98.8 | % | 80.8 | % | 75.2 | % | 94.0 | % | ||||||||||||||||||||||||||||
Six Years later | 104.4 | % | 85.2 | % | 80.3 | % | ||||||||||||||||||||||||||||||
Seven Years later | 111.2 | % | 88.8 | % | ||||||||||||||||||||||||||||||||
Eight Years later | 117.4 | % | ||||||||||||||||||||||||||||||||||
14
Development of Reserve for Loss and LAE - Net
For the Year Ended December 31, | 2007 | 2008(1) | 2009 | 2010(1) | 2011 | 2012 | 2013 | 2014 | 2015 | |||||||||||||||||||||||||||
Net of reinsurance | ($ in Millions) | |||||||||||||||||||||||||||||||||||
As Originally Estimated | $ | 38.5 | $ | 897.7 | $ | 994.3 | $ | 1,220.1 | $ | 1,378.1 | $ | 1,629.4 | $ | 1,873.8 | $ | 2,195.4 | $ | 2,438.9 | ||||||||||||||||||
Liability Re-estimated: | ||||||||||||||||||||||||||||||||||||
One Year later | $ | 36.7 | $ | 886.3 | $ | 961.4 | $ | 1,233.3 | $ | 1,403.1 | $ | 1,635.0 | $ | 1,862.8 | $ | 2,245.1 | ||||||||||||||||||||
Two Years later | 37.3 | 869.8 | 969.5 | 1,230.6 | 1,383.7 | 1,697.9 | 1,909.1 | |||||||||||||||||||||||||||||
Three Years later | 37.9 | 852.9 | 967.8 | 1,220.9 | 1,424.9 | 1,733.6 | ||||||||||||||||||||||||||||||
Four Years later | 41.3 | 842.6 | 965.3 | 1,234.2 | 1,442.7 | |||||||||||||||||||||||||||||||
Five Years later | 40.7 | 838.5 | 975.0 | 1,246.7 | ||||||||||||||||||||||||||||||||
Six Years later | 40.5 | 842.7 | 982.4 | |||||||||||||||||||||||||||||||||
Seven Years later | 44.0 | 847.1 | ||||||||||||||||||||||||||||||||||
Eight Years later | 45.3 | |||||||||||||||||||||||||||||||||||
Cumulative net deficiency (redundancy) | $ | 6.8 | $ | (50.6 | ) | $ | (11.9 | ) | $ | 26.6 | $ | 64.6 | $ | 104.2 | $ | 35.3 | $ | 49.7 | ||||||||||||||||||
Less: Cumulative net deficiency (redundancy) due to foreign exchange | — | — | — | (7.0 | ) | (5.4 | ) | (14.9 | ) | (44.8 | ) | (25.2 | ) | |||||||||||||||||||||||
Cumulative net deficiency (redundancy) excluding the impact of foreign exchange | $ | 6.8 | $ | (50.6 | ) | $ | (11.9 | ) | $ | 33.6 | $ | 70.0 | $ | 119.1 | $ | 80.1 | $ | 74.9 | ||||||||||||||||||
Cumulative claims paid: | ||||||||||||||||||||||||||||||||||||
One Year later | $ | 16.6 | $ | 303.2 | $ | 266.0 | $ | 423.9 | $ | 530.3 | $ | 598.5 | $ | 669.1 | $ | 865.1 | ||||||||||||||||||||
Two Years later | 33.7 | 402.4 | 444.3 | 682.9 | 827.1 | 1,020.7 | 1,004.9 | |||||||||||||||||||||||||||||
Three Years later | 34.1 | 542.2 | 575.1 | 901.8 | 1,072.5 | 1,213.8 | ||||||||||||||||||||||||||||||
Four Years later | 37.6 | 665.0 | 662.5 | 978.0 | 1,165.0 | |||||||||||||||||||||||||||||||
Five Years later | 38.0 | 725.2 | 710.9 | 1,062.3 | ||||||||||||||||||||||||||||||||
Six Years later | 40.2 | 764.9 | 761.8 | |||||||||||||||||||||||||||||||||
Seven Years later | 42.8 | 797.0 | ||||||||||||||||||||||||||||||||||
Eight Years later | 45.2 | |||||||||||||||||||||||||||||||||||
Liability Re-estimated: | ||||||||||||||||||||||||||||||||||||
One Year later | 95.4 | % | 98.7 | % | 96.7 | % | 101.1 | % | 101.8 | % | 100.3 | % | 99.4 | % | 102.3 | % | ||||||||||||||||||||
Two Years later | 96.8 | % | 96.9 | % | 97.5 | % | 100.9 | % | 100.4 | % | 104.2 | % | 101.9 | % | ||||||||||||||||||||||
Three Years later | 98.5 | % | 95.0 | % | 97.3 | % | 100.1 | % | 103.4 | % | 106.4 | % | ||||||||||||||||||||||||
Four Years later | 107.2 | % | 93.9 | % | 97.1 | % | 101.2 | % | 104.7 | % | ||||||||||||||||||||||||||
Five Years later | 105.8 | % | 93.4 | % | 98.1 | % | 102.2 | % | ||||||||||||||||||||||||||||
Six Years later | 105.2 | % | 93.9 | % | 98.8 | % | ||||||||||||||||||||||||||||||
Seven Years later | 114.3 | % | 94.4 | % | ||||||||||||||||||||||||||||||||
Eight Years later | 117.7 | % | ||||||||||||||||||||||||||||||||||
Cumulative net deficiency (redundancy) | 17.7 | % | (5.6 | )% | (1.2 | )% | 2.2 | % | 4.7 | % | 6.4 | % | 1.9 | % | 2.3 | % | ||||||||||||||||||||
Less: Cumulative net deficiency (redundancy) due to foreign exchange | — | % | — | % | — | % | (0.6 | )% | (0.4 | )% | (0.9 | )% | (2.4 | )% | (1.1 | )% | ||||||||||||||||||||
Cumulative net deficiency (redundancy) excluding the impact of foreign exchange | 17.7 | % | (5.6 | )% | (1.2 | )% | 2.8 | % | 5.1 | % | 7.3 | % | 4.3 | % | 3.4 | % | ||||||||||||||||||||
Net loss and LAE cumulative paid as a percentage of originally estimated liability | ||||||||||||||||||||||||||||||||||||
One Year later | 43.1 | % | 33.8 | % | 26.7 | % | 34.7 | % | 38.5 | % | 36.7 | % | 35.7 | % | 39.4 | % | ||||||||||||||||||||
Two Years later | 87.6 | % | 44.8 | % | 44.7 | % | 56.0 | % | 60.0 | % | 62.6 | % | 53.6 | % | ||||||||||||||||||||||
Three Years later | 88.6 | % | 60.4 | % | 57.8 | % | 73.9 | % | 77.8 | % | 74.5 | % | ||||||||||||||||||||||||
Four Years later | 97.7 | % | 74.1 | % | 66.6 | % | 80.2 | % | 84.5 | % | ||||||||||||||||||||||||||
Five Years later | 98.8 | % | 80.8 | % | 71.5 | % | 87.1 | % | ||||||||||||||||||||||||||||
Six Years later | 104.4 | % | 85.2 | % | 76.6 | % | ||||||||||||||||||||||||||||||
Seven Years later | 111.2 | % | 88.8 | % | ||||||||||||||||||||||||||||||||
Eight Years later | 117.4 | % | ||||||||||||||||||||||||||||||||||
15
(1) | Reserve for loss and LAE include the reserves for loss and LAE of $755.6 million, from the GMAC Acquisition, which were acquired in October 2008 and $98.8 million from the IIS Acquisition, which were acquired in November 2010. |
For additional information concerning our reserves, see Item 7,"Management’s Discussion and Analysis of Financial Condition and Results of Operations — Critical Accounting Policies — Reserve for Losses and Loss Adjustment Expense" for further information regarding the specific actuarial models we utilize and the uncertainties in establishing the reserve for loss and LAE.
Our Employees
As of December 31, 2015, we had a total of 204 full-time employees who are located in Bermuda, the U.S., the U.K., Germany, Austria, Russia, Netherlands, Ireland and Australia. We may increase our staff over time commensurate with the expansion of operations. We believe that our employee relations are good. None of our employees are subject to collective bargaining agreements.
Regulatory Matters
General
The insurance and reinsurance industry are subject to regulatory and legislative oversight and regulation in various markets we operate in.
Bermuda Insurance Regulation
Maiden Bermuda is regulated as a registered Class 3B general business insurer under the Insurance Act 1978 of Bermuda, as amended, and related regulations (together, the "Insurance Act"), which regulates the insurance business of Bermuda registered insurers and provides that no person shall carry on any insurance business in or from within Bermuda unless that person has been registered under the Insurance Act by the BMA. The BMA is responsible for the day-to-day supervision of insurers and insurance groups in respect of which it is the group supervisor. Under the Insurance Act, insurance business includes reinsurance business. The registration of an applicant as an insurer is subject to its complying with the terms of its registration and such other conditions as the BMA may impose from time to time.
The Insurance Act imposes solvency and liquidity standards as well as auditing and reporting requirements on Bermuda insurance companies and grants to the BMA powers to supervise, investigate and intervene in the affairs of insurance companies. The Insurance Act also imposes certain regulatory requirements on insurance groups where the BMA has determined that it should act as group supervisor. Certain significant aspects of the Bermuda insurance regulatory framework are set forth below.
• | Cancellation of Insurer's Registration: An insurer's registration may be canceled by the BMA on certain grounds specified in the Insurance Act, including failure of the insurer to comply with its obligations under the Insurance Act or if, in the opinion of the BMA, the insurer has not been carrying on business in accordance with sound insurance principles. We believe that we are in compliance with applicable regulations under the Insurance Act. |
• | Principal Office and Principal Representative: An insurer is required to maintain a principal office in Bermuda and to appoint and maintain a principal representative in Bermuda. It is the duty of the principal representative, upon reaching the view that there is a likelihood of the insurer for which the principal representative acts becoming insolvent, to the principal representative's knowledge, occurred or is believed to have occurred, to immediately notify the BMA and to make a report in writing to the BMA within 14 days of the prior notification setting out all the particulars of the case that are available to the principal representative. |
• | Annual Financial Statements, Annual Statutory Financial Return and Annual Capital and Solvency Return: Maiden Bermuda must prepare annual statutory financial statements as prescribed in the Insurance Act with respect to its general business. The statutory financial return for a Class 3B insurer includes, among other things, a report of the approved independent auditor on the statutory financial statement of such insurer, declaration of the statutory ratios, solvency certificates, the statutory financial statements for the general business, the opinion of the loss reserve specialist, a schedule of reinsurance ceded and a statutory declaration in the matter of the Insurance Code of Conduct as described below. Maiden Bermuda is also required to file audited U.S. GAAP annual financial statements, which must be available to the public. In addition, Maiden Bermuda is required to file a capital and solvency return, which shall include the company's Bermuda Solvency Capital Requirement ("BSCR") model (described below), a commercial insurer's solvency self-assessment ("CISSA"), a catastrophe risk return and a schedule of loss triangles or reconciliation of net loss reserves and a schedule of eligible capital. |
• | Minimum Liquidity Ratio: The Insurance Act requires all general business insurers to maintain the value of its relevant assets at not less than 75% of the amount of its relevant liabilities. Relevant assets include cash and time deposits, quoted investments, unquoted bonds and debentures, first liens on real estate, investment income due and accrued, accounts and premiums receivable, reinsurance balances receivable and funds held by ceding reinsurers. There are certain categories of assets which, unless specifically permitted by the BMA, do not automatically qualify as relevant assets, such as unquoted equity securities, investments in and advances to affiliates and real estate and collateral loans. The relevant liabilities are total general business insurance reserves and total other liabilities less deferred income tax and sundry liabilities (by interpretation, those not specifically defined) and letters of credit and guarantees. |
16
• | Minimum Solvency Margin, Enhanced Capital Requirement and Restrictions on Dividends and Distributions: Under the Insurance Act, Maiden Bermuda must ensure that the value of its general business assets exceeds the amount of its general business liabilities by an amount greater than its prescribed minimum solvency margin ("MSM"). Maiden Bermuda is also required to maintain available statutory capital and surplus at least equal to its enhanced capital requirement ("ECR"). Maiden Bermuda is prohibited from declaring or paying dividends of more than 25% of its total statutory capital and surplus, as shown in its previous financial year statutory balance sheet, unless at least seven days before payment of the dividends it files with the BMA an affidavit that it will continue to meet its minimum capital requirements as described above. In addition, Maiden Bermuda must obtain the BMA’s prior approval before reducing its total statutory capital, as shown in its previous financial year statutory balance sheet, by 15% or more. |
• | Fit and Proper Controllers: The BMA maintains supervision over the controllers of all registered insurers in Bermuda. A controller includes (i) the managing director of the registered insurer or its parent company; (ii) the chief executive of the registered insurer or of its parent company; (iii) a shareholder controller; and (iv) any person in accordance with whose directions or instructions the directors of the registered insurer or of its parent company are accustomed to act. |
• | Notification by Registered Person of Change of Controllers and Officers: All registered insurers are required to give written notice to the BMA of the fact that a person has become, or ceased to be, a controller or officer of the registered insurer within 45 days of becoming aware of such fact. An officer in relation to a registered insurer means a director, chief executive or senior executive performing duties of underwriting, actuarial, risk management, compliance, internal audit, finance or investment matters. |
• | Notification of Material Changes: All registered insurers are required to give 14 days’ notice to the BMA of certain matters that are likely to be of material significance (a “Material Change” within the meaning of the Insurance Act). |
• | Code of Conduct: Maiden Bermuda is required to comply with the Insurance Code of Conduct of the Authority ("Code") which prescribes the duties and standards which must be complied with to ensure it implements sound corporate governance, risk management and internal controls. Failure to comply with the requirements under the Code will be a factor taken into account by the BMA in determining whether an insurer is conducting its business in a sound and prudent manner as prescribed by the Insurance Act. Such failure to comply with the requirements of the Code could result in the BMA exercising its powers of intervention (see BMA's Powers of Intervention, Obtaining Information, Reports and Documents and Providing Information to other Regulatory Authorities below). We believe that we are in compliance with the Code. |
• | Group Supervision: The BMA acts as group supervisor of the Company and has designated Maiden Bermuda to be the designated insurer. As group supervisor, the BMA will perform a number of supervisory functions including (i) coordinating the gathering and dissemination of information which is of importance for the supervisory task of other competent authorities; (ii) carrying out a supervisory review and assessment of the insurance group; (iii) carrying out an assessment of the insurance group's compliance with the rules on solvency, risk concentration, intra-group transactions and good governance procedures; (iv) planning and coordinating, through regular meetings with other competent authorities, supervisory activities in respect of the insurance group, both as a going concern and in emergency situations; (v) coordinating any enforcement action that may need to be taken against the insurance group or any of its members; and (vi) planning and coordinating meetings of colleges of supervisors in order to facilitate the carrying out of the functions described above. In carrying out its group supervisory functions, the BMA may make rules for (i) assessing the financial situation and the solvency position of the insurance group and/or its members and (ii) regulating intra‑group transactions, risk concentration, governance procedures, risk management and regulatory reporting and disclosure. |
• | Group MSM and Group ECR: The Designated Insurer must ensure that the value of the insurance group's assets exceeds the amount of the group's liabilities by the aggregate minimum margin of solvency of each qualifying member of the group ("Group MSM"). A member is a qualifying member of the insurance group if it is subject to solvency requirements in the jurisdiction in which it is registered. Beginning on December 31, 2013, we are required to maintain available group capital and surplus at a level equal to or in excess of the Group Enhanced Capital Requirement ("Group ECR") which is established by reference to either the Group BSCR model or an approved group internal capital model. The Group ECR will be phased-in over 5 years; for the year ended December 31, 2015, it is set at 70% of the amount calculated using the Group BSCR model and thereafter it will increase in increments of 10% per year through year-end 2018. |
• | Designated Insurer Notification Obligations: The Designated Insurer must notify the BMA upon reaching a view that there is a likelihood of the insurance group or any member of the group becoming insolvent or that a reportable "event" has, to the Designated Insurer's knowledge, occurred or is believed to have occurred. Within 30 days of such notification to the BMA, the Designated Insurer must furnish the BMA with a written report setting out all the particulars of the case that are available to it and within 45 days it must furnish a group capital and solvency return that reflects the Group ECR that has been prepared using post-loss data and unaudited financial statements for such period as the BMA shall require together with a declaration of solvency in respect thereof. |
• | BMA's Powers of Intervention, Obtaining Information, Reports and Documents and Providing Information to other Regulatory Authorities: The BMA has certain powers of investigation and intervention relating to insurers and their holding companies, subsidiaries and other affiliates, which it may exercise in the interest of such insurer's policyholders or if there is any risk of insolvency or of a breach of the Insurance Act or the insurer's license conditions. The BMA’s prudential framework for (re)insurance and group supervision has been recognized by the European Commission’s Delegated Act as being fully equivalent to regulatory standards applied to European reinsurance companies and insurance groups in accordance |
17
with the requirements of the Solvency II Directive. The Delegated Act is subject to review, and once it comes into force, the equivalence decision will be applied retroactively to January 1, 2016. There are planned changes to Bermuda’s regulatory regime that have been communicated to the industry. Certain significant aspects of the planned changes are set forth below. The BMA is implementing an Economic Balance Sheet ("EBS") framework which will be used as the basis to determine the ECR of insurers and group. The new regulations come into operation on January 1, 2016 and apply to financial years beginning on or after January 1, 2016. The BMA is also implementing new public disclosure rules that require all insurers and insurance groups to prepare and publish a Financial Condition Report ("FCR"). The FCR is intended to provide additional information to the public in relation to the insurer’s and group’s business model, whereby they may make an informed assessment on whether the business is run in a prudent manner. The new rules come into operation on January 1, 2016 and apply to financial years beginning on or after January 1, 2016.
Certain Bermuda Law Considerations
Maiden Holdings and Maiden Bermuda have been designated as non-resident for exchange control purposes by the BMA and are required to obtain the permission of the BMA for the issue and transfer of all of their shares. The BMA has given its consent for:
• | the issue and transfer of Maiden Holdings' common shares, up to the amount of its authorized capital from time to time, to and among persons that are non-residents of Bermuda for exchange control purposes; and |
• | the issue and transfer of up to 20% of Maiden Holdings' common shares in issue from time to time to and among persons resident in Bermuda for exchange control purposes. |
Transfers and issues of Maiden Holdings' common shares to any resident in Bermuda for exchange control purposes may require specific prior approval under the Exchange Control Act 1972. Maiden Bermuda's common shares cannot be issued or transferred without the consent of the BMA. Because we are designated as non-resident for Bermuda exchange control purposes, we are allowed to engage in transactions, and to pay dividends to Bermuda non-residents who are holders of our common shares, in currencies other than the Bermuda Dollar.
United States
Maiden US, domiciled in Missouri, is an accredited reinsurer in six states and an authorized insurer in forty-five jurisdictions. Regulatory, supervisory and administrative authority is primarily delegated to the states with the exception of federal authority over boycott, coercion and intimidation, federal antitrust laws and where federal law is enacted specifically to regulate the business of insurance. Among other things, state insurance departments regulate insurer solvency standards, insurer and agent licensing, authorized investments, loss and expense reserves and provisions for unearned premiums, and deposits of securities for the benefit of policyholders. Maiden US is required to file detailed financial statements and other reports with the departments of insurance in all states in which they are licensed to transact business. These financial statements are subject to the supervision, regulation and periodic examination by the Missouri department of insurance ("DOI").
State Insurance Department Examinations
Maiden US is subject to the financial supervision and regulation of the state in which it is domiciled. As part of their regulatory oversight process, state insurance departments conduct periodic detailed examinations of the financial reporting of insurance companies domiciled in their states, generally once every three to five years. Examinations may be carried out in cooperation with the insurance departments of other states under guidelines promulgated by the National Association of Insurance Commissioners ("NAIC").
Statutory Accounting Principles
Statutory accounting principles ("SAP") are a basis of accounting developed to assist insurance regulators in monitoring and regulating the solvency of insurance companies. SAP is primarily concerned with measuring an insurer's surplus to policyholders. Accordingly, statutory accounting focuses on valuing assets and liabilities of insurers at financial reporting dates in accordance with appropriate insurance law and regulatory provisions applicable in each insurer's domiciliary state.
U.S. GAAP is concerned with a company's solvency, but is also concerned with other financial measurements, principally income and cash flows. Accordingly, U.S. GAAP gives more consideration to appropriate matching of revenue and expenses and accounting for management's stewardship of assets than does SAP. As a direct result, different assets and liabilities and different amounts of assets and liabilities will be reflected in financial statements prepared in accordance with U.S. GAAP compared to SAP. Statutory accounting practices established by the NAIC and adopted in part by Missouri will determine, among other things, the amount of statutory surplus and statutory net income of Maiden US, and thus determine, in part, the amount of funds that are available to pay dividends to Maiden NA.
Holding Company Regulation
Maiden US is subject to the U.S. statutory holding company laws of its state of domicile. The insurance holding company laws and regulations apply directly to individual insurers, indirectly to non-insurance entities, and provide regulators the ability to look
18
at any entity within an insurance holding company system. State regulations generally provide that each insurance company in an insurance holding company system must register with the insurance department of its state of domicile. These laws vary from state to state, but each state has enacted legislation which requires licensed insurers that are subsidiaries of insurance holding companies to register and file with state regulatory authorities certain reports including information concerning their capital structure, ownership, financial condition and general business operations. All transactions involving the insurers in a holding company system and their affiliates must be fair and reasonable and, if material, require prior notice and approval or non-disapproval by the state insurance department of their domicile.
Further, state insurance holding company laws typically place limitations on the amounts of dividends or other distributions payable by insurers. Payment of ordinary dividends by Maiden US requires prior approval of the Director of the Missouri DOI unless dividends will be paid out of "earned surplus". Earned surplus is an amount equal to the unassigned funds of an insurer as set forth in the most recent annual statement of the insurer including all or part of the surplus arising from unrealized capital gains or revaluation of assets. Extraordinary dividends generally require 30 days prior notice to and non-disapproval of the Missouri DOI before being paid. An extraordinary dividend includes any dividend whose fair market value together with that of other dividends or distributions made within the preceding 12 months exceeds the greater of: (1) 10% of the insurer's surplus as regards policyholders as of December 31 of the prior year, or (2) the net income of the insurer, not including realized capital gains, for the 12 month period ending December 31 of the prior year, but does not include pro rata distributions of any class of the insurer's own securities.
State insurance holding company laws also require prior notice and state insurance department approval of changes in control of an insurer or its holding company. "Control" is generally defined as the possession, direct or indirect, of the power to direct or cause the direction of the management and policies of the company, whether through the ownership of voting securities, by contract (except a commercial contract for goods or non-management services) or otherwise. Maiden US is domiciled in Missouri where any beneficial owner of 10% or more of the outstanding voting securities of an insurance company or its holding company is presumed to have acquired control, unless this presumption is rebutted. Therefore, an investor who intends to acquire beneficial ownership of 10% or more of our outstanding voting securities may need to comply with these laws and would be required to file notices and reports with the Missouri DOI and receive approval from the Missouri DOI or rebut the presumption of control before such acquisition.
Risk-Based Capital
U.S. insurers are also subject to risk-based capital ("RBC") guidelines that provide a method to measure the total adjusted capital (statutory capital and surplus plus other adjustments) of insurance companies taking into account the risk characteristics of a company's investments and products. The RBC formulas establish capital requirements for four categories of risk: asset risk, insurance risk, interest rate risk and business risk. For each category, the capital requirement is determined by applying factors to asset, premium and reserve items, with higher factors applied to items with greater underlying risk and lower factors for less risky items. Insurers that have less statutory capital than the RBC calculation required are considered to have inadequate capital and are subject to varying degrees of regulatory action depending upon the level of capital inadequacy. Maiden US has satisfied the RBC formula and has exceeded all recognized industry solvency standards. At December 31, 2015, Maiden US had adjusted capital in excess of amounts requiring company or regulatory action.
Reinsurance
The ability of an insurer to take credit for the reinsurance purchased from reinsurance companies is a significant component of reinsurance regulation. Typically, an insurer will only enter into a reinsurance agreement if it can obtain credit to its reserves on its statutory financial statements for the reinsurance ceded to the reinsurer. With respect to U.S. domiciled reinsurers that reinsure U.S. insurers, credit is usually granted when the reinsurer is licensed, certified or accredited in a state where the primary insurer is domiciled or, in some instances, in a state in which the primary insurer is licensed. States also generally permit primary insurers to take credit for reinsurance if the reinsurer is (i) domiciled in a state with a credit for reinsurance law that is substantially similar to the standards in the primary insurer's state of domicile, and (ii) meets certain financial requirements. Credit for reinsurance purchased from a reinsurer that does not meet the foregoing conditions is generally allowed to the extent that such reinsurer secures its obligations with qualified collateral. Maiden is able to take credit for all reinsurance purchased and all cedents are able to take credit for reinsurance they purchase from Maiden.
NAIC Ratios
The NAIC Insurance Regulatory Information System ("IRIS") was developed to help state regulators identify companies that may require special attention. IRIS is comprised of statistical and analytical phases consisting of key financial ratios whereby financial examiners review annual statutory basis statements and financial ratios. Each ratio has an established "usual range" of results and assists state insurance departments in executing their statutory mandate to oversee the financial condition of insurance companies. A ratio result falling outside the usual range of IRIS ratios is not considered a failing result; rather unusual values are viewed as part of the regulatory early monitoring system. Furthermore, in some years, it may not be unusual for financially sound companies to have several ratios with results outside the usual ranges. An insurance company may fall out of the usual range for one or more ratios because of specific transactions that are in themselves immaterial. Generally, an insurance company will become subject to regulatory scrutiny and may be subject to regulatory action if it falls outside the usual ranges of four or more of the ratios. At December 31, 2015, Maiden US did not have an IRIS ratio range warranting any regulatory action.
19
State Legislative and Regulatory Changes
From time to time, various regulatory and legislative changes are proposed in the insurance industry. Among the proposals that have in the past been or are at present being considered are proposals in various state legislatures (some of which proposals have been enacted) to conform portions of their insurance laws and regulations to various model acts adopted by the NAIC.
Regulatory changes within the NAIC model laws could affect Maiden US. The concept of “enterprise risk” within an insurance holding company is a proposal that Missouri adopted in 2015 as an amendment to the Insurance Holding Company System Regulatory Act and Regulation. The first enterprise risk report is due on May 1, 2016 and annually thereafter. Maiden maintains its own robust ERM framework and we believe that adoption of the NAIC model laws will not be onerous for the Company.
Under the 2011 revisions to the NAIC Credit for Reinsurance Model Law and Regulation, non-U.S. reinsurers from "qualified jurisdictions" can apply to become a "certified reinsurer". Certified reinsurers are eligible to post less than 100% collateral for reinsurance assumed from U.S. ceding companies. At this time, we are unable to determine whether any additional changes in the U.S. reinsurance regulatory framework will be implemented and what effect any changes would have on our operations or financial condition.
Our insurance subsidiaries are required to comply with a wide variety of laws and regulations applicable to insurance or reinsurance companies, both in the jurisdictions in which they are organized and where they sell their insurance and reinsurance products. The insurance and regulatory environment, in particular for offshore insurance and reinsurance companies, has become subject to increased scrutiny in many jurisdictions, including the U.S., various states within the U.S. and the EU. In the past, there have been Congressional and other initiatives in the U.S. regarding increased supervision and regulation of the insurance industry. It is not possible to predict the future impact of changes in laws and regulations on our operations. The cost of complying with any new legal requirements affecting our subsidiaries could have a material adverse effect on our business.
In addition, our subsidiaries may not always be able to obtain or maintain necessary licenses, permits, authorizations or accreditations. They also may not be able to fully comply with, or to obtain appropriate exemptions from, the laws and regulations applicable to them. Any failure to comply with applicable law or to obtain appropriate exemptions could result in restrictions on either the ability of the company in question, as well as potentially its affiliates, to do business in one or more of the jurisdictions in which they operate or on brokers on which we rely to produce business for us. In addition, any such failure to comply with applicable laws or to obtain appropriate exemptions could result in the imposition of fines or other sanctions. Any of these sanctions could have a material adverse effect on our business. To date, no material fine, penalty or restriction has been imposed on us for failure to comply with any insurance law or regulation.
International Standards
U.S. federal and state regulators have committed in principle to adopting international standards with respect to basic regulatory issues such as accounting, risk management and corporate governance. International regulatory considerations are increasingly being deliberated by the NAIC and could increase regulatory burdens for Maiden US and have the potential to negatively impact all U.S. insurers, regardless of size. Various trade associations and industry participants are aggressively working to impact the NAIC adoption of these standards. However, the final outcome of these deliberations is unknown at this time.
Federal
Although the regulation of the business of insurance and reinsurance is predominantly performed by the states, federal initiatives, such as the Dodd-Frank Wall Street Reform and Consumer Protection Act ("Dodd-Frank"), often have an impact on the insurance industry. From time to time, various federal regulatory and legislative changes have been proposed in the insurance and reinsurance industry. Turmoil in the financial markets has increased the likelihood of changes in the way the financial services industry is regulated. While we cannot predict the exact nature, timing or scope of possible governmental initiatives, there may be increased regulatory intervention in our industry in the future.
The Terrorism Risk Insurance Program Reauthorization Act of 2015
Terrorism Risk Insurance Act of 2002 ("TRIA"), which was previously amended and extended in 2005, 2007 and again in 2015 by the Terrorism Risk Insurance Program Reauthorization Act of 2015 ("TRIPRA 2015"), was enacted to ensure the availability of insurance coverage for terrorist acts in the U.S. The TRIPRA 2015 was signed into law by President Obama on January 12, 2015. This law renewed the prior federal terrorism risk insurance program. It was extended through December 31, 2020 with certain modifications in the provisions of the expiring program.
There is no assurance that TRIA will be extended beyond 2020 on either a temporary or permanent basis and its expiration (or renewal on a substantially modified basis) could have an adverse effect on our clients, the industry or us. TRIA does not apply to reinsurers directly but does apply directly to insurers and to excess and surplus lines insurers. The TRIPRA 2015 has had some impact on our reinsurance clients, but not all due to the lines of business covered by Terrorism Risk Insurance Act. Also, in general, our reinsurance contracts contain inuring language regarding any potential recoveries from TRIA.
Additional material addressing TRIA and TRIPRA, including Treasury issued interpretive letters, are contained on the Treasury’s website.
20
Taxation of the Company and its Subsidiaries
The following summary of the taxation of Maiden Holdings and its subsidiaries is based upon current law. Legislative, judicial or administrative changes may be forthcoming that could affect this summary. Certain subsidiaries of ours are subject to taxation related to operations in Australia, Germany, Russia, Sweden, the U.K. and the U.S. The discussion below covers the principal locations for which the Company or its subsidiaries are subject to taxation.
Bermuda
Maiden Holdings and Maiden Bermuda have each received from the Minister of Finance an assurance under The Exempted Undertakings Tax Protection Act, 1966 to the effect that in the event that there is any legislation enacted in Bermuda imposing tax computed on profits or income, or computed on any capital asset, gain or appreciation, or any tax in the nature of estate duty or inheritance tax, then the imposition of any such tax shall not be applicable to Maiden Holdings or Maiden Bermuda or to any of their operations or the shares, debentures or other obligations of Maiden Holdings or Maiden Bermuda until March 31, 2035. These assurances are subject to the proviso that they are not construed to prevent the application of any tax or duty to such persons as are ordinarily resident in Bermuda (Maiden Holdings and Maiden Bermuda are not currently so designated) or to prevent the application of any tax payable in accordance with the provisions of The Land Tax Act, 1967 of Bermuda or otherwise payable in relation to the property leased to Maiden.
Germany
AVS Automotive VersicherungsService GmbH ("AVS Germany") formerly known as Maiden Germany GmbH or "Maiden Germany", which is a wholly owned subsidiary of Maiden Global, is the majority shareholder of OVS. AVS Germany is subject to German corporate income tax of 15.0% plus a solidarity surcharge of 5.5% thereon (in the aggregate, a rate of 15.825%). In addition, a German municipal trade tax of 14.7% resulting from the registered seat of the company in Russelsheim is paid.
AVS Germany has been able to engage in general commerce as of October 21, 2015 and owns 90% of the shares in OVS. AVS Germany and OVS implemented a tax unity for corporate income and trade tax purposes by entering into a profit and loss pooling agreement with a retroactive effect from January 1, 2011, accordingly all profits and losses generated by OVS are attributed to AVS Germany. The non-affiliated shareholder that holds the remaining 10% stake in OVS receives a fixed annual dividend of €45,000 from AVS Germany, since all income is attributed to AVS Germany as a result of the tax unity.
OVS, also with its registered seat in Russelsheim, is subject to the same German corporate income tax of 15% plus solidarity surcharge of 5.5% thereon (in the aggregate, a rate of 15.825%) and German trade tax of 14.70%. OVS is engaged in general commerce as an insurance agency. The taxable income of a German corporate entity is in principle, absent a Treaty exemption, the total amount of worldwide income (current profits, capital gains) after deduction of business expenses. In general, income from capital gains arising upon the sale of shares in corporate entities are, in principle, fully tax exempt. The same applies to income from dividend if the stake in the dividend paying corporation is at least 10% (for corporate income tax purposes), respectively 15% (for trade tax purposes) at the beginning of the respective calendar year (for dividends received from companies resident outside Germany, the 15% stake in the non-resident corporation must be held as from the beginning of the calendar year). However, a lump sum of 5% of the dividend / capital gains is added back to the taxable income, representing non-deductible business expenses. Since there is a tax unity in place between AVS Germany and OVS, the tax exemption for dividends received by OVS is (due to the tax unity) not granted to OVS, but rather to AVS Germany, the 90% shareholder. Any income generated by OVS is directly attributable to AVS Germany under the profit and loss pooling agreement and therefore taxed at the level of AVS Germany. Thus, no dividend payment by OVS to AVS Germany is required. However, 20/17ths of the amount of the guaranteed dividend to the non-affiliated shareholder is taxed to OVS as its own taxable income.
Maiden Global has obtained a withholding tax exemption certificate from the Federal Central Tax Office such that any dividend from AVS Germany to Maiden Global is exempt from German withholding tax. There is no German withholding tax on (non-profit related) interest payments to corporate shareholders. Other than AVS Germany and OVS, we believe that the Company has operated and will continue to operate its business in a manner that will not cause its affiliates to be treated as engaged in a trade or business within Germany. A trade or business in Germany requires a permanent establishment either in the form of a fixed place of business or by having a permanent representative on German ground. A subsidiary may qualify as permanent representative if it carries out business activities of its shareholder or an affiliate in Germany.
Sweden
Maiden LF is subject to Swedish taxation on net profits irrespective of whether the profits are generated through business in general or capital. To the extent that net profits are generated, profits are taxed at a rate of 22%. Foreign entities are subject to tax in Sweden only to the extent they have a permanent establishment in Sweden or if the income is related to certain types of assets, typically real estate, or partnership income. Dividends paid to foreign shareholders may be subject to withholding tax with a maximum of 30% although in many cases tax is reduced as a result of a tax treaty or under domestic legislation. A foreign entity is deemed to have a permanent establishment in Sweden under the rules very similar to those applied by OECD. Other than Maiden LF, we believe that Maiden has operated and will continue to operate its business in a manner that will not cause it to be treated as having a permanent establishment in Sweden. There is no withholding tax on interest paid by a Swedish borrower to a foreign lender.
21
United Kingdom
Maiden Global is tax resident in the U.K. and is currently subject to corporation tax in the U.K. on its trading and other taxable profits. The main rate of U.K. corporation tax is 20% with effect from April 1, 2015. Non-U.K. resident corporations are within the charge to corporation tax in the U.K. if they carry on a trade in the U.K. through a permanent establishment. Reinsurance business developed by Maiden Global is underwritten by Maiden Bermuda in Bermuda. Other than in respect of Maiden Global, we believe that the Company has operated and will continue to operate its business in a manner that will not cause it to be treated as carrying on a trade within the U.K.
U.K. source income of non-U.K. resident corporations may be subject to U.K. withholding tax, subject to the availability of treaty relief or any other applicable exemptions. Dividends paid by Maiden Global are not subject to U.K. withholding tax. Interest paid by Maiden Global may be subject to U.K. withholding tax at a rate of up to 20%, subject to the availability of treaty relief or any other applicable exemptions.
United States
Maiden NA and its subsidiaries, including Maiden US, (collectively, the Maiden NA Companies), transact business in and are subject to taxation in the U.S. Other than the Maiden NA Companies, we believe that we have operated and will continue to operate our business in a manner that will not cause us to be treated as engaged in a trade or business within the U.S. On this basis, other than the Maiden NA Companies, we do not expect to be required to pay U.S. corporate income taxes (other than withholding and excise taxes as described below). The maximum federal tax rate is currently 35% for a corporation’s income that is effectively connected with a trade or business in the U.S. In addition, U.S. branches of foreign corporations may be subject to the branch profits tax, which imposes a tax on U.S. branch after-tax earnings that are deemed repatriated out of the U.S., for a potential maximum effective federal tax rate of approximately 54% on the net income connected with a U.S. trade or business.
Foreign corporations not engaged in a trade or business in the U.S. are subject to U.S. income tax, effected through withholding by the payer, on certain fixed or determinable annual or periodic gains, profits and income derived from sources within the U.S. as enumerated in Section 881(a) of the Internal Revenue Code, such as dividends and interest on certain investments.
The U.S. also imposes an excise tax on insurance and reinsurance premiums paid to foreign insurers or reinsurers with respect to risks located in the U.S. The rate of tax applicable to reinsurance premiums paid to Maiden Bermuda is 1% of gross premiums.
Where You Can Find More Information
We maintain our principal website at www.maiden.bm. The information on our websites is not incorporated by reference in this Annual Report on Form 10-K.
We make available, free of charge through our principal website, our financial information, including the information contained in our Annual Reports on Form 10-K, Quarterly Reports on Form 10-Q, Current Reports on Form 8-K and amendments to those reports filed or furnished pursuant to Section 13(a) or 15(d) of the Securities Exchange Act of 1934, as amended (the "Exchange Act"), as soon as reasonably practicable after we electronically file such material with, or furnish such material to, the SEC. We also make available, free of charge through our principal website, our Audit Committee Charter, Compensation Committee Charter, Nominating & Corporate Governance Committee Charter, and Code of Business Conduct and Ethics. Such information is also available in print for any shareholder who sends a request to Maiden Holdings, Ltd., Maiden House, 131 Front Street, Hamilton HM 12, Bermuda, Attention: Secretary. Reports and other information we file with the SEC may also be viewed at the SEC’s website at www.sec.gov or viewed or obtained at the SEC Public Reference Room at 100 F Street, N.E., Washington, DC 20549. Information on the operation of the SEC Public Reference Room may be obtained by calling the SEC at 800-SEC-0330.
Item 1A. Risk Factors.
Introduction
Investing in our securities carries risk. Managing risk effectively is critical to our success, and our organization is built around intelligent risk assumptions and prudent risk management. We have identified what we believe reflect key significant risks to the organization, and in turn to our shareholders, which are outlined below. Any of the risks described below could result in a significant or material adverse effect on our results of operations or financial condition. In addition to these enumerated risks, we face numerous other strategic, operational and emerging risks that could in the aggregate lead to shortfalls to our long-term goals or add to short-term volatility in our earnings. The following review of important risk factors should not be construed as exhaustive and should be read in conjunction with other cautionary statements that are included herein or elsewhere. The words or phrases believe, anticipate, estimate, project, plan, expect, intend, hope, forecast, evaluate, will likely result or will continue or words or phrases of similar import generally involve forward-looking statements. All of the risks that may affect our financial or operating performance may not be material at this time but may become material in the future. As used in these Risk Factors, the terms "we", "our" or "us" may, depending upon the context, refer to the Company, to one or more of the Company’s consolidated subsidiaries or to all of them taken as a whole.
22
Business
Our business model is different than other Bermuda reinsurers.
Unlike many other publicly traded Bermuda reinsurance companies, we do not write property catastrophe reinsurance, nor do we maintain substantial primary insurance operations. As a result, you may not be able to compare our business’s performance or prospects to other Bermuda-domiciled publicly traded reinsurers, who have very different strategies and balance sheet structures than us.
We have engaged in a series of significant transactions that may affect comparability and make it difficult for investors to evaluate our performance.
We began underwriting reinsurance transactions in July 2007. As a result, there is limited historical information available to help investors evaluate our performance. In addition, in light of a series of significant transactions during that time, including (but not limited to) the GMAC Acquisition in 2008, NGHC Quota Share in March 2010 (currently in run-off effective August 1, 2013), the IIS Acquisition in November 2010, and in 2013, selling the primary insurance business written on a surplus lines basis by Maiden Specialty (as noted in Item 1 Business, on November 4, 2015, Maiden US finalized the sale of its wholly owned subsidiary, Maiden Specialty, to Clear Blue), our historical financial statements are not necessarily meaningful for evaluating the potential of our future operations over a long term basis.
We may not be able to manage our growth effectively.
Since our inception, our business has grown at a compound annual growth rate of 25.8%, with growth of 6.2% in 2015. We expect our business to grow in the future as we continue our relationships with existing clients while seeking opportunities to reinsure other insurance companies operating in similar niches. We are targeting a 10% annual growth rate for 2016. Expansion of our business at a rate faster than we anticipate could require additional resources including capital and possibly personnel.
While we believe we have demonstrated our ability to effectively manage growth to date, and believe we have additional measures at our disposal to effectively manage growth, both anticipated and unanticipated, we cannot assure you that we will be able to meet our capital needs, expand our systems effectively, allocate our human resources optimally, identify and hire qualified employees or incorporate effectively the components of any businesses we may acquire. The failure to manage our growth effectively could have a material adverse effect on our business, financial condition and results of operations.
Additional measures available to us include but are not limited to, additional capital offerings including debt, equity and hybrid-based, the use of retrocessional reinsurance and the application of other reinsurance mechanisms that reduce or limit the amount of exposure we assume. There can be no guarantee, however, that such measures can be implemented on terms and conditions that do not have an adverse effect on our financial condition and results of operations.
Ongoing economic uncertainty could materially and adversely affect our business, our liquidity and financial condition.
Global economies and financial markets have experienced significant weakness and volatility since 2008, although the most extreme of these circumstances have abated since that time. In addition, U.S. federal and state governments continue to experience significant structural fiscal deficits, creating uncertainty as to levels of taxation, inflation, regulation and other economic fundamentals that may impact future growth prospects. Significantly greater economic, fiscal and monetary uncertainty remains in Europe, due to the combination of poor economic growth, high unemployment and significant sovereign deficits which have called into question the future of the common currency used across most of Europe. European economic activity appears likely to remain volatile in the near future and to potentially have a continuing impact on the U.S. economy. Continuation of these conditions may potentially affect (among other aspects of our business) the demand for and claims made under our products, the ability of clients, counterparties and others to establish or maintain their relationships with us, our ability to access and efficiently use internal and external capital resources and our investment performance. In the event that these conditions persist and result in a prolonged period of economic uncertainty, our results of operations, our financial condition and/or liquidity, and our prospects could be materially and adversely affected.
If continuing opportunities for writing reinsurance through Maiden US do not materialize, our financial condition and results of operations may be materially adversely affected.
We believe that there will be opportunities to renew existing business and write new reinsurance and insurance through Maiden US. We cannot assure you, however, that Maiden US will retain its clients or write new business as we may expect. However, market conditions have been competitive for an extended period of time and are expected to remain competitive for the foreseeable future, particularly as new market participants with business objectives different from Maiden's influence the competitive environment. In addition, other companies may continue to offer reinsurance and insurance products on more competitive terms than we can provide. Under these circumstances, we might not be able to expand our reinsurance business and the failure to do so may have a material adverse effect on our ability to fully implement our business strategy, as well as on our financial condition, results of operations and prospects.
23
Our actual losses may be greater than our reserve for loss and LAE, which would negatively impact our financial condition and results of operations.
We expect that our success will depend upon our ability to assess accurately the risks associated with the businesses that we will reinsure. Significant periods of time often elapse between the occurrence of an insured loss, the reporting of the loss to an insurer and the reporting of the loss by the insurer to its reinsurer and the ultimate disposition of that loss. The reserves we establish represent estimates of amounts needed to pay reported losses and unreported losses and the related loss adjustment expense. Loss reserves are only an estimate of what an insurer or reinsurer anticipates the ultimate costs of claims to be and do not represent an exact calculation of liability. Estimating loss reserves is a difficult and complex process involving many variables and subjective judgments. As part of our reserving process, we review historical data as well as actuarial and statistical projections and consider the impact of various factors such as:
• | trends in claim frequency and severity; |
• | changes in operations; |
• | emerging economic and social trends; |
• | inflation; and |
• | changes in the regulatory and litigation environments. |
This process assumes that past experience, adjusted for the effects of current developments and anticipated trends, is an appropriate basis for predicting future events. There is no precise method, however, for evaluating the impact of any specific factor on the adequacy of reserves, and actual results are likely to differ from original estimates. In addition, unforeseen losses, the type or magnitude of which we cannot predict, may emerge in the future. We will establish or adjust reserves for our insurance subsidiaries in part based upon loss data received from the ceding companies with which we do business, including AmTrust. There is a time delay that elapses between the receipt and recording of claims results by the ceding insurance companies and the receipt and recording of those results by us. Accordingly, establishment and adjustment of reserves for our insurance subsidiaries is dependent upon timely and accurately estimate reporting from cedants and agents.
While we believe that while our case reserves and IBNR reserves are sufficient to cover losses assumed by us, there can be no assurance that losses will not deviate from our reserves, possibly by material amounts. To the extent actual reported losses exceed estimated losses, the carried estimate of the ultimate losses will be increased, which represents unfavorable reserve development, and to the extent actual reported losses are less than our expectations, the carried estimate of ultimate losses will be reduced, which represents favorable reserve development.
The inherent uncertainty of models and the use of such models as a tool to evaluate risk may have an adverse impact on our financial results.
We use both our own proprietary models and widely accepted and industry-recognized third party vendor analytic and modeling capabilities to provide us with pricing, capital modeling and objective risk assessment relating to risks in our reinsurance portfolio. In addition, we also use widely accepted and industry-recognized third party vendor analytic and modeling capabilities to provide us with objective risk assessment relating to catastrophe risks in our reinsurance portfolio. These models help us control risk accumulation, inform management and other stakeholders of capital requirements and to improve the risk/return profile or minimize the amount of capital required to cover the risks in each reinsurance contract in our overall portfolio of reinsurance contracts. However, given the inherent uncertainty of modeling techniques and the application of such techniques, these models and databases may not accurately address the emergence of a variety of matters which might be deemed to impact certain of our coverages. Accordingly, these models may understate the exposures we are assuming and our financial results may be adversely impacted, perhaps significantly.
For our property and casualty reinsurance underwriting, we depend on the policies, procedures and expertise of ceding companies; these companies may fail to accurately assess and price the risks they underwrite, which may lead us to inaccurately assess and price the risks we assume.
Our participation in property and casualty reinsurance markets means the success of our underwriting efforts depends, in part, upon the policies, procedures and expertise of the ceding companies making the original underwriting decisions. As is common among reinsurers, we do not separately evaluate each of the individual risks assumed under reinsurance treaties. We face the risk that these ceding companies may fail to accurately assess the risks that they assume initially, which, in turn, may lead us to inaccurately assess the risks we assume.
If we fail to establish and receive appropriate pricing or fail to contractually limit our exposure to such risks, we could face significant losses on these contracts, which could have a material adverse impact on our financial results.
24
Operational risks, including human or systems failures, are inherent in our business.
Operational risks and losses can result from many sources including fraud, errors by employees, failure to document transactions properly or to obtain proper internal authorization, failure to comply with regulatory requirements or information technology failures.
We believe our modeling, underwriting and information technology and application systems are critical to our business and reputation. Moreover, our technology and applications have been an important part of our underwriting process and our ability to compete successfully. Such technology is and will continue to be a very important part of our underwriting process. We have also licensed certain systems and data from third parties. We cannot be certain that we will have access to these, or comparable service providers, or that our technology or applications will continue to operate as intended. In addition, we cannot be certain that we would be able to replace these service providers or consultants without slowing our underwriting response time. A major defect or failure in our internal controls or information technology and application systems could result in management distraction, harm to our reputation, a loss or delay of revenues or increased expense.
Our internal control and reporting systems might not be effective in the future, which could increase the risk that we would become subject to restatements of our financial results or to regulatory action or litigation or other developments that could adversely affect our business.
Our ability to produce accurate financial statements and comply with applicable laws, rules and regulations is largely dependent on our maintenance of internal control and reporting systems, as well as on our ability to attract and retain qualified management and accounting and actuarial personnel to further develop our internal accounting function and control policies. If we fail to effectively establish and maintain such reporting and accounting systems or fail to attract and retain personnel who are capable of designing and operating such systems, these failures will increase the likelihood that we may be required to restate our financial results to correct errors or that we will become subject to legal and regulatory infractions, which may entail civil litigation and investigations by regulatory agencies including the SEC. In addition, if our management or our independent registered public accounting firm were to conclude that our internal control over financial reporting was not effective, investors could lose confidence in our reported financial information, and our financial flexibility and the value of our common shares could be adversely impacted.
The occurrence of severe catastrophic events may have a material adverse effect on our financial results.
Although our business strategy generally precludes us from writing significant amounts of catastrophe exposed business in our reinsurance segment, most property reinsurance contains some exposure to catastrophic loss. Our Diversified Reinsurance segment includes only limited exposure to natural and man-made disasters, such as hurricane, typhoon, windstorm, flood, earthquake, acts of war, acts of terrorism and political instability. At December 31, 2015, our one-in-250 year catastrophe exposure on a per occurrence and aggregate basis is $36.4 million and $77.8 million, respectively.
While we attempt to carefully manage our aggregate exposure to catastrophes, modeling errors and the incidence and severity of catastrophes, such as hurricanes, windstorms, cyber attacks and large-scale terrorist attacks, are inherently unpredictable, and our losses from catastrophes could be substantial. Further, many scientists believe that the earth's atmospheric and oceanic temperatures are increasing and that, in recent years, changing climate conditions have increased the unpredictability, severity and frequency of natural disasters in certain parts of the world.
We may face substantial exposure to losses from terrorism, acts of war and political instability.
We have exposure to losses resulting from acts of terrorism, acts of war and political instability as a reinsurer of U.S. domiciled insurers. U.S. insurers are required by state and federal law to offer coverage for terrorism in certain commercial lines. In response to the September 11, 2001 terrorist attacks, the U.S. Congress enacted legislation designed to ensure, among other things, the availability of insurance coverage for foreign terrorist acts, including the requirement that insurers offer such coverage in certain commercial lines. The TRIA requires commercial property and casualty insurance companies to offer coverage for certain acts of terrorism and established a federal assistance program through the end of 2005 to help such insurers cover claims related to future terrorism-related losses. The Terrorism Risk Insurance Extension Act ("TRIEA") extended the federal assistance program through 2007, but it also set a per-event threshold that had to be met before the federal program would become applicable and also increased insurers’ statutory deductibles. The Terrorism Risk Insurance Program Revitalization Act ("TRIPRA") extended the federal assistance program through December 31, 2014. The program was reauthorized, with some adjustments to its provisions, for six years through December 31, 2020.
TRIPRA also expanded the definition of Act of Terrorism by removing the distinction between foreign and domestic acts of terrorism. While TRIPRA does not specifically cover losses Maiden may incur, recoveries that our clients receive generally inure to our benefit.
We may or may not use retrocessional and reinsurance coverage to limit our exposure to risks. Any retrocessional or reinsurance coverage that we obtain may be limited, and credit and other risks associated with our retrocessional and reinsurance arrangements may result in losses which could adversely affect our financial condition and results of operations.
We will provide reinsurance to our clients and in turn we may or may not retrocede reinsurance we assume to other insurers and reinsurers. If we do not use retrocessional coverage or reinsurance, our exposure to losses will be greater than if we did obtain such coverage. If we do obtain retrocessional or reinsurance coverage, some of the insurers or reinsurers to whom we may retrocede
25
coverage or reinsure with may be domiciled in Bermuda or other non-U.S. locations. We would be subject to credit and other risks that depend upon the financial strength of these reinsurers. Further, we will be subject to credit risk with respect to any retrocessional or reinsurance arrangements because the ceding of risk to reinsurers and retrocessionaires would not relieve us of our liability to the clients or companies we insure or reinsure. Our failure to establish adequate reinsurance or retrocessional arrangements or the failure of any retrocessional arrangements to protect us from overly concentrated risk exposure could adversely affect our business, financial condition and results of operation. We may attempt to mitigate such risks by retaining collateral or trust accounts for premium and claims receivables, but nevertheless we cannot be assured that reinsurance will be fully collectable in the case of all potential claims outcomes.
The effects of emerging claim and coverage issues on our business are uncertain.
As industry practices and legal, judicial, social and other environmental conditions change, unexpected issues related to claims and coverage may emerge. These issues may adversely affect our business by either extending coverage beyond our underwriting intent or by increasing the number or size of claims. In some instances, these changes may not become apparent until sometime after we have issued insurance or reinsurance contracts that are affected by the changes. As a result, the full extent of liability under our reinsurance contracts may not be known for many years after a contract is issued. Our exposure to these uncertainties could be exacerbated by an increase in insurance and reinsurance contract disputes, arbitration and litigation.
Our business is subject to risks related to litigation.
We may from time to time be subject to litigation in the ordinary course of business relating to our current and past business operations, including, but not limited to, disputes over coverage or claims adjudication, including claims alleging that we have acted in bad faith in the administration of claims by our policyholders, disputes with our agents, producers and termination of contracts and related claims and disputes with former employees. We also cannot determine with any certainty what new theories of recovery may evolve or what their impact may be on our business.
An adverse resolution of one or more lawsuits or arbitrations could have a material adverse effect on our results of operations in a particular fiscal quarter or year.
The integration of companies we acquire may not be as successful as we anticipate.
While we have had limited acquisition activity since our inception, we may periodically evaluate and undertake acquisitions. Acquisitions involve numerous risks, including operational, strategic, and financial risks such as potential liabilities associated with the acquired business. Difficulties in integrating an acquired company from a financial and operational standpoint may result in the acquired company performing differently than we currently expect or in our failure to realize anticipated expense-related efficiencies. Our existing businesses could also be negatively impacted by acquisitions.
Technology breaches or failures, including, but not limited to, those resulting from cyber-attacks on us or our business partners and service providers, could disrupt or otherwise negatively impact our business.
Information technology and application systems can streamline many business processes and ultimately reduce the cost of operations however technology initiatives present certain risks. Our business is dependent upon our employees and outsourcers ability to perform, in an efficient and uninterrupted fashion, necessary business functions. Like all companies, our information technology systems are vulnerable to data breaches, interruptions or failures due to events that may be beyond our control, including, but not limited to, natural disasters, theft, terrorist attacks, computer viruses, hackers and general technology failures. Our information technology systems include the Internet and third-party hosted services. We use information systems to process financial information and results of operations for internal reporting purposes and for regulatory financial reporting, legal and tax requirements. We also use information systems for electronic communications with customers and our various locations.
A shutdown or inability to access one or more of our facilities, a power outage, a security breach, or a failure of one or more of our information technology, telecommunications or other systems could significantly impair our ability to perform such functions on a timely basis. These incidents could be caused by malicious or disruptive software, computer hackers, rogue employees, cyber-attacks, failures of telecommunications systems or other catastrophic events. If sustained or repeated, such a business interruption, system failure or service denial could result in a deterioration of our ability to write and process business, provide customer service, pay claims in a timely manner or perform other necessary business functions. Furthermore, a significant portion of the communications between our employees and our business, banking and investment partners depends on information technology and electronic information exchange. In addition, we may suffer financial and reputational damage because of lost or misappropriated confidential information belonging to us, and may become subject to legal action and increased regulatory oversight. We could also be required to spend significant financial and other resources to remedy any damage caused to repair or replace information systems.
We believe that we have established and implemented appropriate security measures, controls and procedures to safeguard our information technology systems and to prevent unauthorized access to such systems and any data processed and/or stored in such systems, and we periodically employ third parties to evaluate and test the adequacy of such systems, controls and procedures. In addition, we have established a business continuity plan which is designed to ensure that we are able to maintain all aspects of our key business processes functioning in the midst of certain disruptive events, including any disruptions to or breaches of our information technology systems. We continue to make investments in technologies, cyber-insurance and training. Our business
26
continuity plans are tested and evaluated for adequacy. Despite these safeguards, disruptions to and breaches of our information technology systems are possible and may negatively impact our business.
Like most major corporations, Maiden’s information systems are a target of attacks. Although we have experienced no known material or threatened cases involving unauthorized access to our information technology systems and data or unauthorized appropriation of such data to date, we have no assurance that such technology breaches will not occur in the future.
Insurance and Reinsurance Markets
The property and casualty insurance and reinsurance industry is cyclical in nature, which may affect our overall financial performance.
Historically, the financial performance of the property and casualty insurance and reinsurance industry has tended to fluctuate in cyclical periods of price competition and excess capacity (known as a soft market) followed by periods of high premium rates and shortages of underwriting capacity (known as a hard market). Although the financial performance of an individual insurance or reinsurance company is dependent on its own specific business characteristics, the profitability of most property and casualty insurance and reinsurance companies tends to follow this cyclical market pattern.
In recent years, the market has been in a competitive environment in which underwriting capacity has expanded, risk selection became less discrete and price competition increased sharply. During that period, market participants' capital levels have continued to improve due to positive earnings and improved values of risk assets over that time. In addition, an influx of new market participants with different operating models than traditional reinsurers such as us, have entered the market place. While many of these new market participants specialize in property catastrophe oriented business and do not directly compete with us, they are influencing competitive conditions in the broader reinsurance market. This additional underwriting capacity resulted in increased competition from other insurance and reinsurance companies expanding the types or amounts of business they write, or from companies seeking to maintain or increase market share at the expense of underwriting discipline.
Because this cyclicality is due in large part to the actions of our competitors and general economic factors beyond our control, we cannot predict with certainty the timing or duration of changes in the market cycle. These cyclical patterns, the actions of our competitors, and general economic factors could cause our revenues and net income to fluctuate, which may cause the price of our common shares to be volatile. The ultimate outcome of these events and their market impact is not known at this time.
Negative developments in the U.S. workers’ compensation insurance industry could adversely affect our financial condition and results of operations.
In 2015, reinsurance of U.S. workers’ compensation insurance was 42.9% of total net premiums written, which is our largest exposure to a particular line of business, and reflects the ongoing growth of our largest client, AmTrust. Nonetheless, negative developments in the economic, competitive or regulatory conditions affecting the U.S. workers’ compensation insurance industry could have an adverse effect on our financial condition and results of operations. For example, if legislators in our larger markets were to enact legislation to increase the scope or amount of benefits for employees under U.S. workers’ compensation insurance policies without related premium increases or loss control measures, or if regulators made other changes to the regulatory system governing U.S. workers’ compensation insurance, this could negatively affect the U.S. workers’ compensation insurance industry in the affected markets.
In many states, including California, our largest state in terms of U.S. workers’ compensation premium volume, there are active regulatory activities that oversee the level of rates that can be charged by individual insurers. As a result, there is a risk that our clients may not be able to implement needed rate increases to maintain sufficient levels of profitability on business we write.
We operate in a highly competitive industry.
The reinsurance industry is highly competitive. We compete with major U.S. and non-U.S. reinsurers, including other Bermuda-based reinsurers, on an international and regional basis. Many of these entities have significantly larger amounts of capital, higher ratings from rating agencies and more resources than us. Historically, periods of increased capacity levels in our industry have led to increased competition which puts pressure on reinsurance pricing.
In recent years, significant increases in the use of risk-linked securities and derivative and other non-traditional risk transfer mechanisms and vehicles are being developed and offered by other parties, including entities other than insurance and reinsurance companies. The availability of both these non-traditional products and sources of capital could reduce the demand for traditional insurance and reinsurance.
A number of new, proposed or potential industry or legislative developments could further increase competition in our industry. New competition from these developments may result in fewer contracts written, lower premium rates, increased expenses for customer acquisition and retention and less favorable policy terms and conditions, which could have a material adverse impact on our growth and profitability.
27
Our efforts to develop products, expand in targeted markets or modify our business and strategic plans may not be successful and may create enhanced risks.
A number of our planned business initiatives involve developing new products or expanding existing products in targeted markets. To develop new products or markets, we may need to make substantial capital and operating expenditures, which may negatively impact our results in the near term. In addition, the demand for new products or in new markets may not meet our expectations. To the extent we are able to market new products or expand in new markets, our risk exposures may change and the data and models we use to manage such exposures may not be as sophisticated as those we use in existing markets or with existing products. This, in turn, could lead to losses in excess of expectations. As part of our ongoing efforts to continually improve our performance, we regularly evaluate our business plans and strategies, which may result in changes to our business plans and initiatives, some of which may be material. We are subject to increasing risks related to our ability to successfully implement our evolving plans and strategies. Changing plans and strategies requires significant management time and effort, and may divert management’s attention from our core operations and competencies. Moreover, modifications we undertake to our operations may not immediately result in improved financial performance. Therefore, risks associated with implementing or changing our business strategies and initiatives, including risks related to developing or enhancing the operations, controls and other infrastructure required for these strategies and initiatives, may not have a positive impact on our publicly reported results until many years after implementation. The risk that we may fail to have the ability to carry out our business plans may have an adverse effect on our long-term results of operations and financial condition.
Consolidation in the insurance and reinsurance industry and increased competition on premium rates could lead to lower margins for us and less demand for our products and services.
The insurance and reinsurance industry continues to undergo a process of consolidation as industry participants seek to enhance their product and geographic reach, client base, operating efficiency and general market power through merger and acquisition activities. It is possible that the larger combined entities resulting from these mergers and acquisition activities may seek to use the benefits of consolidation, including improved efficiencies and economies of scale, to, among other things, implement price reductions for their products and services to increase their market shares. Consolidation among primary insurance companies may also lead to reduced use of reinsurance as the resulting larger companies may be able to retain more risk and may also have bargaining power in negotiations with reinsurers. If competitive pressures compel us to reduce our prices, our operating margins will decrease.
As the insurance and reinsurance industry consolidates, competition may become more intense and the importance of acquiring and properly servicing each customer will become greater. We could incur greater expenses relating to customer acquisition and retention, which could reduce our operating margins.
When the property-casualty insurance industry has exhibited a greater degree of competition, premium rates have come under downward pressure as a result. Greater competition could result in reduced volumes of reinsurance written and could reduce our profitability.
Financial Strength and Debt Ratings
Ratings downgrades of either Maiden Bermuda or Maiden US may adversely affect our competitive position and our ability to meet our financial goals and capital requirements.
Competition in the types of insurance business that we intend to reinsure is based on many factors, including the perceived financial strength of the insurer and ratings assigned by independent rating agencies. Maiden Bermuda and Maiden US have each received a financial strength rating of "A-" (Excellent) with a positive outlook from A.M. Best and have also received a financial strength rating of "BBB+" (Good) with a stable outlook from S&P.
Ratings from these agencies are an opinion of our financial strength and ability to meet ongoing obligations to our future policyholders, and it is not an evaluation directed to our investors in our common shares, preference shares or senior notes, nor is it a recommendation to buy, sell or hold our common shares, preference shares or senior notes. Each rating should be evaluated independently of any other rating.
The ratings of Maiden Bermuda and Maiden US are subject to periodic review by, and may be revised downward or revoked at any time at the sole discretion of A.M. Best and/or S&P. If A.M. Best were to downgrade Maiden Bermuda’s rating below "A-", AII and other clients would have the right to terminate their respective reinsurance agreements. More generally, if A.M. Best or S&P were to downgrade Maiden Bermuda or Maiden US, our competitive position would suffer, and our ability to market our products, to obtain clients and to compete in the reinsurance industry would be adversely affected. A subsequent downgrade, therefore, could result in a substantial loss of business because our clients may move to other reinsurers with higher claims paying and financial strength ratings.
Clients, Brokers and Financial Institutions
Our business is dependent upon reinsurance brokers and other producers, including third party administrators and financial institutions, and the failure to develop or maintain these relationships could materially adversely affect our ability to market our products and services.
28
We market a significant portion of products in our Diversified Reinsurance segment through brokers and expect that we will derive a significant portion of our business from a limited number of brokers. Our failure to further develop or maintain relationships with brokers from whom we expect to receive our business could have a material adverse effect on our business, financial condition and results of operations.
Our reliance on brokers subjects us to their credit risk.
In accordance with industry practice, we anticipate that we will frequently pay amounts owed on claims under our reinsurance contracts to brokers, and these brokers in turn are required to pay and will pay these amounts over to the clients that have purchased reinsurance from us. If a broker fails to make such a payment, it is highly likely that we will be liable to the client for the deficiency under local laws or contractual obligations, notwithstanding the broker’s obligation to make such payment. Likewise, when the client pays premiums for these policies to brokers for payment over to us, these premiums are considered to have been paid and, in most cases, the client will no longer be liable to us for those amounts, whether or not we actually receive the premiums from the brokers. Consequently, we will assume a degree of credit risk associated with brokers with whom we work with respect to most of our reinsurance business.
We could incur substantial losses and reduced liquidity if one of the financial institutions we use in our operations fails.
We have exposure to counterparties in many different industries and routinely execute transactions with counterparties in the financial services industry, including brokers and dealers, commercial banks, and other institutions. Many of these transactions expose us to credit risk in the event of default of our counterparty. In addition, with respect to secured transactions, our credit risk may be exacerbated when the collateral held by us cannot be realized or is liquidated at prices not sufficient to recover the full amount of the obligation.
We maintain cash balances, including restricted cash held in trust accounts, significantly in excess of the FDIC insurance limits at various depository institutions. We also maintain cash balances in foreign banks and institutions. If one or more of these financial institutions were to fail, our ability to access cash balances may be temporarily or permanently limited, which could have a material adverse effect on our results of operations, financial condition or cash flows.
Liquidity, Capital Resources and Investments
A significant amount of our invested assets are subject to changes in interest rates and market volatility. If we were unable to realize our investment objectives, our financial condition and results of operations may be adversely affected.
Investment income is an important component of our net income. We currently plan to invest approximately 90-95% of our investments in high grade marketable fixed income securities, cash and cash equivalents, and up to approximately 5-10% in other securities which may include high-yield securities and equity securities. At December 31, 2015, the fixed income securities of $4.1 billion in our investment portfolio represented 92.3% of our total cash and investments, of which $11.8 million or 0.3% were in other investments, a combination of investments in limited partnerships and equity investments. As a result of market conditions prevailing at a particular time, the allocation of our portfolio to various asset types may vary from these targets at times. The fair market value of these assets and the investment income from these assets will fluctuate depending on general economic and market conditions. As we currently classify 85.2% of our fixed maturity investments as available-for-sale ("AFS"), changes in the market value of our securities are reflected in shareholders’ equity. The remainder of our fixed maturity investments are held-to-maturity ("HTM") and carried at amortized cost.
Our Board of Directors has established our investment policies and our executive management is implementing our investment strategy with the assistance of AII Insurance Management Limited, our investment manager. Although these guidelines stress diversification and capital preservation, our investment results will be subject to a variety of risks, including risks related to changes in the business, financial condition or results of operations of the entities in which we invest, as well as changes in general economic conditions and overall market conditions, interest rate fluctuations and market volatility.
Our investment portfolio consists almost completely of interest rate-sensitive instruments, such as bonds, which may be adversely affected by changes in interest rates. Interest rates are highly sensitive to many factors, including governmental monetary policies and domestic and international economic and political conditions and other factors beyond our control. Changes in interest rates could have an adverse effect on the value of our investment portfolio and future investment income. For example, changes in interest rates can expose us to prepayment risks on mortgage-backed securities ("MBS") included in our investment portfolio (all U.S. government agency bonds are currently "AA+" rated by S&P). Increases in interest rates will decrease the value of our investments in fixed-income securities. If increases in interest rates occur during periods when we sell investments to satisfy liquidity needs, we may experience investment losses. If interest rates decline, reinvested funds will earn less than expected.
Certain categories of fixed income securities can experience significant price declines for reasons unrelated to interest rates. Since 2007, global financial markets and credit markets in particular have experienced unprecedented volatility due to the effects of global economic weakness and resulting fiscal and monetary crises. Both the U.S. and other sovereign governments, particularly in Europe, have enacted and continue to enact significant fiscal and monetary measures which have elevated levels of liquidity in the credit market in order to ensure economic stability and sustain recent limited economic growth. These measures have reduced interest rates to historically low levels and could continue to affect many types of fixed income securities, continuing the current
29
period of higher than average price volatility. Based on the statements of the U.S. Federal Reserve and other central banks globally, this period of low interest rates is widely expected to continue for at least the next two years.
In order to limit our exposure to unexpected interest rate increases which would reduce the value of our fixed income securities and reduce our shareholders' equity, we attempt to maintain the duration of our fixed maturity investment portfolio combined with our cash and cash equivalents, both restricted and unrestricted, within a reasonable range of the duration of our loss reserves. At December 31, 2015 and 2014, these respective durations in years were as follows:
For the Year Ended December 31, | 2015 | 2014 | ||
AFS fixed maturities and cash and cash equivalents | 4.7 | 4.1 | ||
Reserve for loss and LAE | 4.4 | 4.4 | ||
The differential in duration between these assets and liabilities may fluctuate over time and in the case of fixed maturities, is affected by factors such as market conditions, asset allocations and prepayment speeds in the case of MBS.
While we believe we have substantially mitigated our exposure to liquidity risk through prudent duration management and strong operating cash flow. However, if we do not structure our investment portfolio so that it is appropriately matched with our reinsurance liabilities or our operating cash flow declines, we may be forced to liquidate investments prior to maturity at a significant loss to cover such liabilities. For this or any of the other reasons discussed above, investment losses could significantly decrease our asset base, which would adversely affect our ability to conduct business. Any significant decline in our investment income would adversely affect our business, financial condition and results of operations.
The determination of the fair values of the Company’s investments and whether a decline in the fair value of an investment is other-than-temporary are based on management’s judgment and may prove to be incorrect.
The Company holds a significant amount of assets without readily available, active, quoted market prices or for which fair value cannot be measured from actively quoted prices. These assets are generally deemed to require a higher degree of judgment used in measuring fair value. The assumptions used by management to measure fair values could turn out to be wrong and the actual amounts that may be realized in an orderly transaction with a willing market participant could be either lower or higher than the Company’s estimates of fair value. The Company reviews its investment portfolio for factors that may indicate that a decline in the fair value of an investment is other-than-temporary. This evaluation is based on subjective factors, assumptions and estimates and may prove to be materially incorrect, which may result in the Company recognizing additional losses in the future as new information emerges or recognizing losses currently that may never materialize in the future in an orderly transaction with a willing market participant.
We may require additional capital in the future, which may not be available on favorable terms or at all.
Our future capital requirements will depend on many factors, including our growth and our ability to write new business successfully and to establish premium rates and reserves at levels sufficient to cover our losses. While we have been successful to date in raising the capital necessary to prudently manage our business, our business has grown rapidly and we may need to raise additional funds to further capitalize Maiden Bermuda and Maiden US, or expand our IIS business. We anticipate that any such additional funds would be raised through equity, debt, hybrid financings or entering into retrocession agreements. While we currently have no commitment from any lender with respect to a credit facility or a loan facility, we may enter into an unsecured revolving credit facility or a term loan facility with one or more syndicates of lenders. Any equity, debt or hybrid financing, if available at all, may be on terms that are not favorable to us. If we are able to raise capital through equity financings, the interest of shareholders in our Company would be diluted, and the securities we issue may have rights, preferences and privileges that are senior to those of our common shares.
If our S&P rating is lowered beyond current levels, this could impact our ability to obtain additional debt or hybrid capital at reasonable terms. Similarly, our access to funds may be impaired if regulatory authorities take negative actions against us. Our internal sources of liquidity may prove to be insufficient, and in such case, we may not be able to successfully obtain additional financing on favorable terms, or at all.
In addition to company-specific factors, the availability of additional financing will depend on a variety of other factors such as market conditions, the general availability of capital, the volume of trading activities and the overall availability of capital to the financial services industry. As such, we may be forced to delay raising capital, issue shorter maturity securities than we prefer, or bear an unattractive cost of capital which could decrease our profitability and significantly reduce our financial flexibility. If we cannot obtain adequate capital, our business prospects, results of operations and financial condition could be adversely affected.
We have debt and preference shares outstanding that could adversely affect our financial flexibility.
In connection with the Senior Note Offerings, Maiden NA has issued Senior Notes in the principal amount of $360.0 million, which is subject to a guarantee by Maiden Holdings. We have also issued $480.0 million in Preference Shares since 2012, the dividends of which are required to be paid before common shareholders are eligible for dividend payments. We may also incur
30
additional indebtedness in the future. The level of debt outstanding could adversely affect our financial flexibility. Our indebtedness could have adverse consequences, including:
• | limiting our ability to pay dividends to our common shareholders; |
• | increasing our vulnerability to changing economic, regulatory and industry conditions; |
• | limiting our ability to compete and our flexibility in planning for, or reacting to, changes in our business and the industry; |
• | limiting our ability to borrow additional funds; |
• | requiring us to dedicate a substantial portion of our cash flow from operations to payments on our debt, thereby, reducing funds available for working capital, capital expenditures, acquisitions and other purposes; and |
• | impacting rating agencies and regulators assessment of our capital position, adequacy and flexibility and therefore, the financial strength ratings of rating agencies and regulators assessment of our solvency. |
Our failure to comply with restrictive covenants contained in the indentures governing our Senior Notes or any future credit facility could trigger prepayment obligations, which could adversely affect our business, financial condition and results of operations.
The indentures governing our Senior Notes contain covenants that impose restrictions on us and certain of our subsidiaries with respect to, among other things, the incurrence of liens and the disposition of capital stock of these subsidiaries. In addition, any future credit facility may require us and/or certain of our subsidiaries to comply with certain covenants, which may include the maintenance of a minimum consolidated net tangible worth and restrictions on the payment of dividends. Our failure to comply with these covenants could result in an event of default under the indentures or any future credit facility, which, if not cured or waived, could result in us being required to repay the notes or any amounts outstanding under such credit facility prior to maturity. As a result, our business, financial condition and results of operations could be adversely affected. For more details on our indebtedness, see "Notes to Consolidated Financial Statements Note 7. Long-Term Debt" included under Item 8 "Financial Statements and Supplementary Data" of this Form 10-K.
The Preference Shares are equity and are subordinate to our existing and future indebtedness and other liabilities.
The Preference Shares are equity interests and do not constitute indebtedness. As such, the Preference Shares will rank junior to all of our indebtedness and other non-equity claims of our creditors with respect to assets available to satisfy the claims during liquidation. At December 31, 2015, our total consolidated debt was $360.0 million and our total consolidated liabilities were $4.4 billion. We may incur additional debt and liabilities in the future. Our existing and future indebtedness may restrict payments of dividends on the Preference Shares. Additionally, unlike indebtedness, where principal and interest would customarily be payable on specified due dates, in the case of preference shares, dividends are payable only if declared by our Board of Directors (or a duly authorized committee of the Board).
The availability and cost of security arrangements for reinsurance transactions may materially impact our ability to provide reinsurance from Bermuda to insurers domiciled in the U. S.
Maiden Bermuda is not licensed, approved or accredited as a reinsurer anywhere in the U.S. and, therefore, under the terms of most of its contracts with U.S. ceding companies, it is required to provide collateral to its ceding companies for unpaid ceded liabilities, including when our obligations to these ceding companies exceed negotiated amounts, in a form acceptable to state insurance commissioners. Typically, this type of collateral takes the form of letters of credit issued by a bank, the establishment of a trust, or funds withheld. The amount of collateral we are required to provide typically represents a portion of the obligations we may owe the ceding company, often including estimates of unpaid losses made by the ceding company. Since we may be required to provide collateral based on the ceding company's estimate, we may be obligated to provide collateral that exceeds our estimates of the ultimate liability to the ceding company. It is also unclear what, if any, the impact would be in the event of the liquidation of a ceding company with which we have a collateral arrangement. If these facilities are unavailable, not sufficient or if we are unable to arrange for other types of security on commercially acceptable terms, Maiden Bermuda’s ability to provide reinsurance to U.S. based clients may be severely limited. At December 31, 2015, 90.7% of the collateral provided by Maiden Bermuda was in the form of trusts.
International Operations
Our offices that operate in jurisdictions outside Bermuda and the U.S. are subject to certain limitations and risks that are unique to foreign operations.
Our international operations are regulated in various jurisdictions with respect to licensing requirements, currency, reserves, employees and other matters. International operations may be harmed by political developments in foreign countries, which may be hard to predict in advance. Regulations governing technical reserves and remittance balances in some countries may hinder remittance of profits and repatriation of assets.
31
Foreign currency fluctuations may reduce our net income and our capital levels adversely affecting our financial condition.
We conduct business in a variety of non-U.S. currencies, the principal exposures being the euro, the British pound, the Canadian dollar and the Swedish krona. Assets and liabilities denominated in foreign currencies are exposed to changes in currency exchange rates. Our reporting currency is the U.S. dollar, and exchange rate fluctuations relative to the U.S. dollar may materially impact our results and financial position. Our principal exposure to foreign currency risk is our obligation to settle claims in foreign currencies. In addition, we maintain and expect to continue to maintain a portion of our investment portfolio in investments denominated in currencies other than the U.S. dollar. While the Company may be able to match its foreign currency denominated assets against its net reinsurance liabilities both by currency and duration to protect the Company against foreign exchange and interest rate risks, a natural offset does not exist for all currencies.
We may employ various strategies (including hedging) to manage our exposure to foreign currency exchange risk. To the extent that these exposures are not fully hedged or the hedges are ineffective, our results or equity may be reduced by fluctuations in foreign currency exchange rates that could materially adversely affect our financial condition and results of operations. At December 31, 2015, no such hedges or hedging strategies were in force or had been entered into.
If the European common currency, the euro, were to be devalued, undergo structural changes or in an extreme scenario collapse, in its participating countries or the basis on which they participate, we could be impacted, potentially significantly by the subsequent effects of such a circumstance.
We conduct business in countries in which the euro is the local currency. We report our financial results in U.S. dollars and use widely reported exchange rates to convert this currency into U.S. dollars. Countries whose currency is the euro have experienced significant economic uncertainty in recent years, which continues through the present time. These circumstances are the cumulative result of the effect of excessive sovereign debt, deficits by numerous participating countries in the euro, uncertainty regarding the monetary policies of the EU and their underlying funding mechanisms and poor economic growth and prospects for the EU as a whole.
While economic policy measures and commitments have stabilized the currency's volatility, the EU's fiscal outlook remains negative, and permanent solutions to resolve these issues by participating countries and other institutions to stabilize the EU and improve its economic outlook have not been resolved.
Irrespective of the ultimate future of the currency, the impact of these efforts may cause a further deterioration in the value of the euro and consequently exacerbate instability in global credit markets, and increase credit concerns resulting in the widening of bond yield spreads. The impact of these developments, while potentially severe, remains extremely difficult to predict. However, should European governments default on their obligations, there will be a negative impact on government and non-government issued bonds, government guaranteed corporate bonds and bonds and equities issued by financial institutions and held within the country of default which in turn could adversely impact Euro-denominated assets held in our investment portfolio.
For the year ended December 31, 2015, 9.4% of our net premiums written and 11.2% of our reserve for loss and LAE is euro denominated. At December 31, 2015 our fixed income portfolio contains: (1) $21.3 million of euro-denominated non-U.S. government and supranational bonds, which constitute 0.5% of the fixed income portfolio; and (2) $278.0 million of euro-denominated corporate bonds, which constitutes 6.8% of the fixed income portfolio. Of the euro-denominated non-U.S. government bonds, 52.5% were from Germany and the State of Israel. We hold no sovereign bonds of Greece, Ireland, Italy, Portugal or Spain.
Regulation
Compliance by our insurance subsidiaries with the legal and regulatory requirements to which they are subject is expensive. Any failure to comply could have a material adverse effect on our business.
Our insurance subsidiaries are required to comply with a wide variety of laws and regulations applicable to insurance or reinsurance companies, both in the jurisdictions in which they are organized and where they sell their insurance and reinsurance products. The insurance and regulatory environment, in particular for offshore insurance and reinsurance companies, has become subject to increased scrutiny in many jurisdictions, including the U.S., various states within the U.S. and the EU. In the past, there have been Congressional and other initiatives in the U.S. regarding increased supervision and regulation of the insurance industry. It is not possible to predict the future impact of changes in laws and regulations on our operations. The cost of complying with any new legal requirements affecting our subsidiaries could have a material adverse effect on our business.
In addition, our subsidiaries may not always be able to obtain or maintain necessary licenses, permits, authorizations or accreditations. They also may not be able to fully comply with, or to obtain appropriate exemptions from, the laws and regulations applicable to them. Any failure to comply with applicable law or to obtain appropriate exemptions could result in restrictions on either the ability of the company in question, as well as potentially its affiliates, to do business in one or more of the jurisdictions in which they operate or on brokers on which we rely to produce business for us. In addition, any such failure to comply with applicable laws or to obtain appropriate exemptions could result in the imposition of fines or other sanctions. Any of these sanctions could have a material adverse effect on our business. To date, no fine, penalty or restriction has been imposed on us for failure to comply with any insurance law or regulation.
32
Insurance statutes and regulations in jurisdictions outside and inside the U.S. could affect our profitability and restrict our ability to operate.
Maiden Bermuda is licensed as a Bermuda insurance company and is subject to regulation and supervision in Bermuda. The applicable Bermuda statutes and regulations generally are designed to protect insureds and ceding insurance companies, not our shareholders. We do not intend Maiden Bermuda to be registered or licensed as an insurance company in any jurisdiction outside Bermuda or to conduct any insurance or reinsurance activities in the U.S. or elsewhere outside of Bermuda. Nevertheless, we expect that a large portion of the gross premiums written by Maiden Bermuda will be derived from (1) the Reinsurance Agreement with AII, and (2) from reinsurance contracts entered into with entities mostly domiciled in the U.S. and Europe. Inquiries into or challenges to the insurance activities of Maiden Bermuda may still be raised by U.S. or European insurance regulators in the future.
In addition, even if Maiden Bermuda, as a reinsurer, is not directly regulated by applicable laws and regulations governing insurance in the jurisdictions where its ceding companies operate, these laws and regulations, and changes in them, can affect the profitability of the business that is ceded to Maiden Bermuda, and thereby affect our results of operations. The laws and regulations applicable to direct insurers could indirectly affect us in other ways as well, such as collateral requirements in various U.S. states to enable such insurers to receive credit for reinsurance ceded to us.
In the past, there have been Congressional and other proposals in the U.S. regarding increased supervision and regulation of the insurance industry, including proposals to supervise and regulate reinsurers domiciled outside the U.S. Our exposure to potential regulatory initiatives could be heightened by the fact that Maiden Bermuda is intended to be domiciled in, and operate exclusively from, Bermuda. Bermuda is a small jurisdiction and may be disadvantaged when participating in global or cross-border regulatory matters compared with larger jurisdictions such as the U.S. or the leading EU countries.
If Maiden Bermuda were to become subject to any insurance laws and regulations of the U.S. or any U.S. state, which are generally more restrictive than Bermuda laws and regulations, at any time in the future, it might be required to post deposits or maintain minimum surplus levels and might be prohibited from engaging in lines of business or from writing specified types of policies or contracts. Complying with those laws could have a material adverse effect on our ability to conduct business and on our financial condition and results of operations.
In recent years, the state insurance regulatory framework in the U.S. has come under increased federal scrutiny, and some state legislatures have considered or enacted laws that may alter or increase state authority to regulate insurance and reinsurance companies and insurance holding companies. Further, the NAIC and state insurance regulators are re-examining existing laws and regulations, specifically focusing on modifications to holding company regulations, interpretations of existing laws and the development of new laws. Any proposed or future legislation or NAIC initiatives may be more restrictive than current regulatory requirements or may result in higher costs.
In 2008, the BMA introduced new risk-based capital standards for insurance companies as a tool to assist the BMA both in measuring risk and in determining appropriate levels of capitalization. The amended Bermuda insurance statutes and regulations pursuant to the new risk-based supervisory approach required additional filings by insurers to be made to the BMA. The required statutory capital and surplus of our Bermuda-based operating subsidiary increased under the BSCR. While our Bermuda-based operating subsidiary currently has adequate capital and surplus under these new requirements, there can be no assurance that such requirement or similar regulations, in their current form or as may be amended in the future, will not have a material adverse effect on our business, financial condition or results of operations.
Europe
Within the EU, the EU Reinsurance Directive of November 2005 (the "Directive") was adopted. Member States of the EU and the European Economic Area ("EEA") were required to implement this by December 2007, however, several Member States were late in the implementation of the Directive and, in a few cases, further legislation is still necessary. The Directive requires member countries to lift barriers to trade within the EU for companies that are domiciled in an EU country, therefore, allowing reinsurers established in the EU to provide services to all EEA states. As a result, Maiden LF, being established in Sweden and regulated by the Swedish Finansinspektionen ("Swedish FSA"), is able, subject to regulatory notifications and there being no objection from the Swedish FSA and the Member States concerned, to provide insurance and reinsurance services in all EEA Member States.
The Directive also does not prohibit EEA insurers from obtaining reinsurance from reinsurers licensed outside the EEA. As such, and subject to the specific rules in particular Member States, Maiden Bermuda may do business from Bermuda with insurers in EEA Member States, but it may not directly operate its reinsurance business within the EEA. Currently, each individual EEA Member State may impose conditions on reinsurance provided by Bermuda based reinsurers which could restrict their future provision of reinsurance to the EEA Member State concerned. A number of EEA Member States currently restrict the extent to which Bermudian reinsurers may promote their services in those Member States, and a few have certain prohibitions on the purchase of insurance from reinsurers not authorized in the EEA.
Solvency II was adopted by the European Parliament in April of 2009. The EU’s executive body, the European Commission ("EC") had previously scheduled January 1, 2014 for implementation of Solvency II but this has been delayed until a start date of January 1, 2016. Solvency II is a principles-based regulatory regime which seeks to promote financial stability, enhance transparency and facilitate harmonization among insurance and reinsurance companies within the EU. Solvency II employs a risk-based approach to setting capital requirements for insurers and reinsurers. The Solvency II directive proposes that EU and non-EU reinsurers shall be treated in the same way provided that the non-EU jurisdiction is found to have a regulatory regime "equivalence" to that of
33
Solvency II. Our reinsurance subsidiaries are headquartered in non-EU countries. If the regulatory regimes of such countries are found not to be equivalent to that of Solvency II and if our reinsurance subsidiaries fall below a certain minimum credit rating, then cedants in the EU may be prevented from recognizing the reinsurance provided to them by our reinsurance subsidiaries for the purpose of meeting their capital requirements or we may be required to provide additional collateral for our obligations to EU insurers.
On November 26, 2015, the EC recognized the BMA's prudential framework for (re)insurance and group supervision as being fully equivalent to regulatory standards applied to European reinsurance companies and insurance groups in accordance with the requirements of the Solvency II Directive subject to a three month review by the EC. Once the review is finalized, the equivalence decision will be applied for an unlimited period retroactively from January 1, 2016.
United States
In the U.S., licensed reinsurers are highly regulated and must comply with financial supervision standards comparable to those governing primary insurers. For additional discussion of the regulatory requirements to which Maiden Holdings, as a holding company, and its subsidiaries are subject, see Item 1 "Business — Regulatory Matters" in this Form 10-K. Any failure to comply with applicable laws could result in the imposition of significant restrictions on our ability to do business, and could also result in fines and other sanctions, any or all of which could materially adversely affect our financial condition and results of operations. In addition, these statutes and regulations may, in effect, restrict the ability of our subsidiaries to write new business or, as indicated below, distribute funds to Maiden Holdings. In recent years, some U.S. state legislatures have considered or enacted laws that may alter or increase state authority to regulate insurance companies and insurance holding companies. Moreover, the NAIC and state insurance regulators regularly re-examine existing laws and regulations and interpretations of existing laws and develop new laws. The new interpretations or laws may be more restrictive or may result in higher costs to us than current statutory requirements.
In addition, the federal government has undertaken initiatives, including Dodd-Frank, in several areas that may impact the reinsurance industry, including tort reform, corporate governance and the taxation of reinsurance companies. Dodd-Frank became effective on July 21, 2011. In addition to introducing sweeping reform of the U.S. financial services industry, Dodd-Frank has changed the regulation of reinsurance in the U.S. Dodd-Frank prohibits a state from denying credit for reinsurance if the state of domicile of the insurer purchasing the reinsurance recognizes credit for reinsurance. At present, it appears the changes specific to reinsurance in Dodd-Frank will not have a material adverse effect for non-U.S. reinsurers such as us, however, there is still significant uncertainty as to how these and other provisions of Dodd-Frank will be implemented in practice.
Applicable insurance laws regarding the change of control of insurance companies may limit the acquisition of our shares.
Under Bermuda law, for so long as Maiden Holdings has an insurance subsidiary registered under the Insurance Act, the BMA may at any time, by written notice, object to a person holding 10% or more of its common shares if it appears to the BMA that the person is not or is no longer fit and proper to be such a holder. In such a case, the BMA may require the shareholder to reduce its holding of common shares in Maiden Holdings and direct, among other things, that such shareholder’s voting rights attaching to the common shares shall not be exercisable. A person who does not comply with such a notice or direction from the BMA will be guilty of an offense and shall be liable on summary conviction to a fine of $25,000 (and to an additional fine of $500 for each day on which the offense has continued), or, if convicted on indictment, to a fine of $100,000 and/or two years in prison. In addition, a person holding 10% or more of the company’s common shares is not permitted to reduce or dispose of its holdings such that the proportion of the voting rights held by the shareholder will reach or fall below 10%, 20%, 33% or 50%, as the case may be, unless that shareholder has served on the BMA a notice in writing that it intends to do so. A person who has reduced or disposed of his holding in the company, where the proportion of the voting rights held by him will have reached or has fallen below 10%, 20%, 33% or 50%, as the case may be, without notifying the BMA of their intention to do so will be guilty of an offense and shall be liable on summary conviction to a fine of $25,000. This may discourage potential acquisition proposals and may delay, deter or prevent a change of control of our Company, including through transactions, and in particular unsolicited transactions, that some or all of our shareholders might consider to be desirable.
In addition to the foregoing, we are subject to U.S. state statutes governing insurance holding companies, which generally require that any person or entity desiring to acquire direct or indirect control of any of our U.S. insurance company subsidiaries obtain prior regulatory approval. "Control" is generally defined as the possession, direct or indirect, of the power to direct or cause the direction of the management and policies of the company, whether through the ownership of voting securities, by contract (except a commercial contract for goods or non-management services) or otherwise. Under the laws of most U.S. states, any beneficial owner of 10% or more of the outstanding voting securities of an insurance company or its holding company is presumed to have acquired control, unless this presumption is rebutted. These laws may also discourage potential acquisition proposals and may delay, deter or prevent a change of control of our company, including through transactions, and in particular unsolicited transactions, that some or all of our shareholders might consider to be desirable.
Any person having a shareholding of 10% or more of the issued share capital in Maiden Holdings would be considered to have an indirect holding in our U.S. insurance subsidiaries at or over the 10% limit. Any change that resulted in the indirect acquisition or disposal of a shareholding of greater than or equal to 10% in the share capital of Maiden Holdings may require approval of the relevant U.S. state insurance regulators prior to the transaction.
34
Changes in accounting principles and financial reporting requirements could result in material changes to our reported results and financial condition.
U.S. GAAP and related financial reporting requirements are complex, continually evolving and may be subject to varied interpretation by the relevant authoritative bodies. Such varied interpretations could result from differing views related to specific facts and circumstances. Changes in U.S. GAAP and financial reporting requirements, or in the interpretation of U.S. GAAP or those requirements, could result in material changes to our reported results and financial condition.
Employee Issues
We are dependent on our key executives. We may not be able to attract and retain key employees or successfully integrate our new management team to fully implement our newly formulated business strategy.
Our success depends largely on our senior management, which includes, among others, Arturo M. Raschbaum, our President and CEO, Karen L. Schmitt, our CFO, Thomas H. Highet, our President of Maiden US, Patrick J. Haveron, our Executive Vice President and President of Maiden Bermuda, and Lawrence F. Metz, our Senior Vice President, General Counsel and Secretary. We have entered into employment agreements with each of these executive officers, as well as other key employees. Our inability to attract and retain additional personnel or the loss of the services of any of our senior executives or key employees could delay or prevent us from fully implementing our business strategy and could significantly and negatively affect our business.
Our business in Bermuda could be adversely affected by Bermuda employment restrictions.
Currently, we employ seventeen non-Bermudians in our Bermuda office including our President and CEO, our CFO, Maiden Bermuda's President and Maiden Bermuda's Chief Underwriting Officer. We may hire additional non-Bermudians as our business grows. Under Bermuda law, non-Bermudians (other than spouses of Bermudians, holders of permanent residents’ certificates and holders of working residents’ certificates) may not engage in any gainful occupation in Bermuda without a valid government work permit. A work permit may be granted or renewed upon showing that, after proper public advertisement, no Bermudian, spouse of a Bermudian, or holder of a permanent resident’s or working resident’s certificate who meets the minimum standards reasonably required by the employer has applied for the job. Work permits are issued with expiry dates that range from one, three, five, six or, in certain circumstances for key executives, ten years. We may not be able to use the services of one or more of our non-Bermudian employees if we are not able to obtain work permits for them, which could have a material adverse effect on our business, financial condition and results of operations.
Corporate Governance
Our holding company structure and certain regulatory and other constraints affect our ability to pay dividends and make other payments.
Maiden Holdings is a holding company. As a result, we do not have, and will not have, any significant operations or assets other than our ownership of the shares of our subsidiaries.
We expect that dividends and other permitted distributions from Maiden Bermuda, Maiden Global (and its subsidiaries), Maiden LF and Maiden NA (and its subsidiaries) will be our sole source of funds to pay dividends to common and preference shareholders and meet ongoing cash requirements, including debt service payments, if any, and other expenses. The inability of our subsidiaries to pay dividends in an amount sufficient to enable us to meet our cash requirements at the holding company level could have a material adverse effect on our business, financial condition and results of operations. We are also subject to Bermuda regulatory constraints that will affect our ability to pay dividends on our shares and make other payments. Under the Companies Act, we may declare or pay a dividend out of distributable reserves only if we have reasonable grounds for believing that we are, or would after the payment be, able to pay our liabilities as they become due and if the realizable value of our assets would thereby not be less than our liabilities.
Maiden Bermuda is prohibited from declaring or paying dividends of more than 25% of its total statutory capital and surplus, as shown in its previous financial year statutory balance sheet, unless at least seven days before payment of the dividends it files with the BMA an affidavit that it will continue to satisfy the required margins following declaration of those dividends, though there is no additional requirement for BMA approval. In addition, Maiden Bermuda must obtain the BMA’s prior approval before reducing its total statutory capital, as shown in its previous financial year statutory balance sheet, by 15% or more, such application should consist of an affidavit signed by at least two directors and the principal representative stating that in their opinion the proposed reduction in capital will not cause Maiden Bermuda to fail to meet its relevant margins, and such other information as the BMA may require. Maiden Bermuda is also restricted in paying dividends that would result in Maiden Bermuda failing to comply with the ECR as calculated based on the BSCR or cause Maiden Bermuda to fail to meet its relevant margins. At December 31, 2015, Maiden Bermuda has the ability to pay dividends or distributions not exceeding $322.3 million without prior regulatory approval.
The timing and amount of any cash dividends on our common shares are at the discretion of the Board of Directors and will depend upon result of operations and cash flows, our financial position and capital requirements, and any other factors that our Board of Directors deems relevant.
35
The ability of Maiden US to pay dividends is regulated, and under certain circumstances, restricted, pursuant to applicable law. If Maiden US cannot pay dividends to Maiden NA, Maiden NA may not, in turn, be able to pay dividends to Maiden Holdings. At December 31, 2015, Maiden US currently cannot pay dividends to Maiden NA.
A few significant shareholders may influence or control the direction of our business. If the ownership of our common shares continues to be highly concentrated, it may limit your ability and the ability of other shareholders to influence significant corporate decisions.
The interests of our Founding Shareholders may not be fully aligned with our interests, and this may lead to a strategy that is not in our best interest. As of February 19, 2016, our Founding Shareholders beneficially control approximately 20.3% of our outstanding common shares. Although they do not have any voting agreements or arrangements, our Founding Shareholders could exercise significant influence over matters requiring shareholder approval, and their concentrated holdings may delay or deter possible changes in control of Maiden Holdings, which may reduce the market price of our common shares.
We currently intend to pay a quarterly cash dividend of $0.14 per common share; however, any determination to pay dividends will be at the discretion of our board of directors.
Our board of directors currently intends to authorize the payment of a cash dividend of $0.14 per common share each quarter. Any determination to pay dividends will be at the discretion of our board of directors and will be dependent upon our results of operations and cash flows, our financial position and capital requirements, general business conditions, legal, tax, regulatory, rating agency and any contractual restrictions on the payment of dividends and any other factors our board of directors deems relevant, including Bermuda legal and regulatory constraints. Payment of dividends to common shareholders is also predicated on the payment of dividends to holders of Preference Shares before any such common dividend can be paid. If required dividend payments on the Preference Shares are not made, dividends to common shareholders may not be made until such time that Preference Share dividend payments resume.
Dividends on the Series A and Series C Preference Shares are non-cumulative.
Dividends on the Series A and Series C Preference Shares are non-cumulative and payable only out of lawfully available funds of Maiden Holdings under Bermuda law. Consequently, if our Board of Directors (or a duly authorized committee of the Board) does not authorize and declare a dividend for any dividend period with respect to the Series A and Series C Preference Shares, holders of the Series A and Series C Preference Shares would not be entitled to receive any such dividend, and such unpaid dividend will not accumulate and will never be payable. We will have no obligation to pay dividends for a dividend period on or after the dividend payment date for such period if its Board of Directors (or a duly authorized committee of the Board) has not declared such dividend before the related dividend payment date. If dividends on the Series A and Series C Preference Shares are authorized and declared with respect to any subsequent dividend period, we will be free to pay dividends on any other series of preference shares and/or our common shares.
Dividends on the Preference Shares - Series B are cumulative.
Dividends on the Preference Shares - Series B are cumulative and payable only out of lawfully available funds of Maiden Holdings under Bermuda law. We will pay cumulative dividends on each of the Preference Shares - Series B at a rate of 7.25% per annum on the initial liquidation preference of $50 per share (equivalent to $3.625 per annum per Preference Share - Series B or $0.90625 per quarter). Dividends will accrue and accumulate from the date of issuance and, to the extent that we have lawfully available funds to pay dividends and the Board of Directors declares a dividend payable, it will pay dividends quarterly each year commencing on December 15, 2013, up to, and including, September 15, 2016 in cash and on September 15, 2016 or any earlier conversion date in cash, common shares, or a combination thereof, at our election and subject to the share cap, which is an amount per share equal to the product of (i) 2 and (ii) the maximum conversion rate of 4.0322, subject to conversion rate adjustments. No dividend will be declared or paid upon, or any sum set apart for the payment of dividends upon, any outstanding share of the mandatory convertible preference shares with respect to any dividend period unless all dividends for all preceding dividend periods have been declared and paid or declared and a sufficient sum has been set apart for the payment of such dividends upon all outstanding mandatory convertible preference shares.
The conversion rate will be adjusted from time to time if we issue common shares as a dividend, increases the cash dividend from $0.09 per share or in some other cases as described under "Description of the Mandatory Convertible Preference Shares - Conversion Rate Adjustments" of the Form 424B2 Prospectus Supplement filed with the SEC on September 27, 2013.
On November 4, 2015, the Company’s Board of Directors approved an increase in the quarterly dividend payable to common shareholders from $0.13 to $0.14. The dividend will be payable on January 15, 2016 to shareholders of record as of January 1, 2016. Pursuant to the Conversion Rate Adjustment described above, the minimum and maximum conversion rates of 3.2258 and 4.0322, respectively, will be adjusted. The adjusted minimum and maximum conversion rates is determined after the close of business on January 1, 2016 (dividend record date), when the market price of the Company’s common shares is known. The current number of common shares that could possibly be issued on conversion, if conversion after January 1, 2016 was permitted in accordance with the terms and conditions of Form 424B Prospectus Supplement filed with the SEC, is 10,876,642, an increase of 231,481 common shares since October 1, 2013.
36
Our revenues and results of operations may fluctuate as a result of factors beyond our control, which may cause the price of our shares to be volatile.
The revenues and results of operations of reinsurance companies historically have been subject to significant fluctuations and uncertainties. Our profitability can be affected significantly by:
• | fluctuations in interest rates, inflationary pressures and other changes in the investment environment that affect returns on invested assets; |
• | changes in the frequency or severity of claims; |
• | volatile and unpredictable developments, including man-made, weather-related and other natural catastrophes or terrorist attacks; |
• | price competition; |
• | inadequate loss and LAE reserves; |
• | cyclical nature of the property and casualty insurance market; |
• | negative developments in the specialty property and casualty reinsurance sectors in which we operate; and |
• | reduction in the business activities of AmTrust or any of our ceding insurers. |
If our revenues and results of operations fluctuate as a result of one or more of these factors, the price of our shares may be volatile.
Future sales of shares may adversely affect their price.
Future sales of our common shares by our shareholders or us, or the perception that such sales may occur, could adversely affect the market price of our common shares. As of February 19, 2016, 73,862,441 common shares were outstanding. In addition, we have reserved 10,000,000 common shares for issuance under our Amended and Restated 2007 Share Incentive Plan. As of February 19, 2016, the total options outstanding was 1,873,521. Sales of substantial amounts of our shares, or the perception that such sales could occur, could adversely affect the prevailing price of the shares and may make it more difficult for us to sell our equity securities in the future, or for shareholders to sell their shares, at a time and price that they deem appropriate.
Provisions in our bye-laws may reduce or increase the voting rights of our shares.
In general, and except as provided under our bye-laws and as provided below, the common shareholders have one vote for each common share held by them and are entitled to vote, on a non-cumulative basis, at all meetings of shareholders. However, if, and so long as, the shares of a shareholder are treated as "controlled shares" (as determined pursuant to Sections 957 and 958 of the Internal Revenue Code of 1986, as amended (the "IRS Code")) of any U.S. Person (as that term is defined in the risk factors under the section captioned "Taxation" within this Item on page 41 (that owns shares directly or indirectly through non-U.S. entities) and such controlled shares constitute 9.5% or more of the votes conferred by our issued shares, the voting rights with respect to the controlled shares owned by such U.S. Person will be limited, in the aggregate, to a voting power of less than 9.5%, under a formula specified in our bye-laws. The formula is applied repeatedly until the voting power of all 9.5% U.S. Shareholders has been reduced to less than 9.5%. In addition, our board may limit a shareholder’s voting rights when it deems it appropriate to do so to (i) avoid the existence of any 9.5% U.S. Shareholder; and (ii) avoid certain material adverse tax, legal or regulatory consequences to us, to any of our subsidiaries or any direct or indirect shareholder or its affiliates. "Controlled shares" include, among other things, all shares that a U.S. Person is deemed to own directly, indirectly or constructively (within the meaning of section 958 of the IRS Code). The amount of any reduction of votes that occurs by operation of the above limitations will generally be reallocated proportionately among our other shareholders whose shares were not "controlled shares" of the 9.5% U.S. Shareholder so long as such reallocation does not cause any person to become a 9.5% U.S. Shareholder.
Under these provisions, certain shareholders may have their voting rights limited, while other shareholders may have voting rights in excess of one vote per share. Moreover, these provisions could have the effect of reducing the votes of certain shareholders who would not otherwise be subject to the 9.5% limitation by virtue of their direct share ownership.
We are authorized under our bye-laws to request information from any shareholder for the purpose of determining whether a shareholder’s voting rights are to be reallocated under the bye-laws. If any holder fails to respond to this request or submits incomplete or inaccurate information, we may, in our sole discretion, eliminate or adjust the shareholder’s voting rights.
Anti-takeover provisions in our bye-laws could impede an attempt to replace or remove our directors, which could diminish the value of our common shares.
Our bye-laws contain provisions that may entrench directors and make it more difficult for shareholders to replace directors even if the shareholders consider it beneficial to do so. In addition, these provisions could delay or prevent a change of control that a shareholder might consider favorable. For example, these provisions may prevent a shareholder from receiving the benefit
37
from any premium over the market price of our common shares offered by a bidder in a potential takeover. Even in the absence of an attempt to effect a change in management or a takeover attempt, these provisions may adversely affect the prevailing market price of our common shares if they are viewed as discouraging changes in management and takeover attempts in the future.
Examples of provisions in our bye-laws that could have such an effect include the following:
• | our board of directors may reduce the total voting power of any shareholder in order to avoid adverse tax, legal or regulatory consequences to us or any direct or indirect holder of our shares or its affiliates; and |
• | our directors may, in their discretion, decline to record the transfer of any common shares on our share register, if they are not satisfied that all required regulatory approvals for such transfer have been obtained or if they determine such transfer may result in a non-de minimis adverse tax, legal or regulatory consequence to us or any direct or indirect holder of shares or its affiliates. |
It may be difficult for a third party to acquire us.
Provisions of our organizational documents may discourage, delay or prevent a merger, amalgamation, tender offer or other change of control that holders of our shares may consider favorable. These provisions impose various procedural and other requirements that could make it more difficult for shareholders to effect various corporate actions. These provisions could:
• | have the effect of delaying, deferring or preventing a change in control of us; |
• | discourage bids for our securities at a premium over the market price; |
• | adversely affect the price of, and the voting and other rights of the holders of our securities; or |
• | impede the ability of the holders of our securities to change our management. |
In addition, AII, AEL and AIUL are entitled to terminate their quota share agreements if we undergo a change in control. Because we expect the business we reinsure from AmTrust to constitute a substantial portion of our business, this termination right may deter parties who are interested in acquiring us, may prevent shareholders from receiving a premium over the market price of our common shares and may depress the price of our common shares below levels that might otherwise prevail.
U.S. persons who own our shares may have more difficulty in protecting their interests than U.S. persons who are shareholders of a U.S. corporation.
The Companies Act, which applies to us, differs in certain material respects from laws generally applicable to U.S. corporations and their shareholders. As a result of these differences, U.S. persons who own our shares may have more difficulty protecting their interests than U.S. persons who own shares of a U.S. corporation. Set forth below is a summary of certain significant provisions of the Companies Act, including modifications adopted pursuant to our bye-laws, applicable to us which differ in certain respects from provisions of Delaware corporate law. Because the following statements are summaries, they do not discuss all aspects of Bermuda law that may be relevant to us and our shareholders.
Interested Directors. Bermuda law provides that if a director has a personal interest in a transaction to which the company is also a party and if the director discloses the nature of this personal interest at the first opportunity, either at a meeting of directors or in writing to the directors, then the company will not be able to declare the transaction void solely due to the existence of that personal interest and the director will not be liable to the company for any profit realized from the transaction. In addition, Bermuda law and our bye-laws provide that, after a director has made the declaration of interest referred to above, he is allowed to be counted for purposes of determining whether a quorum is present and to vote on a transaction in which he has an interest, unless disqualified from doing so by the chairman of the relevant board meeting. Under Delaware law such transaction would not be voidable if:
• | the material facts as to such interested director’s relationship or interests are disclosed or are known to the board of directors and the board in good faith authorizes the transaction by the affirmative vote of a majority of the disinterested directors; |
• | such material facts are disclosed or are known to the shareholders entitled; |
• | to vote on such transaction and the transaction is specifically approved in good faith by vote of the majority of shares entitled to vote thereon; or |
• | the transaction is fair as to the corporation as of the time it is authorized, approved or ratified. |
Under Delaware law, such interested director could be held liable for a transaction in which such director derived an improper personal benefit.
Mergers and Similar Arrangements. The amalgamation or merger of a Bermuda company with another company or corporation (other than certain affiliated companies) requires the amalgamation agreement to be approved by the company’s board of directors
38
and by its shareholders. Under our bye-laws, we may, with the approval of a majority of votes cast at a general meeting of our shareholders at which a quorum is present, amalgamate or merge with another Bermuda company or with a body incorporated outside Bermuda. In the case of an amalgamation or merger, a shareholder may apply to a Bermuda court for a proper valuation of such shareholder’s shares if such shareholder is not satisfied that fair value has been paid for such shares. Under Delaware law, with certain exceptions, a merger, consolidation or sale of all or substantially all the assets of a corporation must be approved by the board of directors and a majority of the outstanding shares entitled to vote thereon. Under Delaware law, a shareholder of a corporation participating in certain major corporate transactions may, under certain circumstances, be entitled to appraisal rights pursuant to which such shareholder may receive cash in the amount of the fair value of the shares held by such shareholder (as determined by a court) in lieu of the consideration such shareholder would otherwise receive in the transaction.
Shareholders’ Suit. The rights of shareholders under Bermuda law are not as extensive as the rights of shareholders under legislation or judicial precedent in many U.S. jurisdictions. Class actions and derivative actions are generally not available to shareholders under the laws of Bermuda. However, the Bermuda courts ordinarily would be expected to follow English case law precedent, which would permit a shareholder to commence an action in the name of the company to remedy a wrong done to the company where the act complained of is alleged to be beyond the corporate power of the company, is illegal or would result in the violation of our memorandum of association or bye-laws. Furthermore, consideration would be given by the court to acts that are alleged to constitute a fraud against the minority shareholders or where an act requires the approval of a greater percentage of our shareholders than actually approved it. The winning party in such an action generally would be able to recover a portion of attorneys’ fees incurred in connection with such action. Our bye-laws provide that shareholders waive all claims or rights of action that they might have, individually or in the right of the company, against any director or officer for any act or failure to act in the performance of such director’s or officer’s duties, except with respect to any fraud or dishonesty of such director or officer. Class actions and derivative actions generally are available to shareholders under Delaware law for, among other things, breach of fiduciary duty, corporate waste and actions not taken in accordance with applicable law. In such actions, the court has discretion to permit the winning party to recover attorneys’ fees incurred in connection with such action.
Indemnification of Directors. We may indemnify our directors or officers in their capacity as directors or officers of any loss arising or liability attaching to them by virtue of any rule of law in respect of any negligence, default, breach of duty or breach of trust of which a director or officer may be guilty in relation to the company other than in respect of his own fraud or dishonesty. Under Delaware law, a corporation may indemnify a director or officer of the corporation against expenses (including attorneys’ fees), judgments, fines and amounts paid in settlement actually and reasonably incurred in defense of an action, suit or proceeding by reason of such position if such director or officer acted in good faith and in a manner he or she reasonably believed to be in or not opposed to the best interests of the corporation and, with respect to any criminal action or proceeding, such director or officer had no reasonable cause to believe his or her conduct was unlawful. In addition, we have entered into indemnification agreements with our directors and officers.
We are a Bermuda company and it may be difficult for you to enforce judgments against us or our directors and executive officers.
We are incorporated under the laws of Bermuda and our business is based in Bermuda. In addition, most of our directors and officers reside outside Bermuda and a substantial portion of our assets will be and the assets of these persons are, and will continue to be, located in jurisdictions outside Bermuda. As such, it may be difficult or impossible to effect service of process within the U.S. upon us or those persons or to recover against us or them on judgments of U.S. courts, including judgments predicated upon civil liability provisions of the U.S. federal securities laws. Further, no claim may be brought in Bermuda against us or our directors and officers in the first instance for violation of U.S. federal securities laws because these laws have no extraterritorial jurisdiction under Bermuda law and do not have force of law in Bermuda. A Bermuda court may, however, impose civil liability, including the possibility of monetary damages, on us or our directors and officers if the facts alleged in a complaint constitute or give rise to a cause of action under Bermuda law.
We have been previously advised by Conyers Dill & Pearman Limited, our Bermuda counsel, that there is doubt as to whether the courts of Bermuda would enforce judgments of U.S. courts obtained in actions against us or our directors and officers, as well as the experts named in this Report, predicated upon the civil liability provisions of the U.S. federal securities laws or original actions brought in Bermuda against us or these persons predicated solely upon U.S. federal securities laws. Further, we have been advised by Conyers Dill & Pearman Limited that there is no treaty in effect between the U.S. and Bermuda providing for the enforcement of judgments of U.S. courts, and there are grounds upon which Bermuda courts may not enforce judgments of U.S. courts. Some remedies available under the laws of U.S. jurisdictions, including some remedies available under the U.S. federal securities laws, may not be allowed in Bermuda courts as contrary to that jurisdiction’s public policy. Because judgments of U.S. courts are not automatically enforceable in Bermuda, it may be difficult for you to recover against us based upon such judgments.
Relationship with AmTrust
We are dependent on AmTrust and its subsidiaries for a substantial portion of our business.
AmTrust is Maiden’s largest client relationship and we will continue to derive a substantial portion of our business from AmTrust in the near term. We commenced our reinsurance business by providing traditional quota share reinsurance to AmTrust through the Reinsurance Agreement with AmTrust’s Bermuda reinsurance subsidiary, AII, assuming initially a 40% quota share portion of the net liabilities less recoveries of certain lines of business that existed on the effective date. In 2011, we provided additional quota share reinsurance through the European Hospital Liability Quota Share which is a separate one-year, renewable,
39
40% quota share agreement with AEL and AIUL. The European Hospital Liability Quota Share covers those entities' medical liability business in Europe, all of which is in Italy and France at the present time.
We are still dependent, however, on AmTrust and its subsidiaries for a substantial portion of our business and underwriting income. Our Reinsurance Agreement with AII has been renewed for an additional three years (until July 1, 2019), subject to certain early termination provisions (including if the A.M. Best rating of Maiden Bermuda is reduced below "A-"). The Reinsurance Agreement will be extended for additional terms of three years unless either party elects not to renew. There is no assurance that this agreement will not terminate. The termination of the Reinsurance Agreement would significantly reduce our revenues and could have a material adverse effect on us.
At the same time, there are risks related to the business of AmTrust and its insurance subsidiaries that may adversely impact our ability to continue doing business with them. In addition, we are not able to control the types or amounts of reinsurance AmTrust purchases from unaffiliated reinsurers, and any changes AmTrust makes to such reinsurance may affect our profitability and ability to write additional business.
Our initial arrangements with AmTrust were negotiated while we were its affiliate. The arrangements could be challenged as not reflecting terms that we would agree to in arm’s-length negotiations with an independent third party; moreover, our business relationship with AmTrust and its subsidiaries may present, and may make us vulnerable to, possible adverse tax consequences, difficult conflicts of interest, and legal claims that we have not acted in the best interest of our shareholders.
We entered into a quota share agreement with AII, which reinsures AmTrust’s insurance company subsidiaries, and a Master Agreement with AmTrust, pursuant to which Maiden Bermuda entered into the quota share agreement. The asset management agreement with an AmTrust subsidiary, the reinsurance brokerage agreement with an AmTrust subsidiary, the warrants previously issued to our Founding Shareholders (which were exchanged for restricted common shares in September 2010) and the expired provisional employment agreement with our former Chief Executive Officer, Max G. Caviet, were negotiated while we were an affiliate of AmTrust. These circumstances could increase the likelihood that the IRS would claim that the agreements between us and AmTrust were not executed on an arm’s-length basis and any such assertion, if not disproved by us, could result in adverse tax consequences to us.
Because (i) our Founding Shareholders collectively own or control approximately 47.9% of the outstanding shares of AmTrust’s common shares, (ii) our Founding Shareholders sponsored our formation, and (iii) our Founding Shareholders’ common shares represent approximately 20.3% of our outstanding common shares; we, therefore, may be deemed an affiliate of AmTrust. Due to our close business relationship with AmTrust, we may be presented with situations involving conflicts of interest with respect to the agreements and other arrangements we will enter into with AmTrust and its subsidiaries, exposing us to possible claims that we have not acted in the best interest of our shareholders. The arrangements between us and AmTrust were modified somewhat after they were originally entered into and there could be future modifications.
Our non-executive Chairman of the Board currently holds the positions of President, Chief Executive Officer and director of AmTrust, These dual positions may present, and make us vulnerable to, difficult conflicts of interest and related legal challenges.
Barry D. Zyskind, our non-executive Chairman of the Board, is the President, Chief Executive Officer and director of AmTrust and, as such, he does not serve our Company on a full-time basis. Mr. Zyskind is expected to continue in both of his positions for the foreseeable future. Conflicts of interest could arise with respect to business opportunities that could be advantageous to AmTrust or its subsidiaries, on the one hand, and us or our subsidiary, on the other hand. In addition, potential conflicts of interest may arise should the interests of Maiden Holdings and AmTrust diverge. As AmTrust is currently our largest customer, after being our only significant customer until November 2008, and is also expected to remain our largest customer for at least the next several years, AmTrust could have the ability to significantly influence such situations. However, the Audit Committee of our Board of Directors, which consists entirely of independent directors, does review and approve all related party transactions.
Collateral has been provided to AmTrust, AII and AEL in the form of trusts, letters of credit and a loan.
As a result of our use of trust accounts, letters of credit and a loan, a substantial portion of our assets will not be available to us for other uses, which could reduce our financial flexibility. If further collateral is required to be provided to any other AmTrust insurance company subsidiaries under applicable law or regulatory requirements, Maiden Bermuda will provide collateral to the extent required. At December 31, 2015, $2.6 billion was provided as collateral to AmTrust, AII and AEL in the form of trusts, letters of credit and a loan.
Maiden Bermuda is not a party to the reinsurance agreements between AII and AmTrust’s U.S. insurance subsidiaries or the related reinsurance trust agreements and has no rights thereunder. If one or more of these AmTrust subsidiaries withdraws Maiden Bermuda’s assets from their trust account or misapplies withheld funds that are due to Maiden and that subsidiary is or becomes insolvent, we believe it may be more difficult for Maiden Bermuda to recover any such amounts to which we are entitled than it would be if Maiden Bermuda had entered into reinsurance and trust agreements with these AmTrust subsidiaries directly. AII has agreed to immediately return to Maiden Bermuda any collateral provided by Maiden Bermuda that one of those subsidiaries improperly utilizes or retains, and AmTrust has agreed to guarantee AII’s repayment obligation and AII’s payment obligations under its loan agreement with Maiden Bermuda. We are subject to the risk that AII and/or AmTrust may be unable or unwilling to discharge these obligations. In addition, if AII experiences a change in control and Maiden Bermuda chooses not to terminate the Reinsurance Agreement, AmTrust’s guarantee obligations will terminate immediately and automatically.
40
We will not be able to control AmTrust’s decisions relating to its other reinsurance, and AmTrust may change its reinsurance in ways that could adversely affect us.
The reinsurance ceded by AmTrust is net of any reinsurance that AmTrust obtains from unaffiliated reinsurers. For example, Maiden Bermuda will receive 40% of AmTrust’s premiums, net of commissions, in the case of AmTrust’s U.K. subsidiary, and net of reinsurance with unaffiliated reinsurers relating to certain lines of business that existed on the effective date and will be liable for 40% of losses and LAE on these certain lines of ceded business net of any reinsurance recoverable (whether collectible or not) from unaffiliated reinsurers. We are not able to control the types or amounts of reinsurance that AmTrust purchases from unaffiliated reinsurers. If AmTrust chose to purchase additional reinsurance from unaffiliated reinsurers, AmTrust would reduce the premium revenue ceded to us. The purchase of such additional reinsurance would, however, in general inure to our benefit.
Taxation
We may become subject to taxes in Bermuda after 2035, which may have a material adverse effect on our financial condition and operating results and on an investment in our shares.
The Bermuda Minister of Finance, under the Exempted Undertakings Tax Protection Act 1966, as amended, of Bermuda, has given each of Maiden Holdings and Maiden Bermuda an assurance that if any legislation is enacted in Bermuda that would impose tax computed on profits or income, or computed on any capital asset, gain or appreciation, or any tax in the nature of estate duty or inheritance tax, then the imposition of any such tax will not be applicable to Maiden Holdings, Maiden Bermuda or any of their respective operations or their respective shares, debentures or other obligations (except insofar as such tax applies to persons ordinarily resident in Bermuda or to any taxes payable by them in respect of real property or leasehold interests in Bermuda held by them) until March 31, 2035. Given the limited duration of the Minister of Finance’s expected assurance, we cannot be certain that we will not be subject to any Bermuda tax after March 31, 2035. Since Maiden Holdings and Maiden Bermuda are incorporated in Bermuda, we will be subject to changes of law or regulation in Bermuda that may have an adverse impact on our operations, including imposition of tax liability.
The financial results of our operations may be affected by measures taken in response to the OECD BEPS project.
On July 19, 2013, the Organisation for Economic Co-operation and Development published its Action Plan on Base Erosion and Profit Shifting (the "BEPS Action Plan"), in an attempt to coordinate multilateral action on international tax rules. The recommended actions include an examination of the definition of a "permanent establishment" and the rules for attributing profit to a permanent establishment. Other recommended actions relate to the goal of ensuring that transfer pricing outcomes are in line with value creation, noting that the current rules may facilitate the transfer of risks or capital away from countries where the economic activity takes place. Any changes in Australian, German, Irish, Russian, Swedish, U.K.or U.S. tax law in response to the BEPS Action Plan could adversely affect the Company's liability to tax.
Our operations may be affected by the introduction of a EU financial transaction tax ("FTT").
On February 14, 2013, the EU Commission published a proposal for a Directive for a common FTT in those EU Member States which choose to participate (''the FTT Zone"), currently Belgium, Germany, Estonia, Greece, Spain, France, Italy, Austria, Portugal, Slovenia and Slovakia.
The proposed FTT has broad scope and would apply to financial transactions where at least one party to the transaction is established in the FTT Zone and either that party or another party is a financial institution established in the FTT Zone. "Financial institution" covers a wide range of entities, including insurance and reinsurance undertakings. "Financial transaction" includes the sale and purchase of a financial instrument, a transfer of risk associated with a financial instrument and the conclusion or modification of a derivative. The proposed minimum rate of tax is 0.1% of the consideration, or 0.01% of the notional amount in relation to a derivative. A financial institution may be deemed to be "established" in the FTT Zone even if it has no business presence there, if the underlying financial instrument is issued in the FTT Zone.
The FTT proposal remains subject to negotiation between the participating EU Member States. It may therefore be altered prior to any implementation, the timing of which remains unclear. The current plan is to implement a FTT on a progressive basis, with the first phase applying from January 1, 2016. The introduction of FTT in this or similar form could have an adverse effect on the Company's economic performance.
We may be subject to U.S. federal income tax, which would have an adverse effect on our financial condition and results of operations and on an investment in our shares.
If either Maiden Holdings or Maiden Bermuda were considered to be engaged in a trade or business in the U.S., it could be subject to U.S. federal income and additional branch profits taxes on the portion of its earnings that are effectively connected to such U.S. business or in the case of Maiden Bermuda, if it is entitled to benefits under the U.S. income tax treaty with Bermuda and if Maiden Bermuda were considered engaged in a trade or business in the U.S. through a permanent establishment, Maiden Bermuda could be subject to U.S. federal income tax on the portion of its earnings that are attributable to its permanent establishment in the U.S., in which case its results of operations could be materially adversely affected. Maiden Holdings and Maiden Bermuda are Bermuda companies. We intend to manage our business so that each of these companies should operate in such a manner that
41
neither of these companies should be treated as engaged in a U.S. trade or business and, thus, should not be subject to U.S. federal taxation (other than the U.S. federal excise tax on insurance and reinsurance premium income attributable to insuring or reinsuring U.S. risks and U.S. federal withholding tax on certain U.S. source investment income). However, because (i) there is considerable uncertainty as to activities which constitute being engaged in a trade or business within the U.S.; (ii) a significant portion of Maiden Bermuda’s business is reinsurance of AmTrust’s insurance subsidiaries; (iii) our non-executive Chairman of the Board is AmTrust’s President and Chief Executive Officer, and certain of our executive officers or directors and former executive officers are also either executive officers of AmTrust or related to directors of AmTrust, including (a) our former interim Chief Financial Officer for part of 2007 was at the time and is AmTrust’s Chief Financial Officer, (b) our former Chief Executive Officer is currently an executive officer of AmTrust, and (c) one of our directors is related to a significant shareholder of AmTrust; (iv) one of our Founding Shareholders, Michael Karfunkel, controls NGHC; (v) we have an asset management agreement with a subsidiary of AmTrust and may also have additional contractual relationships with AmTrust and its subsidiaries in the future, and (vi) the activities conducted outside the U.S. related to Maiden Bermuda’s start-up were limited, we cannot be certain that the IRS will not contend successfully that we are engaged in a trade or business in the U.S.
Holders of 10% or more of our shares may be subject to U.S. income taxation under the controlled foreign corporation rules.
If you are a "10% U.S. Shareholder" of a non-U.S. corporation (defined as a U.S. Person who owns (directly, indirectly through non-U.S. entities or constructively (as defined below)) at least 10% of the total combined voting power of all classes of shares entitled to vote) that is a controlled foreign corporation, which we refer to as a CFC, for an uninterrupted period of 30 days or more during a taxable year, and you own shares in the CFC directly or indirectly through non-U.S. entities on the last day of the CFC’s taxable year, you must include in your gross income for U.S. federal income tax purposes your pro rata share of the CFC’s "subpart F income", even if the subpart F income is not distributed. "Subpart F income" of a non-U.S. insurance corporation typically includes foreign personal holding company income (such as interest, dividends and other types of passive income), as well as insurance and reinsurance income (including underwriting and investment income). A non-U.S. corporation is considered a CFC if 10% U.S. Shareholders own (directly, indirectly through non-U.S. entities or by attribution by application of the constructive ownership rules of section 958(b) of the Code (that is, "constructively")) more than 50% of the total combined voting power of all classes of voting shares of that non-U.S. corporation or the total value of all shares of that corporation.
For purposes of taking into account insurance income, a CFC also includes a non-U.S. insurance company in which more than 25% of the total combined voting power of all classes of shares (or more than 25% of the total value of the shares) is owned (directly, indirectly through non-U.S. entities or constructively) by 10% U.S. Shareholders on any day during the taxable year of such corporation (subject to an exception not applicable here).
For purposes of this discussion, the term "U.S. Person" means: (i) an individual citizen or resident of the U.S., (ii) a partnership or corporation created or organized in or under the laws of the U.S., or under the laws of any State thereof (including the District of Columbia), (iii) an estate, the income of which is subject to U.S. federal income taxation regardless of its source, (iv) a trust if either (1) a court within the U.S. is able to exercise primary supervision over the administration of such trust and one or more U.S. Persons have the authority to control all substantial decisions of such trust or (2) the trust has a valid election in effect to be treated as a U.S. Person for U.S. federal income tax purposes or (v) any other person or entity that is treated for U.S. federal income tax purposes as if it were one of the foregoing.
Because our Founding Shareholders owned all of the shares of Maiden Holdings prior to July 3, 2007, Maiden Holdings was a CFC during the period of 2007 prior to July 3, 2007. Following the 2007 private offering, Barry Zyskind may be treated as a 10% U.S. Shareholder of Maiden Holdings and Maiden Bermuda as a result of his seat on the board of Maiden Holdings, George Karfunkel and/or Michael Karfunkel may be treated as a 10% U.S. Shareholder of Maiden Holdings and Maiden Bermuda as a result of Yehuda Neuberger’s seat on the board of Maiden Holdings, because of Mr. Neuberger’s significant familial connections to the Karfunkels and, through them, to AmTrust. We believe, subject to the discussion below, that because of provisions in our organizational documents that limit voting power and other factors, no U.S. Person who acquired our shares directly or indirectly through one or more non-U.S. entities should be treated as owning (directly, indirectly through non-U.S. entities or constructively) 10% or more of the total voting power of all classes of Maiden Holdings’ or Maiden Bermuda’s shares. However, the IRS could challenge the effectiveness of the provisions in our organizational documents and a court could sustain such a challenge. Accordingly, no assurance can be given that a U.S. Person (other than the Founding Shareholders) who owns our shares will not be characterized as a 10% U.S. Shareholder.
U.S. Persons who hold our shares may be subject to U.S. federal income taxation at ordinary income rates on their proportionate share of Maiden Bermuda’s related person insurance income.
If U.S. persons are treated as owning 25% or more of Maiden Bermuda’s shares (by vote or by value) (as is expected to be the case) and the related person insurance income ("RPII") of Maiden Bermuda (determined on a gross basis) were to equal or exceed 20% of Maiden Bermuda’s gross insurance income in any taxable year and direct or indirect insureds (and persons related to those insureds) own directly or indirectly through entities 20% or more of the voting power or value of our shares, then a U.S. Person who owns any shares of Maiden Bermuda (directly or indirectly through non-U.S. entities) on the last day of the taxable year would be required to include in its income for U.S. federal income tax purposes such person’s pro rata share of Maiden Bermuda’s RPII for the entire taxable year, determined as if such RPII were distributed proportionately only to U.S. Persons at that date, regardless of whether such income is distributed. In addition, any RPII that is includible in the income of a U.S. tax-exempt organization generally will be treated as unrelated business taxable income. The amount of RPII earned by Maiden Bermuda (generally, premium and related investment income from the direct or indirect insurance or reinsurance of any direct or indirect
42
U.S. holder of shares or any person related to such holder) will depend on a number of factors, including the identity of persons directly or indirectly insured or reinsured by Maiden Bermuda.
At December 31, 2015, we believe that either (i) the direct or indirect insureds of Maiden Bermuda (and related persons) should not directly or indirectly own 20% or more of either the voting power or value of our shares or (ii) the RPII (determined on a gross basis) of Maiden Bermuda should not equal or exceed 20% of Maiden Bermuda’s gross insurance income for the taxable year ended December 31, 2015 and we do not expect both of these thresholds to be exceeded in the foreseeable future. However, we cannot be certain that this will be the case because some of the factors which determine the extent of RPII may be beyond our control.
U.S. Persons who dispose of our shares may be subject to U.S. federal income taxation at the rates applicable to dividends on a portion of their gains if any.
The RPII rules provide that if a U.S. Person disposes of shares in a non-U.S. insurance corporation in which U.S. Persons own 25% or more of the shares (even if the amount of gross RPII is less than 20% of the corporation’s gross insurance income and the ownership of its shares by direct or indirect insureds and related persons is less than the 20% threshold), any gain from the disposition will generally be treated as a dividend to the extent of the holder’s share of the corporation’s undistributed earnings and profits that were accumulated during the period that the holder owned the shares (whether or not such earnings and profits are attributable to RPII). In addition, such a holder will be required to comply with certain reporting requirements, regardless of the amount of shares owned by the holder. These RPII rules should not apply to dispositions of our shares because Maiden Holdings will not be directly engaged in the insurance business. The RPII provisions, however, have never been interpreted by the courts or the U.S. Treasury Department in final regulations, and regulations interpreting the RPII provisions of the Code exist only in proposed form. It is not certain whether these regulations will be adopted in their proposed form or what changes or clarifications might ultimately be made thereto or whether any such changes, as well as any interpretation or application of the RPII rules by the IRS, the courts, or otherwise, might have retroactive effect. The U.S. Treasury Department has authority to impose, among other things, additional reporting requirements with respect to RPII. Accordingly, the meaning of the RPII provisions and the application thereof to Maiden Holdings and Maiden Bermuda is uncertain.
U.S. Persons who hold our shares will be subject to adverse U.S. federal income tax consequences if Maiden Holdings is considered to be a passive foreign investment company.
If Maiden Holdings is considered a passive foreign investment company, or a PFIC, for U.S. federal income tax purposes, a U.S. Person who owns directly or, in some cases, indirectly (e.g. through a non-U.S. partnership) any of our shares will be subject to adverse U.S. federal income tax consequences, including subjecting the investor to a greater tax liability than might otherwise apply and subjecting the investor to a tax on amounts in advance of when such tax would otherwise be imposed, in which case your investment could be materially adversely affected. In addition, if Maiden Holdings were considered a PFIC, upon the death of any U.S. individual owning our shares, such individual’s heirs or estate would not be entitled to a "step-up" in the basis of the shares which might otherwise be available under U.S. federal income tax laws. We believe that we are not, and we currently do not expect to become, a PFIC for U.S. federal income tax purposes; however, there can be no assurance that we will not be deemed a PFIC by the IRS. There are currently no regulations regarding the application of the PFIC provisions to an insurance company. New regulations or pronouncements interpreting or clarifying these rules may be forthcoming. We cannot predict what impact, if any, such guidance would have on a shareholder that is subject to U.S. federal income taxation.
U.S. tax exempt organizations that own our shares may recognize unrelated business taxable income.
U.S. tax-exempt entities will generally be required to treat certain subpart F insurance income, including RPII, that is includible in income by the tax-exempt entity as unrelated business taxable income. Although we do not believe that any U.S. tax exempt entities should be allocated such insurance income, we cannot be certain that this will be the case because of factual and legal uncertainties. U.S. tax-exempt investors are advised to consult their own tax advisor.
The Quota Share Agreements between Maiden Bermuda and AmTrust may be subject to recharacterization or other adjustment for U.S. federal income tax purposes, which may have a material adverse effect on our financial condition and operating results.
Under section 845 of the Code, the IRS may allocate income, deductions, assets, reserves, credits and any other items related to a reinsurance agreement among certain related parties to the reinsurance agreement, or in circumstances where one party is an agent of the other, recharacterize such items, or make any other adjustment, in order to reflect the proper source, character or amount of the items for each party. In addition, if a reinsurance contract has a significant tax avoidance effect on any party to the contract, the IRS may make adjustments with respect to such party to eliminate the tax avoidance effect. No regulations have been issued under section 845 of the Code. Accordingly, the application of such provisions is uncertain and we cannot predict what impact, if any, such provisions may have on us.
Changes in U.S. federal income tax law could materially adversely affect an investment in our shares.
In the past, legislation has been introduced in the U.S. Congress (but not enacted) intended to eliminate certain perceived tax advantages of companies (including insurance companies) that have legal domiciles outside the U.S. but have certain U.S. connections. It is possible that legislation could be introduced and enacted by the current Congress or future Congresses that could have an adverse effect on us, or our shareholders. For example, President Obama’s budget proposals and legislative proposals would reduce or eliminate the tax deduction for reinsurance premiums paid by a U.S. insurer or reinsurer to a non-U.S. affiliate.
43
Another legislative proposal would treat foreign corporations as U.S. corporations for tax purposes if management and control occur primarily in the U.S. Any such change in U.S. tax law could have a material adverse effect on the Company.
Additionally, the U.S. federal income tax laws and interpretations regarding whether a company is engaged in a trade or business within the U.S., or is a PFIC or whether U.S. Persons would be required to include in their gross income the "subpart F income" or the RPII of a CFC are subject to change, possibly on a retroactive basis. There are currently no regulations regarding the application of the PFIC rules to insurance companies and the regulations regarding RPII are still in proposed form. New regulations or pronouncements interpreting or clarifying such rules may be forthcoming. We cannot be certain if, when or in what form such regulations or pronouncements may be provided and whether such guidance will have a retroactive effect.
We may be subject to United Kingdom taxes, which would have an adverse effect on our financial condition and results of operations and on an investment in our shares.
A company which is resident in the U.K. for U.K. corporation tax purposes is subject to U.K. corporation tax in respect of its worldwide income and gains. While Maiden Global is a U.K. company, neither Maiden Holdings nor Maiden Bermuda are incorporated in the U.K. Nevertheless, Maiden Holdings or Maiden Bermuda would be treated as being resident in the U.K. for U.K. corporation tax purposes if its central management and control were exercised in the U.K. The concept of central management and control is indicative of the highest level of control of a company’s affairs, which is wholly a question of fact. The directors and officers of both Maiden Holdings and Maiden Bermuda intend to manage their affairs so that both companies are resident in Bermuda, and not resident in the U.K., for U.K. tax purposes. However, HM Revenue & Customs could challenge our tax residence status.
A company which is not resident in the U.K. for U.K. corporation tax purposes can nevertheless be subject to U.K. corporation tax at the rate of 20% if it carries on a trade in the U.K. through a permanent establishment in the U.K., but the charge to U.K. corporation tax is limited to profits (both income profits and chargeable gains) attributable directly or indirectly to such permanent establishment.
The directors and officers of Maiden Bermuda intend to operate the business of Maiden Bermuda in such a manner that it does not carry on a trade in the U.K. through a permanent establishment in the U.K. Nevertheless, HM Revenue & Customs might contend successfully that Maiden Bermuda is trading in the U.K. through a permanent establishment in the U.K. because there is considerable uncertainty as to the activities which constitute carrying on a trade in the U.K. through a permanent establishment in the U.K.
The U.K. has no income tax treaty with Bermuda. Companies that are neither resident in the U.K. nor entitled to the protection afforded by a double tax treaty between the U.K. and the jurisdiction in which they are resident are liable to income tax in the U.K., at the basic rate of 20%, on the profits of a trade carried on in the U.K., where that trade is not carried on through a permanent establishment in the U.K. The directors and officers of Maiden Bermuda intend to operate the business in such a manner that Maiden Bermuda will not fall within the charge to income tax in the U.K. (other than by way of deduction or withholding) in this respect.
During 2015, the U.K. introduced a new Diverted Profits Tax ("DPT") which applies to foreign companies with sales in the U.K. that organize their affairs to avoid creating a taxable presence (in the form of a permanent establishment) in the U.K., or to U.K. companies that enter into transactions with connected companies which lack economic substance to exploit differentials in tax rates. DPT will be charged at 25% of the profits representing the contribution of the U.K. activities to the group’s results.
If either Maiden Holdings or Maiden Bermuda were treated as being resident in the U.K. for U.K. corporation tax purposes, or if Maiden Bermuda were treated as carrying on a trade in the U.K., whether through a permanent establishment or otherwise, or if the DPT applied, the results of our operations would be materially adversely affected.
Item 1B. Unresolved Staff Comments.
None.
Item 2. Properties.
We currently lease office space in Hamilton, Bermuda (our corporate headquarters), the U.S., the U.K., Germany, Austria, Ireland and Russia for the operation of our business. We also lease a property for employee use in Bermuda. We renew and enter into new leases in the ordinary course of business as needed. While we believe that the office space from these leased properties is sufficient for us to conduct our operations for the foreseeable future, we may need to expand into additional facilities to accommodate future growth. To date, the cost of acquiring and maintaining our office space has not been material to us as a whole.
44
Item 3. Legal Proceedings.
We may become involved in various claims and legal proceedings that arise in the normal course of our business, which are not likely to have a material adverse effect on our financial position, results of operations or liquidity.
Except as noted below, the Company is not a party to any material legal proceedings. From time to time, the Company is subject to routine legal proceedings, including arbitrations, arising in the ordinary course of business. These legal proceedings generally relate to claims asserted by or against the Company in the ordinary course of insurance or reinsurance operations. Based on the Company's opinion, the eventual outcome of these legal proceedings is not expected to have a material adverse effect on its financial condition or results of operations.
In April 2009, the Company learned that Bentzion S. Turin, the former Chief Operating Officer, General Counsel and Secretary of Maiden Holdings and Maiden Bermuda, sent a letter to the U.S. Department of Labor claiming that his employment with the Company was terminated in retaliation for corporate whistle blowing in violation of the whistle blower protection provisions of the Sarbanes-Oxley Act of 2002. Mr. Turin alleged concerns regarding corporate governance with respect to negotiation of the terms of the Trust Preferred Securities Offering and seeks reinstatement as Chief Operating Officer, General Counsel and Secretary of Maiden Holdings and Maiden Bermuda, back pay and legal fees incurred. On December 31, 2009, the U.S. Secretary of Labor found no reasonable cause for Mr. Turin’s claim and dismissed the complaint in its entirety. Mr. Turin objected to the Secretary's findings and requested a hearing before an administrative law judge in the U.S. Department of Labor. The Company moved to dismiss Mr. Turin's complaint, and its motion was granted by the Administrative Law Judge on June 30, 2011.
On July 13, 2011, Mr. Turin filed a petition for review of the Administrative Law Judge's decision with the Administrative Review Board in the U.S. Department of Labor. The Company filed its brief in opposition to the petition for review on October 19, 2011. On March 29, 2013, the Administrative Review Board reversed the dismissal of the complaint on procedural grounds, and remanded the case to the administrative law judge. The administrative hearing began in September 2014, and we expect it to conclude in 2016. The Company believes that it had ample reason for terminating such employment for good and sufficient legal cause, and the Company believes that the claim is without merit and is vigorously defending this claim.
Item 4. Mine Safety Disclosures.
Not applicable.
PART II
Item 5. Market for Registrant’s Common Equity, Related Stockholder Matters and Issuer Purchases of Equity Securities.
Our common shares began publicly trading on NASDAQ under the symbol "MHLD" on May 6, 2008. The following table sets out the high and low prices for our common shares for the periods indicated as reported by NASDAQ. Such prices reflect inter-dealer prices, without retail mark-up, mark-down or commission, and do not necessarily represent actual transactions.
High | Low | ||||||
2014 | |||||||
First quarter | $ | 13.48 | $ | 10.55 | |||
Second quarter | $ | 13.05 | $ | 11.29 | |||
Third quarter | $ | 12.51 | $ | 11.07 | |||
Fourth quarter | $ | 13.52 | $ | 10.92 | |||
2015 | |||||||
First quarter | $ | 14.95 | $ | 12.42 | |||
Second quarter | $ | 16.03 | $ | 13.52 | |||
Third quarter | $ | 16.98 | $ | 12.85 | |||
Fourth quarter | $ | 16.10 | $ | 13.48 | |||
At February 19, 2016, the last reported sale price of our common share was $13.32 per share and there were 29 holders of record of our common shares. This figure does not represent the actual number of beneficial owners of our common shares because shares are frequently held in "street name" by securities dealers and others for the benefit of beneficial owners who may vote the shares.
During the years ended December 31, 2015 and 2014, we declared regular quarterly dividends totaling $0.53 and $0.46 per common share, respectively. The continued declaration and payment of dividends to holders of common shares is expected but will be at the discretion of our board of directors and subject to specified legal, regulatory, financial and other restrictions.
On December 24, 2012, the Company adopted a written trading plan to facilitate the repurchase of its common shares in accordance with the Company's existing share purchase reauthorization. On July 24, 2014, the Company's Board of Directors
45
approved the repurchase of up to $75.0 million of the Company's common shares from time to time at market prices. During the years ended December 31, 2015 and 2014, there were no common shares repurchased by the Company under the plan, except for withholdings from employees in respect of tax obligations on the issued vested restricted shares. See "Notes to Consolidated Financial Statements Note 13. Shareholders' Equity" included under Item 8 "Financial Statements and Supplementary Data" of this Form 10-K.
As a holding company, our principal source of income is dividends or other statutorily permissible payments from our subsidiaries. The ability of our subsidiaries to pay dividends is limited by the applicable laws and regulations of the various countries in which we operate, including Bermuda and the U.S. See Item 1 "Business — Regulatory Matters", Item 7 "Management’s Discussion and Analysis of Financial Condition", and "Results of Operations, Liquidity and Capital Resources — Restrictions, Collateral and Specific Requirements", included in this Annual Report on Form 10-K.
Performance Graph
The following information is not deemed to be "soliciting material" or to be "filed" with the SEC or subject to the liabilities of Section 18 of the Exchange Act, and the report shall not be deemed to be incorporated by reference into any prior or subsequent filing by the Company under the Securities Act or the Exchange Act.
The following graph shows the cumulative total return, including reinvestment of dividends, on the common shares compared to such return for S&P 500 Composite Index ("S&P 500"), and NASDAQ Insurance Index for the five year period beginning December 31, 2010, assuming $100 was invested on that date and ending on December 31, 2015.
The measurement point on the graph represents the cumulative shareholder return as measured by the last reported sale price on such date during the relevant period.
Total Return To Shareholders
(Includes Reinvestment of Dividends)
Comparison of Cumulative Total Return
(Includes Reinvestment of Dividends)
Comparison of Cumulative Total Return
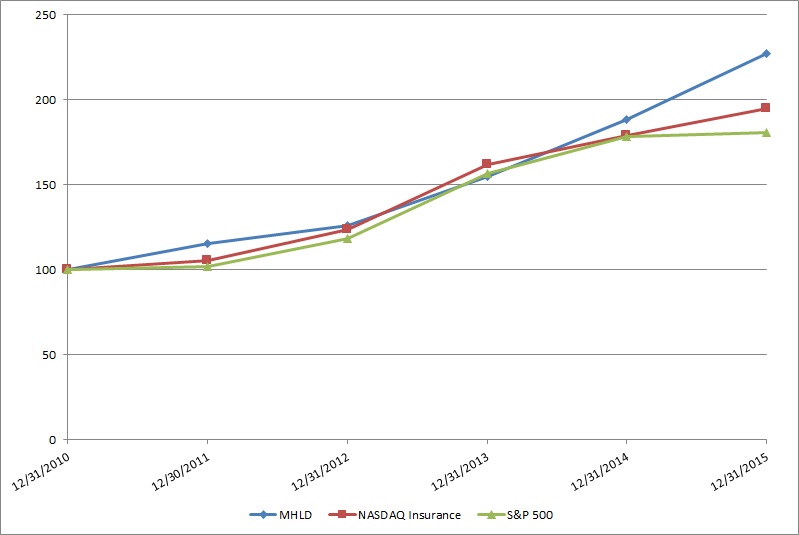
46
Item 6. Selected Financial Data.
The following tables set forth our selected consolidated financial data and other financial information at the end of and for each of the years in the five-year period ended December 31, 2015.
Statement of income data and balance sheet data are derived from our audited Consolidated Financial Statements, which have been prepared in accordance with U.S. GAAP. These historical results are not necessarily indicative of results to be expected from any future period. For further discussion of this risk see Item 1A. "Risk Factors" in this Annual Report on Form 10-K. You should read the following selected financial data in conjunction with the other information contained in this Annual Report on Form 10-K, including Item 7 "Management’s Discussion and Analysis of Financial Condition and Results of Operations" and Item 8 "Financial Statements and Supplementary Data".
47
For the Year Ended December 31, | 2015 | 2014 | 2013 | 2012 | 2011 | |||||||||||||||
($ in Millions, Except per Share Amounts and Ratios) | ||||||||||||||||||||
Summary Consolidated Statement of Income Data: | ||||||||||||||||||||
Gross premiums written | $ | 2,662.8 | $ | 2,507.4 | $ | 2,204.2 | $ | 2,001.0 | $ | 1,812.6 | ||||||||||
Net premiums written | $ | 2,514.1 | $ | 2,458.1 | $ | 2,096.3 | $ | 1,901.3 | $ | 1,723.5 | ||||||||||
Net premiums earned | $ | 2,429.1 | $ | 2,251.7 | $ | 2,000.9 | $ | 1,803.8 | $ | 1,552.4 | ||||||||||
Other insurance revenue | 11.5 | 13.4 | 14.2 | 12.9 | 12.6 | |||||||||||||||
Net investment income | 131.1 | 117.2 | 91.4 | 81.2 | 74.9 | |||||||||||||||
Net realized and unrealized gains on investment | 2.5 | 1.2 | 3.6 | 1.9 | 0.5 | |||||||||||||||
Net impairment losses recognized in earnings | (1.1 | ) | (2.4 | ) | — | — | — | |||||||||||||
Total revenues | 2,573.1 | 2,381.1 | 2,110.1 | 1,899.8 | 1,640.4 | |||||||||||||||
Net loss and loss adjustment expenses | 1,633.6 | 1,498.3 | 1,349.6 | 1,262.3 | 1,043.1 | |||||||||||||||
Commissions and other acquisition expenses | 724.2 | 659.3 | 556.6 | 492.1 | 438.8 | |||||||||||||||
General and administrative expenses | 64.9 | 62.5 | 58.4 | 53.5 | 53.9 | |||||||||||||||
Interest and amortization expenses | 29.1 | 30.0 | 39.8 | 36.7 | 34.1 | |||||||||||||||
Accelerated amortization of junior subordinated debt discount and issuance cost | — | 28.2 | — | — | 20.3 | |||||||||||||||
Junior subordinated debt repurchase expense | — | — | — | — | 15.1 | |||||||||||||||
Amortization of intangible assets | 2.8 | 3.3 | 3.8 | 4.4 | 5.0 | |||||||||||||||
Foreign exchange and other gains | (7.8 | ) | (4.2 | ) | (2.8 | ) | (1.6 | ) | (0.3 | ) | ||||||||||
Income tax expense | 2.1 | 2.2 | 1.9 | 2.2 | 1.9 | |||||||||||||||
(Loss) income attributable to noncontrolling interests | (0.2 | ) | 0.1 | 0.1 | 0.1 | — | ||||||||||||||
Total expenses | 2,448.7 | 2,279.7 | 2,007.4 | 1,849.7 | 1,611.9 | |||||||||||||||
Dividends on preference shares | (24.3 | ) | (24.3 | ) | (14.8 | ) | (3.6 | ) | — | |||||||||||
Net income attributable to Maiden common shareholders | $ | 100.1 | $ | 77.1 | $ | 87.9 | $ | 46.5 | $ | 28.5 | ||||||||||
Per Common Share Data: | ||||||||||||||||||||
Earnings per common share(1): | ||||||||||||||||||||
Basic | $ | 1.36 | $ | 1.06 | $ | 1.21 | $ | 0.64 | $ | 0.40 | ||||||||||
Diluted | $ | 1.31 | $ | 1.04 | $ | 1.18 | $ | 0.64 | $ | 0.39 | ||||||||||
Weighted average number of common shares outstanding: | ||||||||||||||||||||
Basic | 73,478,544 | 72,843,782 | 72,510,361 | 72,263,022 | 72,155,503 | |||||||||||||||
Diluted | 85,638,235 | 74,117,568 | 76,417,839 | 73,105,531 | 72,903,688 | |||||||||||||||
Dividends declared per common share | $ | 0.53 | $ | 0.46 | $ | 0.38 | $ | 0.33 | $ | 0.30 | ||||||||||
For the Year Ended December 31, | 2015 | 2014 | 2013 | 2012 | 2011 | ||||||||||
Selected Consolidated Ratios: | |||||||||||||||
Loss and LAE ratio(2) | 66.9 | % | 66.1 | % | 67.0 | % | 69.5 | % | 66.6 | % | |||||
Commission and other acquisition expense ratio(3) | 29.7 | % | 29.1 | % | 27.6 | % | 27.1 | % | 28.0 | % | |||||
General and administrative expense ratio(4) | 2.7 | % | 2.8 | % | 2.9 | % | 2.9 | % | 3.5 | % | |||||
Expense ratio(5) | 32.4 | % | 31.9 | % | 30.5 | % | 30.0 | % | 31.5 | % | |||||
Combined ratio(6) | 99.3 | % | 98.0 | % | 97.5 | % | 99.5 | % | 98.1 | % | |||||
48
December 31, | 2015 | 2014 | 2013 | 2012 | 2011 | |||||||||||||||
($ in Millions, Except per Share Amounts) | ||||||||||||||||||||
Summary Consolidated Balance Sheet Data: | ||||||||||||||||||||
Total investments | $ | 4,127.7 | $ | 3,469.5 | $ | 3,167.2 | $ | 2,621.6 | $ | 2,022.9 | ||||||||||
Cash and cash equivalents | 89.6 | 108.1 | 139.8 | 81.5 | 188.1 | |||||||||||||||
Restricted cash and cash equivalents | 242.9 | 284.4 | 77.4 | 132.3 | 114.9 | |||||||||||||||
Reinsurance balances receivable, net | 377.3 | 513.0 | 560.1 | 522.6 | 423.4 | |||||||||||||||
Loan to related party | 168.0 | 168.0 | 168.0 | 168.0 | 168.0 | |||||||||||||||
Deferred commission and other acquisition expenses | 397.5 | 372.5 | 304.9 | 270.7 | 248.4 | |||||||||||||||
Total assets | 5,713.6 | 5,164.1 | 4,713.4 | 4,138.2 | 3,395.1 | |||||||||||||||
Reserve for loss and loss adjustment expenses | 2,510.1 | 2,271.3 | 1,957.8 | 1,740.3 | 1,398.4 | |||||||||||||||
Unearned premiums | 1,354.6 | 1,207.8 | 1,034.8 | 936.5 | 832.0 | |||||||||||||||
Senior notes | 360.0 | 360.0 | 360.0 | 207.5 | 107.5 | |||||||||||||||
Junior subordinated debt (7) | — | — | 126.4 | 126.3 | 126.3 | |||||||||||||||
Total Maiden shareholders’ equity | 1,347.8 | 1,240.7 | 1,123.8 | 1,015.2 | 768.6 | |||||||||||||||
Book Value: | ||||||||||||||||||||
Book value per common share(8) | $ | 11.77 | $ | 12.69 | $ | 11.14 | $ | 11.96 | $ | 10.64 | ||||||||||
Accumulated dividends per common share | 2.75 | 2.22 | 1.76 | 1.38 | 1.05 | |||||||||||||||
Book value per common share plus accumulated dividends | $ | 14.52 | $ | 14.91 | $ | 12.90 | $ | 13.34 | $ | 11.69 | ||||||||||
Change in book value per common share plus accumulated dividends | (2.6 | )% | 15.6 | % | (3.3 | )% | 14.1 | % | 4.8 | % | ||||||||||
Diluted book value per common share(9) | $ | 11.61 | $ | 12.47 | $ | 10.92 | $ | 11.95 | $ | 10.48 | ||||||||||
(1) | Please refer to "Notes to Consolidated Financial Statements Note 12. Earnings per Common Share" included under Item 8 "Financial Statements and Supplementary Data" of this Form 10-K for the calculation of basic and diluted earnings per common share. |
(2) | Calculated by dividing net loss and LAE by the sum of net premiums earned and other insurance revenue. |
(3) | Calculated by dividing commission and other acquisition expenses by the sum of net premiums earned and other insurance revenue. |
(4) | Calculated by dividing general and administrative expenses by the sum of net premiums earned and other insurance revenue. |
(5) | Calculated by adding together the commission and other acquisition expense ratio and the general and administrative expense ratio. |
(6) | Calculated by adding together the net loss and LAE ratio, commission and other acquisition expense ratio and general and administrative expense ratio. |
(7) | On January 15, 2014, we redeemed all of the outstanding 14% Junior Subordinated Debt with a face value of $152.5 million using the net proceeds from the issuance of the 2013 Senior Notes and available cash on hand. |
(8) | Book value per common share is defined as total shareholders’ equity available to common shareholders divided by the number of common shares issued and outstanding as of the end of the period, giving no effect to dilutive securities. |
(9) | Diluted book value per common share is calculated by dividing common shareholders' equity, adjusted for assumed proceeds from the exercise of dilutive options, by the number of outstanding common shares plus dilutive options and restricted share units (assuming exercise of all dilutive share based awards). The Mandatory Convertible Preference Shares - Series B are excluded at December 31, 2015, 2014 and 2013 as they are anti-dilutive. |
49
Item 7. Management’s Discussion and Analysis of Financial Condition and Results of Operations.
The following discussion and analysis of the Company’s financial condition and results of operations should be read in conjunction with the Company’s Consolidated Financial Statements and related notes included elsewhere in this Annual Report on Form 10-K and Item 1, "Business - General Overview" on page 2. Amounts in tables may not reconcile due to rounding differences. Some of the information contained in this discussion and analysis or set forth elsewhere in this Report, including information with respect to the Company’s plans and strategy for its business, includes forward-looking statements that involve risk and uncertainties. Please see the "Special Note About Forward-Looking Statements" in this Annual Report on Form 10-K for more information on factors that could cause actual results to differ materially from the results described in or implied by any forward-looking statements contained in this discussion and analysis. You should review the "Risk Factors" set forth in this Annual Report on Form 10-K for a discussion of important factors that could cause actual results to differ materially from the results described in or implied by the forward-looking statements contained herein.
Overview
We are a Bermuda-based holding company formed in June 2007 primarily focused on serving the needs of regional and specialty insurers in the U.S. and Europe by providing innovative reinsurance solutions designed to support their capital needs. We specialize in reinsurance solutions that optimize financing by providing coverage within the more predictable and actuarially credible lower layers of coverage and/or reinsuring risks that are believed to be lower hazard, more predictable and generally not susceptible to significant claims from natural catastrophes. Our tailored solutions include a variety of value added services focused on helping our clients grow and prosper.
We have operations in Bermuda and the United States which provide reinsurance through our wholly owned subsidiaries, Maiden Bermuda and Maiden US. Maiden Bermuda and Maiden US do not underwrite any direct insurance business. Maiden LF is a life insurer organized in Sweden and writes credit life insurance on a primary basis in support of Maiden Global business development efforts.
Our business consists of two reportable segments: Diversified Reinsurance and AmTrust Reinsurance. Please refer to Item 1, "Business - Our Reportable Segments" section of this Annual Report on Form 10-K for the year ended December 31, 2015 for a discussion on our reportable segments.
Recent Developments
The following are strategic and capital transactions that occurred during the years ended December 31, 2015 and 2014.
Issuance of Preference Shares - Series C
On November 25, 2015, the Company issued 6.6 million shares of 7.125% Preference Shares - Series C, par value $0.01, at a price of $25 per preference share. The Company received net proceeds of $159.6 million from the offering after deducting issuance costs of $5.4 million. Each share, which is redeemable by the Company beginning December 15, 2020, will be paid non-cumulative dividends at a rate of 7.125% per annum on the initial liquidation preference of $25 per share.
The Preference Shares - Series C have no voting rights other than to elect two additional members of the board of directors if dividends on the Preference Shares - Series C have not been declared and paid for the equivalent of six or more dividend periods. The Preference Shares - Series C have been listed on NYSE and trading commenced on November 27, 2015 under the symbol "MHPRC".
Sale of Maiden Specialty
On November 4, 2015, Maiden US finalized the sale of its wholly owned subsidiary, Maiden Specialty, to Clear Blue. On the same date, Maiden US entered into a reinsurance agreement with Clear Blue whereby Maiden US reinsures all in-force policies transferred to Clear Blue as part of the sale. In addition, Maiden US entered into an agreement with Clear Blue whereby Maiden US assumes the responsibility for the administration and servicing of all aspects of the polices in-force at the date of sale.
Redemption of Junior Subordinated Debt
On January 15, 2014, the Company's wholly owned U.S. holding company, Maiden NA, repurchased all of the outstanding TRUPS Offering, with a face value of $152.5 million, which has substantially lowered our cost of capital. As a result of the redemption, during the year ended December 31, 2014, the Company incurred a non-recurring, non-cash charge of $28.2 million, which represents the accelerated amortization of original issuance discount and write-off of issuance costs associated with the junior subordinated debt.
50
2015 Financial Highlights
For the Year Ended December 31, | 2015 | 2014 | % Change | ||||||||
Summary Consolidated Statement of Income Data: | ($ in Millions except per share data) | ||||||||||
Net Income | $ | 124.2 | $ | 101.5 | 22.4 | % | |||||
Net income attributable to Maiden common shareholders | 100.1 | 77.1 | 30.0 | % | |||||||
Operating earnings (1) | 107.2 | 117.7 | (8.9 | )% | |||||||
Basic earnings per common share: | |||||||||||
Net income attributable to Maiden common shareholders (2) | 1.36 | 1.06 | 28.3 | % | |||||||
Net operating earnings attributable to Maiden common shareholders(1) | 1.46 | 1.61 | (9.3 | )% | |||||||
Diluted earnings per common share: | |||||||||||
Net income attributable to Maiden common shareholders (2) | 1.31 | 1.04 | 26.0 | % | |||||||
Net operating earnings attributable to Maiden common shareholders (1) | 1.39 | 1.53 | (9.2 | )% | |||||||
Dividends per common share | 0.53 | 0.46 | 15.2 | % | |||||||
Gross premiums written | 2,662.8 | 2,507.4 | 6.2 | % | |||||||
Net premiums earned | 2,429.1 | 2,251.7 | 7.9 | % | |||||||
Underwriting income (3) | 42.3 | 65.4 | (35.3 | )% | |||||||
Net investment income | 131.1 | 117.2 | 11.8 | % | |||||||
Combined Ratio (4) | 99.3 | % | 98.0 | % | 1.3 | % | |||||
Annualized operating return on average common shareholders' equity (1) | 12.0 | % | 13.6 | % | (11.8 | )% | |||||
At December 31, | 2015 | 2014 | % Change | ||||||||
Consolidated Financial Condition | ($ in Millions except per share data) | ||||||||||
Total investments and cash and cash equivalents (5) | $ | 4,460.2 | $ | 3,862.0 | 15.5 | % | |||||
Total assets | 5,713.6 | 5,164.1 | 10.6 | % | |||||||
Reserve for loss and loss adjustment expenses | 2,510.1 | 2,271.3 | 10.5 | % | |||||||
Senior Notes | 360.0 | 360.0 | — | % | |||||||
Maiden common shareholders' equity | 867.8 | 925.7 | (6.3 | )% | |||||||
Maiden shareholders' equity | 1,347.8 | 1,240.7 | 8.6 | % | |||||||
Total capital resources (6) | 1,707.8 | 1,600.7 | 6.7 | % | |||||||
Ratio of debt to total capital resources | 21.1 | % | 22.5 | % | (6.2 | )% | |||||
Book Value | |||||||||||
Book value per common share (7) | $ | 11.77 | $ | 12.69 | (7.2 | )% | |||||
Accumulated dividends per common share | 2.75 | 2.22 | 23.9 | % | |||||||
Book value per common share plus accumulated dividends | $ | 14.52 | $ | 14.91 | (2.6 | )% | |||||
Change in book value per common share plus accumulated dividends | (2.6 | )% | 15.6 | % | |||||||
Diluted book value per common share (8) | $ | 11.61 | $ | 12.47 | (6.9 | )% | |||||
(1) | Operating earnings, operating earnings per common share and operating return on average common equity are non-GAAP financial measures. See "Key Financial Measures" for additional information and a reconciliation to the nearest U.S. GAAP financial measure (net income). |
(2) | Please refer to "Notes to Consolidated Financial Statements Note 12. Earnings per Common Share" included under Item 8 "Financial Statements and Supplementary Data" of this Form 10-K for the calculation of basic and diluted earnings per common share. |
51
(3) | Underwriting income is calculated as net premiums earned plus other insurance revenue less net loss and LAE, commission and other acquisition expenses and general and administrative expenses directly related to underwriting activities. |
(4) | Calculated by adding together the net loss and LAE ratio, commission and other acquisition expense ratio and general and administrative expense ratio. |
(5) | Total investments and cash and cash equivalents includes both restricted and unrestricted. |
(6) | Total capital resources is the sum of the Company's debt and Maiden shareholders' equity. See "Key Financial Measures" for additional information. |
(7) | Book value per common share is calculated using common shareholders’ equity (shareholders' equity excluding the aggregate liquidation value of our preference shares) divided by the number of common shares outstanding. |
(8) | Diluted book value per common share is calculated by dividing common shareholders' equity, adjusted for assumed proceeds from the exercise of dilutive options, by the number of outstanding common shares plus dilutive options and restricted share units (assuming exercise of all dilutive share based awards). The Mandatory Convertible Preference Shares - Series B are excluded at December 31, 2015 and 2014 as they are anti-dilutive. |
Key Financial Measures
In addition to the Consolidated Balance Sheets and Consolidated Statements of Income and Comprehensive Income, management uses certain key financial measures, some of which are non-GAAP measures, to evaluate its financial performance and the overall growth in value generated for the Company’s common shareholders. Management believes that these measures, which may be defined differently by other companies, better explain the Company’s results in a manner that allows for a more complete understanding of the underlying trends in the Company’s business. The non-GAAP measures should not be viewed as a substitute for those determined in accordance with U.S. GAAP. These key financial measures are:
Operating Earnings and Operating Earnings per Common Share: Management believes that the use of operating earnings and diluted operating earnings per share enables investors and other users of the Company’s financial information to analyze its performance in a manner similar to how Management analyzes performance. Management also believes that these measures follow industry practice and, therefore, allow the users of financial information to compare the Company’s performance with its industry peer group, and that the equity analysts and certain rating agencies which follow the Company, and the insurance industry as a whole, generally exclude these items from their analyses for the same reasons. Operating earnings should not be viewed as a substitute for U.S. GAAP net income.
Operating earnings are an internal performance measure used by management as these measures focus on the the underlying fundamentals of the Company's operations by excluding, on a recurring basis: (1) net realized gains or losses on investment; (2) impairment losses related to investments which were recognized in earnings; (3) foreign exchange and other gains or losses; (4) amortization of intangible assets; (5) loss and related activity from our run-off operations comprised of our former segment NGHC Quota Share and our divested E&S business; and (6) non-cash deferred tax expenses. We exclude net realized gains or losses on investment, impairment losses related to investments, and foreign exchange and other gains or losses as we believe these are influenced by market opportunities and other factors. We do not believe amortization of intangible assets and loss and related activity from our run-off operations are representative of our ongoing business. We believe all of these amounts are largely independent of our business and underwriting process and including them distorts the analysis of trends in our operations.
In addition to the recurring exclusions above, we also exclude certain non-recurring items that are material to understanding our results of operations. For the year ended December 31, 2014, we excluded: (1) the interest expense incurred on our 2013 Senior Notes prior to the redemption of the outstanding junior subordinated debt given the one time nature of the additional funding cost; and (2) the accelerated amortization of the junior subordinated debt discount and the write-off of the associated issuance costs while for the year ended December 31, 2013, we excluded the interest incurred on the 2013 Senior Notes given the one time nature of the additional funding cost.
Operating earnings and diluted operating earnings per common share can be reconciled to the nearest U.S. GAAP financial measure as follows:
52
For the Year Ended December 31, | 2015 | 2014 | 2013 | |||||||||
($ in Millions except per share data) | ||||||||||||
Net income attributable to Maiden common shareholders | $ | 100.1 | $ | 77.1 | $ | 87.9 | ||||||
Add (subtract): | ||||||||||||
Net realized gains on investment | (2.5 | ) | (1.2 | ) | (3.6 | ) | ||||||
Net impairment losses recognized in earnings | 1.1 | 2.4 | — | |||||||||
Foreign exchange and other gains | (7.8 | ) | (4.2 | ) | (2.8 | ) | ||||||
Amortization of intangible assets | 2.8 | 3.3 | 3.8 | |||||||||
Divested E&S business and NGHC run-off | 12.3 | 10.4 | — | |||||||||
Interest expense incurred related to 2013 Senior Notes prior to actual redemption of the junior subordinated debt | — | 0.5 | 1.2 | |||||||||
Accelerated amortization of junior subordinated debt discount and issuance cost | — | 28.2 | — | |||||||||
Non-cash deferred tax expense | 1.2 | 1.2 | 1.0 | |||||||||
Operating earnings attributable to Maiden common shareholders | $ | 107.2 | $ | 117.7 | $ | 87.5 | ||||||
Diluted earnings per share attributable to Maiden common shareholders | $ | 1.31 | $ | 1.04 | $ | 1.18 | ||||||
Add (subtract): | ||||||||||||
Net realized gains on investment | (0.03 | ) | (0.01 | ) | (0.04 | ) | ||||||
Net impairment losses recognized in earnings | 0.01 | 0.03 | — | |||||||||
Foreign exchange and other gains | (0.09 | ) | (0.05 | ) | (0.04 | ) | ||||||
Amortization of intangible assets | 0.04 | 0.04 | 0.05 | |||||||||
Divested E&S business and NGHC run-off | 0.14 | 0.12 | — | |||||||||
Interest expense incurred related to 2013 Senior Notes prior to actual redemption of the junior subordinated debt | — | 0.01 | 0.02 | |||||||||
Accelerated amortization of junior subordinated debt discount and issuance cost | — | 0.33 | — | |||||||||
Non-cash deferred tax expense | 0.01 | 0.02 | 0.01 | |||||||||
Diluted operating earnings per common share | $ | 1.39 | $ | 1.53 | $ | 1.18 | ||||||
Operating earnings attributable to Maiden common shareholders decreased by $10.6 million, or 8.9% for the year ended December 31, 2015 compared to December 31, 2014. This decrease is mainly due to a reduction in underwriting income, offset by improvements in net investment income.
Operating Return on Average Common Equity ("Operating ROACE"): Management uses operating return on average common shareholders' equity as a measure of profitability that focuses on the return to common shareholders. It is calculated using operating earnings available to common shareholders (as defined above) divided by average common shareholders' equity. Management has set, as a target, a long-term average of 15% Operating ROACE, which management believes provides an attractive return to shareholders for the risk assumed from our business.
Operating ROACE for the years ended December 31, 2015, 2014 and 2013 was computed as follows:
At and For the Year Ended December 31, | 2015 | 2014 | 2013 | |||||||||
($ in Millions) | ||||||||||||
Operating earnings attributable to Maiden common shareholders | $ | 107.2 | $ | 117.7 | $ | 87.5 | ||||||
Opening Maiden common shareholders’ equity | $ | 925.7 | $ | 808.8 | $ | 865.2 | ||||||
Ending Maiden common shareholders’ equity | $ | 867.8 | $ | 925.7 | $ | 808.8 | ||||||
Average Maiden common shareholders’ equity | $ | 896.8 | $ | 867.3 | $ | 837.0 | ||||||
Operating return on average common equity | 12.0 | % | 13.6 | % | 10.5 | % | ||||||
53
Book Value per Common Share and Diluted Book Value per Common Share: Management uses growth in both of these metrics as a prime measure of the value we are generating for our common shareholders, as management believes that growth in each metric ultimately results in growth in the Company’s common share price. These metrics are impacted by the Company’s net income and external factors, such as interest rates, which can drive changes in unrealized gains or losses on our investment portfolio. At December 31, 2015, the book value per common share and the diluted book value per common share decreased by 7.2% and 6.9% respectively, compared to December 31, 2014, (see "Liquidity and Capital Resources - Investments" on page 76 for further information). Book value and diluted book value per common share at December 31, 2015, 2014 and 2013 were computed as follows:
December 31, | 2015 | 2014 | 2013 | |||||||||
($ in Millions except share and per share data) | ||||||||||||
Ending Maiden common shareholders’ equity | $ | 867.8 | $ | 925.7 | $ | 808.8 | ||||||
Proceeds from assumed conversion of dilutive options | 13.4 | 15.9 | 19.1 | |||||||||
Numerator for diluted book value per common share calculation | $ | 881.2 | $ | 941.6 | $ | 827.9 | ||||||
Common shares outstanding | 73,721,140 | 72,932,702 | 72,633,561 | |||||||||
Shares issued from assumed conversion of dilutive options and restricted share units | 2,166,545 | 2,590,394 | 3,176,433 | |||||||||
Denominator for diluted book value per common share calculation | 75,887,685 | 75,523,096 | 75,809,994 | |||||||||
Book value per common share | $ | 11.77 | $ | 12.69 | $ | 11.14 | ||||||
Diluted book value per common share | $ | 11.61 | $ | 12.47 | $ | 10.92 | ||||||
Ratio of Debt to Total Capital Resources: Management uses this measure to monitor the financial leverage of the Company. This measure is calculated using total debt divided by the sum of total Maiden shareholders' equity and total debt. The ratio of Debt to Total Capital Resources at December 31, 2015 and 2014 was computed as follows:
December 31, | 2015 | 2014 | ||||||
($ in Millions) | ||||||||
Senior notes | $ | 360.0 | $ | 360.0 | ||||
Maiden shareholders’ equity | 1,347.8 | 1,240.7 | ||||||
Total capital resources | $ | 1,707.8 | $ | 1,600.7 | ||||
Ratio of debt to total capital resources | 21.1 | % | 22.5 | % | ||||
Underwriting Income and Combined Ratio: The combined ratio is used in the insurance and reinsurance industry as a measure of underwriting profitability. Management measures underwriting results on an overall basis and for each segment on the basis of the combined ratio. The combined ratio is the sum of the net loss and LAE ratio and the expense ratio and the computations of each component are described below. A combined ratio under 100% indicates underwriting profitability, as the net loss and LAE, commission and other acquisition expenses and general and administrative expenses are less than the net premiums earned and other insurance revenue on that business. We have generated underwriting income in each year since our inception. Underwriting income is calculated by subtracting net loss and LAE, commissions and other acquisition expenses and applicable general and administrative expenses from the net premiums earned and other insurance revenue and is the monetized counterpart of the combined ratio. For purposes of these operating measures, the fee-generating business which is included in the Diversified Reinsurance segment, is considered part of the underwriting operations of the Company.
While an important metric of success, underwriting income and combined ratio do not reflect all components of profitability, as they do not recognize the impact of investment income earned on premiums between the time premiums are received and the time loss payments are ultimately paid to clients. Because we do not manage our cash and investments by segment, investment income and interest expense are not allocated to individual reportable segments. Certain general and administrative expenses are allocated to segments based on various factors, including staff count and each segment’s proportional share of gross premiums written.
The "net loss and LAE ratio" is derived by dividing net loss and LAE by the sum of net premiums earned and other insurance revenue. The "commission and other acquisition expense ratio" is derived by dividing commission and other acquisition expenses by the sum of net premiums earned and other insurance revenue. The "general and administrative expense ratio" is derived by
54
dividing general and administrative expenses by the sum of net premiums earned and other insurance revenue. The "expense ratio" is the sum of the commission and other acquisition expense ratio and the general and administrative expense ratio.
Relevant Factors
Revenues
We derive our revenues primarily from premiums on our insurance policies and reinsurance contracts, net of any reinsurance or retrocessional coverage purchased. Insurance and reinsurance premiums are a function of the amounts and types of policies and contracts we write, as well as prevailing market prices. Our prices are determined before our ultimate costs, which may extend far into the future, are known.
The Company's revenues also include fee income as well as income generated from our investment portfolio. The Company's investment portfolio is comprised of fixed maturity investments, currently held as AFS and HTM, short-term investments and other investments. In accordance with U.S. GAAP, these investments, except for HTM fixed maturities, are carried at fair market value and unrealized gains and losses on the Company's investments are excluded from earnings. These unrealized gains and losses are included on the Company's Consolidated Balance Sheet in accumulated other comprehensive income ("AOCI") as a separate component of shareholders' equity. If unrealized losses are considered to be other-than-temporarily impaired due to a credit event, such losses are included in earnings as a realized loss.
Expenses
Our expenses consist largely of net loss and LAE, commission and other acquisition expenses, general and administrative expenses, interest and amortization expenses, amortization of intangible assets and foreign exchange and other gains or losses.
Net loss and LAE has three main components:
•losses paid, which are actual cash payments to insureds, net of recoveries from reinsurers;
• | change in outstanding loss or case reserves, which represent cedants' best estimate of the likely settlement amount for known claims, less the portion that can be recovered from reinsurers; and |
• | change in IBNR reserves, which are reserves established by us for changes in the values of claims that have been reported to us but are not yet settled, as well as claims that have occurred but have not yet been reported. The portion recoverable from our reinsurers is deducted from the gross estimated loss. |
Commission and other acquisition expenses include commissions, brokerage fees and insurance taxes. Commissions and brokerage fees are usually calculated as a percentage of premiums and depend on the market and line of business and can, in certain instances, vary based on loss sensitive features of reinsurance contracts. Commission and other acquisition expenses are reported after: (1) deducting commissions received on ceded reinsurance; (2) deducting the part of commission and other acquisition expenses relating to unearned premiums; and (3) including the amortization of previously deferred commission and other acquisition expenses.
General and administrative expenses include personnel expenses (including share-based compensation expense), rent expense, professional fees, information technology costs and other general operating expenses.
Critical Accounting Policies and Estimates
It is important to understand our accounting policies in order to understand our financial position and results of operations. The Company’s Consolidated Financial Statements have been prepared in accordance with U.S. GAAP. The preparation of financial statements in conformity with U.S. GAAP requires management to make estimates and assumptions that affect the reported amounts of assets and liabilities at the date of the financial statements and the reported amounts of revenues and expenses during the reporting period. The following presents a discussion of those accounting policies and estimates that management believes are the most critical to its operations and require the most difficult, subjective and complex judgment. If actual events differ significantly from the underlying assumptions and estimates used by management, there could be material adjustments to prior estimates that could potentially adversely affect the Company’s results of operations, financial condition and liquidity. These critical accounting policies and estimates should be read in conjunction with "Notes to Consolidated Financial Statements Note 2. Significant Accounting Policies" included under Item 8 "Financial Statements and Supplementary Data" of this Form 10-K for a full understanding of the Company’s accounting policies.
Reserve for Loss and Loss Adjustment Expenses
General: The amount of time that elapses before a claim is reported to the cedant and then subsequently reported to the reinsurer is commonly referred to in the industry as the reporting tail. Lines of business for which claims are reported quickly are commonly referred to as short-tailed lines; and lines of business for which a longer period of time elapses before claims are reported to the reinsurer are commonly referred to as long-tailed lines. In general, for reinsurance, the time lags are longer than for primary business due to the delay that occurs between the cedant becoming aware of a loss and reporting the information to its reinsurer
(s). The delay varies by reinsurance market (country of cedant), type of treaty, whether losses are paid by the cedant and the size of the loss. The delay could vary from a few weeks to a year or sometimes longer.
Because a significant amount of time can elapse, particularly on longer-tail lines of business, between the assumption of risk, the occurrence of a loss event, the reporting of the event to an insurance company (the primary company or the cedant), the subsequent reporting to the reinsurance company ("the reinsurer") and the ultimate payment of the claim on the loss event by the reinsurer, the Company’s liability for unpaid loss and LAE ("loss reserves") is based largely upon estimates. The Company categorizes loss reserves into two types of reserves: reported outstanding loss reserves ("case reserves") and IBNR reserves. Case reserves represent, for each individual claim, an estimate of unpaid losses, either by the Company’s cedants or the Company’s claims handling professionals, and recorded by the Company. IBNR reserves represent a provision for claims that have been incurred but not yet reported to the Company, as well as future loss development on losses already reported, in excess of the case reserves. The Company updates its estimates for each of the aforementioned categories on a quarterly basis using information received from its cedants.
For excess of loss treaties, cedents generally are required to report losses that either (i) exceed 50% of their retention; or (ii) have a reasonable probability of exceeding the retention; or (iii) meet defined reporting criteria. All reinsurance claims that are reserved are reviewed at least every six months. In addition, reserves for loss and LAE are reviewed every quarter for each cedant. For proportional treaties, cedents are required to give a periodic statement of account, generally monthly or quarterly. These periodic statements typically include information regarding written premiums, earned premiums, unearned premiums, ceding commissions, brokerage amounts, applicable taxes, paid losses and outstanding losses. They can be submitted up to 90 days after the close of the reporting period. Some proportional treaties have specific language requiring earlier notice of serious claims.
For all lines, the Company’s objective is to estimate ultimate loss and LAE. Total loss reserves are then calculated by subtracting losses paid. Similarly, IBNR reserves are calculated by subtraction of case reserves from total loss reserves. IBNR is the estimated liability for (1) changes in the values of claims that have been reported to us but are not yet settled, as well as (2) claims that have occurred but have not yet been reported as well as (3) claims that are closed but subsequently reopen. Each claim is settled individually based upon its merits, and particularly for longer-tailed lines of business, it is not unusual for a claim to take years after being reported to settle, especially if legal action is involved. As a result, the reserve for loss and LAE include significant estimates for IBNR reserves.
The reserve for IBNR is estimated by management for each account based on various factors, including our underwriting teams expectations about loss experience, actuarial analysis and loss experience to date. Our actuaries employ standard actuarial methodologies to determine estimated ultimate loss reserves.
In selecting management's best estimate of loss and LAE reserves, we consider the range of results produced by many actuarial methods and the appropriateness of those estimates. The methodologies that the Company employs include, but may not be limited to, the Expected Loss Ratio method, the Reported Loss and Paid Loss Development methods and the Incurred and (as applicable) Paid Bornhuetter-Ferguson ("BF") methods.
The reserve methodologies employed by the Company are dependent on data that the Company collects. This data consists primarily of case reserves and loss payments reported by the Company’s cedants, and premiums written and earned reported by cedants or estimated by the Company. The actuarial methods used by the Company to project loss reserves in the Diversified Reinsurance segment that it will pay in the future (future liabilities) do not generally include methodologies that are dependent on claim counts reported, claim counts settled or claim counts open as, due to the nature of the Company’s business, this information is not routinely provided by cedants for every treaty. Consequently, actuarial methods relying on this information cannot be used by the Company to estimate loss reserves in the Diversified Reinsurance segment. However, the Company does use actuarial methods in the AmTrust Reinsurance segments that are dependent on claim counts reported, claim counts settled or claim counts open.
The reserve for loss and LAE at December 31, 2015 and 2014 was as follows:
December 31, | 2015 | 2014 | ||||||
($ in Millions) | ||||||||
Reserve for reported loss and LAE | $ | 1,411.7 | $ | 1,241.1 | ||||
Reserve for losses incurred but not reported | 1,098.4 | 1,030.2 | ||||||
Reserve for loss and LAE | $ | 2,510.1 | $ | 2,271.3 | ||||
While management believes that our case reserves and IBNR are sufficient to cover losses assumed by us, there can be no assurance that losses will not deviate from our reserves, possibly by material amounts. The methodology and assumptions used to estimate loss reserves are reviewed at least quarterly, with adjustments made as appropriate. To the extent actual reported losses exceed estimated losses, the carried estimate of the ultimate losses will be increased (i.e. unfavorable reserve development), and to the extent actual reported losses are less than our expectations, the carried estimate of ultimate losses will be reduced (i.e. favorable reserve development). We record any changes in our loss reserve estimates and the related reinsurance recoverable in the periods in which they are determined.
55
Loss reserves do not represent an exact calculation of liability. Rather, loss reserves are estimates of what we expect the ultimate resolution and administration of claims will cost. These estimates are based on actuarial projections and on our assessment of currently available data, as well as estimates of future trends in claims severity and frequency, judicial theories of liability and other factors. Loss reserve estimates are refined as experience develops and as claims are reported and resolved. In addition, the relatively long periods between when a loss occurs and when it may be reported to our claims department for our casualty reinsurance lines of business also increase the uncertainties of our reserve estimates in such lines.
Actuarial Methods Used to Estimate Loss and Loss Adjustment Expense Reserves: We utilize a variety of standard actuarial methods in our analysis. The selections from these various methods are based on the loss development characteristics of the specific line of business. The actuarial methods we utilize include:
The Expected Loss Ratio ("ELR") method is a technique that multiplicatively applies an expected loss ratio to earned premium to yield estimated ultimate losses. The ELR assumption is derived most often from the pricing of the business that is being reserved but can be based on historical experience of the business. This method is frequently used for the purpose of stability in the early valuations of an underwriting year with large and uncertain loss development factors. This technique does not take into account actual loss experience for the underwriting year being projected. As an underwriting year matures and actual loss experience becomes available, other methods may be applied in determining the estimated ultimate losses.
The Loss Development ("LD") method is a common reserving method in which ultimate losses are estimated by applying a loss development factor to actual reported (or paid) loss experience. This method fully utilizes actual experience. Multiplication of underwriting year actual reported (or paid) losses by its respective development factor produces the estimated ultimate losses. The LD method is based upon the assumption that the relative change in a given underwriting year’s losses from one evaluation point to the next is similar to the relative change in prior underwriting years’ losses at similar evaluation points. In addition, this method is based on the assumption that the reserving and payment patterns as well as the claim handling procedures have not changed substantially over time. When a company has a sufficiently reliable loss development history, a development pattern based on the company’s historical indications may be used to develop losses to ultimate values.
The BF reserving technique is commonly used for long-tailed or volatile lines. It is also useful in situations where the reported loss experience is relatively immature and/or lacks sufficient credibility for the application of methods that are more heavily reliant on emerged experience. The BF method is an additive IBNR method that combines the ELR and LD techniques by splitting the expected loss into two pieces - expected reported (or paid) losses and expected unreported (or unpaid) losses. Expected unreported (unpaid) losses are added to the current actual reported (or paid) losses to produce an estimate of ultimate losses by underwriting year. The BF method introduces an element of stability that moderates the impact of inconsistent changes in paid and reported amounts.
The average frequency and severity (“FS”) technique is used for lines where claim count is available, and the estimate of loss development factors is more difficult due to volatility in historical data. The available data for such lines is usually more volatile in the estimation of future losses using the LD and BF reserving methods. The frequency and severity method uses historical data to estimate the average number of reported claims (frequency) and the average costs of closed claims (severity). The estimate of ultimate losses by underwriting year is the result of the multiplication of the average number of claims and the average cost of a claim.
With the guidance of the methods above, actuarial judgment is applied in the determination of ultimate losses. In general, the Company’s segments have varying levels of seasoning with which the Company has direct experience and as a result, differing methods are utilized to estimate loss and LAE reserves in each segment.
In the Diversified Reinsurance segment, the Company’s executive and technical management, including claims and underwriting, have significant experience with this book of business, which also has more than 30 years of loss experience associated with it. In general for the Diversified Reinsurance segment, we utilize the ELR approach at the onset of reserving an account, the BF method for business with less but maturing loss experience, and as the experience matures the LD Method.
The Company has underwritten the AmTrust Reinsurance segment since July 1, 2007. The majority of the exposure in the underlying book of business has significant seasoning, and allows for a significant amount of credibility in using parameters derived from historical experience to calculate reserve estimates. Some segments of the book are a result of recent acquisitions or newer markets for AmTrust. These segments require a greater level of assumptions and professional judgment in deriving reserve levels, which inherently implies a wider range of reasonable estimates. As a result, we have tended to rely on a weighted approach which primarily employs the LD method for aspects of the segment with ample historical data, while also considering the ELR or BF method for exposure resulting from recent acquisitions, or a relative business with a more limited level of experience.The FS method is also considered for segments of the AmTrust book for which claim count information is available.
The Company’s actuarial analysis of this book of business is more refined in that it utilizes a combination of quarterly and annual data instead of contract period data in totality. Additional data detailing items such as class of business, state, claim counts, frequency and severity is available, further enhancing the reserve analysis. Because of the refinement of the data, this allows for greater use of the loss development method earlier on in the maturity of the book than would ordinarily occur.
Significant Assumptions Employed in the Estimation of Reserve for Loss and Loss Adjustment Expenses: The most significant assumptions used at December 31, 2015 to estimate the reserve for loss and LAE within the Company’s segments are as follows:
56
• | the information developed from internal and independent external sources can be used to develop meaningful estimates of the likely future performance of business bound by the Company; |
• | the loss and exposure information provided by ceding companies, insureds and brokers in support of their submissions have been used by Maiden's pricing actuaries to derive meaningful estimates of the likely future performance of business bound with respect to each contract and policy; |
• | historic loss development and trend experience is assumed to be indicative of future loss development and trends; and |
• | no significant emergence of losses or types of losses that are not represented in the information supplied to the Company by its brokers, ceding companies and insureds will occur. |
The above four assumptions most significantly influence the Company’s determination of initial expected loss ratios and expected loss reporting patterns that are the key inputs which impact potential variability in the estimate of the reserve for loss and LAE and are applicable to each of the Company’s business segments. These factors are combined with the actuarial judgment exercised by our reserving staff, and validated by the external review of our reserving levels.While there can be no assurance that any of the above assumptions will prove to be correct, we believe that this process represents a realistic and appropriate basis for estimating the reserve for loss and LAE. Our reporting factors and expected loss ratios are based on a blend of our own experience, cedant experience and industry benchmarks. The benchmarks selected were those that we believe are most similar to our underwriting business.
Factors Creating Uncertainty in the Estimation of the Reserve for Loss and Loss Adjustment Expenses: While management does not at this time include an explicit or implicit provision for uncertainty in its reserve for loss and LAE, certain of the Company’s business lines are by their nature subject to additional uncertainties, which are discussed in detail below. In addition, the Company’s reserves are subject to additional factors which add to the uncertainty of estimating reserve for loss and LAE. Time lags in the reporting of losses can also introduce further ambiguity to the process of estimating reserve for loss and LAE.
The inherent uncertainty of estimating the Company’s reserve for loss and LAE increases principally due to:
• | the lag in time between the time claims are reported to the ceding company and the time they are reported through one or more reinsurance broker intermediaries to the Company; |
• | the differing reserving practices among ceding companies; |
• | the diversity of loss development patterns among different types of reinsurance treaties or contracts; and |
• | the Company’s need to rely on its ceding companies for loss information, which also exposes the Company to changes in the reserving philosophy of the ceding company and the adequacy of its underlying case reserves. |
In order to verify the accuracy and completeness of the information provided to the Company by its ceding company counterparties, the Company’s underwriters, actuaries, accounting and claims personnel perform underwriting and claims reviews, and also accounting and financial audits, of the Company’s ceding companies. Any material findings are communicated to the ceding companies and utilized in the establishment or revision of the Company’s case reserves and related IBNR reserve. On occasion, these reviews reveal that the ceding company’s reported loss and LAE do not comport with the terms of the contract with the Company. In such events, the Company strives to resolve the outstanding differences in an amicable fashion. The large majority of such differences are resolved in this manner. In the infrequent instance where an amicable solution is not feasible, the Company’s policy is to vigorously defend its position in litigation or arbitration. At December 31, 2015, the Company was not involved in any material claims litigation or arbitration proceedings.
Due to the large volume of potential transactions that must be recorded in the insurance and reinsurance industry, backlogs in the recording of the Company’s business activities can also impair the accuracy of its loss and LAE reserve estimates. At December 31, 2015, there were no significant backlogs related to the processing of policy or contract information in the Company’s segments.
The Company assumes in its loss and LAE reserving process that, on average, the time periods between the recording of expected losses and the reporting of actual losses are predictable when measured in the aggregate and over time. The time period over which all losses are expected to be reported to the Company varies significantly by line of business. This period can range from a few quarters for some lines, such as property, to many years for some casualty lines of business. To the extent that actual reported losses are reported more quickly or more slowly than expected, the Company may adjust its estimate of ultimate loss.
Potential Volatility in the Reserve for Loss and Loss Adjustment Expenses: In addition to the factors creating uncertainty in the Company’s estimate of loss and LAE, the Company’s estimated reserve for loss and LAE can change over time because of unexpected changes in the external environment. Potential changing external factors include:
• | changes in the inflation rate for goods and services related to the covered damages; |
• | changes in the general economic environment that could cause unanticipated changes in claim frequency or severity; |
57
• | changes in the litigation environment regarding the representation of plaintiffs and potential plaintiffs; |
• | changes in the judicial and/or arbitration environment regarding the interpretation of policy and contract provisions relating to the determination of coverage and/or the amount of damages awarded for certain types of claims; |
• | changes in the social environment regarding the general attitude of juries in the determination of liability and damages; |
• | changes in the legislative environment regarding the definition of damages; |
• | new types of injuries caused by new types of injurious activities or exposures; and |
• | changes in ceding company case reserving and reporting patterns. |
The Company’s estimates of reserve for loss and LAE can also change over time because of changes in internal company operations, such as:
• | alterations in claims handling procedures; |
• | growth in new lines of business where exposure and loss development patterns are not well established; or |
• | changes in the quality of risk selection or pricing in the underwriting process. |
Due to the inherent complexity of the assumptions used in establishing the Company’s loss and LAE reserve estimates, final claim settlements made by the Company may vary significantly from the present estimates, particularly when those settlements may not occur until well into the future. The expected pattern of loss emergence and the projected level of profitability, two primary factors in establishing the loss and LAE reserves, are subject to a normal level of variance. The recognition of this variance defines a possible range of reserve estimates, from which the best estimate of the provision for reserves is estimated. In addition, the Company’s segments have varying levels of seasoning with which the Company has direct experience and as a result, the reasonably likely variance of our expected loss ratio for each segment varies commensurately with that experience.
Based on a range of reasonable reserve estimates, we believe that if our final loss ratio were to vary from the expected loss ratios in the aggregate, our required reserves after reinsurance recoverable could increase by approximately $251.6 million, or 10% of our loss and LAE reserves, from December 31, 2015.
The Company has underwritten the AmTrust Reinsurance segment since July 1, 2007. In addition, certain aspects of this segment are associated with recent acquisitions by AmTrust and while the underlying experience of the book has significant seasoning, the combination of the shorter time frame with which the Company has direct experience with this business and the relative immaturity of certain aspects of this business may result in a greater range of volatility in the reasonably likely variance of our expected loss ratio for all applicable loss years in the segment compared to the Diversified Reinsurance segment.
Premiums and Commissions and Other Acquisition Expenses
For pro-rata contracts and excess-of-loss contracts where no deposit or minimum premium is specified in the contract, written premium is recognized based on estimates of ultimate premiums provided by the ceding companies. Initial estimates of written premium are recognized in the period in which the underlying risks are incepted. Subsequent adjustments, based on reports of actual premium by the ceding companies, or revisions in estimates, are recorded in the period in which they are determined. Reinsurance premiums assumed are generally earned on a pro rata basis over the terms of the underlying policies or reinsurance contracts.
Contracts and policies written on a "losses occurring" basis cover claims that may occur during the term of the contract or policy, which is typically 12 months. Accordingly, the premium is earned evenly over the term. Contracts which are written on a "risks attaching" basis cover claims which attach to the underlying insurance policies written during the terms of such contracts. Premiums earned on such contracts extend beyond the original term of the reinsurance contract, typically resulting in recognition of premiums earned over a 24-month period.
Reinsurance premiums on specialty risk and extended warranty are earned based on the estimated program coverage period. These estimates are based on the expected distribution of coverage periods by contract at inception, because a single contract may contain multiple coverage period options and these estimates are revised based on the actual coverage period selected by the original insured.
Unearned premiums represent the portion of premiums written which is applicable to the unexpired term of the contract or policy in force. These premiums can be subject to estimates based upon information received from ceding companies and any subsequent differences arising on such estimates are recorded in the period in which they are determined.
The Company provides proportional and non-proportional reinsurance coverage to cedants (insurance companies). In most cases, cedants seek protection for business that they have not yet written at the time they enter into reinsurance agreements and thus have to estimate the volume of premiums they will cede to the Company. Reporting delays are inherent in the reinsurance
58
industry and vary in length by type of treaty. As delays can vary from a few weeks to a year or sometimes longer, the Company produces accounting estimates to report premiums and commission and other acquisition expenses until it receives the cedants’ actual results. Under proportional treaties, which represented 91.0% of gross premiums written for the year December 31, 2015, the Company shares proportionally in both the premiums and losses of the cedant and pays the cedant a commission to cover the cedant’s acquisition expenses. Under this type of treaty, the Company’s ultimate premiums written and earned and acquisition expenses are not known at the inception of the treaty and must be estimated until the cedant reports its actual results to the Company. Under non-proportional treaties, which represented 9.0% of gross premiums written for the year December 31, 2015, the Company is typically exposed to loss events in excess of a predetermined dollar amount or loss ratio and receives a deposit or minimum premium, which is subject to adjustment depending on the premium volume written by the cedant.
Reported premiums written and earned and commission and other acquisition expenses on proportional treaties are generally based upon reports received from cedants and brokers, supplemented by the Company’s own estimates of premiums written and commission and other acquisition expenses for which ceding company reports have not been received. Premium and acquisition expenses estimates are determined at the individual treaty level based upon contract provisions. The determination of estimates requires a review of the Company’s experience with cedants, a thorough understanding of the individual characteristics of each line of business and the ability to project the impact of current economic indicators on the volume of business written and ceded by the Company’s cedants. Estimates for premiums and commission and other acquisition expenses are updated continuously as new information is received from the cedants. Differences between such estimates and actual amounts are recorded in the period in which estimates are changed or the actual amounts are determined.
Assessing whether or not a reinsurance contract meets the condition for risk transfer requires judgment. The determination of risk transfer is critical to reporting premiums written and is based, in part, on the use of actuarial and pricing models and assumptions. If we determine that a reinsurance contract does not transfer sufficient risk, we account for the contract as deposit liability.
Acquisition expenses represent the costs of writing business that vary with, and are primarily related to, the production of the business. Acquisition expenses that are related to successful contracts are deferred and recognized as expense over the same period in which the related premiums are earned.
Only certain expenses incurred in the successful acquisition of new and renewal insurance contracts are capitalized. Those expenses include incremental direct costs of contract acquisition that result directly from and are essential to the contract transaction and would not have been incurred had the contract transaction not occurred. All other acquisition-related expenses, such as costs incurred for soliciting business, administration, and unsuccessful acquisition or renewal efforts are charged to expense as incurred. Administrative expenses, including rent, depreciation, occupancy, equipment, and all other general overhead expenses are considered indirect and are expensed as incurred.
The Company considers anticipated investment income in determining the recoverability of these deferred costs and believes they are fully recoverable. A premium deficiency is recognized if the sum of anticipated losses and loss adjustment expenses, unamortized acquisition expenses and anticipated investment income exceed unearned premium.
Fair Value of Financial Instruments
Please refer to "Notes to Consolidated Financial Statements Note 5. Fair Value of Financial Instruments" included under Item 8 "Financial Statements and Supplementary Data" of this Form 10-K on page F-25 for a discussion on the fair value methodology and valuation techniques used by the Company to determine the fair value of the financial instruments held at December 31, 2015 and 2014.
Other-Than-Temporary Impairment ("OTTI") of Investments
Please refer to "Notes to Consolidated Financial Statements Note 2. "Significant Accounting Policies" included under Item 8 "Financial Statements and Supplementary Data" of this Form 10-K on page F-8 for a discussion on the OTTI evaluation performed by the Company to determine if an impairment is OTTI.
The Company recognized $1.1 million of OTTI through earnings for the year ended December 31, 2015 (2014 - $2.4 million and 2013 - $0). Please refer to "Notes to Consolidated Financial Statements Note 4. Investments" included under Item 8 "Financial Statements and Supplementary Data" of this Form 10-K on page F-20 for further details.
Goodwill and Intangible Assets
The Company recognizes Goodwill and Intangible Assets in connection with certain acquisitions. Goodwill represents the excess of the cost of acquisitions over the fair value of the net assets acquired and is assigned to the applicable reporting unit(s) on the acquisition date, based upon the expected benefit to be received by the reporting unit. Intangible Assets consist of finite and indefinite life assets. Finite life intangible assets include customer and producer relationships and trademarks with useful life of 15 years. Insurance company licenses are considered indefinite life intangible assets.
On November 4, 2015, Maiden US finalized the sale of its wholly owned subsidiary, Maiden Specialty, to Clear Blue. On the same date, The goodwill and intangible assets disposed of, by way of this sale agreement, were $1.1 million and $3.2 million, respectively.
59
Annually, the Company makes an assessment as to whether the value of the Company’s goodwill and intangible assets are impaired. Impairment, which can be either partial or full, is based on a fair value analysis by individual reporting unit. Based upon the Company’s assessment at the reporting unit level, there was no impairment of its goodwill and intangible assets at December 31, 2015 of $81.9 million.
In making an assessment of the value of its goodwill and intangible assets, the Company uses both market based and non-market based valuations. Assumptions underlying these valuations include an analysis of the Company’s share price relative to both its book value and its net income in addition to forecasts of future cash flows and future profits. Significant changes in the data underlying these assumptions could result in an assessment of impairment of the Company’s goodwill asset. In addition, if the current economic environment and/or the Company’s financial performance were to deteriorate significantly, this could lead to an impairment of goodwill and intangible, the write-off of which would be recorded against net income in the period such deterioration occurred. If a 5% decline in the fair value of the reporting units occurred, this would not result in an impairment of the goodwill asset at December 31, 2015.
Results of Operations
The following table sets forth our selected Consolidated Statement of Income data for each of the periods indicated.
For the Year Ended December 31, | 2015 | 2014 | 2013 | |||||||||
($ in Millions) | ||||||||||||
Gross premiums written | $ | 2,662.8 | $ | 2,507.4 | $ | 2,204.2 | ||||||
Net premiums written | $ | 2,514.1 | $ | 2,458.1 | $ | 2,096.3 | ||||||
Net premiums earned | $ | 2,429.1 | $ | 2,251.7 | $ | 2,000.9 | ||||||
Other insurance revenue | 11.5 | 13.4 | 14.2 | |||||||||
Net loss and loss adjustment expenses | (1,633.6 | ) | (1,498.3 | ) | (1,349.6 | ) | ||||||
Commission and other acquisition expenses | (724.2 | ) | (659.3 | ) | (556.6 | ) | ||||||
General and administrative expenses | (40.5 | ) | (42.1 | ) | (39.9 | ) | ||||||
Underwriting income | 42.3 | 65.4 | 69.0 | |||||||||
Other general and administrative expenses | (24.4 | ) | (20.4 | ) | (18.5 | ) | ||||||
Net investment income | 131.1 | 117.2 | 91.4 | |||||||||
Net realized gains on investment | 2.5 | 1.2 | 3.6 | |||||||||
Net impairment losses recognized in earnings | (1.1 | ) | (2.4 | ) | — | |||||||
Accelerated amortization of junior subordinated debt discount and issuance cost | — | (28.2 | ) | — | ||||||||
Amortization of intangible assets | (2.8 | ) | (3.3 | ) | (3.8 | ) | ||||||
Foreign exchange and other gains | 7.8 | 4.2 | 2.8 | |||||||||
Interest and amortization expenses | (29.1 | ) | (30.0 | ) | (39.8 | ) | ||||||
Income tax expense | (2.1 | ) | (2.2 | ) | (1.9 | ) | ||||||
Net Income | 124.2 | 101.5 | 102.8 | |||||||||
Loss (income) attributable to noncontrolling interests | 0.2 | (0.1 | ) | (0.1 | ) | |||||||
Dividends on preference shares | (24.3 | ) | (24.3 | ) | (14.8 | ) | ||||||
Net income attributable to Maiden common shareholders | $ | 100.1 | $ | 77.1 | $ | 87.9 | ||||||
Ratios | ||||||||||||
Net loss and LAE ratio (1) | 66.9 | % | 66.1 | % | 67.0 | % | ||||||
Commission and other acquisition expense ratio (2) | 29.7 | % | 29.1 | % | 27.6 | % | ||||||
General and administrative expense ratio (3) | 2.7 | % | 2.8 | % | 2.9 | % | ||||||
Expense ratio (4) | 32.4 | % | 31.9 | % | 30.5 | % | ||||||
Combined ratio (5) | 99.3 | % | 98.0 | % | 97.5 | % | ||||||
60
(1) | Calculated by dividing net loss and LAE by the sum of net premiums earned and other insurance revenue. |
(2) | Calculated by dividing commission and other acquisition expenses by the sum of net premiums earned and other insurance revenue. |
(3) | Calculated by dividing general and administrative expenses by the sum of net premiums earned and other insurance revenue. |
(4) | Calculated by adding together commission and other acquisition expense ratio and general and administrative expense ratio. |
(5) | Calculated by adding together net loss and LAE ratio and the expense ratio. |
Net Income
Comparison of Years Ended December 31, 2015 and 2014
Net income attributable to Maiden common shareholders for the year ended December 31, 2015 increased to $100.1 million from $77.1 million for the same period in 2014. The factors that contributed to this net increase were as follows:
• | redemption of the Company's Junior Subordinated Debt in the first quarter of 2014 leading to a non-recurring, non-cash charge of $28.2 million, which represented the accelerated amortization of original issue discount and write off of issuance costs associated with the Junior Subordinated Debt. As shown in our Item 7 Key Financial Measures on page 52, excluding this non-recurring, non-cash charge in 2014, net income attributable to Maiden common shareholders for the year ended December 31, 2015, compared to the same period in 2014, would decrease by $5.2 million or 4.9%; |
• | increase in investment income of $13.9 million, or 11.8%, for the year ended December 31, 2015 compared to the same period in 2014. This increase reflects the growth in average investable assets of 14.8%, however, this growth was partially offset by a slight reduction in yields. |
The increases above were offset by the following:
• | decrease in underwriting income of $23.1 million, or 35.3%, for the year ended December 31, 2015 compared to the same period in 2014. This decrease arose in our Diversified Reinsurance segment and was driven primarily by 1) adverse development on Maiden US commercial auto business; 2) loss of a large customer and expiration of a fronting arrangement in the latter periods of 2014; and 3) foreign exchange impact on our non-U.S. underwriting portfolio due to the strengthening of the U.S. dollar during the year. |
Comparison of Years Ended December 31, 2014 and 2013
Net income attributable to Maiden common shareholders for the year ended December 31, 2014 was $77.1 million compared to $87.9 million for the same period in 2013. The factors that contributed to this net decrease were as follows:
• | redemption of the Company's Junior Subordinated Debt which resulted in a non-recurring, non-cash charge of $28.2 million, which represents the accelerated amortization of original issue discount and write-off of issuance costs associated with the Junior Subordinated Debt. Excluding this non-recurring, non-cash charge, net income attributable to Maiden common shareholders increased by 19.8% for the year ended December 31, 2014, compared to the same period in 2013; and |
• | increase in dividends paid on preference shares of $9.5 million due to the dividends on the Preference Shares - Series B being paid for the full year. The Preference Shares - Series B were issued on October 1, 2013. |
The decreases above, were offset by the following:
• | growth in investment income of $25.8 million due primarily to a 19.0% increase in our average invested assets along with an improvement in our overall portfolio yields for the year ended December 31, 2014 compared to the same period in 2013; and |
• | net reduction in interest expense of $9.8 million primarily due to the redemption of the Junior Subordinated Debt in the first quarter of 2014, which previously incurred an annual interest charge of $21.4 million. This reduction was partially offset by the interest expense incurred by the Company on the 2013 Senior Notes issued on November 25, 2013, which has an annual interest charge of $11.8 million. |
The following is a discussion on the results of our operations for the years ended December 31, 2015, 2014 and 2013:
Net Premiums Written
Comparison of Years Ended December 31, 2015 and 2014
Net premiums written increased by $56.0 million, or 2.3%, for the year ended December 31, 2015 compared to the same period in 2014. The increase in net premiums written for the year ended December 31, 2015, compared to the same period in 2014, was due to the continuing strong growth in business written in our AmTrust Reinsurance segment partially offset by the loss of business in the Diversified Reinsurance segment.
The tables below compare net premiums written by our reportable segments, reconciled to the total net premiums written:
61
For the Year Ended December 31, | 2015 | 2014 | Change in | ||||||||||||||||||
Total | % of Total | Total | % of Total | $ | % | ||||||||||||||||
($ in Millions) | ($ in Millions) | ($ in Millions) | |||||||||||||||||||
Diversified Reinsurance | $ | 734.8 | 29.2 | % | $ | 850.0 | 34.6 | % | $ | (115.2 | ) | (13.6 | )% | ||||||||
AmTrust Reinsurance | 1,779.3 | 70.8 | % | 1,610.5 | 65.5 | % | 168.8 | 10.5 | % | ||||||||||||
Total - reportable segments | 2,514.1 | 100.0 | % | 2,460.5 | 100.1 | % | 53.6 | 2.2 | % | ||||||||||||
Other | — | — | % | (2.4 | ) | (0.1 | )% | 2.4 | NM | ||||||||||||
Total | $ | 2,514.1 | 100.0 | % | $ | 2,458.1 | 100.0 | % | $ | 56.0 | 2.3 | % | |||||||||
NM - not meaningful
The increase in net premiums written in our AmTrust Reinsurance segment for the year ended December 31, 2015 compared to the same period in 2014 reflects AmTrust's continued expansion through a combination of acquisitions and ongoing organic growth partially offset by 1) the Company entering into an agreement with AmTrust to commute outstanding liabilities, loss reserves and unearned premiums, associated with certain classes and lines of business resulting in a reduction of net written premiums of approximately 3.5% for the year ended December 31, 2015; 2) an unfavorable impact from foreign exchange movements; and 3) the Company entering into a retrocessional quota share agreement with a highly rated global insurer entered into effective January 1, 2015. There was no such retrocessional quota share agreement in force during 2014. Please refer to the analysis of our AmTrust Reinsurance segment on page 71 for further details.
Net premiums written in our Diversified Reinsurance segment decreased by $115.2 million or 13.6% during the year ended December 31, 2015 compared to the same period in 2014. These reductions were due to 1) declines in both our U.S. and International business as discussed above; 2) adverse impact on our non-U.S. underwriting portfolio due to the strengthening of the U.S. dollar during the year; and 3) the Company entering into a retrocessional quota share agreement with a highly rated global insurer entered into effective January 1, 2015. There was no such retrocessional quota share agreement in force during 2014. Please refer to the analysis of our Diversified Reinsurance segment on page 67 for further details.
Comparison of Years Ended December 31, 2014 and 2013
Net premiums written increased by $361.8 million, or 17.3%, for the year ended December 31, 2014 compared to the same period in 2013. The increase in net premiums written was primarily the result of strong growth in business written in both the AmTrust Reinsurance and the Diversified Reinsurance segments.
The tables below compare net premiums written by our reportable segments, reconciled to the total net premiums written, for the years ended December 31, 2014 and 2013:
For the Year Ended December 31, | 2014 | 2013 | Change in | ||||||||||||||||||
Total | % of Total | Total | % of Total | $ | % | ||||||||||||||||
($ in Millions) | ($ in Millions) | ($ in Millions) | |||||||||||||||||||
Diversified Reinsurance | $ | 850.0 | 34.6 | % | $ | 763.4 | 36.4 | % | $ | 86.6 | 11.4 | % | |||||||||
AmTrust Reinsurance | 1,610.5 | 65.5 | % | 1,169.9 | 55.8 | % | 440.6 | 37.7 | % | ||||||||||||
Total - reportable segments | 2,460.5 | 100.1 | % | 1,933.3 | 92.2 | % | 527.2 | 27.3 | % | ||||||||||||
Other | (2.4 | ) | (0.1 | )% | 163.0 | 7.8 | % | (165.4 | ) | (101.5 | )% | ||||||||||
Total | $ | 2,458.1 | 100.0 | % | $ | 2,096.3 | 100.0 | % | $ | 361.8 | 17.3 | % | |||||||||
The increase in net premiums written in our AmTrust Reinsurance segment for the year ended December 31, 2014 compared to the same period in 2013 reflects AmTrust's continued expansion through continued organic growth and improved rate levels, particularly in its U.S. workers' compensation business as well as additional premiums written related to acquisitions. Net premiums written in our Diversified Reinsurance segment increased by $86.6 million, or 11.4%, for the year ended December 31, 2014 compared to the same period in 2013, primarily due to growth in the business written by Maiden US.
Net Premiums Earned
Comparison of Years Ended December 31, 2015 and 2014
Net premiums earned increased by $177.4 million, or 7.9%, for the year ended December 31, 2015 compared to the same period in 2014. The increase in net premiums earned was primarily the result of strong growth in business written in the AmTrust Reinsurance segment offset by a reduction in the earned premiums in our Diversified Reinsurance segment and business included in our Other category.
62
The table below compares net premiums earned by our reportable segments, reconciled to the total net premiums earned:
For the Year Ended December 31, | 2015 | 2014 | Change in | ||||||||||||||||||
Total | % of Total | Total | % of Total | $ | % | ||||||||||||||||
($ in Millions) | ($ in Millions) | ($ in Millions) | |||||||||||||||||||
Diversified Reinsurance | $ | 744.9 | 30.7 | % | $ | 854.0 | 37.9 | % | $ | (109.1 | ) | (12.8 | )% | ||||||||
AmTrust Quota Share Reinsurance | 1,684.2 | 69.3 | % | 1,378.3 | 61.2 | % | 305.9 | 22.2 | % | ||||||||||||
Total - reportable segments | 2,429.1 | 100.0 | % | 2,232.3 | 99.1 | % | 196.8 | 8.8 | % | ||||||||||||
Other | — | — | % | 19.4 | 0.9 | % | (19.4 | ) | NM | ||||||||||||
Total | $ | 2,429.1 | 100.0 | % | $ | 2,251.7 | 100.0 | % | $ | 177.4 | 7.9 | % | |||||||||
NM - not meaningful
The net premiums earned in the AmTrust Reinsurance segment increased for the year ended December 31, 2015 compared to 2014 due to the reasons outlined in Net Premiums Written section above. Please refer to the analysis of our AmTrust Reinsurance segment on page 71 for further discussion.
Net premiums earned in our Diversified Reinsurance segment decreased for the year ended December 31, 2015 compared to 2014 due to the reasons outlined in the Net Premiums Written section above. Please refer to the analysis of our Diversified Reinsurance segment on page 67 for further discussion.
Our Other category comprises business in run-off with all premiums written on the agreements being fully earned by December 31, 2014.
Comparison of Years Ended December 31, 2014 and 2013
Net premiums earned increased by $250.8 million, or 12.5%, for the year ended December 31, 2014 compared to the same period in 2013. The increase in net premiums earned was primarily the result of strong growth in business written in the AmTrust Reinsurance and Diversified Reinsurance segments.
The table below compares net premiums earned by our reportable segments, reconciled to the total net premiums earned for the years ended December 31, 2014 and 2013:
For the Year Ended December 31, | 2014 | 2013 | Change in | ||||||||||||||||||
Total | % of Total | Total | % of Total | $ | % | ||||||||||||||||
($ in Millions) | ($ in Millions) | ($ in Millions) | |||||||||||||||||||
Diversified Reinsurance | $ | 854.0 | 37.9 | % | $ | 753.2 | 37.6 | % | $ | 100.8 | 13.4 | % | |||||||||
AmTrust Quota Share Reinsurance | 1,378.3 | 61.2 | % | 988.9 | 49.4 | % | 389.4 | 39.4 | % | ||||||||||||
Total - reportable segments | 2,232.3 | 99.1 | % | 1,742.1 | 87.0 | % | 490.2 | 28.1 | % | ||||||||||||
Other | 19.4 | 0.9 | % | 258.8 | 13.0 | % | (239.4 | ) | (92.5 | )% | |||||||||||
Total | $ | 2,251.7 | 100.0 | % | $ | 2,000.9 | 100.0 | % | $ | 250.8 | 12.5 | % | |||||||||
The increase in net premiums earned in the AmTrust Reinsurance segment, for the year ended December 31, 2014 compared to 2013 reflects AmTrust's continued expansion through continued organic growth and improved rate levels, particularly in its U.S. workers' compensation business as well as additional premiums written related to acquisitions. Net premiums earned in our Diversified Reinsurance segment increased by $100.8 million, or 13.4%, for the year ended December 31, 2014 compared to 2013. The growth in the U.S. is due to both new accounts and organic growth from certain existing Maiden US accounts.
Other Insurance Revenue
Other insurance revenue represents fee business that is not directly associated with premiums revenue assumed by the Company. See "Results of Operations- Diversified Reinsurance Segment" on page 67 for further information.
Net Investment Income, Net Realized Gains on Investment and Net Impairment Losses Recognized in Earnings
Comparison of Years Ended December 31, 2015 and 2014
Net Investment Income - Net investment income increased by $13.9 million, or 11.8%, for the year ended December 31, 2015 compared to the same period in 2014.
63
For the year ended December 31, 2015, average invested assets grew by 14.7% giving rise to the increase in net investment income compared to the same period in 2014. The growth in average invested assets during this period was the result of: 1) our continued profitable growth; 2) strong positive cash flow from operations during the period reported; and 3) issuance of the Preference Shares - Series C, with net proceeds of $159.6 million. The Company's average book yields were marginally lower for the year ended December 31, 2015 compared to the same period in 2014.
The following table details the Company's average invested assets and average book yield for the year ended December 31, 2015 compared to the same period in 2014:
For the Year Ended December 31, | 2015 | 2014 | ||||||
($ in Millions) | ||||||||
Average invested assets(1) | $ | 4,378.4 | $ | 3,818.7 | ||||
Average book yield(2) | 3.0 | % | 3.1 | % | ||||
(1)The average of the Company's investments, cash and cash equivalents, restricted cash and loan to related party at each quarter-end during the year.
(2) Ratio of net investment income over average invested assets at fair value.
Net Realized Gains on Investment - Net realized gains on investment were $2.5 million for the year ended December 31, 2015, compared to $1.2 million for the same period in 2014.
Net Impairment Losses Recognized in Earnings - The Company recognized $1.1 million of OTTI on investment for the year ended December 31, 2015 compared to $2.4 million for the same period in 2014. Following reviews of its fixed maturity investments to determine whether declines in fair value below amortized cost were considered other-than-temporary, the Company determined that there was a credit impairment in respect of one corporate bond. The Company does not intend to sell this security, however we do not believe it is probable that we will recover the amortized cost basis of the security.
Comparison of Years Ended December 31, 2014 and 2013
Net Investment Income - Net investment income increased by $25.8 million, or 28.3%, for the year ended December 31, 2014 compared to the same period in 2013. The following table details the Company's average invested assets and average book yield for the year ended December 31, 2014 compared to the same period in 2013:
For the Year Ended December 31, | 2014 | 2013 | ||||||
($ in Millions) | ||||||||
Average invested assets (1) | $ | 3,818.7 | $ | 3,210.2 | ||||
Average book yield (2) | 3.1 | % | 2.8 | % | ||||
(1)The average of the Company's investments, cash and cash equivalents, restricted cash, loan to related party and funds withheld balance as of each quarter-end during the year.
(2) Ratio of net investment income over average invested assets at fair value.
The increase in net investment income for the year ended December 31, 2014 compared to the same period in 2013 is primarily the result of the 19.0% growth in average invested assets for the year ended December 31, 2014 compared to the same period in 2013 combined with improvement on our overall portfolio yields despite the continuing low interest rate environment. The growth in average invested assets during this period compared to the same period in 2013 was the result of: 1) our continued profitable growth and 2) strong positive cash flow from operations during the period reported which was offset by 3) the repayment of the Junior Subordinated Debt of $152.5 million on January 15, 2014.
In addition to the aforementioned growth in invested assets, the improvement in investment income during the year ended December 31, 2014 compared to the same period in 2013 was also due to lower paydowns on the Company's U.S. government agency MBS portfolio, resulting in reduced amortization expense for those MBS securities purchased at a premium.
Net Realized Gains on Investment - Net realized gains on investment were $1.2 million for the year ended December 31, 2014, compared to $3.6 million for the same period in 2013.
Net Impairment Losses Recognized in Earnings - The Company recognized $2.4 million of OTTI for the year ended December 31, 2014 compared to none in 2013. Following the review of its AFS investments to determine whether declines in fair value below the amortized cost basis were considered other-than-temporary, at December 31, 2014, the Company determined that there was a credit impairment in respect of one corporate bond. The Company does not intend to sell this security, but we do not believe it is probable that we will recover the amortized cost basis of the security
64
Net Loss and Loss Adjustment Expenses
Comparison of Years Ended December 31, 2015 and 2014
Net loss and LAE increased by $135.3 million, or 9.0%, for the year ended December 31, 2015 compared to 2014. This net increase reflects the continued growth of the business in our AmTrust Reinsurance segment along with the factors offsetting this growth, as discussed in Net Premiums Written above, combined with unfavorable results experienced by Maiden US in its commercial auto liability accounts.
The net loss and LAE ratios were 66.9% and 66.1% for the years ended December 31, 2015 and 2014, respectively. The impact on the net loss and LAE ratios should be considered in conjunction with the commission and other acquisition expense ratio as changes to either ratio arise primarily due to changes in the mix of business and the impact of the increase in the commission and other acquisition expense rates on pro-rata contracts with loss sensitive features. As a result of these factors, combined with adverse development in both our Diversified Reinsurance segment and on the run-off of the NGHC Quota Share, in our Other category, the combined ratio (excluding the general and administrative expense ratio) increased by 1.4 points for the year ended December 31, 2015 compared to 2014.
Comparison of Years Ended December 31, 2014 and 2013
Net loss and LAE increased by $148.7 million, or 11.0%, for the year ended December 31, 2014 compared to 2013. The net loss and LAE ratios were 66.1% and 67.0% for the years ended December 31, 2014 and 2013, respectively. The increase in net loss and LAE reflects the strong growth of the business in our reportable segments. The improvement in the net loss and LAE ratio for the year ended December 31, 2014 compared to 2013 reflects the change in segment mix and also the continued improvement in pricing that AmTrust is experiencing in certain lines of business, particularly U.S. workers' compensation. The Company amortized gains as a reduction of losses assumed from the GMAC Acquisition and the IIS Acquisition of $8.1 million for the year ended December 31, 2014 compared to $13.7 million for 2013.
Commission and Other Acquisition Expenses
Comparison of Years Ended December 31, 2015 and 2014
Commission and other acquisition expenses increased by $64.9 million, or 9.8%, for the year ended December 31, 2015 compared to 2014. The commission and other acquisition expense ratio increased to 29.7% for the year ended December 31, 2015 compared to 29.1% for the same period in 2014. Please refer to the reasons for the changes in the combined ratio discussed in the Net Loss and Loss Adjustment Expenses section above.
Comparison of Years Ended December 31, 2014 and 2013
Commission and other acquisition expenses increased by $102.7 million, or 18.5%, for the year ended December 31, 2014 compared to 2013. The commission and other acquisition expense ratio increased to 29.1% for the year ended December 31, 2014 compared to 27.6% for the same period in 2013. The change in the amount of expenses incurred reflects the continuing premium growth of the Company's business as discussed while the change in the ratio largely reflects: (1) strong growth and ongoing changes in the mix of the AmTrust Reinsurance segment compared to our Diversified Reinsurance segment; and (2) the impact of a higher mix of earned premium on pro-rata contracts, which incur a higher commission expense compared to excess of loss treaties.
General and Administrative Expenses
General and administrative expenses include expenses which are segregated for analytical purposes as a component of underwriting income. General and administrative expenses consist of:
For the Year Ended December 31, | 2015 | 2014 | 2013 | |||||||||
($ in Millions) | ||||||||||||
General and administrative expenses – segments | $ | 40.5 | $ | 42.1 | $ | 39.9 | ||||||
General and administrative expenses – corporate | 24.4 | 20.4 | 18.5 | |||||||||
Total general and administrative expenses | $ | 64.9 | $ | 62.5 | $ | 58.4 | ||||||
Comparison of Years Ended December 31, 2015 and 2014
Total general and administrative expenses increased by $2.4 million, or 3.7%, for the year ended December 31, 2015 compared to 2014. The increase in total general and administrative expenses is primarily due to an increase in employee compensation and professional fees offset by a decrease in legal fees. The general and administrative expense ratio slightly decreased to 2.7% for the year ended December 31, 2015 from 2.8% for the year ended December 31, 2014.
65
Comparison of Years Ended December 31, 2014 and 2013
Total general and administrative expenses increased by $4.1 million, or 7.2%, for the year ended December 31, 2014 compared to 2013. The increase in total general and administrative expenses is primarily due to an increase in legal expenses, employee compensation and technology expenses. The general and administrative expense ratio slightly decreased to 2.8% for the year ended December 31, 2014 from 2.9% for the year ended December 31, 2013.
Interest and Amortization Expense
The interest and amortization expense for the years ended December 31, 2015, 2014 and 2013 consists of:
For the Year Ended December 31, | 2015 | 2014 | 2013 | |||||||||
($ in Millions) | ||||||||||||
Senior Note Offerings | $ | 29.1 | $ | 29.1 | $ | 18.3 | ||||||
Junior Subordinated Debt | — | 0.9 | 21.5 | |||||||||
Total | $ | 29.1 | $ | 30.0 | $ | 39.8 | ||||||
Comparison of Years Ended December 31, 2015 and 2014
The decrease in interest and amortization expense for the year ended December 31, 2015 compared to the same period in 2014 was due to the Company incurring an interest expense on the Junior Subordinated Debt prior to its redemption on January 15, 2014. The weighted average effective interest rate for the Company's debt was 8.25% for the year ended December 31, 2015 compared to 8.38% for the year ended December 31, 2014.
Comparison of Years Ended December 31, 2014 and 2013
The decrease in interest and amortization expense for the year ended December 31, 2014 compared to the same period in 2013 was the result of the redemption of the outstanding Junior Subordinated Debt on January 15, 2014, which had an effective interest rate of 16.95% and replacing it with the 2013 Senior Notes, which have an effective interest rate of 8.04%. The Company used the proceeds from the 2013 Senior Notes, along with cash on hand, to redeem the all of the outstanding Junior Subordinated Debt on January 15, 2014. The weighted average effective interest rate for the Company's debt for the year ended December 31, 2014 was 8.38% compared to 11.3% in 2013.
Income Tax Expense
The Company recorded income tax expense of $2.1 million, $2.2 million and $1.9 million for the years ended December 31, 2015, 2014 and 2013, respectively. These amounts relate to income tax on the earnings of our international subsidiaries, non-cash U.S. deferred tax expense relating to timing differences and state taxes incurred by our U.S. subsidiaries. The effective rate of income tax was 1.6% for the year ended December 31, 2015 compared to 2.1% and 1.8% for the years ended December 31, 2014 and 2013, respectively.
Underwriting Results by Reportable Segment
Diversified Reinsurance Segment
The underwriting results and associated ratios for the Diversified Reinsurance segment for the years ended December 31, 2015, 2014 and 2013 were as follows:
66
For the Year Ended December 31, | 2015 | 2014 | 2013 | |||||||||
($ in Millions) | ||||||||||||
Gross premiums written | $ | 776.9 | $ | 897.7 | $ | 848.8 | ||||||
Net premiums written | $ | 734.8 | $ | 850.0 | $ | 763.4 | ||||||
Net premiums earned | $ | 744.9 | $ | 854.0 | $ | 753.2 | ||||||
Other insurance revenue | 11.5 | 13.4 | 14.2 | |||||||||
Net loss and LAE | (547.3 | ) | (579.8 | ) | (520.0 | ) | ||||||
Commission and other acquisition expenses | (196.3 | ) | (233.7 | ) | (190.6 | ) | ||||||
General and administrative expenses | (37.6 | ) | (38.8 | ) | (37.6 | ) | ||||||
Underwriting (loss) income | $ | (24.8 | ) | $ | 15.1 | $ | 19.2 | |||||
Ratios | ||||||||||||
Net loss and LAE ratio | 72.3 | % | 66.8 | % | 67.8 | % | ||||||
Commission and other acquisition expense ratio | 26.0 | % | 26.9 | % | 24.8 | % | ||||||
General and administrative expense ratio | 5.0 | % | 4.6 | % | 4.9 | % | ||||||
Expense ratio | 31.0 | % | 31.5 | % | 29.7 | % | ||||||
Combined ratio | 103.3 | % | 98.3 | % | 97.5 | % | ||||||
Comparison of Years Ended December 31, 2015 and 2014
The combined ratio increased to 103.3% for the year ended December 31, 2015 compared to 98.3% in 2014 primarily due to increased loss activity in our Maiden US commercial auto liability reinsurance contracts.
Premiums - Gross premiums written decreased by $120.8 million, or 13.5% for the year ended December 31, 2015 compared to the same period in 2014. The decrease was primarily due to a reduction in Maiden US premium following underwriting actions taken by the Company as well as the loss of a large customer and the expiration of a fronting arrangement in September 2014. In addition, there was a reduction in the International business written due to the strengthening of the U.S. dollar.
Net premiums written decreased by $115.2 million or 13.6%, for the year December 31, 2015, compared to the same period in 2014. The tables below illustrate net premiums written by line of business in this segment:
For the Year Ended December 31, | 2015 | 2014 | Change in | ||||||||||||||||||
Total | % of Total | Total | % of Total | $ | % | ||||||||||||||||
Net Premiums Written | ($ in Millions) | ($ in Millions) | ($ in Millions) | ||||||||||||||||||
Property | $ | 161.0 | 21.9 | % | $ | 160.3 | 18.8 | % | $ | 0.7 | 0.4 | % | |||||||||
Casualty | 435.6 | 59.3 | % | 535.5 | 63.0 | % | (99.9 | ) | (18.7 | )% | |||||||||||
Accident and Health | 64.1 | 8.7 | % | 38.8 | 4.6 | % | 25.3 | 64.9 | % | ||||||||||||
International | 74.1 | 10.1 | % | 115.4 | 13.6 | % | (41.3 | ) | (35.7 | )% | |||||||||||
Total Diversified Reinsurance | $ | 734.8 | 100.0 | % | $ | 850.0 | 100.0 | % | $ | (115.2 | ) | (13.6 | )% | ||||||||
The decrease arises predominantly due to the same reasons outlined above in the discussion on gross premiums written for this segment. Furthermore, net premiums written decreased for the year ended December 31, 2015 compared to the same period in 2014, following the Company entering into a retrocessional quota share agreement with a highly rated global insurer effective January 1, 2015. There was no such retrocessional quota share agreement in force during 2014.
Net premiums earned decreased by $109.1 million, or 12.8%, during the year ended December 31, 2015 compared to the same period in 2014. The table below shows net premiums earned by line of business:
67
For the Year Ended December 31, | 2015 | 2014 | Change in | ||||||||||||||||||
Total | % of Total | Total | % of Total | $ | % | ||||||||||||||||
Net Premiums Earned | ($ in Millions) | ($ in Millions) | ($ in Millions) | ||||||||||||||||||
Property | $ | 157.2 | 21.1 | % | $ | 174.8 | 20.4 | % | $ | (17.6 | ) | (10.1 | )% | ||||||||
Casualty | 449.0 | 60.3 | % | 533.8 | 62.5 | % | (84.8 | ) | (15.9 | )% | |||||||||||
Accident and Health | 55.7 | 7.5 | % | 39.9 | 4.7 | % | 15.8 | 39.5 | % | ||||||||||||
International | 83.0 | 11.1 | % | 105.5 | 12.4 | % | (22.5 | ) | (21.3 | )% | |||||||||||
Total Diversified Reinsurance | $ | 744.9 | 100.0 | % | $ | 854.0 | 100.0 | % | $ | (109.1 | ) | (12.8 | )% | ||||||||
Within the Diversified Reinsurance reportable segment, both our US operations and our non-U.S. operations experienced a decrease in net premiums earned for the year ended December 31, 2015 of $83.6 million, or 11.3%, and $25.5 million, or 22.6%, respectively, compared to the same period in 2014, for reasons outlined previously and the impact of a retrocessional quota share agreement effective January 1, 2015 with a highly rated global insurer.
Other Insurance Revenue - Other insurance revenue, which represents fee income that is not directly associated with premium revenue assumed by the Company decreased by $1.9 million for the year ended December 31, 2015 compared to the same period in 2014. This net decrease includes a $2.5 million adverse impact on our non-U.S. dollar denominated fee income due to the continued strengthening of the U.S. dollar, during the year ended December 31, 2015 compared to the foreign currency exchange rates for the same period in 2014, respectively.
.
Net Loss and Loss Adjustment Expenses - Net loss and LAE decreased by $32.5 million, or 5.6%, for the year ended December 31, 2015 compared to 2014. This decrease reflects the loss of business as discussed in the Net Premiums Written section above combined with the favorable impact of the strengthening of the U.S. dollar on Net loss and LAE. Net loss and LAE ratios were 72.3% and 66.8% for the years ended December 31, 2015 and 2014, respectively, reflecting the adverse development from commercial auto liability in Maiden US.
The impact on the net loss and LAE ratios should be considered in conjunction with the commission and other acquisition expense ratio as changes to either ratio arise primarily due to changes in the mix of business and the impact of the increase in the commission and other acquisition expense rates on pro-rata contracts with loss sensitive features. As a result of these factors, the combined ratio (excluding the general and administrative expense ratio) increased by 4.6 points for the year ended December 31, 2015 compared to 2014.
Commission and Other Acquisition Expenses - Commission and other acquisition expenses decreased by $37.4 million, or 16.0%, for the year ended December 31, 2015 compared to 2014. The commission and other acquisition expense ratios decreased to 26.0% for the year ended December 31, 2015 compared to 26.9% for the same period in 2014. Please refer to the reasons for the changes in the combined ratio discussed in the preceding paragraph.
General and Administrative Expenses - Consistent with the Company's growth, general and administrative expenses decreased by $1.2 million, or 3.4%, for the year ended December 31, 2015 compared to 2014. The general and administrative expense ratio was 5.0% and 4.6% for the years ended December 31, 2015 and 2014, respectively. The overall expense ratio (including commission and other acquisition expenses) was 31.0% and 31.5% for the years ended December 31, 2015 and 2014, respectively.
Comparison of Years Ended December 31, 2014 and 2013
The combined ratio increased to 98.3% for the year ended December 31, 2014 compared to 97.5% in 2013 due to 1) elevated excess property loss activity from several clients of our US operations during the first half of 2014 and 2) due to a modest amount of reserve deterioration in commercial auto business during 2014.
Premiums - Gross premiums written increased by $48.9 million, or 5.8%, for the year ended December 31, 2014 compared to the same period in 2013. Net premiums written increased by $86.6 million, or 11.4%, for the year ended December 31, 2014 compared to the same period in 2013. The table below shows net premiums written by line of business in this segment for the years ended December 31, 2014 and 2013:
68
For the Year Ended December 31, | 2014 | 2013 | Change in | ||||||||||||||||||
Total | % of Total | Total | % of Total | $ | % | ||||||||||||||||
Net Premiums Written | ($ in Millions) | ($ in Millions) | ($ in Millions) | ||||||||||||||||||
Property | $ | 160.3 | 18.8 | % | $ | 145.3 | 19.0 | % | $ | 15.0 | 10.3 | % | |||||||||
Casualty | 535.5 | 63.0 | % | 473.7 | 62.1 | % | 61.8 | 13.0 | % | ||||||||||||
Accident and Health | 38.8 | 4.6 | % | 35.4 | 4.6 | % | 3.4 | 10.0 | % | ||||||||||||
International | 115.4 | 13.6 | % | 109.0 | 14.3 | % | 6.4 | 5.8 | % | ||||||||||||
Total Diversified Reinsurance | $ | 850.0 | 100.0 | % | $ | 763.4 | 100.0 | % | $ | 86.6 | 11.4 | % | |||||||||
The increase arises primarily on the business written by our US operations experiencing an increase for the year ended December 31, 2014 of $77.2 million, or 11.8% compared to 2013. This increase was due to a combination of the addition of new accounts along with organic growth from certain accounts already existing in our US operations for the year ended December 31, 2014. Furthermore, our non - U.S. entities, included within the Casualty and International components of this segment, experienced a net increase of $9.5 million, or 8.5%, in the business written for the year ended December 31, 2014 compared to 2013.
Net premiums earned increased by $100.8 million, or 13.4%, during the year ended December 31, 2014 compared to the same period in 2013. The table below shows net premiums earned by line of business in this segment for the years ended December 31, 2014 and 2013:
For the Year Ended December 31, | 2014 | 2013 | Change in | ||||||||||||||||||
Total | % of Total | Total | % of Total | $ | % | ||||||||||||||||
Net Premiums Earned | ($ in Millions) | ($ in Millions) | ($ in Millions) | ||||||||||||||||||
Property | $ | 174.8 | 20.4 | % | $ | 150.3 | 19.9 | % | $ | 24.5 | 16.3 | % | |||||||||
Casualty | 533.8 | 62.5 | % | 472.1 | 62.7 | % | 61.7 | 13.1 | % | ||||||||||||
Accident and Health | 39.9 | 4.7 | % | 36.2 | 4.8 | % | 3.7 | 10.4 | % | ||||||||||||
International | 105.5 | 12.4 | % | 94.6 | 12.6 | % | 10.9 | 11.5 | % | ||||||||||||
Total Diversified Reinsurance | $ | 854.0 | 100.0 | % | $ | 753.2 | 100.0 | % | $ | 100.8 | 13.4 | % | |||||||||
Within the Diversified Reinsurance reportable segment, the business underwritten by our US operations experienced an increase in premiums earned for the year ended December 31, 2014 of $101.2 million, or 15.8%, compared to 2013. This increase arises due to a combination of growth in the US operations' net premiums written, following the addition of new accounts, and organic growth from certain existing accounts. Furthermore, the premiums earned from the business written by our non- U.S. entities, reflected within the Casualty and International components of this segment, experienced a net decrease of $0.4 million, or 0.3%, compared to the same period in 2013, following the non-renewal of certain accounts during 2013 and 2014.
Other Insurance Revenue - Other insurance revenue, which represents the fee business that is not directly associated with premium revenue assumed by the Company, decreased by $0.8 million for the year ended December 31, 2014 compared to the same period in 2013. Revenue from our German auto business represents 66.0% of other insurance revenue for the year ended December 31, 2014 compared to 64.3% for the same period in 2013. Other insurance revenue from the German auto business decreased by $0.3 million, or 3.3% for the year ended December 31, 2014 compared to the same period in 2013. In addition, other insurance revenue earned by our remaining operations, decreased by $0.5 million, or 10.3%, for the year ended December 31, 2014 compared to the same period in 2013.
Net Loss and Loss Adjustment Expenses - Net loss and LAE increased by $59.8 million, or 11.5%, for the year ended December 31, 2014 compared to 2013. Net loss and LAE ratios were 66.8% and 67.8% for the years ended December 31, 2014 and 2013, respectively. The increase in the amount of net loss and LAE reflect the growth of this reportable segment following the addition by our US operations of new accounts during 2013 and 2014 combined with organic growth from certain existing accounts.
The following factors also contributed to the overall increase in losses: 1) elevated excess property loss activity from several Maiden US clients during the first half of 2014; and 2) a modest amount of reserve deterioration in commercial auto business during the third quarter 2014; offset by 3) more proportional business being written which has a lower loss ratio and higher expense ratio.
Commission and Other Acquisition Expenses - Commission and other acquisition expenses increased by $43.1 million, or 22.6%, for the year ended December 31, 2014 compared to 2013. This increase reflects the increase in premiums earned for this period compared to the same period in 2013, consistent with the reasons cited in the discussion of the change in earned premiums. This increase reflects the higher mix of earned premium on pro-rata contracts, which incur a higher commission expense compared to excess of loss treaties for the year ended December 31, 2014 compared to 2013.
69
Offsetting this was lower ceding commissions for the year ended December 31, 2014 compared to 2013 relating to loss sensitive features on certain contracts, in particular business written by Maiden US. This was due to higher loss ratios on contracts with these features. For the year ended December 31, 2014, 54.3% of Maiden US net premiums written have loss sensitive features, which results in lower ceding commissions when loss ratios increase, compared to 57.6% for the year ended December 31, 2013. For the year ended December 31, 2014, the net effect of loss sensitive features on Maiden US reinsurance contracts reduced ceding commissions by $6.1 million, compared to $8.3 million in 2013.
General and Administrative Expenses - Consistent with the Company's growth, general and administrative expenses increased by $1.2 million, or 3.2%, for the year ended December 31, 2014 compared to 2013. The general and administrative expense ratio was 4.6% and 4.9% for the years ended December 31, 2014 and 2013, respectively. The overall expense ratio (including commission and other acquisition expenses) was 31.5% and 29.7% for the years ended December 31, 2014 and 2013, respectively.
AmTrust Reinsurance Segment
The AmTrust Reinsurance segment reported strong growth and stable combined ratios in each of the comparative periods reported. The underwriting results and associated ratios for the AmTrust Reinsurance segment for the years ended December 31, 2015, 2014 and 2013 were as follows:
For the Year Ended December 31, | 2015 | 2014 | 2013 | |||||||||
($ in Millions) | ||||||||||||
Gross premiums written | $ | 1,886.0 | $ | 1,610.5 | $ | 1,169.9 | ||||||
Net premiums written | $ | 1,779.3 | $ | 1,610.5 | $ | 1,169.9 | ||||||
Net premiums earned | $ | 1,684.2 | $ | 1,378.3 | $ | 988.9 | ||||||
Net loss and LAE | (1,074.1 | ) | (893.5 | ) | (653.5 | ) | ||||||
Commission and other acquisition expenses | (527.9 | ) | (418.9 | ) | (291.6 | ) | ||||||
General and administrative expenses | (2.9 | ) | (2.5 | ) | (1.6 | ) | ||||||
Underwriting income | $ | 79.3 | $ | 63.4 | $ | 42.2 | ||||||
Ratios | ||||||||||||
Net loss and LAE ratio | 63.8 | % | 64.8 | % | 66.1 | % | ||||||
Commission and other acquisition expense ratio | 31.3 | % | 30.4 | % | 29.5 | % | ||||||
General and administrative expense ratio | 0.2 | % | 0.2 | % | 0.2 | % | ||||||
Expense ratio | 31.5 | % | 30.6 | % | 29.7 | % | ||||||
Combined ratio | 95.3 | % | 95.4 | % | 95.8 | % | ||||||
Comparison of Years Ended December 31, 2015 and 2014
The AmTrust Reinsurance segment continues to experience strong profitable growth during the year ended December 31, 2015 compared to 2014. The combined ratio decreased slightly to 95.3% for the year ended December 31, 2015 compared to 95.4% in 2014, generally reflecting this segment's overall stable combined loss ratios.
Premiums - Gross premiums written increased by $275.5 million or 17.1% for the year ended December 31, 2015 compared to the same period in 2014. This increase reflects the continued ongoing growth, through strategic acquisitions and organically, particularly in U.S. workers' compensation and specialty program business. This increase was offset partially by: 1) the Company entering into an agreement with AmTrust to commute outstanding liabilities, loss reserves and unearned premiums associated with certain classes and lines of business which reduced gross written premiums by approximately 3.4% for the year ended December 31, 2015; and 2) the impact of foreign exchange movements on the non-U.S. dollar business ceded to us by AmTrust.
The table below shows net premiums written by this segment for the years ended December 31, 2015 and 2014:
70
For the Year Ended December 31, | 2015 | 2014 | Change in | ||||||||||||||||||
Total | % of Total | Total | % of Total | $ | % | ||||||||||||||||
Net Premiums Written | ($ in Millions) | ($ in Millions) | ($ in Millions) | ||||||||||||||||||
Small Commercial Business | $ | 1,058.0 | 59.5 | % | $ | 857.6 | 53.2 | % | $ | 200.4 | 23.4 | % | |||||||||
Specialty Program | 332.4 | 18.7 | % | 220.1 | 13.7 | % | 112.3 | 51.0 | % | ||||||||||||
Specialty Risk and Extended Warranty | 388.9 | 21.8 | % | 532.8 | 33.1 | % | (143.9 | ) | (27.0 | )% | |||||||||||
Total AmTrust Reinsurance | $ | 1,779.3 | 100.0 | % | $ | 1,610.5 | 100.0 | % | $ | 168.8 | 10.5 | % | |||||||||
Net premiums earned increased by $305.9 million, or 22.2% for the year ended December 31, 2015, compared to the same period in 2014. This increase is due to the reasons outlined above in the Net Premiums Written section.
The table below details net premiums earned by line of business for the years ended December 31, 2015 and 2014:
For the Year Ended December 31, | 2015 | 2014 | Change in | ||||||||||||||||||
Total | % of Total | Total | % of Total | $ | % | ||||||||||||||||
Net Premiums Earned | ($ in Millions) | ($ in Millions) | ($ in Millions) | ||||||||||||||||||
Small Commercial Business | $ | 984.3 | 58.5 | % | $ | 752.2 | 54.6 | % | $ | 232.1 | 30.9 | % | |||||||||
Specialty Program | 290.2 | 17.2 | % | 175.3 | 12.7 | % | 114.9 | 65.6 | % | ||||||||||||
Specialty Risk and Extended Warranty | 409.7 | 24.3 | % | 450.8 | 32.7 | % | (41.1 | ) | (9.1 | )% | |||||||||||
Total AmTrust Reinsurance | $ | 1,684.2 | 100.0 | % | $ | 1,378.3 | 100.0 | % | $ | 305.9 | 22.2 | % | |||||||||
Net Loss and Loss Adjustment Expenses - Net loss and LAE increased by $180.6 million, or 20.2%, for the year ended December 31, 2015 compared to the same period in 2014. Net loss and LAE ratios were 63.8% and 64.8% for the years ended December 31, 2015 and 2014, respectively. The net loss and LAE ratio has improved primarily due to the continued change in the segment's mix of business.
Commission and Other Acquisition Expenses - Commission and other acquisition expenses increased by $109.0 million, or 26.0%, for the year ended December 31, 2015 compared to 2014. The commission and other acquisition expense ratio increased to 31.3% for the year ended December 31, 2015 compared to 30.4% in 2014. The increase in the ratio during the year ended December 31, 2015 compared to 2014 reflects 1) the higher proportion of net premiums earned from the Reinsurance Agreement, which has a higher commission rate than the European Hospital Liability Quota Share; and 2) increase in Specialty Program business, within which is a component with the highest commission rate in the Reinsurance Agreement of 34.375%.
General and Administrative Expenses - General and administrative expenses increased by $0.4 million, or 16.3%, for the year ended December 31, 2015 compared to the same period in 2014. The general and administrative expense ratio has remained flat at 0.2% for both years ended December 31, 2015 and 2014. The overall expense ratio (including commission and other acquisition expenses) was 31.5% and 30.6% for the years ended December 31, 2015 and 2014, respectively.
Comparison of Years Ended December 31, 2014 and 2013
The AmTrust Reinsurance segment continues to experience strong profitable growth during the year ended December 31, 2014 compared to 2013. The combined ratio decreased slightly to 95.4% for the year ended December 31, 2014 compared to 95.8% in 2013, generally reflecting this segment's stable combined loss ratios and the continued improvement in pricing that AmTrust is experiencing in certain lines of business, particularly U.S. workers' compensation. The changes in the components of the combined ratio reflect ongoing changes in this segment's mix of business.
Premiums - Gross premiums written increased by $440.6 million, or 37.7%, for the year ended December 31, 2014 compared to the same period in 2013. This increase reflects the continued organic growth and improved rate levels, particularly in U.S. workers' compensation.
The table below shows net premiums written by this segment for the years ended December 31, 2014 and 2013:
71
For the Year Ended December 31, | 2014 | 2013 | Change in | ||||||||||||||||||
Total | % of Total | Total | % of Total | $ | % | ||||||||||||||||
Net Premiums Written | ($ in Millions) | ($ in Millions) | ($ in Millions) | ||||||||||||||||||
Small Commercial Business | $ | 857.6 | 53.2 | % | $ | 572.0 | 48.9 | % | $ | 285.6 | 49.9 | % | |||||||||
Specialty Program | 220.1 | 13.7 | % | 157.6 | 13.5 | % | 62.5 | 39.7 | % | ||||||||||||
Specialty Risk and Extended Warranty | 532.8 | 33.1 | % | 440.3 | 37.6 | % | 92.5 | 21.0 | % | ||||||||||||
Total AmTrust Reinsurance | $ | 1,610.5 | 100.0 | % | $ | 1,169.9 | 100.0 | % | $ | 440.6 | 37.7 | % | |||||||||
Net premiums earned increased by $389.4 million, or 39.4% for the year ended December 31, 2014, compared to the same period in 2013. This increase is primarily due to AmTrust's continued organic growth and rate increases achieved in U.S. workers' compensation. The table below details net premiums earned by line of business for the years ended December 31, 2014 and 2013:
For the Year Ended December 31, | 2014 | 2013 | Change in | ||||||||||||||||||
Total | % of Total | Total | % of Total | $ | % | ||||||||||||||||
Net Premiums Earned | ($ in Millions) | ($ in Millions) | ($ in Millions) | ||||||||||||||||||
Small Commercial Business | $ | 752.2 | 54.6 | % | $ | 493.8 | 49.9 | % | $ | 258.4 | 52.3 | % | |||||||||
Specialty Program | 175.3 | 12.7 | % | 140.5 | 14.2 | % | 34.8 | 24.8 | % | ||||||||||||
Specialty Risk and Extended Warranty | 450.8 | 32.7 | % | 354.6 | 35.9 | % | 96.2 | 27.1 | % | ||||||||||||
Total AmTrust Reinsurance | $ | 1,378.3 | 100.0 | % | $ | 988.9 | 100.0 | % | $ | 389.4 | 39.4 | % | |||||||||
Net Loss and Loss Adjustment Expenses - Net loss and LAE increased by $240.0 million, or 36.7%, for the year ended December 31, 2014 compared to the same period in 2013. Net loss and LAE ratios were 64.8% and 66.1% for the years ended December 31, 2014 and 2013, respectively. The net loss and LAE ratio has improved as the segment's mix of business has continued to change, with the Small Commercial Business component increasing at the fastest rate, in part due to the continued improvement in pricing that AmTrust is experiencing in certain lines of business in that component, particularly U.S. workers' compensation.
Commission and Other Acquisition Expenses - Commission and other acquisition expenses increased by $127.3 million, or 43.7%, for the year ended December 31, 2014 compared to 2013. The commission and other acquisition expense ratio increased to 30.4% for the year ended December 31, 2014 compared to 29.5% in 2013. The increase in the ratios reflects the higher proportion of net premiums earned from the Reinsurance Agreement, which has a higher commission rate than the European Hospital Liability Quota Share, compared to the same periods in 2013.
General and Administrative Expenses - General and administrative expenses increased by $0.9 million, or 61.7%, for the year ended December 31, 2014 compared to the same period in 2013. The general and administrative expense ratio has remained flat at 0.2% for the year ended December 31, 2014 compared to the same period in 2013. The overall expense ratio (including commission and other acquisition expenses) was 30.6% and 29.7% for the years ended December 31, 2014 and 2013, respectively, reflecting the changes in the commission and other acquisition expense ratio.
Liquidity and Capital Resources
Liquidity
Maiden Holdings is a holding company and transacts no business of its own. We therefore rely on cash flows in the form of dividends, advances and loans and other permitted distributions from our subsidiary companies to make dividend payments on our common and preference shares.
The jurisdictions in which our operating subsidiaries are licensed to write business impose regulations requiring companies to maintain or meet statutory solvency and liquidity requirements. Some jurisdictions also place restrictions on the declaration and payment of dividends and other distributions.
The amount of dividends that can be distributed from Maiden Bermuda is, under certain circumstances, limited under Bermuda law and Bermuda regulatory requirements, which requires our Bermuda operating subsidiary to maintain certain measures of solvency and liquidity in accordance with the BSCR. At December 31, 2015, the statutory capital and surplus of Maiden Bermuda was $1,813.8 million. Maiden Bermuda is allowed to pay dividends or distributions not exceeding $322.3 million. During 2015 and 2014, Maiden Bermuda did not pay any dividends to Maiden Holdings.
Maiden US is subject to regulatory restrictions limiting their ability to declare and pay dividends by the state of Missouri where it is domiciled. In addition, there are restrictions based on risk-based capital, a test which is the threshold that constitutes the authorized control level. If Maiden US's statutory capital and surplus falls below the authorized control level, the insurance
72
regulators is authorized to take whatever regulatory actions are considered necessary to protect policyholders and creditors. At December 31, 2015, Maiden US has statutory capital and surplus of $294.3 million, which exceeds the required level of minimum statutory capital and surplus by the state of Missouri. During 2015 and 2014, Maiden US paid no dividends.
Maiden Holdings’ Swedish domiciled operating subsidiary, Maiden LF, is regulated by the Swedish FSA. At December 31, 2015, Maiden LF has statutory capital and surplus of $7.6 million, which exceeds the amount required to be maintained of $4.0 million at December 31, 2015. Maiden LF is subject to statutory and regulatory restrictions under the Swedish FSA that limit the maximum amount of annual dividends or distributions paid by Maiden LF to Maiden Holdings. At December 31, 2015, Maiden LF is allowed to pay dividends or distributions not exceeding $2.2 million. Maiden LF did not pay any dividends to Maiden Holdings during the year.
Maiden Holdings’ wholly owned U.K. subsidiary, Maiden Global, that operates as a reinsurance services and holding company, is subject to regulation by the U.K. Financial Conduct Authority (the "FCA") that limit the maximum amount of annual dividends or distributions paid by Maiden Global to the Company. At December 31, 2015, Maiden Global is allowed to pay dividends or distributions not exceeding $2.1 million. During the year, Maiden Global did not pay any dividend to Maiden Holdings.
Maiden Global's wholly owned subsidiary in Netherlands, Maiden Nederland B.V. ("Maiden Nederland"), operates as an insurance intermediary and is subject to regulation by the Netherlands Authority for Financial Markets (the "AFM"). There are no statutory minimum capital requirements imposed on Maiden Nederland by the AFM.
Our sources of funds primarily consist of premium receipts net of commissions, investment income, net proceeds from capital raising activities, which may include the issuance of common and preference shares, and proceeds from sales and redemption of investments. Cash is used primarily to pay loss and LAE, general and administrative expenses and dividends, with the remainder made available to our investment managers for investment in accordance with our investment policy.
The table below summarizes our operating, investing and financing cash flows for the years ended December 31, 2015, 2014 and 2013:
For the Year Ended December 31, | 2015 | 2014 | 2013 | |||||||||
($ in Millions) | ||||||||||||
Operating activities | $ | 634.3 | $ | 651.6 | $ | 366.2 | ||||||
Investing activities | (750.7 | ) | (471.9 | ) | (584.0 | ) | ||||||
Financing activities | 99.7 | (208.3 | ) | 274.5 | ||||||||
Effect of exchange rate changes on foreign currency cash | (1.8 | ) | (3.1 | ) | 1.6 | |||||||
Total (decrease) increase in cash and cash equivalents | $ | (18.5 | ) | $ | (31.7 | ) | $ | 58.3 | ||||
Cash Flows from Operating Activities
Cash flows from operations for the year ended December 31, 2015 were $634.3 million compared to $651.6 million for the year ended December 31, 2014, a 2.7% decrease. The Company's assets grew by $549.5 million, or 10.6%, at December 31, 2015 compared to December 31, 2014. The increase in assets was largely due to the growth in premium written, in our AmTrust Reinsurance segment during 2015. Cash flows associated with the AmTrust Reinsurance segment's growth typically lag by at least one calendar quarter, and the Company anticipates seeing further cash flow benefits from that growth in the beginning of 2016.
Cash flows from operations for the year ended December 31, 2014 were $651.6 million compared to $366.2 million for the year ended December 31, 2013, a 77.9% increase. The Company's assets grew by $450.7 million, or 9.6%, at December 31, 2014 compared to December 31, 2013. The increase in assets was largely due to the growth in premium written, in our AmTrust Reinsurance and Diversified Reinsurance segments during 2014.
Cash Flows from Investing Activities
Investing cash flows consist primarily of proceeds from the sales and maturities of investments and payments for investments acquired. Net cash used in investing activities was $750.7 million for the year ended December 31, 2015 compared to $471.9 million for the same period in 2014. The Company continues to deploy available cash for longer-term investments as investment conditions permit and to maintain, where possible, cash and cash equivalents balances at low levels. For the year ended December 31, 2015, the purchases of fixed maturity securities exceeded the proceeds from the sales, maturities and calls by $793.3 million. This outflow was offset by the decrease in restricted cash and cash equivalents of $35.0 million combined with a net proceeds from the other investing activities of $7.6 million.
Net cash used in investing activities was $471.9 million for the year ended December 31, 2014 compared to $584.0 million for the same period in 2013. For the year ended December 31, 2014, the purchases of fixed maturity securities exceeded the proceeds from the sales, maturities and calls by $257.6 million. This outflow was increased further by the increase in restricted cash and cash equivalents of $207.9 million and net purchases of other investments of $5.9 million during the same period.
73
Cash Flows from Financing Activities
Cash flows provided by financing activities were $99.7 million for the year ended December 31, 2015 compared to cash flows used by financing activities of $208.3 million for the year ended December 31, 2014. This net cash inflow arises following the issuance of the Preference Shares - Series C, with net proceeds of $159.6 million, offset by the cash outflow from the payment of dividends to both common and preference shareholders of $62.5 million. In addition, the Company received net proceeds of $2.6 million following the issuance and repurchasing of common shares during the year.
Cash flows used in financing activities were $208.3 million for the year ended December 31, 2014 compared to cash flows provided by financing activities of $274.5 million for the year ended December 31, 2013. The net proceeds from the 2013 Senior Notes and existing cash were used in January 2014 to repurchase all of the remaining outstanding Junior Subordinated Debt, which caused the decrease in cash flows provided by financing activities in 2014. The increase of $12.5 million in the cash outflow from dividends paid to common shareholder for the year ended December 31, 2014 compared to 2013 was primarily due to the accelerated payment of the common share dividend announced in the fourth quarter of 2012, which resulted in no cash outflow for common shareholder dividends in the first quarter of 2013. Furthermore, cash outflow from dividends paid to preference shareholders increased by $9.5 million for the year ended December 31, 2014 compared to 2013 due to the issuance of the Preference Shares - Series B in October 2013.
The net cash inflow (outflow) from financing activities for the years ended December 31, 2015, 2014 and 2013 were as follows:
For the Year Ended December 31, | 2015 | 2014 | 2013 | |||||||||
($ in Millions) | ||||||||||||
Cash flows from Financing Activities | ||||||||||||
Preference shares issuance, net of issuance costs | $ | 159.6 | $ | — | $ | 159.7 | ||||||
Repayment of junior subordinated debt | — | (152.5 | ) | — | ||||||||
Senior notes issuance, net of issuance costs | — | — | 147.4 | |||||||||
Common share issuance | 3.3 | 0.7 | 1.8 | |||||||||
Repurchase of common shares | (0.7 | ) | (0.1 | ) | — | |||||||
Dividends paid to Maiden common shareholders | (38.2 | ) | (32.1 | ) | (19.6 | ) | ||||||
Dividends paid on preference shares | (24.3 | ) | (24.3 | ) | (14.8 | ) | ||||||
Net cash (used in) provided by financing activities | $ | 99.7 | $ | (208.3 | ) | $ | 274.5 | |||||
Restrictions, Collateral and Specific Requirements
Maiden Bermuda is neither licensed nor admitted as an insurer, nor is it accredited as a reinsurer, in any jurisdiction in the U.S. As a result, it is generally required to post collateral security with respect to any reinsurance liabilities it assumes from ceding insurers domiciled in the U.S. in order for U.S. ceding companies to obtain credit on their U.S. statutory financial statements with respect to insurance liabilities ceded to them. Under applicable statutory provisions, the security arrangements may be in the form of letters of credit, reinsurance trusts maintained by trustees or funds withheld arrangements where assets are held by the ceding company.
Maiden Bermuda uses trust accounts, loan to related party and letters of credit to meet collateral requirements - consequently, cash and cash equivalents and investments are pledged in favor of ceding companies in order to comply with relevant insurance regulations.
Maiden US also offers to its clients, on a voluntary basis, the ability to collateralize certain liabilities related to the reinsurance contracts it issues. Under these arrangements, Maiden retains broad investment discretion in order to achieve its business objectives while giving clients the additional security a collateralized arrangement offers. We believe this offers the Company a significant competitive advantage and improves Maiden US’s retention of high-quality clients.
At December 31, 2015, total cash and cash equivalents and fixed maturity investments used as collateral were $3.7 billion compared to $3.1 billion at December 31, 2014. The increase was primarily attributable to the increase in assets provided as collateral for the AmTrust Reinsurance segment reflecting continued growth.
The following table details additional information on those assets at December 31, 2015 and 2014:
74
December 31, | 2015 | 2014 | ||||||||||||||||||||||
Restricted Cash & Equivalents | Fixed Maturities | Total | Restricted Cash & Equivalents | Fixed Maturities | Total | |||||||||||||||||||
($ in Millions) | ($ in Millions) | |||||||||||||||||||||||
Maiden US | $ | 71.3 | $ | 864.6 | $ | 935.9 | $ | 94.9 | $ | 805.2 | $ | 900.1 | ||||||||||||
Maiden Bermuda | 31.7 | 210.5 | 242.2 | 13.7 | 219.1 | 232.8 | ||||||||||||||||||
Diversified Reinsurance | 103.0 | 1,075.1 | 1,178.1 | 108.6 | 1,024.3 | 1,132.9 | ||||||||||||||||||
Maiden Bermuda | 138.9 | 2,329.8 | 2,468.7 | 174.6 | 1,755.9 | 1,930.5 | ||||||||||||||||||
AmTrust Reinsurance | 138.9 | 2,329.8 | 2,468.7 | 174.6 | 1,755.9 | 1,930.5 | ||||||||||||||||||
Maiden Bermuda | 1.0 | 29.5 | 30.5 | 1.2 | 56.7 | 57.9 | ||||||||||||||||||
Other | 1.0 | 29.5 | 30.5 | 1.2 | 56.7 | 57.9 | ||||||||||||||||||
Total | $ | 242.9 | $ | 3,434.4 | $ | 3,677.3 | $ | 284.4 | $ | 2,836.9 | $ | 3,121.3 | ||||||||||||
As a % of Consolidated Balance Sheet captions | 100.0 | % | 83.4 | % | 84.4 | % | 100.0 | % | 82.1 | % | 83.4 | % | ||||||||||||
As part of the Reinsurance Agreement, Maiden Bermuda has also loaned funds to AmTrust totaling $168.0 million at December 31, 2015 and 2014, respectively, to partially satisfy collateral requirements with AII.
Collateral arrangements with ceding insurers may subject our assets to security interests or require that a portion of our assets be pledged to, or otherwise held by, third parties. Both our trust accounts and letters of credit are fully collateralized by assets held in custodial accounts. Although the investment income derived from our assets while held in trust accrues to our benefit, the investment of these assets is governed by the terms of the letter of credit facilities or the investment regulations of the state or territory of domicile of the ceding insurer, which may be more restrictive than the investment regulations applicable to us under Bermuda law. The restrictions may result in lower investment yields on these assets, which may adversely affect our profitability.
We do not currently anticipate that the restrictions on liquidity resulting from restrictions on the payments of dividends by our subsidiary companies or from assets committed in trust accounts or to collateralize the letter of credit facilities will have a material impact on our ability to carry out our normal business activities, including, our ability to make dividend payments on our common and preference shares.
Investments
The investment of our funds is designed to ensure safety of principal while generating current income. Accordingly, our funds are invested in liquid, investment-grade fixed income securities which are designated as either AFS or HTM. During the third quarter of 2015, the Company designated certain corporate bonds previously classified as AFS to HTM to reflect our intention of holding these corporate bonds until maturity. See "Notes to Consolidated Financial Statements Note 4. Investments" included under Item 8 "Financial Statements and Supplementary Data" of this Form 10-K.
The Company's AFS fixed maturity investments increased by $51.2 million or 1.5% at December 31, 2015 compared to 2014. The net increase in the fair value of our AFS fixed maturity investments is a combination of 1) net purchases of $1,334.4 million, comprising of primarily asset-backed securities and investment grade corporate bonds; offset by 2) maturities and calls totaling $541.1 million; 3) designation of $608.7 million of investment grade corporate bonds as HTM and 4) net unrealized losses and amortization of $133.4 million.
During the year ended December 31, 2015, the yield on the 10-year U.S. Treasury bond increased by 10 basis points to 2.27%. The 10-year U.S. Treasury is the key risk-free determinant in the fair value of many of the securities in our AFS portfolio. The increase in interest rates during 2015 reflects the continued conflicting economic indicators, combined with equity market volatility and increased global geopolitical uncertainties.
The movement in unrealized gain/loss in our AFS fixed maturity portfolio was a loss of $131.9 million, primarily due to an increase in interest rates and an increase in corporate spreads. This loss is net of unrealized foreign exchange losses of $28.9 million arising on our non-U.S. dollar denominated investment portfolio, primarily on our euro-denominated investments, following the significant strengthening of the U.S. dollar versus the euro during the year ended December 31, 2015. These declines were substantially offset by decreases in our non-U.S. dollar net liabilities which are reflected in the movement in our cumulative translation adjustment, which is also a component of AOCI, in our shareholders equity. See "Liquidity and Capital Resources - Capital Resources" on page 83 for further information.
75
At December 31, 2015, we consider the levels of cash and cash equivalents we are holding to be within our targeted ranges. However, during periods when interest rates experience greater volatility, we have periodically maintained more cash and cash equivalents in order to better assess current market conditions and opportunities within our defined risk appetite, and may do so in future periods.
In order to limit our exposure to unexpected interest rate increases which would reduce the value of our fixed income securities and reduce our shareholders' equity, we attempt to maintain the duration of our fixed maturity investment portfolio combined with our cash and cash equivalents, both restricted and unrestricted, within a reasonable range of the duration of our loss reserves.
At December 31, 2015 and 2014, these respective durations in years were as follows:
December 31, | 2015 | 2014 | ||
Fixed maturities and cash and cash equivalents | 4.7 | 4.1 | ||
Reserve for loss and loss adjustment expenses | 4.4 | 4.4 | ||
The increase of 0.6 years in the weighted average duration of our fixed maturity investment portfolio arises predominantly due to purchases during the period with a higher duration than the fixed maturity investment portfolio at December 31, 2014 combined with the increase in the duration of our Agency MBS portfolio reflecting the impact of the volatility in interest rates on paydowns.
The differential in duration between these assets and liabilities may fluctuate over time and in the case of fixed maturities, is affected by factors such as market conditions, changes in asset mix and prepayment speeds in the case of both our Agency MBS and Commercial MBS.
The average yield and average duration of our fixed maturities, by asset class, and our cash and cash equivalents (restricted and unrestricted) are as follows:
December 31, 2015 | Original or Amortized Cost | Gross Unrealized Gains | Gross Unrealized Losses | Fair Value | Average yield* | Average duration | |||||||||||||||
AFS fixed maturities | ($ in Millions) | ||||||||||||||||||||
U.S. treasury bonds | $ | 5.7 | $ | 0.3 | $ | — | $ | 6.0 | 2.9 | % | 2.5 years | ||||||||||
U.S. agency bonds – mortgage-backed | 1,471.8 | 15.4 | (10.2 | ) | 1,477.0 | 2.8 | % | 4.5 years | |||||||||||||
U.S. agency bonds – other | 23.8 | 0.5 | — | 24.3 | 3.6 | % | 8.5 years | ||||||||||||||
Non-U.S. government and supranational bonds | 35.1 | — | (4.6 | ) | 30.5 | 2.6 | % | 4.0 years | |||||||||||||
Asset-backed securities | 165.7 | 1.2 | (1.1 | ) | 165.8 | 4.1 | % | 4.6 years | |||||||||||||
Corporate bonds | 1,798.6 | 38.1 | (97.0 | ) | 1,739.7 | 3.8 | % | 5.0 years | |||||||||||||
Municipal bonds | 62.2 | 2.6 | — | 64.8 | 4.2 | % | 6.3 years | ||||||||||||||
Total AFS fixed maturities | 3,562.9 | 58.1 | (112.9 | ) | 3,508.1 | 3.4 | % | 4.8 years | |||||||||||||
HTM fixed maturities | |||||||||||||||||||||
Corporate bonds | 607.8 | 3.5 | (12.3 | ) | 599.0 | 3.9 | % | 6.4 years | |||||||||||||
Total HTM fixed maturities | 607.8 | 3.5 | (12.3 | ) | 599.0 | ||||||||||||||||
Cash and cash equivalents | 332.5 | — | — | 332.5 | 0.2 | % | 0.0 years | ||||||||||||||
Total | $ | 4,503.2 | $ | 61.6 | $ | (125.2 | ) | $ | 4,439.6 | 3.2 | % | 4.7 years | |||||||||
76
December 31, 2014 | Original or Amortized Cost | Gross Unrealized Gains | Gross Unrealized Losses | Fair Value | Average yield* | Average duration | |||||||||||||||
AFS fixed maturities | ($ in Millions) | ||||||||||||||||||||
U.S. treasury bonds | $ | 8.9 | $ | 0.5 | $ | — | $ | 9.4 | 2.4 | % | 3.7 years | ||||||||||
U.S. agency bonds – mortgage-backed | 1,313.8 | 19.2 | (10.6 | ) | 1,322.4 | 2.9 | % | 3.7 years | |||||||||||||
U.S. agency bonds – other | 7.2 | 0.8 | — | 8.0 | 5.0 | % | 6.1 years | ||||||||||||||
Non-U.S. government and supranational bonds | 54.5 | 0.3 | (3.1 | ) | 51.7 | 2.0 | % | 3.1 years | |||||||||||||
Asset-backed securities | 52.3 | 2.4 | — | 54.7 | 3.5 | % | 6.3 years | ||||||||||||||
Corporate bonds | 1,831.4 | 89.2 | (25.3 | ) | 1,895.3 | 4.0 | % | 5.1 years | |||||||||||||
Municipal bonds | 62.2 | 3.7 | — | 65.9 | 4.2 | % | 7.9 years | ||||||||||||||
Short term investments | 49.5 | — | — | 49.5 | 0.4 | % | 0.3 years | ||||||||||||||
Total AFS maturities | 3,379.8 | 116.1 | (39.0 | ) | 3,456.9 | 3.5 | % | 4.5 years | |||||||||||||
Cash and cash equivalents | 392.5 | — | — | 392.5 | 0.2 | % | 0.0 years | ||||||||||||||
Total | $ | 3,772.3 | $ | 116.1 | $ | (39.0 | ) | $ | 3,849.4 | 3.1 | % | 4.1 years | |||||||||
*Average yield is calculated by dividing annualized investment income for each sub-component of AFS securities and cash and cash equivalents (including amortization of premium or discount) by amortized cost.
The following table summarizes the Company's fixed maturity investment portfolio holdings by contractual maturity at December 31, 2015 and 2014:
December 31, 2015 | December 31, 2014 | |||||||||||||||
AFS fixed maturities | HTM fixed maturities | AFS fixed maturities | HTM fixed maturities | |||||||||||||
Fair Value | Amortized cost | Fair Value | Amortized Cost | |||||||||||||
($ in Millions) | ||||||||||||||||
Due in one year or less | $ | 180.4 | $ | — | $ | 74.6 | $ | — | ||||||||
Due after one year through five years | 475.1 | 67.3 | 563.1 | — | ||||||||||||
Due after five years through ten years | 1,180.2 | 540.5 | 1,403.4 | — | ||||||||||||
Due after ten years | 29.6 | — | 38.7 | — | ||||||||||||
1,865.3 | 607.8 | 2,079.8 | — | |||||||||||||
U.S. agency bonds – mortgage-backed | 1,477.0 | — | 1,322.4 | — | ||||||||||||
Asset-backed securities | 165.8 | — | 54.7 | — | ||||||||||||
Total fixed maturities | $ | 3,508.1 | $ | 607.8 | $ | 3,456.9 | $ | — | ||||||||
Substantially all of the Company’s U.S. agency bond holdings are mortgage-backed. Additional details on the MBS component of our U.S. agency bonds portfolio at December 31, 2015 and 2014 were as follows:
77
December 31, | 2015 | 2014 | ||||||||||||
Fair Value | % of Total | Fair Value | % of Total | |||||||||||
U.S. agency bonds - mortgage-backed | ($ in Millions) | ($ in Millions) | ||||||||||||
Residential mortgage-backed (RMBS) | ||||||||||||||
GNMA – fixed rate | $ | 139.5 | 9.3 | % | $ | 75.8 | 5.7 | % | ||||||
FNMA – fixed rate | 791.7 | 52.7 | % | 657.2 | 49.4 | % | ||||||||
FNMA – variable rate | 22.1 | 1.5 | % | 26.5 | 2.0 | % | ||||||||
FHLMC – fixed rate | 517.3 | 34.5 | % | 555.3 | 41.7 | % | ||||||||
FHLMC – variable rate | 6.4 | 0.4 | % | 7.6 | 0.6 | % | ||||||||
Total RMBS | 1,477.0 | 98.4 | % | 1,322.4 | 99.4 | % | ||||||||
Total U.S. agency bonds - mortgage-backed | 1,477.0 | 98.4 | % | 1,322.4 | 99.4 | % | ||||||||
Non-MBS fixed rate agency bonds | 24.3 | 1.6 | % | 8.0 | 0.6 | % | ||||||||
Total U.S. agency bonds | $ | 1,501.3 | 100.0 | % | $ | 1,330.4 | 100.0 | % | ||||||
The following table provides a summary of changes in fair value associated with our U.S. agency bonds - mortgage-backed portfolio:
December 31, | 2015 | 2014 | ||||||
U.S. agency MBS: | ($ in Millions) | |||||||
Beginning balance | $ | 1,322.4 | $ | 1,262.7 | ||||
Purchases | 586.4 | 302.5 | ||||||
Sales, calls and paydowns | (423.2 | ) | (277.9 | ) | ||||
Net realized gains (losses) on sales – included in net income | 0.1 | 0.6 | ||||||
Change in net unrealized gains – included in other comprehensive income | (3.4 | ) | 38.0 | |||||
Amortization of bond premium and discount | (5.3 | ) | (3.5) | |||||
Ending balance | $ | 1,477.0 | $ | 1,322.4 | ||||
Our U.S. agency MBS portfolio is 35.9% of our fixed maturity investments at December 31, 2015. Given the relative size of this portfolio to our total investments, if faster prepayment patterns were to occur over an extended period of time, this could potentially limit the growth in our investment income in certain circumstances, or even potentially reducing the total amount of investment income we earn.
At December 31, 2015 and December 31, 2014, 97.5% and 98.2%, respectively of our fixed maturity investments consisted of investment grade securities. We define a security as being below investment grade if it has an S&P credit rating of BB+, or equivalent, or less. See "Part IV, Item 8 - Notes to Condensed Consolidated Financial Statements Note 4. Investments" for additional information on the credit rating of our fixed income portfolio.
The following summarizes the credit ratings of our fixed maturities:
78
Rating* at December 31, | 2015 | 2014 | ||||||||||||||
Amortized cost | Fair value | Amortized cost | Fair value | |||||||||||||
U.S. treasury bonds | $ | 5.7 | $ | 6.0 | $ | 8.9 | $ | 9.4 | ||||||||
U.S. agency bonds | 1,495.6 | 1,501.3 | 1,321.0 | 1,330.4 | ||||||||||||
AAA | 170.2 | 170.4 | 193.3 | 203.0 | ||||||||||||
AA+, AA, AA- | 222.5 | 223.1 | 116.9 | 120.7 | ||||||||||||
A+, A, A- | 1,075.5 | 1,066.8 | 883.1 | 917.5 | ||||||||||||
BBB+, BBB, BBB- | 1,077.0 | 1,039.2 | 794.3 | 814.0 | ||||||||||||
BB+ or lower | 124.2 | 100.3 | 62.3 | 61.9 | ||||||||||||
Total | $ | 4,170.7 | $ | 4,107.1 | $ | 3,379.8 | $ | 3,456.9 | ||||||||
*Ratings as assigned by S&P
The security holdings by sector and financial strength rating of our corporate bond holdings at December 31, 2015 and 2014 were as follows:
Ratings* | ||||||||||||||||||||||
December 31, 2015 | AAA | AA+, AA, AA- | A+, A, A- | BBB+, BBB, BBB- | BB+ or lower | Fair Value | % of Corporate bonds portfolio | |||||||||||||||
Corporate bonds | ($ in Millions) | |||||||||||||||||||||
Financial Institutions | 1.7 | % | 2.2 | % | 24.2 | % | 13.1 | % | 0.3 | % | $ | 971.5 | 41.5 | % | ||||||||
Industrials | — | % | 5.1 | % | 17.6 | % | 26.3 | % | 3.6 | % | 1,230.0 | 52.6 | % | |||||||||
Utilities/Other | — | % | — | % | 0.9 | % | 4.6 | % | 0.4 | % | 137.2 | 5.9 | % | |||||||||
Total Corporate bonds | 1.7 | % | 7.3 | % | 42.7 | % | 44.0 | % | 4.3 | % | $ | 2,338.7 | 100.0 | % | ||||||||
Ratings* | ||||||||||||||||||||||
December 31, 2014 | AAA | AA+, AA, AA- | A+, A, A- | BBB+, BBB, BBB- | BB+ or lower | Fair Value | % of Corporate bonds portfolio | |||||||||||||||
Corporate bonds | ($ in Millions) | |||||||||||||||||||||
Financial Institutions | 4.2 | % | 2.1 | % | 29.9 | % | 8.4 | % | 0.4 | % | $ | 853.8 | 45.0 | % | ||||||||
Industrials | — | % | 2.9 | % | 12.0 | % | 29.3 | % | 2.9 | % | 892.1 | 47.1 | % | |||||||||
Utilities/Other | — | % | — | % | 2.6 | % | 5.3 | % | — | % | 149.4 | 7.9 | % | |||||||||
Total Corporate bonds | 4.2 | % | 5.0 | % | 44.5 | % | 43.0 | % | 3.3 | % | $ | 1,895.3 | 100.0 | % | ||||||||
*Ratings as assigned by S&P
During the year ended December 31, 2015, the Company's allocation to corporate bonds rated BBB (including those with a + or - modifier) was generally stable, as we had reached our maximum allocation to those securities as a percentage of the total fixed maturities portfolio.
The Company’s ten largest corporate holdings, all of which are U.S. dollar denominated and 82.9% of which are in the Financial Institutions sector, at December 31, 2015 as carried at fair value and as a percentage of all fixed income securities were as follows:
79
December 31, 2015 | Fair Value | % of Holdings Based on Fair Value of All Fixed Income Securities | Rating* | ||||||
($ in Millions) | |||||||||
Morgan Stanley FLT, Due 10/18/2016 (1) | $ | 39.9 | 1.0 | % | BBB+ | ||||
Citigroup Inc FLT, Due 06/09/2016 (1) | 26.9 | 0.7 | % | BBB | |||||
BNP Paribas, 5.0% Due 01/15/2021 | 21.1 | 0.5 | % | A+ | |||||
JP Morgan Chase & Co, 3.90%, Due 07/15/2025 | 20.6 | 0.5 | % | A- | |||||
Rabobank Nederland Utrec, 3.875% Due 02/08/2022 | 20.2 | 0.5 | % | A+ | |||||
JP Morgan Chase Bank NA. FLT, Due 06/13/2016(1) | 20.0 | 0.5 | % | A- | |||||
Bear Stearns FLT, Due 11/21/2016 (1) | 20.0 | 0.5 | % | A- | |||||
HSBC Finance Corp FLT, Due 06/01/2016 (1) | 20.0 | 0.5 | % | A | |||||
Schlumberger Holdings Corporation, 4.0% Due 12/21/2025 | 19.7 | 0.4 | % | AA- | |||||
Mondelez International, 4.00% Due 02/1/2024 | 19.3 | 0.4 | % | BBB | |||||
Total | $ | 227.7 | 5.5 | % | |||||
* Ratings as assigned by S&P
(1) Securities with the notation FLT are floating rate securities.
We own the following securities not denominated in U.S. dollars:
December 31, | 2015 | 2014 | ||||||||||||
Fair Value | % of Total | Fair Value | % of Total | |||||||||||
($ in Millions) | ($ in Millions) | |||||||||||||
Non-U.S. dollar denominated corporate bonds | $ | 323.3 | 91.6 | % | $ | 351.9 | 87.2 | % | ||||||
Non-U.S. government and supranational bonds | 30.5 | 8.4 | % | 51.7 | 12.8 | % | ||||||||
Total non-U.S. dollar denominated AFS securities | $ | 353.8 | 100.0 | % | $ | 403.6 | 100.0 | % | ||||||
These securities are invested in the following currencies:
December 31, | 2015 | 2014 | ||||||||||||
Fair Value | % of Total | Fair Value | % of Total | |||||||||||
($ in Millions) | ($ in Millions) | |||||||||||||
Euro | $ | 299.3 | 84.8 | % | $ | 339.5 | 84.1 | % | ||||||
British Pound | 41.4 | 11.7 | % | 47.8 | 11.8 | % | ||||||||
Swedish Krona | 5.8 | 1.7 | % | 7.0 | 1.7 | % | ||||||||
Australian Dollar | 4.0 | 1.1 | % | 7.1 | 1.8 | % | ||||||||
All other | 3.3 | 0.7 | % | 2.2 | 0.6 | % | ||||||||
Total non-U.S. dollar denominated AFS securities | $ | 353.8 | 100.0 | % | $ | 403.6 | 100.0 | % | ||||||
The net decrease in non U.S. denominated fixed maturities is primarily due to the strengthening of the U.S. dollar versus the euro and British Pound. We do not have any non-U.S. government and government related obligations of Greece, Ireland, Italy, Portugal and Spain at December 31, 2015 and 2014. At December 31, 2015 and 2014, 100.0% of the Company's non-U.S. government and supranational issuers were rated A+ or higher by S&P.
For our non-U.S. dollar denominated corporate bonds, the following table summarizes the composition of the fair value of our fixed maturity investments at the dates indicated by ratings:
80
December 31, | 2015 | 2014 | ||||||||||||
Fair Value | % of Total | Fair Value | % of Total | |||||||||||
($ in Millions) | ($ in Millions) | |||||||||||||
AAA | $ | 32.8 | 10.1 | % | $ | 62.1 | 17.6 | % | ||||||
AA+, AA, AA- | 17.3 | 5.4 | % | 26.6 | 7.6 | % | ||||||||
A+, A, A- | 149.3 | 46.2 | % | 181.3 | 51.5 | % | ||||||||
BBB+, BBB, BBB- | 117.9 | 36.5 | % | 80.6 | 22.9 | % | ||||||||
BB+ or lower | 6.0 | 1.8 | % | 1.3 | 0.4 | % | ||||||||
Total non-U.S. dollar denominated corporate bonds | $ | 323.3 | 100.0 | % | $ | 351.9 | 100.0 | % | ||||||
* Ratings as assigned by S&P
The Company does not employ any credit default protection against any of the fixed maturities held in non-U.S. denominated currencies.
Reserve for Loss and Loss Adjustment Expenses
The Company establishes loss reserves to cover the estimated liability for the payment of all loss and LAE incurred with respect to premiums earned on the contracts that the Company writes. Loss reserves do not represent an exact calculation of the liability. Estimates of ultimate liabilities are contingent on many future events and the eventual outcome of these events may be different from the assumptions underlying the reserve estimates. The Company believes that the recorded unpaid loss and LAE represent management’s best estimate of the cost to settle the ultimate liabilities based on information available at December 31, 2015.
At December 31, 2015 and 2014, the Company recorded gross reserves for unpaid loss and LAE of $2.5 billion and $2.3 billion, respectively, and net reserves for unpaid loss and LAE of $2.4 billion and $2.2 billion for December 31, 2015 and 2014, respectively.
The following table represents a reconciliation of our beginning and ending gross and net loss and LAE reserves for the years ended December 31, 2015, 2014 and 2013:
For the Year Ended December 31, | 2015 | 2014 | 2013 | |||||||||
($ in Millions) | ||||||||||||
Gross unpaid loss and LAE reserves - January 1 | $ | 2,271.3 | $ | 1,957.8 | $ | 1,740.3 | ||||||
Less: reinsurance recoverable - January 1 | 75.9 | 84.0 | 110.9 | |||||||||
Net loss and LAE reserves - January 1 | 2,195.4 | 1,873.8 | 1,629.4 | |||||||||
Net incurred losses related to: | ||||||||||||
Current year | 1,558.7 | 1,479.4 | 1,351.0 | |||||||||
Prior years | 74.9 | 18.8 | (1.4 | ) | ||||||||
1,633.6 | 1,498.2 | 1,349.6 | ||||||||||
Net paid losses related to: | ||||||||||||
Current year | (457.5 | ) | (430.4 | ) | (517.6 | ) | ||||||
Prior years | (892.9 | ) | (705.4 | ) | (598.5 | ) | ||||||
(1,350.4 | ) | (1,135.8 | ) | (1,116.1 | ) | |||||||
Effect of foreign exchange movement | (39.7 | ) | (40.8 | ) | 10.9 | |||||||
Net loss and LAE reserves - December 31 | 2,438.9 | 2,195.4 | 1,873.8 | |||||||||
Reinsurance recoverable - December 31 | 71.2 | 75.9 | 84.0 | |||||||||
Gross unpaid loss and LAE reserves - December 31 | $ | 2,510.1 | $ | 2,271.3 | $ | 1,957.8 | ||||||
See "Business — Reserve for Loss and Loss Adjustment Expenses" in Item 1 of Part I of this Report, "Critical Accounting Policies and Estimates — Reserve for Loss and Loss Adjustment Expenses" and "Results of Operations" above for a discussion of loss and LAE and prior years’ reserve developments.
81
Other Balance Sheet Changes
The following summarizes other material balance sheet changes of the Company at December 31, 2015 and 2014:
December 31, | 2015 | 2014 | Change | Change | |||||||||||
($ in Millions) | % | ||||||||||||||
Reinsurance balances receivable, net | $ | 377.3 | $ | 513.0 | $ | (135.7 | ) | (26.4 | )% | ||||||
Reserve for loss and LAE | 2,510.1 | 2,271.3 | 238.8 | 10.5 | % | ||||||||||
Unearned premiums | 1,354.6 | 1,207.8 | 146.8 | 12.2 | % | ||||||||||
The reinsurance balances receivable, net decreased by $135.7 million, or 26.4%, primarily due to the impact of the commutation agreement with AmTrust combined with a reduction in gross premiums written on AmTrust Reinsurance segment during the fourth quarter of 2015 compared to the same period in 2014. The reserve for net loss and LAE increased following the continued growth in our AmTrust Reinsurance segment combined with adverse development experienced in both our reportable segments. The unearned premiums also increased following the continued growth in our AmTrust Reinsurance segment, however, this growth was partially offset by 1) underwriting actions taken by the Company; 2) the loss of a customer as previously noted; and 3) the expiration of a fronting arrangement in our Diversified Reinsurance segment.
Capital Resources
Capital resources consist of funds deployed or available to be deployed in support of our operations. Our total capital resources were $1,707.8 million at December 31, 2015, a $107.1 million, or 6.7%, net increase from $1,600.7 million at December 31, 2014.
The following table shows the movement in total capital resources at December 31, 2015 and 2014:
December 31, | 2015 | 2014 | Change | Change | |||||||||||
($ in Millions) | % | ||||||||||||||
Preference shares | $ | 480.0 | $ | 315.0 | $ | 165.0 | 52.4 | % | |||||||
Common shareholders' equity | 867.8 | 925.7 | (57.9 | ) | (6.3 | )% | |||||||||
Total Maiden shareholders' equity | 1,347.8 | 1,240.7 | 107.1 | 8.6 | % | ||||||||||
Senior Notes | 360.0 | 360.0 | — | — | % | ||||||||||
Total capital resources | $ | 1,707.8 | $ | 1,600.7 | $ | 107.1 | 6.7 | % | |||||||
The major factors contributing to the net increase in capital resources were as follows:
Maiden shareholders' equity
Total Maiden shareholders' equity at December 31, 2015 increased by $107.1 million, or 8.6%, compared to December 31, 2014 primarily due to:
• | increase in preference shares of $165.0 million, or 52.4%, following the issuance of 6.6 million shares of 7.125% Preference Shares - Series C, par value $0.01, at a price of $25 per preference share on November 25, 2015; |
• | net increase resulting from share based transactions of $0.2 million after deduction of issuance cost related to Preference Shares - Series C; and |
• | net income attributable to Maiden of $124.4 million. See "Results of Operations - Net Income" on page 62 for a discussion of the Company’s net income for the year ended December 31, 2015. |
These increases were offset by the following:
• | net decrease in AOCI of $119.1 million. This decrease arose due to: 1) decrease in AOCI of $132.7 million which arose from the net decline in our U.S. dollar denominated investment portfolio of $84.2 million relating to market price movements and decline in our non-U.S. dollar denominated investment portfolio of $48.5 million. The decline in our non-U.S. dollar denominated investment portfolio was $28.9 million as a result of the strengthening of the U.S. dollar and $19.6 million as a result of market price movements; offset by 2) increase in cumulative translation adjustments of $13.6 million due to the effect of the appreciation of the U.S. dollar relative to the original currencies on our non-U.S. dollar net liabilities (excluding non-U.S. dollar denominated AFS fixed maturities; and |
• | dividend declared of $63.4 million related to the Company’s common and preferred shares. |
82
On July 24, 2014, the Company's Board of Directors has approved the repurchase of up to $75.0 million of the Company's common shares from time to time at market prices. No share repurchases have taken place to date under this plan.
Please refer to "Notes to Consolidated Financial Statements Note 13. Shareholders' Equity" included under Item 8 "Financial Statements and Supplementary Data" of this Form 10-K for a discussion of the equity instruments issued by the Company at December 31, 2015 and 2014.
Indebtedness
The Company did not enter into any new borrowing arrangements during the year ended December 31, 2015.
Refer to "Notes to Consolidated Financial Statements Note 7. Long Term Debt" included under Item 8 "Financial Statements and Supplementary Data" of this Form 10-K for a discussion of the Company’s indebtedness.
We have, and expect to continue, to fund a portion of our capital requirements through issuances of senior securities, including secured, unsecured and convertible debt securities, or issuances of common or preference shares. On November 9, 2015, we filed an unallocated universal shelf registration statement with the SEC, which became effective upon filing. Pursuant to the shelf registration, from time to time, we may sell any combination of certain securities in one or more offerings. Our intent and ability to issue securities pursuant to this registration statement will depend on market conditions at the time of any proposed offering.
Aggregate Contractual Obligations
In the normal course of business, the Company is a party to a variety of contractual obligations as summarized below. These contractual obligations are considered by the Company when assessing its liquidity requirements and the Company is confident in its ability to meet all of its obligations.
The Company’s aggregate contractual obligations at December 31, 2015 are as follows:
Payment Due by Period | ||||||||||||||||||||
December 31, 2015 | Total | Less than 1 Year | 1 – 3 Years | 3 – 5 Years | More than 5 Years | |||||||||||||||
Contractual Obligations | ($ in Millions) | |||||||||||||||||||
Operating lease obligations | $ | 3.9 | $ | 1.4 | $ | 1.7 | $ | 0.8 | $ | — | ||||||||||
Senior notes and interest | 1,127.2 | 28.7 | 57.4 | 57.4 | 983.7 | |||||||||||||||
Reserve for loss and LAE | 2,510.1 | 725.2 | 763.2 | 363.0 | 658.7 | |||||||||||||||
Other investments - unfunded commitments | 0.6 | — | 0.6 | — | — | |||||||||||||||
Total | $ | 3,641.8 | $ | 755.3 | $ | 822.9 | $ | 421.2 | $ | 1,642.4 | ||||||||||
The amounts included for reserve for loss and LAE reflect the estimated timing of expected loss payments on known claims and anticipated future claims at December 31, 2015. Both the amount and timing of cash flows are uncertain and do not have contractual payout terms. For a discussion of these uncertainties, please refer to "Critical Accounting Policies — Reserve for Loss and Loss Adjustment Expenses" section included under Item 7 of this Annual Report on Form 10-K for the year ended December 31, 2015. Due to the inherent uncertainty in the process of estimating the timing of these payments, there is a risk that the amounts paid in any period will differ significantly from those disclosed. Total estimated obligations will be funded by existing cash and investments.
Currency and Foreign Exchange
We conduct business in a variety of foreign (non-U.S.) currencies, the principal exposures being the euro, the British pound, the Australian dollar, the Canadian dollar and the Swedish krona. Assets and liabilities denominated in foreign currencies are exposed to changes in currency exchange rates. Our reporting currency is the U.S. dollar, and exchange rate fluctuations relative to the U.S. dollar may materially impact our results and financial position. Our principal exposure to foreign currency risk is our obligation to settle claims in foreign currencies. In addition, in order to minimize this risk, we maintain and expect to continue to maintain a portion of our investment portfolio in investments denominated in currencies other than the U.S. dollar. We may employ various strategies (including hedging) to manage our exposure to foreign currency exchange risk. To the extent that these exposures are not fully hedged or the hedges are ineffective, our results of operations or equity may be adversely effected. At December 31, 2015, no such hedges or hedging strategies were in force or had been entered into. We measure monetary assets and liabilities denominated in foreign currencies at year end exchange rates, with the resulting foreign exchange gains and losses recognized in the Consolidated Statements of Income. Revenues and expenses in foreign currencies are converted at average exchange rates during the year. The effect of the translation adjustments for foreign operations is included in AOCI.
Net foreign exchange gains amounted to $7.4 million during the year ended December 31, 2015 compared to $3.6 million and $1.7 million during the years ended December 31, 2014 and 2013, respectively.
83
Effects of Inflation
The effects of inflation are considered implicitly in pricing and estimating reserves for loss and LAE. The effects of inflation could cause the severity of claims to rise in the future. To the extent inflation causes these costs, particularly medical treatments and litigation costs, to increase above reserves established for these claims, the Company will be required to increase the reserve for loss and LAE with a corresponding reduction in its earnings in the period in which the deficiency is identified. The actual effects of inflation on the results of operations of the Company cannot be accurately known until claims are ultimately settled.
Off-Balance Sheet Arrangements
At December 31, 2015, we did not have any off-balance sheet arrangements as defined by Item 303(a)(4) of Regulation S-K.
Recent Accounting Pronouncements
Refer to "Notes to Consolidated Financial Statements Note 2. Significant Accounting Policies" included under Item 8 "Financial Statement and Supplementary Data", of this Form 10-K for a discussion on recently issued accounting pronouncements.
84
Item 7A. Quantitative and Qualitative Disclosures about Market Risk.
Quantitative and Qualitative Disclosures About Market Risk
Market risk is the risk that we will incur losses in our investments due to adverse changes in market rates and prices. Market risk is directly influenced by the volatility and liquidity in the market in which the related underlying assets are invested. We believe that we are principally exposed to three types of market risk: changes in interest rates, changes in credit quality of issuers of investment securities and reinsurers and changes in foreign exchange rates.
Interest Rate Risk
Interest rate risk is the risk that we may incur economic losses due to adverse changes in interest rates. The primary market risk to the investment portfolio is interest rate risk associated with investments in fixed maturity securities. Fluctuations in interest rates have a direct impact on the market valuation of these securities. At December 31, 2015, we had AFS fixed maturity securities with a fair value of $3.5 billion that are subject to interest rate risk.
The table below summarizes the interest rate risk associated with our fixed maturity securities by illustrating the sensitivity of the fair value and carrying value of our fixed maturity securities at December 31, 2015 to selected hypothetical changes in interest rates, and the associated impact on our shareholders’ equity. Temporary changes in the fair value of our fixed maturity securities that are held as AFS do impact the carrying value of these securities and are reported in our shareholders’ equity as a component of other comprehensive income. The selected scenarios in the table below are not predictions of future events, but rather are intended to illustrate the effect such events may have on the fair value of our AFS fixed maturity securities and on our shareholders’ equity at December 31, 2015:
Hypothetical Change in Interest Rates | Fair Value | Estimated Change in Fair Value | Hypothetical % (Decrease) Increase in Shareholders’ Equity | ||||||||
($ in Millions) | |||||||||||
200 basis point increase | $ | 3,191.2 | $ | (316.9 | ) | (23.5 | )% | ||||
100 basis point increase | 3,344.1 | (164.0 | ) | (12.2 | )% | ||||||
No change | 3,508.1 | — | — | % | |||||||
100 basis point decrease | 3,681.7 | 173.6 | 12.9 | % | |||||||
200 basis point decrease | 3,858.4 | 350.3 | 26.0 | % | |||||||
The interest rate sensitivity on the $168.0 million loan to related party which carries an interest rate of one month LIBOR plus 90 basis points, an increase of 100 and 200 basis points in LIBOR would increase our earnings and cash flows by $1.7 million and $3.4 million, respectively, on an annual basis, but would not affect the carrying value of the loan.
Counterparty Credit Risk
The concentrations of the Company’s counterparty credit risk exposures have not changed materially compared to December 31, 2014.
The Company has exposure to credit risk primarily as a holder of fixed income securities. The Company controls this exposure by emphasizing investment grade credit quality in the fixed income securities it purchases. The table below summarizes the credit ratings by major rating category of the Company's fixed maturity investments at December 31 for each of the years presented:
For the Year Ended December 31, | 2015 | 2014 | ||||
Ratings* | ||||||
AA+ or better | 42.3 | % | 46.0 | % | ||
AA, AA-, A+, A, A- | 29.9 | % | 28.7 | % | ||
BBB+, BBB, BBB- | 25.4 | % | 23.5 | % | ||
BB+ or lower | 2.4 | % | 1.8 | % | ||
100.0 | % | 100.0 | % | |||
* Ratings as assigned by S&P
The Company believes this high quality concentration reduces its exposure to credit risk on fixed income investments to an acceptable level.
85
At December 31, 2015, the Company is not exposed to any significant credit concentration risk on its investments, excluding securities issued by the U.S. government and agencies which are rated AA+ (see "Liquidity and Capital Resources - Investments" in Item 7 of Part II of this Annual Report on Form 10-K), with the single largest corporate issuer and the top 10 corporate issuers accounting for only 1.0% and 5.5% of the Company’s total fixed income securities, respectively.
The Company is subject to the credit risk of its cedants in the event of their insolvency or their failure to honor the value of the funds held balances due to the Company for any other reason. However, the Company’s credit risk in some jurisdictions is mitigated by a mandatory right of offset of amounts payable by the Company to a cedant against amounts due to the Company. In certain other jurisdictions, the Company is able to mitigate this risk, depending on the nature of the funds held arrangements, to the extent that the Company has the contractual ability to offset any shortfall in the payment of the funds held balances with amounts owed by the Company to cedants for losses payable and other amounts contractually due. Funds held balances for which the Company receives an investment return based upon either the results of a pool of assets held by the cedant or the investment return earned by the cedant on its investment portfolio are exposed to an additional layer of credit risk.
The Company has exposure to credit risk, as it relates to its business written through brokers if any, if the Company’s brokers are unable to fulfill their contractual obligations with respect to payments to the Company. In addition, in some jurisdictions, if the broker fails to make payments to the insured under the Company’s policy, the Company might remain liable to the insured for the deficiency. The Company’s exposure to such credit risk is somewhat mitigated in certain jurisdictions by contractual terms. See "Business and Risk Factors" in Item 1 and 1A of Part I of this Annual Report on Form 10-K, respectively, for detailed information on three brokers that accounted for approximately 36.9% of the Company’s gross premiums written in the Diversified Reinsurance segment for the year ended December 31, 2015.
The Company has exposure to credit risk as it relates to its reinsurance balances receivable and reinsurance recoverable on paid and unpaid losses. We are subject to the credit risk that AII and/or AmTrust will fail to perform their obligations to pay interest on and repay principal of amounts loaned to AII pursuant to its loan agreement with Maiden Bermuda, and to reimburse Maiden Bermuda for any assets or other collateral of Maiden that AmTrust’s U.S. insurance company subsidiaries apply or retain, and income on those assets. Reinsurance balances receivable from the Company’s clients at December 31, 2015 were $377.3 million, including balances both currently due and accrued.
The Company believes that credit risk related to these balances is mitigated by several factors, including but not limited to, credit checks performed as part of the underwriting process and monitoring of aged receivable balances. In addition, as the vast majority of its reinsurance agreements permit the Company the right to offset reinsurance balances receivable from clients against losses payable to them, the Company believes that the credit risk in this area is substantially reduced. Provisions are made for amounts considered potentially uncollectible. There was no allowance for uncollectible reinsurance balances receivable at December 31, 2015.
The Company requires its reinsurers to have adequate financial strength. The Company evaluates the financial condition of its reinsurers and monitors its concentration of credit risk on an ongoing basis. Provisions are made for amounts considered potentially uncollectible. The balance of reinsurance recoverable on unpaid losses was $71.2 million at December 31, 2015 compared to $75.9 million at the end of 2014. Of these reinsurance recoverables, at December 31, 2015, $35.0 million or 49.2% compared to $37.8 million or 49.8% at December 31, 2014 relates to reinsurance claims from Superstorm Sandy. The table below summarizes the A.M. Best credit ratings of the Company's reinsurance counterparties at December 31:
December 31, | 2015 | 2014 | ||||
A or better | 99.1 | % | 92.9 | % | ||
A- | — | % | 5.6 | % | ||
B++ or worse | 0.9 | % | 1.5 | % | ||
100.0 | % | 100.0 | % | |||
Foreign Currency Risk
The Company is generally able to match foreign currency denominated assets against its net reinsurance liabilities both by currency and duration to protect the Company against foreign exchange and interest rate risks. However, a natural offset does not exist for all currencies. For the year ended December 31, 2015, 9.4% of our net premiums written and 11.2% of our reserve for loss and LAE were transacted in euro.
We may employ various strategies to manage our exposure to foreign currency exchange risk. To the extent that these exposures are not fully hedged or the hedges are ineffective, our results of operations or equity may be reduced by fluctuations in foreign currency exchange rates and could materially adversely affect our financial condition and results of operations. At December 31, 2015, no hedging instruments have been entered into. Our principal foreign currency exposure is to the euro and British pound, however, assuming all other variables remain constant and disregarding any tax effects, a strengthening (weakening) of the U.S. dollar exchange rate of 10% or 20% relative to the non-U.S. currencies held by the Company would result in a decrease (increase) in the Company's net assets of $5.5 million and $11.0 million, respectively.
86
Item 8. Financial Statements and Supplementary Data.
See our Consolidated Financial Statements and Notes thereto and required financial statement schedules commencing on pages F-1 through F-48 and S-1 through S-7 below.
Item 9. Changes in and Disagreements with Accountants on Accounting and Financial Disclosure.
None.
Item 9A. Controls and Procedures.
Evaluation of Disclosure Controls and Procedures
In connection with the preparation of this Report, our management has performed an evaluation, with the participation of our Principal Executive Officer and Principal Financial Officer, of the effectiveness of our disclosure controls and procedures (as defined in Rule 13a-15(e) and 15d-15(e) under the Exchange Act) at December 31, 2015. Based on their evaluation, our Principal Executive Officer and Principal Financial Officer concluded that, at December 31, 2015, our Company’s disclosure controls and procedures were effective.
Management’s Annual Report on Internal Control over Financial Reporting
Our management is responsible for establishing and maintaining adequate internal control over financial reporting as defined in Rules 13a-15(f) and 15d-15(f) under the Exchange Act and for the assessment of the effectiveness of internal control over financial reporting. As defined by the SEC, internal control over financial reporting is a process designed by, or under the supervision of, our principal executive and principal financial officers and effected by our Board of Directors, management and other personnel, to provide reasonable assurance regarding the reliability of financial reporting and the preparation of the consolidated financial statements in accordance with U.S. GAAP.
Our internal control over financial reporting includes those policies and procedures that (1) pertain to the maintenance of records that, in reasonable detail, accurately and fairly reflect our transactions and dispositions of our assets; (2) provide reasonable assurance that transactions are recorded as necessary to permit preparation of the consolidated financial statements in accordance with U.S. GAAP, and that our receipts and expenditures are being made only in accordance with authorizations of our management and directors; and (3) provide reasonable assurance regarding prevention or timely detection of unauthorized acquisition, use or disposition of our assets that could have a material effect on the consolidated financial statements.
Because of its inherent limitations, internal control over financial reporting may not prevent or detect misstatements. Also, projections of any evaluation of effectiveness to future periods are subject to the risk that controls may become inadequate because of changes in conditions, or that the degree of compliance with the policies or procedures may deteriorate.
In connection with the preparation of our annual consolidated financial statements, management has undertaken an assessment of the effectiveness of our internal control over financial reporting as of December 31, 2015 based on criteria established in Internal Control — Integrated Framework issued by the Committee of Sponsoring Organizations of the Treadway Commission ("COSO") 2013. Management’s assessment included an evaluation of the design of our internal control over financial reporting and testing of the operational effectiveness of those controls. Based on this evaluation, management, including our CEO and CFO, have concluded that our internal control over financial reporting is effective as of December 31, 2015 based on those criteria.
The Company's independent auditors have issued an audit report on our assessment of the Company's internal control over financial reporting. This report appears below.
Changes in Internal Control Over Financial Reporting
No changes were made in our internal controls over financial reporting, as such term is defined in Exchange Act Rules 13a-15(f) and 15(d) – 15(f), during the fourth quarter ended December 31, 2015 that have materially affected, or are reasonably likely to materially affect, our internal control over financial reporting.
87
Report of Independent Registered Public Accounting Firm
Board of Directors and Shareholders
Maiden Holdings, Ltd.
Maiden Holdings, Ltd.
Hamilton, Bermuda
We have audited Maiden Holdings, Ltd. and subsidiaries' internal control over financial reporting as of December 31, 2015, based on criteria established in Internal Control - Integrated Framework (2013) issued by the Committee of Sponsoring Organizations of the Treadway Commission (the "COSO criteria"). Maiden Holdings, Ltd.’s management is responsible for maintaining effective internal control over financial reporting and for its assessment of the effectiveness of internal control over financial reporting, included in the accompanying Item 9A, Management’s Report on Internal Control Over Financial Reporting. Our responsibility is to express an opinion on the company’s internal control over financial reporting based on our audit.
We conducted our audit in accordance with the standards of the Public Company Accounting Oversight Board (United States). Those standards require that we plan and perform the audit to obtain reasonable assurance about whether effective internal control over financial reporting was maintained in all material respects. Our audit included obtaining an understanding of internal control over financial reporting, assessing the risk that a material weakness exists, and testing and evaluating the design and operating effectiveness of internal control based on the assessed risk. Our audit also included performing such other procedures as we considered necessary in the circumstances. We believe that our audit provides a reasonable basis for our opinion.
A company’s internal control over financial reporting is a process designed to provide reasonable assurance regarding the reliability of financial reporting and the preparation of financial statements for external purposes in accordance with generally accepted accounting principles. A company’s internal control over financial reporting includes those policies and procedures that (1) pertain to the maintenance of records that, in reasonable detail, accurately and fairly reflect the transactions and dispositions of the assets of the company; (2) provide reasonable assurance that transactions are recorded as necessary to permit preparation of financial statements in accordance with generally accepted accounting principles, and that receipts and expenditures of the company are being made only in accordance with authorizations of management and directors of the company; and (3) provide reasonable assurance regarding prevention or timely detection of unauthorized acquisition, use, or disposition of the company’s assets that could have a material effect on the financial statements.
Because of its inherent limitations, internal control over financial reporting may not prevent or detect misstatements. Also, projections of any evaluation of effectiveness to future periods are subject to the risk that controls may become inadequate because of changes in conditions, or that the degree of compliance with the policies or procedures may deteriorate.
In our opinion, Maiden Holdings, Ltd. and subsidiaries maintained, in all material respects, effective internal control over financial reporting as of December 31, 2015, based on the COSO criteria.
We also have audited, in accordance with the standards of the Public Company Accounting Oversight Board (United States), the consolidated balance sheets of Maiden Holdings, Ltd. and subsidiaries as of December 31, 2015 and 2014, and the related consolidated statements of income, comprehensive income, changes in shareholders’ equity and cash flows for each of the three years in the period ended December 31, 2015 and our report dated February 29, 2016 expressed an unqualified opinion thereon.
/s/ BDO USA, LLP
New York, New York
February 29, 2016
88
Item 9B. Other Information.
None.
PART III
Item 10. Directors, Executive Officers and Corporate Governance.
The information required by this item is incorporated by reference from the information responsive thereto in the sections in the proxy statement for our Annual Meeting of Shareholders to be held on May 4, 2016 (the "Proxy Statement") captioned "Election of Directors", "Executive Officers", "Audit Committee", "Section 16(a) Beneficial Ownership Reporting Compliance" and "Nominating and Corporate Governance Committee".
We have adopted a Code of Business Conduct and Ethics for all employees. The Code of Business Conduct and Ethics is available free of charge on our website at www.maiden.bm and is available in print to any shareholder who requests it. We intend to disclose any amendments to this code by posting such information on our website, and disclose any waivers of this code applicable to our principal executive officer, principal financial officer, principal accounting officer or controller and other executive officers who perform similar functions through such means or by filing a Form 8-K.
Item 11. Executive Compensation.
The information required by this item is incorporated by reference from the information responsive thereto in the sections in the Proxy Statement captioned "Compensation Discussion and Analysis", "Director Compensation for 2015", "Compensation Committee Interlocks and Insider Participation" and "Compensation Committee Report".
Item 12. Security Ownership of Certain Beneficial Owners and Management and Related Stockholder Matters.
The information required by this item is incorporated by reference from the information responsive thereto in the sections in the Proxy Statement captioned "Security Ownership of Certain Beneficial Owners", "Equity Compensation Plan Information" and "Security Ownership of Management".
Item 13. Certain Relationships and Related Transactions, and Director Independence.
The information required by this item is incorporated by reference from the information responsive thereto in the sections in the Proxy Statement captioned "Certain Relationships and Related Transactions", "Audit Committee", "Board Independence", "Compensation Committee" and "Nominating and Corporate Governance Committee".
Item 14. Principal Accounting Fees and Services.
The information required by this item is incorporated by reference from the information responsive thereto in the section in the Proxy Statement captioned "Appointment of Independent Auditors of Maiden Holdings, Ltd.".
PART IV
Item 15. Exhibits, Financial Statement Schedules.
(a) Financial statements and schedules
Financial statements and schedules listed in the accompanying index to our Consolidated Financial Statements starting on page F-1 are filed as part of this Form 10-K, and are included in Item 8. "Financial Statement and Supplementary Data". All other schedules for which provision is made in the applicable regulation of the Securities and Exchange Commission are not required under the related instructions or are inapplicable, and therefore have been omitted.
(b) Exhibits
The exhibits listed in the Exhibit Index starting on page E-1 following the signature page are filed herewith, which Exhibit Index is incorporated herein by reference.
89
SIGNATURES
Pursuant to the requirements of Section 13 or 15(d) of the Securities Exchange Act of 1934, the registrant has duly caused this Report to be signed on its behalf by the undersigned, thereunto duly authorized, in Hamilton, Bermuda on February 29, 2016.
MAIDEN HOLDINGS, LTD. | ||
By: | ||
/s/ Arturo M. Raschbaum | ||
Name: Arturo M. Raschbaum Title: President and Chief Executive Officer | ||
Pursuant to the requirements of the Securities Exchange Act of 1934, this report has been signed below by the following persons on behalf of the registrant and in the capacities and on the dates indicated.
Signature | Title | Date | ||
/s/ Arturo M. Raschbaum | President and Chief Executive Officer | February 29, 2016 | ||
Arturo M. Raschbaum | (Principal Executive Officer) | |||
/s/ Karen L. Schmitt | Chief Financial Officer | February 29, 2016 | ||
Karen L. Schmitt | (Principal Financial and Accounting Officer) | |||
/s/ Barry D. Zyskind | Chairman | February 29, 2016 | ||
Barry D. Zyskind | ||||
/s/ Raymond M. Neff | Director | February 29, 2016 | ||
Raymond M. Neff | ||||
/s/ Simcha G. Lyons | Director | February 29, 2016 | ||
Simcha G. Lyons | ||||
/s/ Yehuda L. Neuberger | Director | February 29, 2016 | ||
Yehuda L. Neuberger | ||||
/s/ Steven H. Nigro | Director | February 29, 2016 | ||
Steven H. Nigro | ||||
90
EXHIBIT INDEX
Exhibit No. | Description | Reference | ||
3.1 | Memorandum of Association (as amended) | (1) | ||
3.2 | Bye-Laws | (2) | ||
4.1 | Form of Common Share Certificate | (2) | ||
4.2 | Registration Rights Agreement by and between Maiden Holdings, Ltd. and Friedman, Billings, Ramsey & Co., Inc., dated as of July 3, 2007 | (2) | ||
4.3 | Form of Indenture for Debt Securities by and among Maiden Holdings North America, Ltd., Maiden Holdings, Ltd., as guarantor, and Wilmington Trust Company, as trustee | (3) | ||
4.4 | First Supplemental Indenture, dated as of June 24, 2011, by and among Maiden Holdings North America, Ltd., Maiden Holdings, Ltd., as guarantor, and Wilmington Trust Company, as trustee | (4) | ||
4.5 | Form of 8.25% Notes due 2041 (included in Exhibit 4.4) | (4) | ||
4.6 | Second Supplemental Indenture, dated March 27, 2012, by and among Maiden Holdings North America, Ltd., Maiden Holdings, Ltd., as guarantor, and Wilmington Trust Company, as trustee | (5) | ||
4.7 | Form of 8.000% Notes due 2042 (included in Exhibit 4.6) | (5) | ||
4.8 | Certificate of Designations of 8.25% Non-Cumulative Preference Shares, Series A, adopted on August 7, 2012 | (6) | ||
4.9 | Form of stock certificate evidencing 8.25% Series A Preference Share (included in Exhibit 4.8) | (6) | ||
4.10 | Certificate of Designations of 7.25% Mandatory Convertible Preference Shares, Series B, adopted on October 1, 2013 | (7) | ||
4.11 | Form of stock certificate evidencing 7.25% Mandatory Convertible Preference Shares, Series B (included in Exhibit 4.10) | (7) | ||
4.12 | Third Supplemental Indenture, dated November 25, 2013, by and among Maiden Holdings North America, Ltd., Maiden Holdings, Ltd., as guarantor, and Wilmington Trust Company, as trustee | (8) | ||
4.13 | Form of 7.75% Notes due 2043 (included in Exhibit 4.12) | (8) | ||
4.14 | Certificate of Designations of 7.125% Non-Cumulative Preference Shares, Series C, adopted on November 4, 2015 | (9) | ||
4.15 | Form of stock certificate evidencing 7.125% Non-Cumulative Preference Shares, Series C (included in Exhibit 4.14) | (9) | ||
10.1* | Amended and Restated Maiden Holdings, Ltd. 2007 Share Incentive Plan as of July 26, 2011 | (10) | ||
10.2* | Form of Share Option Agreement for Employee Recipients of Options under Amended and Restated 2007 Share Incentive Plan | (2) | ||
10.3* | Form of Share Option Agreement for Non-Employee Recipients of Options under Amended and Restated 2007 Share Incentive Plan | (2) | ||
10.4* | Form of Performance-Based Restricted Share Unit Agreement for Employee Recipients of Restricted Share Units under the Amended and Restated 2007 Share Incentive Plan | (10) | ||
10.5* | Form of Employment Agreement by and between Maiden and Arturo M. Raschbaum, Karen L. Schmitt, Patrick J. Haveron, Thomas Highet and Lawrence F. Metz, dated as of November 1, 2011 | (11) | ||
10.6* | Master Agreement by and between Maiden Holdings, Ltd. and AmTrust Financial Services, Inc., dated as of July 3, 2007 | (2) | ||
10.7* | Amendment No. 1 to the Master Agreement by and between Maiden Holdings, Ltd. and AmTrust Financial Services, Inc., dated as of September 17, 2007 | (2) | ||
10.8 | Amended and Restated Quota Share Reinsurance Agreement by and between Maiden Insurance Company Ltd. and AmTrust International Insurance, Ltd. and dated as of June 1, 2008 | (12) | ||
10.9 | Loan Agreement by and between AmTrust International Insurance, Ltd. and Maiden Insurance Company Ltd., dated as of November 16, 2007 | (13) | ||
10.10 | Amendment No. 1 to the Loan Agreement by and between AmTrust International Insurance, Ltd. and Maiden Insurance Company Ltd., dated as of February 15, 2008 | (13) | ||
E-1
10.11 | Asset Management Agreement by and between AII Insurance Management Limited and Maiden Insurance Company Ltd., dated as of July 3, 2007 | (2) | ||
10.12 | First Amendment to Asset Management Agreement by and between AII Insurance Management Limited, Maiden Insurance Company Ltd., Maiden Holdings, Ltd., and Maiden Holdings North America, Ltd., dated as of November 3, 2008 | (14) | ||
10.13 | Second Amendment to Asset Management Agreement by and between AII Insurance Management Limited, Maiden Insurance Company Ltd., Maiden Holdings, Ltd., Maiden Holdings North America, Ltd. and Maiden Reinsurance Company, dated as of December 23, 2008 | (14) | ||
10.14 | Third Amendment to Asset Management Agreement by and between AII Insurance Management Limited, Maiden Insurance Company Ltd., Maiden Holdings, Ltd., Maiden Holdings North America, Ltd., Maiden Reinsurance Company and Maiden Specialty Insurance Company dated as of September 1, 2009 | (14) | ||
10.15 | Asset Management Agreement by and between AII Insurance Management Limited, Maiden Insurance Company Ltd., Maiden Holdings, Ltd., Maiden Holdings North America, Ltd., Maiden Reinsurance Company and Maiden Specialty Insurance Company dated as of August 6, 2010 | (14) | ||
10.16 | Asset Management Agreement by and between AII Insurance Management Limited and Maiden Life Försäkrings AB dated as of October 11, 2013 | (15) | ||
10.17 | Reinsurance Brokerage Agreement by and between Maiden Insurance Company Ltd. and AII Reinsurance Broker Ltd., dated as of July 3, 2007 | (2) | ||
10.18 | Brokerage Services Agreement between Maiden Insurance Company Ltd. and IGI Intermediaries Limited, dated as of January 1, 2008 | (13) | ||
10.19 | Reinsurance Brokerage Services Agreement between Maiden Insurance Company Ltd. and IGI Intermediaries, Inc., dated as of April 3, 2008 | (16) | ||
10.2 | Endorsement No. 1 to the Amended and Restated Quota Share Reinsurance Agreement by and between Maiden Insurance Company Ltd. and AmTrust International Insurance, Ltd. dated as of July 26, 2011 | (10) | ||
10.21 | Endorsement No. 2 to the Quota Share Reinsurance Contract by and between Maiden Insurance Company Ltd. and AmTrust International Insurance, Ltd. dated as of March 7, 2013 | (17) | ||
10.22 | Quota Share Reinsurance Contract by and between Maiden Insurance Company Ltd. and AmTrust Europe Limited and/or AmTrust International Underwriters Limited dated as of April 1, 2011 | (10) | ||
10.23 | Endorsement No. 1 to the Quota Share Reinsurance Contract by and between Maiden Insurance Company Ltd. and AmTrust Europe Limited and/or AmTrust International Underwriters Limited dated as of July 26, 2011 | (10) | ||
10.24 | Endorsement No. 2 to the Quota Share Reinsurance Contract by and between Maiden Insurance Company Ltd. and AmTrust Europe Limited and/or AmTrust International Underwriters Limited dated as of August 7, 2012 | (7) | ||
10.25 | Personal and Commercial Automobile Quota Share Reinsurance Agreement by and between Maiden Insurance Company Ltd. and Integon National Insurance Company, dated as March 1, 2010 | (14) | ||
10.26 | Addendum No. 1 to Personal and Commercial Automobile Quota Share Reinsurance Agreement by and between Maiden Insurance Company Ltd. and Integon National Insurance Company and others, dated as October 1, 2012 | (16) | ||
10.27 | Termination of Personal and Commercial Automobile Quota Share Reinsurance Agreement by and between Maiden Insurance Company Ltd. and Integon National Insurance Company and others, dated as August 1, 2013 | (15) | ||
10.28 | Form of Indemnification Agreement between Maiden Holdings, Ltd. and its officers and directors | (13) | ||
21.1 | Subsidiaries of the registrant | † | ||
23.1 | Consent of BDO USA, LLP | † | ||
31.1 | Section 302 Certification of CEO | † | ||
31.2 | Section 302 Certification of CFO | † | ||
32.1 | Section 906 Certification of CEO | † | ||
32.2 | Section 906 Certification of CFO | † | ||
E-2
101.1 | The following financial information from Maiden Holdings, Ltd.'s Annual Report on Form 10-K for the year ended December 31, 2015, formatted in XBRL (eXtensive Business Reporting Language): (i) the Consolidated Balance Sheets at December 31, 2015 and 2014; (ii) the Consolidated Statements of Income for the years ended December 31, 2015, 2014 and 2013; (iii) the Consolidated Statements of Comprehensive Income for the years ended December 31, 2015, 2014 and 2013; (iv) the Consolidated Statements of Changes in Shareholders' Equity for the years ended December 31, 2015, 2014 and 2013; (v) the Consolidated Statements of Cash Flows for the years ended December 31, 2015, 2014 and 2013; (vi) Notes to Consolidated Financial Statements; and (vii) Financial Statement Schedules. | † | ||
(1) | Incorporated by reference to the filing of such exhibit with the registrant's Registration Statement on Form S-8 filed with the SEC on May 18, 2010 (File No. 333-166934). |
(2) | Incorporated by reference to the filing of such exhibit with the registrant's Registration Statement on S-1 initially filed with the SEC on September 17, 2007, subsequently amended and declared effective May 6, 2008 (File No. 333-146137). |
(3) | Incorporated by reference to the filing of such exhibit with the registrant's Registration Statement on S-3 filed with the SEC on February 7, 2011 (File Nos. 333-172107 and 333-172107-01). |
(4) | Incorporated by reference to the filing of such exhibit with the registrant's Current Report on Form 8-K filed with the SEC on June 17, 2011 (File No. 001-34042). |
(5) | Incorporated by reference to the filing of such exhibit with the registrant's Current Report on Form 8-K filed with the SEC on March 27, 2012 (File No. 001-34042). |
(6) | Incorporated by reference to the filing of such exhibit with the registrant's Current Report on Form 8-K filed with the SEC on August 22, 2012 (File No. 001-34042). |
(7) | Incorporated by reference to the filing of such exhibit with the registrant's Current Report on Form 8-K filed with the SEC on October 1, 2013 (File No. 001-34042). |
(8) | Incorporated by reference to the filing of such exhibit with the registrant's Current Report on Form 8-K filed with the SEC on November 25, 2013 (File No. 001-34042). |
(9) | Incorporated by reference to the filing of such exhibit with the registrant’s Current Report on Form 8-K filed with the SEC on November 25, 2015 (File No. 001-34042). |
(10) | Incorporated by reference to the filing of such exhibit with the registrant's Quarterly Report on Form 10-Q for the period ended June 30, 2010 filed with the SEC on August 8, 2011 (File No. 001-34042). |
(11) | Incorporated by reference to the filing of such exhibit with the registrant's Annual Report on Form 10-K for the fiscal year ended December 31, 2011 filed with the SEC on March 13, 2012 (File No. 001-34042). |
(12) | Incorporated by reference to the filing of such exhibit with the registrant's Annual Report on Form 10-K for the fiscal year ended December 31, 2008 filed with the SEC on March 31, 2009 (File No. 001-34042). |
(13) | Incorporated by reference to the filing of such exhibit with Amendment No. 2 to the registrant's Registration Statement on S-1 filed with the SEC on March 28, 2008 (No. 333-146137). |
(14) | Incorporated by reference to the filing of such exhibit with the registrant's Annual Report on Form 10-K for the fiscal year ended December 31, 2010 filed with the SEC on March 14, 2011 (File No. 001-34042). |
(15) Incorporated by reference to the filing of such exhibit with the registrant's Annual Report on Form 10-K for the fiscal year ended December 31, 2013 filed with the SEC on March 4, 2014 (File No. 001-34042).
(16) | Incorporated by reference to the filing of such exhibit with Amendment No. 3 to the registrant's Registration Statement on S-1 filed with the SEC on April 24, 2008 (No. 333-146137). |
(17) | Incorporated by reference to the filing of such exhibit with the registrant's Annual Report on Form 10-K for the fiscal year ended December 31, 2012 filed with the SEC on March 11, 2013 (File No. 001-34042). |
(18) | Incorporated by reference to the filing of such exhibit with the registrant's Quarterly Report on Form 10-Q for the period ended June 30, 2012 filed with the SEC on August 9, 2012 (File No. 001-34042) |
† Filed herewith.
* Management contract or compensatory plan or arrangement
E-3
Item 8. Financial Statements and Supplementary Data.
Index to Consolidated Financial Statements and Related Notes | Page | |
Supplementary Information | ||
F-1
REPORT OF INDEPENDENT REGISTERED PUBLIC ACCOUNTING FIRM
To the Board of Directors and Shareholders of
Maiden Holdings, Ltd.
Maiden Holdings, Ltd.
Hamilton, Bermuda
We have audited the accompanying consolidated balance sheets of Maiden Holdings, Ltd. and subsidiaries (the "Company") as of December 31, 2015 and 2014 and the related consolidated statements of income, comprehensive income, changes in shareholders’ equity, and cash flows for each of the three years in the period ended December 31, 2015. In connection with our audits of the financial statements, we have also audited the financial statement schedules listed in the accompanying index. These financial statements and schedules are the responsibility of the Company’s management. Our responsibility is to express an opinion on these financial statements and schedules based on our audits.
We conducted our audits in accordance with the standards of the Public Company Accounting Oversight Board (United States). Those standards require that we plan and perform the audit to obtain reasonable assurance about whether the financial statements are free of material misstatement. An audit includes examining, on a test basis, evidence supporting the amounts and disclosures in the financial statements, assessing the accounting principles used and significant estimates made by management, as well as evaluating the overall presentation of the financial statements and schedules. We believe that our audits provide a reasonable basis for our opinion.
In our opinion, the consolidated financial statements referred to above present fairly, in all material respects, the financial position of Maiden Holdings, Ltd. and subsidiaries as of December 31, 2015 and 2014, and the results of their operations and their cash flows for each of the three years in the period ended December 31, 2015, in conformity with accounting principles generally accepted in the United States of America.
Also, in our opinion, the financial statement schedules, when considered in relation to the basic consolidated financial statements taken as a whole, present fairly, in all material respects, the information set forth therein.
We also have audited, in accordance with the standards of the Public Company Accounting Oversight Board (United States), Maiden Holdings, Ltd.’s internal control over financial reporting as of December 31, 2015, based on criteria established in Internal Control — Integrated Framework (2013) issued by the Committee of Sponsoring Organizations of the Treadway Commission (COSO) and our report dated February 29, 2016 expressed an unqualified opinion thereon.
/s/ BDO USA, LLP
New York, New York
February 29, 2016
F-2
MAIDEN HOLDINGS, LTD.
CONSOLIDATED BALANCE SHEETS
As of December 31, 2015 and 2014
(In thousands of U.S. dollars, except share and per share data)
As of December 31, 2015 and 2014
(In thousands of U.S. dollars, except share and per share data)
2015 | 2014 | |||||||
ASSETS | ||||||||
Investments: | ||||||||
Fixed maturities, available-for-sale, at fair value (amortized cost 2015: $3,562,864; 2014: $3,379,864) | $ | 3,508,088 | $ | 3,456,904 | ||||
Fixed maturities, held-to-maturity, at amortized cost (fair value 2015: $598,975; 2014: $0) | 607,843 | — | ||||||
Other investments, at fair value (cost 2015: $10,816; 2014: $10,862) | 11,812 | 12,571 | ||||||
Total investments | 4,127,743 | 3,469,475 | ||||||
Cash and cash equivalents | 89,641 | 108,119 | ||||||
Restricted cash and cash equivalents | 242,859 | 284,381 | ||||||
Accrued investment income | 32,288 | 27,524 | ||||||
Reinsurance balances receivable, net (includes $147,365 and $267,490 from related parties in 2015 and 2014, respectively) | 377,318 | 512,996 | ||||||
Reinsurance recoverable on unpaid losses (includes $2,177 and $3,845 from related parties in 2015 and 2014, respectively) | 71,248 | 75,873 | ||||||
Loan to related party | 167,975 | 167,975 | ||||||
Deferred commission and other acquisition expenses (includes $341,025 and $285,227 from related parties in 2015 and 2014, respectively) | 397,548 | 372,487 | ||||||
Goodwill and intangible assets, net | 81,920 | 87,336 | ||||||
Other assets | 125,105 | 57,926 | ||||||
Total assets | $ | 5,713,645 | $ | 5,164,092 | ||||
LIABILITIES | ||||||||
Reserve for loss and loss adjustment expenses (includes $1,443,639 and $1,167,041 from related parties in 2015 and 2014, respectively) | $ | 2,510,101 | $ | 2,271,292 | ||||
Unearned premiums (includes $1,077,460 and $914,087 from related parties in 2015 and 2014, respectively) | 1,354,572 | 1,207,757 | ||||||
Accrued expenses and other liabilities | 139,873 | 83,877 | ||||||
Senior notes | 360,000 | 360,000 | ||||||
Total liabilities | 4,364,546 | 3,922,926 | ||||||
Commitments and Contingencies | ||||||||
EQUITY | ||||||||
Preference shares | 480,000 | 315,000 | ||||||
Common shares ($0.01 par value; 74,735,785 and 73,900,889 shares issued in 2015 and 2014, respectively; 73,721,140 and 72,932,702 shares outstanding in 2015 and 2014, respectively) | 747 | 739 | ||||||
Additional paid-in capital | 579,178 | 578,445 | ||||||
Accumulated other comprehensive (loss) income | (23,767 | ) | 95,293 | |||||
Retained earnings | 316,184 | 255,084 | ||||||
Treasury shares, at cost (1,014,645 and 968,187 shares in 2015 and 2014, respectively) | (4,521 | ) | (3,867 | ) | ||||
Total Maiden shareholders’ equity | 1,347,821 | 1,240,694 | ||||||
Noncontrolling interests in subsidiaries | 1,278 | 472 | ||||||
Total equity | 1,349,099 | 1,241,166 | ||||||
Total liabilities and equity | $ | 5,713,645 | $ | 5,164,092 | ||||
See accompanying notes to Consolidated Financial Statements
F-3
MAIDEN HOLDINGS, LTD.
CONSOLIDATED STATEMENTS OF INCOME
(In thousands of U.S. dollars, except share and per share data)
CONSOLIDATED STATEMENTS OF INCOME
(In thousands of U.S. dollars, except share and per share data)
For the Year Ended December 31, | 2015 | 2014 | 2013 | |||||||||
Revenues | ||||||||||||
Gross premiums written | $ | 2,662,825 | $ | 2,507,352 | $ | 2,204,159 | ||||||
Net premiums written | $ | 2,514,116 | $ | 2,458,136 | $ | 2,096,301 | ||||||
Change in unearned premiums | (85,047 | ) | (206,393 | ) | (95,414 | ) | ||||||
Net premiums earned | 2,429,069 | 2,251,743 | 2,000,887 | |||||||||
Other insurance revenue | 11,512 | 13,410 | 14,232 | |||||||||
Net investment income | 131,092 | 117,215 | 91,352 | |||||||||
Net realized gains on investment | 2,498 | 1,163 | 3,585 | |||||||||
Total other-than-temporary impairment losses | (1,060 | ) | (2,364 | ) | — | |||||||
Portion of loss recognized in other comprehensive income (loss) | — | — | — | |||||||||
Net impairment losses recognized in earnings | (1,060 | ) | (2,364 | ) | — | |||||||
Total revenues | 2,573,111 | 2,381,167 | 2,110,056 | |||||||||
Expenses | ||||||||||||
Net loss and loss adjustment expenses | 1,633,570 | 1,498,271 | 1,349,630 | |||||||||
Commission and other acquisition expenses | 724,197 | 659,315 | 556,578 | |||||||||
General and administrative expenses | 64,872 | 62,558 | 58,353 | |||||||||
Interest and amortization expenses | 29,063 | 29,959 | 39,805 | |||||||||
Accelerated amortization of junior subordinated debt discount and issuance cost | — | 28,240 | — | |||||||||
Amortization of intangible assets | 2,840 | 3,277 | 3,780 | |||||||||
Foreign exchange and other gains | (7,753 | ) | (4,150 | ) | (2,809 | ) | ||||||
Total expenses | 2,446,789 | 2,277,470 | 2,005,337 | |||||||||
Income before income taxes | 126,322 | 103,697 | 104,719 | |||||||||
Income tax expense | 2,038 | 2,164 | 1,863 | |||||||||
Net income | 124,284 | 101,533 | 102,856 | |||||||||
Loss (income) attributable to noncontrolling interests | 192 | (142 | ) | (121 | ) | |||||||
Net income attributable to Maiden | 124,476 | 101,391 | 102,735 | |||||||||
Dividends on preference shares | (24,337 | ) | (24,337 | ) | (14,834 | ) | ||||||
Net income attributable to Maiden common shareholders | $ | 100,139 | $ | 77,054 | $ | 87,901 | ||||||
Basic earnings per share attributable to Maiden common shareholders | $ | 1.36 | $ | 1.06 | $ | 1.21 | ||||||
Diluted earnings per share attributable to Maiden common shareholders | $ | 1.31 | $ | 1.04 | $ | 1.18 | ||||||
Dividends declared per common share | $ | 0.53 | $ | 0.46 | $ | 0.38 | ||||||
Weighted average number of common shares - basic | 73,478,544 | 72,843,782 | 72,510,361 | |||||||||
Adjusted weighted average number of common shares and assumed conversions - diluted | 85,638,235 | 74,117,568 | 76,417,839 | |||||||||
See accompanying notes to Consolidated Financial Statements.
F-4
MAIDEN HOLDINGS, LTD.
CONSOLIDATED STATEMENTS OF COMPREHENSIVE INCOME
(In thousands of U.S. dollars)
For the Year Ended December 31, | 2015 | 2014 | 2013 | |||||||||
Net income | $ | 124,284 | $ | 101,533 | $ | 102,856 | ||||||
Other comprehensive (loss) income | ||||||||||||
Net unrealized holdings (losses) gains on available-for-sale fixed maturities arising during the period | (132,511 | ) | 40,625 | (102,001 | ) | |||||||
Portion of other-than-temporary impairment losses recognized in other comprehensive income | — | — | — | |||||||||
Adjustment for reclassification of net realized (gains) losses recognized in net income | (263 | ) | 3,278 | (6,953 | ) | |||||||
Foreign currency translation adjustment | 13,566 | 25,592 | (6,388 | ) | ||||||||
Other comprehensive (loss) income, before tax | (119,208 | ) | 69,495 | (115,342 | ) | |||||||
Income tax benefit (expense) related to components of other comprehensive income | 83 | (52 | ) | 17 | ||||||||
Other comprehensive (loss) income, after tax | (119,125 | ) | 69,443 | (115,325 | ) | |||||||
Comprehensive income (loss) | 5,159 | 170,976 | (12,469 | ) | ||||||||
Net loss (income) attributable to noncontrolling interests | 192 | (142 | ) | (121 | ) | |||||||
Other comprehensive loss (income) attributable to noncontrolling interests | 65 | 66 | (21 | ) | ||||||||
Comprehensive loss (income) attributable to noncontrolling interests | 257 | (76 | ) | (142 | ) | |||||||
Comprehensive income (loss) attributable to Maiden | $ | 5,416 | $ | 170,900 | $ | (12,611 | ) | |||||
See accompanying notes to Consolidated Financial Statements.
F-5
MAIDEN HOLDINGS, LTD.
CONSOLIDATED STATEMENTS OF CHANGES IN SHAREHOLDERS' EQUITY
(In thousands of U. S. dollars)
CONSOLIDATED STATEMENTS OF CHANGES IN SHAREHOLDERS' EQUITY
(In thousands of U. S. dollars)
For the Year Ended December 31, | 2015 | 2014 | 2013 | |||||||||
Preference shares - Series A, B and C | ||||||||||||
Beginning balance | $ | 315,000 | $ | 315,000 | $ | 150,000 | ||||||
Issuance of preference shares - Series C | 165,000 | — | — | |||||||||
Issuance of preference shares - Series B | — | — | 165,000 | |||||||||
Ending balance | 480,000 | 315,000 | 315,000 | |||||||||
Common shares | ||||||||||||
Beginning balance | 739 | 736 | 733 | |||||||||
Exercise of options and issuance of shares | 8 | 3 | 3 | |||||||||
Ending balance | 747 | 739 | 736 | |||||||||
Additional paid-in capital | ||||||||||||
Beginning balance | 578,445 | 574,522 | 575,869 | |||||||||
Exercise of options and issuance of common shares | 3,310 | 589 | 1,773 | |||||||||
Issuance costs of preference shares | (5,515 | ) | — | (5,325 | ) | |||||||
Share-based compensation expense | 2,938 | 3,334 | 2,205 | |||||||||
Ending balance | 579,178 | 578,445 | 574,522 | |||||||||
Accumulated other comprehensive (loss) income | ||||||||||||
Beginning balance | 95,293 | 25,784 | 141,130 | |||||||||
Change in net unrealized (losses) gains on investment | (132,691 | ) | 43,851 | (108,937 | ) | |||||||
Foreign currency translation adjustment | 13,631 | 25,658 | (6,409 | ) | ||||||||
Ending balance | (23,767 | ) | 95,293 | 25,784 | ||||||||
Retained earnings | ||||||||||||
Beginning balance | 255,084 | 211,602 | 151,308 | |||||||||
Net income attributable to Maiden | 124,476 | 101,391 | 102,735 | |||||||||
Dividends on preference shares | (24,337 | ) | (24,337 | ) | (14,834 | ) | ||||||
Dividends on common shares | (39,039 | ) | (33,572 | ) | (27,607 | ) | ||||||
Ending balance | 316,184 | 255,084 | 211,602 | |||||||||
Treasury shares | ||||||||||||
Beginning balance | (3,867 | ) | (3,801 | ) | (3,801 | ) | ||||||
Shares repurchased | (654 | ) | (66 | ) | — | |||||||
Ending balance | (4,521 | ) | (3,867 | ) | (3,801 | ) | ||||||
Noncontrolling interests in subsidiaries | ||||||||||||
Beginning balance | 472 | 452 | 372 | |||||||||
Acquisition of subsidiary | 1,378 | — | — | |||||||||
Dividend paid to noncontrolling interest | (315 | ) | (56 | ) | (62 | ) | ||||||
Net (loss) income attributable to noncontrolling interests | (192 | ) | 142 | 121 | ||||||||
Foreign currency translation adjustment | (65 | ) | (66 | ) | 21 | |||||||
Ending balance | 1,278 | 472 | 452 | |||||||||
Total equity | $ | 1,349,099 | $ | 1,241,166 | $ | 1,124,295 | ||||||
See accompanying notes to Consolidated Financial Statements.
F-6
MAIDEN HOLDINGS, LTD.
CONSOLIDATED STATEMENTS OF CASH FLOWS
(In thousands of U.S. dollars)
CONSOLIDATED STATEMENTS OF CASH FLOWS
(In thousands of U.S. dollars)
For the Year Ended December 31, | 2015 | 2014 | 2013 | |||||||||
Cash flows from operating activities | ||||||||||||
Net income | $ | 124,284 | $ | 101,533 | $ | 102,856 | ||||||
Adjustments to reconcile net income to net cash provided by operating activities | ||||||||||||
Depreciation and amortization | 9,716 | 40,319 | 19,076 | |||||||||
Net realized gains on investment | (2,498 | ) | (1,163 | ) | (3,585 | ) | ||||||
Net impairment losses recognized in earnings | 1,060 | 2,364 | — | |||||||||
Foreign exchange and other gains | (7,753 | ) | (4,150 | ) | (2,809 | ) | ||||||
Changes in assets - (increase) decrease: | ||||||||||||
Reinsurance balances receivable, net | 127,506 | 34,343 | (31,051 | ) | ||||||||
Reinsurance recoverable on unpaid losses | (20,721 | ) | 8,078 | 26,821 | ||||||||
Accrued investment income | (5,086 | ) | (2,693 | ) | (4,141 | ) | ||||||
Deferred commission and other acquisition expenses | (26,546 | ) | (69,217 | ) | (34,118 | ) | ||||||
Other assets | (76,599 | ) | 32,060 | (131 | ) | |||||||
Changes in liabilities - increase (decrease): | ||||||||||||
Reserve for loss and loss adjustment expenses | 304,254 | 354,014 | 206,783 | |||||||||
Unearned premiums | 154,642 | 182,602 | 96,040 | |||||||||
Accrued expenses and other liabilities | 52,039 | (26,445 | ) | (9,494 | ) | |||||||
Net cash provided by operating activities | 634,298 | 651,645 | 366,247 | |||||||||
Cash flows from investing activities | ||||||||||||
Purchases of investments: | ||||||||||||
Purchases of fixed-maturities – available-for-sale | (1,463,556 | ) | (778,702 | ) | (1,442,116 | ) | ||||||
Purchases of other investments | (217 | ) | (6,698 | ) | (2,135 | ) | ||||||
Sale of investments: | ||||||||||||
Proceeds from sales of fixed-maturities – available-for-sale | 129,152 | 171,216 | 355,863 | |||||||||
Proceeds from maturities and calls of fixed maturities | 541,081 | 349,852 | 448,881 | |||||||||
Proceeds from redemption of other investments | 456 | 797 | 400 | |||||||||
Decrease (increase) in restricted cash and cash equivalents | 34,980 | (207,859 | ) | 54,967 | ||||||||
Other, net | 7,426 | (490 | ) | 146 | ||||||||
Net cash used in investing activities | (750,678 | ) | (471,884 | ) | (583,994 | ) | ||||||
Cash flows from financing activities | ||||||||||||
Senior notes issuance, net of issuance costs | — | — | 147,446 | |||||||||
Repayment of junior subordinated debt | — | (152,500 | ) | — | ||||||||
Preference shares issuance, net of issuance costs | 159,628 | — | 159,675 | |||||||||
Issuance of common shares | 3,318 | 592 | 1,776 | |||||||||
Repurchase of common shares | (654 | ) | (66 | ) | — | |||||||
Dividends paid - Maiden common shareholders | (38,204 | ) | (32,079 | ) | (19,607 | ) | ||||||
Dividends paid - preference shares | (24,337 | ) | (24,337 | ) | (14,834 | ) | ||||||
Net cash provided by (used in) financing activities | 99,751 | (208,390 | ) | 274,456 | ||||||||
Effect of exchange rate changes on foreign currency cash | (1,849 | ) | (3,085 | ) | 1,581 | |||||||
Net (decrease) increase in cash and cash equivalents | (18,478 | ) | (31,714 | ) | 58,290 | |||||||
Cash and cash equivalents, beginning of period | 108,119 | 139,833 | 81,543 | |||||||||
Cash and cash equivalents, end of period | $ | 89,641 | $ | 108,119 | $ | 139,833 | ||||||
Supplemental information on cash flows | ||||||||||||
Interest paid | $ | 28,687 | $ | 34,222 | $ | 38,219 | ||||||
Taxes paid | 789 | 708 | 634 | |||||||||
Supplemental information about non cash investing and financing activities | ||||||||||||
Acquisition of fixed maturities, available-for-sale | — | — | 23,478 | |||||||||
Other assets | — | — | (23,478 | ) | ||||||||
See accompanying notes to Consolidated Financial Statements.
F-7
MAIDEN HOLDINGS, LTD.
NOTES TO CONSOLIDATED FINANCIAL STATEMENTS
(In thousands of U.S. dollars, except share and per share data)
NOTES TO CONSOLIDATED FINANCIAL STATEMENTS
(In thousands of U.S. dollars, except share and per share data)
1. Organization
Maiden Holdings, Ltd. (sometimes referred to as "Maiden Holdings" or "Parent Company") is a Bermuda-based holding company formed in June 2007, primarily focused on serving the needs of regional and specialty insurers in the United States and Europe by providing innovative reinsurance solutions designed to support their capital needs. Together with its subsidiaries (collectively referred to as the "Company", "We" or "Maiden"), Maiden specializes in reinsurance solutions that optimize financing by providing coverage within the more predictable and actuarially credible lower layers of coverage and/or reinsure risks that are believed to be lower hazard, more predictable and generally not susceptible to catastrophe claims. Our tailored solutions include a variety of value added services focused on helping our clients grow and prosper.
We provide reinsurance through our wholly owned subsidiaries, Maiden Reinsurance Ltd. ("Maiden Bermuda") and Maiden Reinsurance North America, Inc. ("Maiden US") and have operations in Bermuda and the United States, respectively. Maiden Bermuda does not underwrite any direct insurance business. Internationally, we provide reinsurance-related services through Maiden Global Holdings, Ltd. ("Maiden Global") and its subsidiaries. Maiden Global primarily focuses on providing branded auto and credit life insurance products through its insurer partners to retail clients in the European Union and other global markets, which also produce reinsurance programs which are underwritten by Maiden Bermuda. Certain international credit life business is also written on a primary basis by Maiden Life Försäkrings AB ("Maiden LF"), a wholly owned subsidiary of Maiden Holdings, as part of Maiden Global’s service offerings.
2. Significant Accounting Policies
Basis of Reporting and Consolidation — These Consolidated Financial Statements of the Company have been prepared in conformity with accounting principles generally accepted in the United States of America ("U.S. GAAP") and include the accounts of Maiden Holdings and all of its subsidiaries. These Consolidated Financial Statements reflect all adjustments that are, in the opinion of management, necessary for a fair presentation of the results for the period and all such adjustments are of a normal recurring nature. All significant intercompany transactions and accounts have been eliminated. Certain prior year comparatives have been reclassified to conform to the current year presentation. The effect of these reclassifications had no impact on previously reported shareholders' equity or net income.
Estimates — The preparation of U.S. GAAP Consolidated Financial Statements requires management to make estimates and assumptions that affect the reported amounts of assets and liabilities and disclosure of contingent assets and liabilities at the date of the Consolidated Financial Statements and the reported amounts of revenues and expenses during the reporting period. Actual results could materially differ from those estimates. The significant estimates include, but are not limited to:
• | reserve for loss and loss adjustment expenses; |
• | recoverability of deferred commission and other acquisition expenses; |
• | determination of impairment of goodwill and other intangible assets; |
• | valuation of financial instruments; and |
• | determination of other-than-temporary impairment ("OTTI") of investments. |
Investments — The Company currently classifies its fixed maturity investments as either "available-for-sale" ("AFS") or held-to-maturity ("HTM"). The AFS portfolio is reported at fair value. The HTM portfolio includes securities for which we have the ability and intent to hold to maturity or redemption. The HTM portfolio is reported at amortized cost. When a security is transferred from AFS to HTM, the fair value at the time of transfer, adjusted for subsequent amortization, becomes the security's amortized cost. The fair value of fixed maturity investments is generally determined from quotations received from nationally recognized pricing services ("Pricing Service"), or when such prices are not available, by reference to broker or underwriter bid indications. Short-term investments comprise securities due to mature within one year of the date of purchase.
The Company's other investments comprise both quoted and unquoted investments. The Company's quoted equity investment is based on a quoted market price from a Pricing Service, reflecting the closing price quoted for the final trading day of the period. The Company accounts for its unquoted other investments at fair value in accordance with Financial Accounting Standards Board ("FASB") Accounting Standards Codification ("ASC") Topic 944, "Financial Services" ("ASC 944"). Unquoted other investments primarily comprise investments in limited partnerships which are reported at fair value based on the financial information received from the fund managers and other information available to management.
Unrealized gains or losses on fixed maturities and other investments are reported as a component of accumulated other comprehensive income ("AOCI"). The net unrealized holding gains/losses of securities transferred from AFS to HTM at the designation date continues to be reported in the carrying value of the HTM securities and is amortized through Other Comprehensive Income over the remaining life of the securities using the effective interest method in a manner consistent with the amortization of any premium or discount.
F-8
MAIDEN HOLDINGS, LTD.
NOTES TO CONSOLIDATED FINANCIAL STATEMENTS
(In thousands of U.S. dollars, except share and per share data)
NOTES TO CONSOLIDATED FINANCIAL STATEMENTS
(In thousands of U.S. dollars, except share and per share data)
2. Significant Accounting Policies (continued)
Purchases and sales of investments are recorded on a trade date basis. Realized gains or losses on sales of investments are determined based on the first in first out cost method. Net investment income is recognized when earned and includes interest and dividend income together with amortization of market premiums and discounts using the effective yield method and is net of investment management fees. For mortgage-backed securities ("MBS") and any other holdings for which there is a prepayment risk, prepayment assumptions are evaluated and revised as necessary. Any adjustments required due to the change in effective yields and maturities are recognized on a prospective basis through yield adjustments.
A security is potentially impaired when its fair value is below its amortized cost. On a quarterly basis, we review all impaired securities to determine if the impairment is OTTI. OTTI assessments are inherently judgmental, especially where securities have experienced severe declines in fair value in a short period. Our review process begins with a quantitative analysis to identify securities to be further evaluated for potential OTTI. For all identified securities, further fundamental analysis is performed that considers, but not limited to, the following quantitative and qualitative factors:
• | Historic and implied volatility of the security; |
• | Length of time and extent to which the fair value has been less than amortized cost; |
• | Adverse conditions specifically related to the security or to specific conditions in an industry or geographic area; |
• | Failure, if any, of the issuer of the security to make scheduled payments; and |
• | Recoveries or additional declines in fair value subsequent to the balance sheet date. |
The Company recognizes OTTI in earnings for its impaired fixed maturity securities (i) for which the Company has the intent to sell the security or (ii) it is more likely than not that the Company will be required to sell the debt security before its anticipated recovery and (iii) for those securities which have a credit loss. In assessing whether a credit loss exists, the Company compares the present value of the cash flows expected to be collected from the security with the amortized cost basis of the security. In instances in which a determination is made that an impairment exists but the Company does not intend to sell the security and it is not more likely than not that the Company will be required to sell the security before the anticipated recovery of its remaining amortized cost basis, the impairment is separated into (i) the amount of the total impairment related to the credit loss and (ii) the amount of the total impairment related to all other factors. The amount of the total OTTI related to the credit loss is recognized in earnings. The amount of the total OTTI related to all other factors is recognized in other comprehensive income. In periods after the recognition of OTTI on the Company’s fixed maturity securities, the Company accounts for such securities as if they had been purchased on the measurement date of the OTTI at an amortized cost basis equal to the previous amortized cost basis less the OTTI recognized in earnings. For fixed maturity securities in which OTTI was recognized in earnings, the difference between the new amortized cost basis and the cash flows expected to be collected will be amortized into net investment income.
As our investment portfolio is the largest component of our consolidated assets, OTTI on our fixed maturity securities could be material to our financial condition and operating results particularly during periods of dislocation in the financial markets.
Fair Value Measurements — ASC Topic 820, "Fair Value Measurements and Disclosures" ("ASC 820") defines fair value as the price that would be received upon the sale of an asset or paid to transfer a liability (i.e. the "exit price") in an orderly transaction between open market participants at the measurement date. Additionally, ASC 820 establishes a hierarchy for inputs used in measuring fair value that maximizes the use of observable inputs and minimizes the use of unobservable inputs by requiring that the most observable inputs be used when available. The hierarchy is broken down into three levels based on the reliability of inputs as follows:
• | Level 1 — Valuations based on unadjusted quoted market prices for identical assets or liabilities that we have the ability to access. Valuation adjustments and block discounts are not applied to Level 1 instruments. Since valuations are based on quoted prices that are readily and regularly available in an active market, valuation of these products does not entail a significant degree of judgment. Examples of assets and liabilities utilizing Level 1 inputs include: exchange-traded equity securities and U.S. Treasury bonds; |
• | Level 2 — Valuations based on quoted prices for similar assets or liabilities in active markets, quoted prices for identical assets or liabilities in inactive markets, or valuations based on models where the significant inputs are observable (e.g. interest rates, yield curves, prepayment speeds, default rates, loss severities, etc.) or can be corroborated by observable market data. Examples of assets and liabilities utilizing Level 2 inputs include: U.S. government-sponsored agency securities; non-U.S. government and supranational obligations; commercial mortgage-backed securities ("CMBS"); collateralized loan obligations ("CLO"); corporate and municipal bonds; and |
F-9
MAIDEN HOLDINGS, LTD.
NOTES TO CONSOLIDATED FINANCIAL STATEMENTS
(In thousands of U.S. dollars, except share and per share data)
NOTES TO CONSOLIDATED FINANCIAL STATEMENTS
(In thousands of U.S. dollars, except share and per share data)
2. Significant Accounting Policies (continued)
• | Level 3 — Valuations based on models where significant inputs are not observable. The unobservable inputs reflect our own assumptions about assumptions that market participants would use. Examples of assets and liabilities utilizing Level 3 inputs include: insurance and reinsurance derivative contracts; and hedge and credit funds with partial transparency. |
The availability of observable inputs can vary from financial instrument to financial instrument and is affected by a wide variety of factors, including, for example, the type of financial instrument, whether the financial instrument is new and not yet established in the marketplace, and other characteristics particular to the transaction. To the extent that valuation is based on models or inputs that are less observable or unobservable in the market, the determination of fair value requires significantly more judgment. Accordingly, the degree of judgment exercised by management in determining fair value is greatest for instruments categorized in Level 3. We use prices and inputs that are current at the measurement date. In periods of market dislocation, the observability of prices and inputs may be reduced for many instruments. This condition could cause an instrument to be reclassified between levels.
For investments that have quoted market prices in active markets, the Company uses the quoted market prices as fair value and includes these prices in the amounts disclosed in the Level 1 hierarchy. The Company receives the quoted market prices from the Pricing Service. When quoted market prices are unavailable, the Company utilizes the Pricing Service to determine an estimate of fair value. The fair value estimates are included in the Level 2 hierarchy. The Company will challenge any prices for its investments which are considered not to be representation of fair value. If quoted market prices and an estimate from the Pricing Service are unavailable, the Company produces an estimate of fair value based on dealer quotations for recent activity in positions with the same or similar characteristics to that being valued or through consensus pricing of a pricing service. The Company determines whether the fair value estimate is in the Level 2 or Level 3 hierarchy depending on the level of observable inputs available when estimating the fair value. The Company bases its estimates of fair values for assets on the bid price as it represents what a third party market participant would be willing to pay in an orderly transaction.
Cash and Cash Equivalents — The Company maintains its cash accounts in several banks and brokerage institutions. Cash equivalents consist of investments in money market funds and short-term investments with an original maturity of 90 days or less and are stated at cost, which approximates fair value. Restricted cash and cash equivalents are separately reported in the Consolidated Balance Sheets. Accordingly, changes in restricted cash and cash equivalents are reported as an investing activity in our Consolidated Statements of Cash Flows. The Company maintains certain cash and investments in trust accounts to be used primarily as collateral for unearned premiums and loss and loss adjustment expenses reserves owed to insureds. The Company is required to maintain minimum balances in these accounts based on pre-determined formulas. See "Note 4. (e) Investments" for additional details.
Premiums and Related Expenses — For pro-rata contracts and excess-of-loss contracts where no deposit or minimum premium is specified in the contract, written premium is recognized based on estimates of ultimate premiums provided by the ceding companies. Initial estimates of written premium are recognized in the period in which the underlying risks are incepted. Subsequent adjustments, based on reports of actual premium by the ceding companies, or revisions in estimates, are recorded in the period in which they are determined. Reinsurance premiums assumed are generally earned on a pro-rata basis over the terms of the underlying policies or reinsurance contracts. Contracts and policies written on a "losses occurring" basis cover claims that may occur during the term of the contract or policy, which is typically 12 months. Accordingly, the premium is earned evenly over the term. Contracts which are written on a "risks attaching" basis cover claims which attach to the underlying insurance policies written during the terms of such contracts. Premiums earned on such contracts usually extend beyond the original term of the reinsurance contract, typically resulting in recognition of premiums earned over a 24-month period. Reinsurance premiums on specialty risk and extended warranty are earned based on the estimated program coverage period. These estimates are based on the expected distribution of coverage periods by contract at inception, because a single contract may contain multiple coverage period options, and these estimates are revised based on the actual coverage period selected by the original insured. Unearned premiums represent the portion of premiums written which is applicable to the unexpired term of the contract or policy in force. These premiums can be subject to estimates based upon information received from ceding companies and any subsequent differences arising on such estimates are recorded in the period in which they are determined.
The unexpired portion of reinsurance purchased by the Company (retrocession or reinsurance premiums ceded) is included in other assets and amortized over the contract period in proportion to the amount of insurance protection provided. The ultimate amount of premiums, including adjustments, is recognized as premiums ceded, and amortized over the applicable contract period to which they apply. Losses recoverable are recorded as an asset called reinsurance recoverable on unpaid losses. Premiums earned are reported net of reinsurance in the Consolidated Statements of Income.
F-10
MAIDEN HOLDINGS, LTD.
NOTES TO CONSOLIDATED FINANCIAL STATEMENTS
(In thousands of U.S. dollars, except share and per share data)
NOTES TO CONSOLIDATED FINANCIAL STATEMENTS
(In thousands of U.S. dollars, except share and per share data)
2. Significant Accounting Policies (continued)
Assumed and ceded reinsurance contracts that lack a significant transfer of risk are treated as deposits.
Acquisition expenses represent the costs of writing business that vary with, and are primarily related to, the production of the business. Policy and contract acquisition expenses, including assumed commissions and other direct operating expenses that are related to successful contracts are deferred and recognized as expense as related premiums are earned.
Only certain expenses incurred in the successful acquisition of new and renewal insurance contracts are capitalized. Those expenses include incremental direct costs of contract acquisition that result directly from and are essential to the contract transaction and would not have been incurred had the contract transaction not occurred. All other acquisition-related expenses, such as costs incurred for soliciting business, administration, and unsuccessful acquisition or renewal efforts are charged to expense as incurred. Administrative expenses, including rent, depreciation, occupancy, equipment, and all other general overhead expenses are considered indirect and are expensed as incurred.
The Company considers anticipated investment income in determining the recoverability of these costs and believes they are fully recoverable. A premium deficiency is recognized if the sum of anticipated losses and loss adjustment expenses, unamortized acquisition expenses and anticipated investment income exceed unearned premium.
Loss and Loss Adjustment Expenses Incurred — Loss and loss adjustment expenses ("LAE") represent the estimated ultimate net costs of all reported and unreported losses incurred through December 31. The reserve for loss and LAE is estimated using individual case-basis valuations and statistical analysis and is not discounted. Although considerable variability is inherent in the estimates of reserves for loss and LAE, management believes that the reserve for loss and LAE is adequate. In estimating reserves, the Company utilizes a variety of standard actuarial methods. The estimates are continually reviewed and adjusted as necessary as experience develops or new information becomes known. Such adjustments are included in current operations.
Reinsurance — Reinsurance premiums, losses and LAE ceded to other companies are accounted for on a basis consistent with those used in accounting for original policies issued and pursuant to the terms of the reinsurance contracts. The Company records premiums earned and losses and LAE incurred and ceded to other companies as reduction of premium revenue and losses and LAE. The Company accounts for commissions allowed by reinsurers on business ceded as ceding commission, which is a reduction of acquisition costs and other underwriting expenses. The Company earns commissions on reinsurance premiums ceded in a manner consistent with the recognition of the earned premium on the underlying insurance policies, on a pro-rata basis over the terms of the policies reinsured. Reinsurance recoverable relate to the portion of reserves and paid losses and LAE that are ceded to other companies. The Company remains contingently liable for all loss payments in the event of failure to collect from reinsurers.
Ceding Commissions on Reinsurance Transactions — Ceding commissions on reinsurance transactions are commissions the Company receives from ceding gross written premiums to third party reinsurers. The ceding commissions the Company receives cover a portion of its capitalized acquisition costs and a portion of other underwriting expenses. Ceding commissions received from reinsurance transactions that represent recovery of capitalized direct acquisition costs are recorded as a reduction of deferred acquisition costs and the net amount is charged to expense in proportion to net premium revenue recognized. Ceding commissions received from reinsurance transactions that represent the recovery of other underwriting expenses are recognized in the income statement over the insurance contract period in proportion to the insurance protection provided and classified as a reduction of acquisition costs and other underwriting expenses. Ceding commissions received, but not yet earned, that represent the recovery of other underwriting expenses are classified as a component of accrued expenses and other current liabilities. The Company allocates earned ceding commissions to its segments based on each segment’s proportionate share of total acquisition costs and other underwriting expenses recognized during the period.
Debt Obligations and Deferred Debt Issuance Costs — Costs incurred in issuing debt are capitalized and amortized over the life of the debt. The amortization of these costs is included in interest and amortization expenses in the Consolidated Statements of Income.
Business Combinations, Goodwill and Intangible Assets — A purchase price that is in excess of the fair value of the net assets acquired arising from a business combination is recorded as goodwill, and is not amortized. Other intangible assets with a finite life are amortized over the estimated useful life of the asset. Other intangible assets with an indefinite useful life are not amortized.
Goodwill and other indefinite life intangible assets are tested for impairment on an annual basis or more frequently if events or changes in circumstances indicate that the carrying amount may not be recoverable. Definite life intangible assets are reviewed for indicators of impairment on an annual basis or more frequently if events or changes in circumstances indicate that the carrying amount may not be recoverable, and tested for impairment if appropriate. For purposes of the annual impairment evaluation, goodwill is assigned to the applicable reporting unit of the acquired entities giving rise to the goodwill.
The Company has established October 1 as the date for performing its annual impairment tests. If goodwill or other intangible assets are impaired, they are written down to their estimated fair values with a corresponding loss reflected in the Company’s Consolidated Statements of Income.
F-11
MAIDEN HOLDINGS, LTD.
NOTES TO CONSOLIDATED FINANCIAL STATEMENTS
(In thousands of U.S. dollars, except share and per share data)
NOTES TO CONSOLIDATED FINANCIAL STATEMENTS
(In thousands of U.S. dollars, except share and per share data)
2. Significant Accounting Policies (continued)
Noncontrolling Interests — The Company accounts for its noncontrolling interests in accordance with ASC Topic 810 "Consolidations", and presents such noncontrolling shareholders' interest in the equity section of the Company’s Consolidated Balance Sheets. Net income (loss) attributable to noncontrolling interests is presented separately in the Company’s Consolidated Statements of Income.
Income Taxes — The Company accounts for income taxes using ASC Topic 740 "Income Taxes" for its subsidiaries operating in taxable jurisdictions. Deferred income taxes reflect the expected future tax consequences of temporary differences between the carrying amounts of assets and liabilities for financial reporting purposes and amounts used for income tax purposes. A valuation allowance is recorded if it is more likely than not that some or all of a deferred tax asset may not be realized. The Company considers future taxable income and feasible tax planning strategies in assessing the need for a valuation allowance. In the event the Company determines that it will not be able to realize all or part of its deferred income tax assets in the future, an adjustment to the deferred income tax assets would be charged to income in the period in which such determination is made. In addition, if the Company subsequently assesses that the valuation allowance is no longer needed, a benefit would be recorded to income in the period in which such determination is made. U.S. GAAP allows for the recognition of tax benefits of uncertain tax positions only where the position is more likely than not to be sustained assuming examination by tax authorities. A liability is established for any tax benefit claimed in a tax return in excess of this threshold. Income tax related interest and penalties would be included as income tax expense. The Company has not recorded or accrued any interest or penalties during the years ended December 31, 2015, 2014 and 2013.
Share-Based Compensation Expense — The Company is authorized to issue restricted share awards and units, performance based restricted share units ("PB-RSUs"), share options and other equity-based awards to its employees and directors. The Company recognizes the compensation expense for share options, restricted share and share unit grants, based on the fair value of the award on the date of grant, over the vesting period, which is the requisite service period. The estimated fair value of the grant will be amortized ratably over its vesting period as a charge to compensation expense (a component of general and administrative expenses) and an increase to additional paid in capital in Shareholders’ Equity.
The estimated fair value of the PB-RSUs is recognized as a charge to compensation expense and an increase to additional paid in capital in Shareholders’ Equity following certain criteria such as operating return on common equity, underwriting performance, revenue growth and operating expense being met during the specified performance period as well as based on the recommendation of the Company's Chief Executive Officer ("CEO") and the discretion of the Compensation Committee of the Board of Directors.
Earnings Per Share — Basic earnings per share are computed based on the weighted-average number of common shares outstanding and exclude any dilutive effects of options and restricted share units ("RSUs"). Dilutive earnings per share are computed using the weighted-average number of common shares outstanding during the period adjusted for the dilutive impact of share options, RSUs, PB-RSUs and the mandatory convertible preference shares using the if-converted method.
The two-class method is used to determine earnings per share based on dividends declared on common shares and participating securities (i.e. distributed earnings) and participation rights of participating securities in any undistributed earnings. Each unvested restricted share granted by the Company to certain senior leaders is considered a participating security and the Company uses the two-class method to calculate its net income (loss) attributable to Maiden common shareholders per common share – basic and diluted.
Treasury Shares — Treasury shares are common shares repurchased by the Company and not subsequently cancelled. These shares are recorded at cost and result in a reduction of our shareholders’ equity in the Consolidated Balance Sheets.
Foreign Currency Transactions — The functional currency of the Company and many of its subsidiaries is the U.S. dollar. For these companies, we translate monetary assets and liabilities denominated in foreign currencies at year-end exchange rates, with the resulting foreign exchange gains and losses recognized in the Consolidated Statements of Income. Revenues and expenses in foreign currencies are converted at average exchange rates during the year. Monetary assets and liabilities include investments, cash and cash equivalents, reinsurance balances receivable, reserve for loss and LAE and accrued expenses and other liabilities. Accounts that are classified as non-monetary, such as deferred commission and other acquisition expenses and unearned premiums, are not revalued.
Assets and liabilities of subsidiaries and divisions, whose functional currency is not the U.S. dollar, are translated at year-end exchange rates. Revenues and expenses of these entities are translated at average exchange rates during the year. The effects of the translation adjustments for foreign entities are included in AOCI. The amount of cumulative translation adjustment at December 31, 2015 was $30,345 (2014 - $16,714).
F-12
MAIDEN HOLDINGS, LTD.
NOTES TO CONSOLIDATED FINANCIAL STATEMENTS
(In thousands of U.S. dollars, except share and per share data)
NOTES TO CONSOLIDATED FINANCIAL STATEMENTS
(In thousands of U.S. dollars, except share and per share data)
2. Significant Accounting Policies (continued)
Recently Adopted Accounting Standards Updates
Reporting Discontinued Operations and Disclosures of Disposals of Components of an Entity
On April 10, 2014, the FASB issued ASU 2014-08, which amends the definition of a discontinued operation in ASC 205-20 and requires entities to provide additional disclosures about disposal transactions that both meet and do not meet the discontinued-operations criteria. Under the previous guidance, the results of operations of a component of an entity were classified as a discontinued operation if all of the following conditions were met:
• | The component has been disposed of or is classified as held for sale; |
• | The operations and cash flows of the component have been (or will be) eliminated from the ongoing operations of the entity as a result of the disposal transaction; and |
• | The entity will not have any significant continuing involvement in the operations of the component after the disposal transaction. |
The revised guidance changes how entities identify disposal transactions under U.S. GAAP by eliminating the second and third criteria above for classifying operations as discontinued. The new guidance instead requires classification of a component or group of components as discontinued operations if it represents a strategic shift that has or will have a major impact on an entity’s operations or financial results.
The amendments in this ASU are effective prospectively to all disposals (or classifications as held for sale) that occur in annual periods (and interim periods therein) beginning on or after December 15, 2014. Early adoption is permitted. Entities are prohibited from applying the new ASU to any component that is classified as held for sale before the adoption date. The adoption of this guidance did not have an impact on our results of operations, financial condition or liquidity.
Accounting for Share-Based Payments When the Terms of an Award Provide That a Performance Target Could Be Achieved after the Requisite Service Period
On June 19, 2014, FASB issued ASU 2014-12 to clarify how entities should treat performance targets that can be met after the requisite service period of a share-based payment award. The ASU states that the share-based payment award should be treated as a performance condition that affects vesting and therefore, an entity would not record compensation expense (measured as of the grant date without taking into account the effect of the performance target) related to an award for which transfer to the employee is contingent on the entity’s satisfaction of a performance target until it becomes probable that the performance target will be met. No new disclosures are required under the ASU.
ASU 2014-12 is effective for annual reporting periods (including interim reporting periods within those periods) beginning after December 15, 2015. Early adoption is permitted. In addition, all entities will have the option of applying the guidance either prospectively (i.e. only to awards granted or modified on or after the effective date of the issue) or retrospectively. Retrospective application would only apply to awards with performance targets outstanding at or after the beginning of the first annual period presented (i.e. the earliest presented comparative period). The adoption of this guidance did not have an impact on our results of operations, financial condition or liquidity.
Recently Issued Accounting Standards Not Yet Adopted
Simplifying the Presentation of Debt Issuance Costs
In April 2015, the FASB issued ASU 2015-03 which changes the presentation of debt issuance costs in financial statements. Under this new guidance, the Company will be required to present such cost in the balance sheet as a direct deduction from the related debt liability rather than as an asset. The amortization of such costs shall be reported as an interest expense. For public business entities, this guidance will be effective for fiscal years, and interim periods within those fiscal years, beginning December 15, 2015. Early adoption is permitted. The adoption of this guidance is not expected to have a material impact on our results of operations, financial condition or liquidity.
F-13
MAIDEN HOLDINGS, LTD.
NOTES TO CONSOLIDATED FINANCIAL STATEMENTS
(In thousands of U.S. dollars, except share and per share data)
NOTES TO CONSOLIDATED FINANCIAL STATEMENTS
(In thousands of U.S. dollars, except share and per share data)
2. Significant Accounting Policies (continued)
Disclosures about Short-Duration Contracts
In May 2015, the FASB issued ASU 2015-09 which is aimed at providing users of financial statements with more transparent information about an insurance entity’s initial claim estimates and subsequent adjustments to those estimates, methodologies and judgments in estimating claims, and the timing, frequency and severity of claims. The new disclosures are required for short-duration insurance contracts issued by insurers. For public business entities, this guidance will be effective for annual periods beginning after December 15, 2015, and interim periods within annual periods beginning after December 15, 2016. Early adoption is permitted and should be applied retrospectively by providing comparative disclosures for each period presented. As this guidance is disclosure-related only, the adoption of this guidance is not expected to have a material impact on the Company’s statements of operations and financial position.
Disclosures for Investments in Certain Entities That Calculate Net Asset Value per Share (or Its Equivalent)
In May 2015, the FASB issued ASU No. 2015-07 which removes the requirement to categorize all investments for which fair value is measured using the net asset value per share practical expedient within the fair value hierarchy. ASU 2015-07 also removes the requirement to make certain disclosures for investments that are eligible to be measured at fair value using the net asset value per share practical expedient, unless the entity has elected to measure the fair value using that practical expedient. For public business entities, this guidance will be effective for fiscal years beginning after December 15, 2015, and interim periods within those fiscal years. A reporting entity should apply the amendments retrospectively to all periods presented. Earlier application is permitted. As this guidance is disclosure-related only, the adoption of this guidance is not expected to have a material impact on the Company’s statements of operations and financial position.
Recognition and Measurement of Financial Assets and Financial Liabilities
In January 2016, the FASB issued ASU 2016-01 that will change how entities measure certain equity investments and present changes in the fair value of financial liabilities measured under the fair value option that are attributable to their own credit. The new guidance also changes certain disclosure requirements and other aspects of current U.S. GAAP. It does not change the guidance for classifying and measuring investments in debt securities and loans. Under the new guidance, entities will have to measure many equity investments at fair value and recognize any changes in fair value in net income unless the investments qualify for the new practicability exception. This includes investments in partnerships, unincorporated joint ventures and limited liability companies that do not result in consolidation and are not accounted for under the equity method. Entities will no longer be able to recognize unrealized holding gains and losses on equity securities they classify today as AFS in AOCI. They also will no longer be able to use the cost method of accounting for equity securities that do not have readily determinable fair values. The guidance is effective for annual periods beginning after December 15, 2017, including interim periods within those fiscal years. The Company is evaluating the impact of this new guidance on its consolidated results of operations and financial condition.
Accounting for Leases
In February 2016, the FASB issued final ASC 842 guidance that requires lessees to put most leases on their balance sheets but recognize expenses on their income statement in a manner similar to today's accounting. The guidance also eliminates today's real-estate-specific provisions for all entities. All entities classify leases to determine how to recognize lease-related revenue and expense. The U.S. GAAP standard is effective for public business entities and certain not-for-profit entities and employee benefit plans for annual periods beginning after December 15, 2018, and interim periods within those years. Early adoption is permitted for all entities. The Company is evaluating the impact of this new guidance on its consolidated results of operations and financial condition.
F-14
MAIDEN HOLDINGS, LTD.
NOTES TO CONSOLIDATED FINANCIAL STATEMENTS
(In thousands of U.S. dollars, except share and per share data)
NOTES TO CONSOLIDATED FINANCIAL STATEMENTS
(In thousands of U.S. dollars, except share and per share data)
3. Segment Information
The Company currently has two reportable segments: Diversified Reinsurance and AmTrust Reinsurance. Our Diversified Reinsurance segment consists of a portfolio of predominantly property and casualty reinsurance business focusing on regional and specialty property and casualty insurance companies located, primarily in the U.S. and Europe. Our AmTrust Reinsurance segment includes all business ceded to Maiden Bermuda from AmTrust, primarily the AmTrust Quota Share and the European Hospital Liability Quota Share. In addition to our reportable segments, the results of operations of the former NGHC Quota Share segment and the remnants of the U.S. excess and surplus business have been included in the "Other" category.
The Company evaluates segment performance based on segment profit separately from the results of our investment portfolio. General and administrative expenses are allocated to the segments on an actual basis except salaries and benefits where management’s judgment is applied. The Company does not allocate general corporate expenses to the segments. In determining total assets by reportable segment, the Company identifies those assets that are attributable to a particular segment such as reinsurance balances receivable, reinsurance recoverable on unpaid losses, deferred commission and other acquisition expenses, loans, goodwill and intangible assets, restricted cash and cash equivalents and investments and prepaid reinsurance premiums. All remaining assets are allocated to Corporate.
The following tables summarize our reporting segment's underwriting results and the reconciliation of our reportable segments and Other category's underwriting results to our consolidated net income:
For the Year Ended December 31, 2015 | Diversified Reinsurance | AmTrust Reinsurance | Other | Total | ||||||||||||
Gross premiums written | $ | 776,852 | $ | 1,885,974 | $ | (1 | ) | $ | 2,662,825 | |||||||
Net premiums written | $ | 734,781 | $ | 1,779,334 | $ | 1 | $ | 2,514,116 | ||||||||
Net premiums earned | $ | 744,875 | $ | 1,684,191 | $ | 3 | $ | 2,429,069 | ||||||||
Other insurance revenue | 11,512 | — | — | 11,512 | ||||||||||||
Net loss and loss adjustment expenses | (547,296 | ) | (1,074,072 | ) | (12,202 | ) | (1,633,570 | ) | ||||||||
Commission and other acquisition expenses | (196,292 | ) | (527,863 | ) | (42 | ) | (724,197 | ) | ||||||||
General and administrative expenses | (37,550 | ) | (2,947 | ) | — | (40,497 | ) | |||||||||
Underwriting (loss) income | $ | (24,751 | ) | $ | 79,309 | $ | (12,241 | ) | 42,317 | |||||||
Reconciliation to net income | ||||||||||||||||
Net investment income and realized gains on investment | 133,590 | |||||||||||||||
Net impairment losses recognized in earnings | (1,060 | ) | ||||||||||||||
Interest and amortization expenses | (29,063 | ) | ||||||||||||||
Amortization of intangible assets | (2,840 | ) | ||||||||||||||
Foreign exchange and other gains | 7,753 | |||||||||||||||
Other general and administrative expenses | (24,375 | ) | ||||||||||||||
Income tax expense | (2,038 | ) | ||||||||||||||
Net income | $ | 124,284 | ||||||||||||||
Net loss and LAE ratio (1) | 72.3 | % | 63.8 | % | 66.9 | % | ||||||||||
Commission and other acquisition expense ratio (2) | 26.0 | % | 31.3 | % | 29.7 | % | ||||||||||
General and administrative expense ratio (3) | 5.0 | % | 0.2 | % | 2.7 | % | ||||||||||
Combined ratio (4) | 103.3 | % | 95.3 | % | 99.3 | % | ||||||||||
F-15
MAIDEN HOLDINGS, LTD.
NOTES TO CONSOLIDATED FINANCIAL STATEMENTS
(In thousands of U.S. dollars, except share and per share data)
NOTES TO CONSOLIDATED FINANCIAL STATEMENTS
(In thousands of U.S. dollars, except share and per share data)
3. Segment Information (continued)
For the Year Ended December 31, 2014 | Diversified Reinsurance | AmTrust Reinsurance | Other | Total | ||||||||||||
Gross premiums written | $ | 897,748 | $ | 1,610,485 | $ | (881 | ) | $ | 2,507,352 | |||||||
Net premiums written | $ | 850,049 | $ | 1,610,485 | $ | (2,398 | ) | $ | 2,458,136 | |||||||
Net premiums earned | $ | 854,026 | $ | 1,378,327 | $ | 19,390 | $ | 2,251,743 | ||||||||
Other insurance revenue | 13,410 | — | — | 13,410 | ||||||||||||
Net loss and loss adjustment expenses | (579,771 | ) | (893,502 | ) | (24,998 | ) | (1,498,271 | ) | ||||||||
Commission and other acquisition expenses | (233,711 | ) | (418,908 | ) | (6,696 | ) | (659,315 | ) | ||||||||
General and administrative expenses | (38,858 | ) | (2,533 | ) | (757 | ) | (42,148 | ) | ||||||||
Underwriting income (loss) | $ | 15,096 | $ | 63,384 | $ | (13,061 | ) | 65,419 | ||||||||
Reconciliation to net income | ||||||||||||||||
Net investment income and realized gains on investment | 118,378 | |||||||||||||||
Net impairment losses recognized in earnings | (2,364 | ) | ||||||||||||||
Interest and amortization expenses | (29,959 | ) | ||||||||||||||
Accelerated amortization of junior subordinated debt discount and issuance cost | (28,240 | ) | ||||||||||||||
Amortization of intangible assets | (3,277 | ) | ||||||||||||||
Foreign exchange and other gains | 4,150 | |||||||||||||||
Other general and administrative expenses | (20,410 | ) | ||||||||||||||
Income tax expense | (2,164 | ) | ||||||||||||||
Net income | $ | 101,533 | ||||||||||||||
Net loss and LAE ratio (1) | 66.8 | % | 64.8 | % | 66.1 | % | ||||||||||
Commission and other acquisition expense ratio (2) | 26.9 | % | 30.4 | % | 29.1 | % | ||||||||||
General and administrative expense ratio (3) | 4.6 | % | 0.2 | % | 2.8 | % | ||||||||||
Combined ratio (4) | 98.3 | % | 95.4 | % | 98.0 | % | ||||||||||
F-16
MAIDEN HOLDINGS, LTD.
NOTES TO CONSOLIDATED FINANCIAL STATEMENTS
(In thousands of U.S. dollars, except share and per share data)
NOTES TO CONSOLIDATED FINANCIAL STATEMENTS
(In thousands of U.S. dollars, except share and per share data)
3. Segment Information (continued)
For the Year Ended December 31, 2013 | Diversified Reinsurance | AmTrust Reinsurance | Other | Total | ||||||||||||
Gross premiums written | $ | 848,790 | $ | 1,169,961 | $ | 185,408 | $ | 2,204,159 | ||||||||
Net premiums written | $ | 763,374 | $ | 1,169,961 | $ | 162,966 | $ | 2,096,301 | ||||||||
Net premiums earned | $ | 753,157 | $ | 988,900 | $ | 258,830 | $ | 2,000,887 | ||||||||
Other insurance revenue | 14,232 | — | — | 14,232 | ||||||||||||
Net loss and loss adjustment expenses | (519,962 | ) | (653,528 | ) | (176,140 | ) | (1,349,630 | ) | ||||||||
Commission and other acquisition expenses | (190,604 | ) | (291,559 | ) | (74,415 | ) | (556,578 | ) | ||||||||
General and administrative expenses | (37,649 | ) | (1,566 | ) | (707 | ) | (39,922 | ) | ||||||||
Underwriting income | $ | 19,174 | $ | 42,247 | $ | 7,568 | 68,989 | |||||||||
Reconciliation to net income | ||||||||||||||||
Net investment income and realized gains on investment | 94,937 | |||||||||||||||
Interest and amortization expenses | (39,805 | ) | ||||||||||||||
Amortization of intangible assets | (3,780 | ) | ||||||||||||||
Foreign exchange and other gains | 2,809 | |||||||||||||||
Other general and administrative expenses | (18,431 | ) | ||||||||||||||
Income tax expense | (1,863 | ) | ||||||||||||||
Net income | $ | 102,856 | ||||||||||||||
Net loss and LAE ratio (1) | 67.8 | % | 66.1 | % | 67.0 | % | ||||||||||
Commission and other acquisition expense ratio (2) | 24.8 | % | 29.5 | % | 27.6 | % | ||||||||||
General and administrative expense ratio (3) | 4.9 | % | 0.2 | % | 2.9 | % | ||||||||||
Combined ratio (4) | 97.5 | % | 95.8 | % | 97.5 | % | ||||||||||
(1) | Calculated by dividing net loss and LAE by the sum of net premiums earned and other insurance revenue. |
(2) | Calculated by dividing commission and other acquisition expenses by the sum of net premiums earned and other insurance revenue. |
(3) | Calculated by dividing general and administrative expenses by the sum of net premiums earned and other insurance revenue. |
(4) | Calculated by adding together net loss and LAE ratio, commission and other acquisition expense ratio and general and administrative expense ratio. |
F-17
MAIDEN HOLDINGS, LTD.
NOTES TO CONSOLIDATED FINANCIAL STATEMENTS
(In thousands of U.S. dollars, except share and per share data)
NOTES TO CONSOLIDATED FINANCIAL STATEMENTS
(In thousands of U.S. dollars, except share and per share data)
3. Segment Information (continued)
The following tables summarize the financial position of our reportable segments including the reconciliation to our consolidated assets at December 31, 2015 and 2014:
December 31, 2015 | Diversified Reinsurance | AmTrust Reinsurance | Total | |||||||||
Reinsurance balances receivable, net | $ | 230,223 | $ | 137,586 | $ | 367,809 | ||||||
Reinsurance recoverable on unpaid losses | 38,390 | 14,230 | 52,620 | |||||||||
Deferred commission and other acquisition expenses | 80,012 | 317,536 | 397,548 | |||||||||
Loan to related party | — | 167,975 | 167,975 | |||||||||
Goodwill and intangible assets, net | 81,920 | — | 81,920 | |||||||||
Restricted cash and cash equivalents and investments | 1,178,076 | 2,468,689 | 3,646,765 | |||||||||
Other assets | 35,920 | 72,843 | 108,763 | |||||||||
Total assets - reportable segments | 1,644,541 | 3,178,859 | 4,823,400 | |||||||||
Corporate assets | — | — | 890,245 | |||||||||
Total Assets | $ | 1,644,541 | $ | 3,178,859 | $ | 5,713,645 | ||||||
December 31, 2014 | Diversified Reinsurance | AmTrust Reinsurance | Total | |||||||||
Reinsurance balances receivable, net | $ | 245,782 | $ | 256,779 | $ | 502,561 | ||||||
Reinsurance recoverable on unpaid losses | 31,272 | — | 31,272 | |||||||||
Deferred commission and other acquisition expenses | 87,289 | 285,232 | 372,521 | |||||||||
Loan to related party | — | 167,975 | 167,975 | |||||||||
Goodwill and intangible assets, net | 87,336 | — | 87,336 | |||||||||
Restricted cash and cash equivalents and investments | 1,132,953 | 1,930,502 | 3,063,455 | |||||||||
Other assets | 40,032 | — | 40,032 | |||||||||
Total assets - reportable segments | 1,624,664 | 2,640,488 | 4,265,152 | |||||||||
Corporate assets | — | — | 898,940 | |||||||||
Total Assets | $ | 1,624,664 | $ | 2,640,488 | $ | 5,164,092 | ||||||
The following table shows an analysis of the Company’s gross and net premiums written and net premiums earned by geographic location for the years ended December 31, 2015, 2014 and 2013. In case of business assumed from AmTrust Financial Services, Inc. ("AmTrust"), it is the location of the relevant AmTrust subsidiaries.
For the Year Ended December 31, | 2015 | 2014 | 2013 | |||||||||
Gross premiums written – North America | $ | 2,165,309 | $ | 1,979,768 | $ | 1,742,333 | ||||||
Gross premiums written – Other (predominantly Europe) | 497,516 | 527,584 | 461,826 | |||||||||
Net premiums written – North America | 2,038,444 | 1,934,644 | 1,638,844 | |||||||||
Net premiums written – Other (predominantly Europe) | 475,672 | 523,492 | 457,457 | |||||||||
Net premiums earned – North America | 2,027,141 | 1,778,579 | 1,602,128 | |||||||||
Net premiums earned – Other (predominantly Europe) | 401,928 | 473,164 | 398,759 | |||||||||
F-18
MAIDEN HOLDINGS, LTD.
NOTES TO CONSOLIDATED FINANCIAL STATEMENTS
(In thousands of U.S. dollars, except share and per share data)
NOTES TO CONSOLIDATED FINANCIAL STATEMENTS
(In thousands of U.S. dollars, except share and per share data)
3. Segment Information (continued)
The following tables set forth financial information relating to net premiums written by major line of business and reportable segment for the years ended December 31, 2015, 2014 and 2013:
For the Year Ended December 31, | 2015 | 2014 | 2013 | ||||||||||||||||||
Total | % of Total | Total | % of Total | Total | % of Total | ||||||||||||||||
Net premiums written | |||||||||||||||||||||
Diversified Reinsurance | |||||||||||||||||||||
Property | $ | 160,939 | 6.4 | % | $ | 160,308 | 6.5 | % | $ | 145,292 | 6.9 | % | |||||||||
Casualty | 435,625 | 17.3 | % | 535,518 | 21.8 | % | 473,732 | 22.6 | % | ||||||||||||
Accident and Health | 64,102 | 2.6 | % | 38,870 | 1.6 | % | 35,340 | 1.7 | % | ||||||||||||
International | 74,115 | 2.9 | % | 115,353 | 4.7 | % | 109,010 | 5.2 | % | ||||||||||||
Total Diversified Reinsurance | 734,781 | 29.2 | % | 850,049 | 34.6 | % | 763,374 | 36.4 | % | ||||||||||||
AmTrust Reinsurance | |||||||||||||||||||||
Small Commercial Business | 1,057,968 | 42.1 | % | 857,576 | 34.9 | % | 572,006 | 27.3 | % | ||||||||||||
Specialty Program | 332,416 | 13.2 | % | 220,121 | 8.9 | % | 157,578 | 7.5 | % | ||||||||||||
Specialty Risk and Extended Warranty | 388,950 | 15.5 | % | 532,788 | 21.7 | % | 440,377 | 21.0 | % | ||||||||||||
Total AmTrust Reinsurance | 1,779,334 | 70.8 | % | 1,610,485 | 65.5 | % | 1,169,961 | 55.8 | % | ||||||||||||
Other | 1 | — | % | (2,398 | ) | (0.1 | )% | 162,966 | 7.8 | % | |||||||||||
$ | 2,514,116 | 100.0 | % | $ | 2,458,136 | 100.0 | % | $ | 2,096,301 | 100.0 | % | ||||||||||
The following tables set forth financial information relating to net premiums earned by major line of business and reportable segment for the years ended December 31, 2015, 2014 and 2013:
For the Year Ended December 31, | 2015 | 2014 | 2013 | ||||||||||||||||||
Total | % of Total | Total | % of Total | Total | % of Total | ||||||||||||||||
Net premiums earned | |||||||||||||||||||||
Diversified Reinsurance | |||||||||||||||||||||
Property | $ | 157,186 | 6.5 | % | $ | 174,785 | 7.7 | % | $ | 150,261 | 7.5 | % | |||||||||
Casualty | 449,000 | 18.5 | % | 533,775 | 23.7 | % | 472,095 | 23.6 | % | ||||||||||||
Accident and Health | 55,672 | 2.3 | % | 39,918 | 1.8 | % | 36,165 | 1.8 | % | ||||||||||||
International | 83,017 | 3.4 | % | 105,548 | 4.7 | % | 94,636 | 4.7 | % | ||||||||||||
Total Diversified Reinsurance | 744,875 | 30.7 | % | 854,026 | 37.9 | % | 753,157 | 37.6 | % | ||||||||||||
AmTrust Reinsurance | |||||||||||||||||||||
Small Commercial Business | 984,333 | 40.5 | % | 752,188 | 33.4 | % | 493,774 | 24.7 | % | ||||||||||||
Specialty Program | 290,209 | 11.9 | % | 175,286 | 7.8 | % | 140,478 | 7.0 | % | ||||||||||||
Specialty Risk and Extended Warranty | 409,649 | 16.9 | % | 450,853 | 20.0 | % | 354,648 | 17.7 | % | ||||||||||||
Total AmTrust Reinsurance | 1,684,191 | 69.3 | % | 1,378,327 | 61.2 | % | 988,900 | 49.4 | % | ||||||||||||
Other | 3 | — | % | 19,390 | 0.9 | % | 258,830 | 13.0 | % | ||||||||||||
$ | 2,429,069 | 100.0 | % | $ | 2,251,743 | 100.0 | % | $ | 2,000,887 | 100.0 | % | ||||||||||
F-19
MAIDEN HOLDINGS, LTD.
NOTES TO CONSOLIDATED FINANCIAL STATEMENTS
(In thousands of U.S. dollars, except share and per share data)
NOTES TO CONSOLIDATED FINANCIAL STATEMENTS
(In thousands of U.S. dollars, except share and per share data)
4. Investments
a) Fixed Maturities and Other Investments
During the third quarter of 2015, we designated fixed maturities with a total fair value of $608,722 as HTM reflecting our intent to hold these securities to maturity. The net unrealized holding gain of $244 at the designation date continues to be reported in the carrying value of the HTM securities and is amortized through Other Comprehensive Income over the remaining life of the securities using the effective interest method in a manner consistent with the amortization of any premium or discount.
The original or amortized cost, estimated fair value and gross unrealized gains and losses of fixed maturities and other investments at December 31, 2015 and 2014, are as follows:
December 31, 2015 | Original or amortized cost | Gross unrealized gains | Gross unrealized losses | Fair value | ||||||||||||
AFS fixed maturities: | ||||||||||||||||
U.S. treasury bonds | $ | 5,714 | $ | 312 | $ | (16 | ) | $ | 6,010 | |||||||
U.S. agency bonds – mortgage-backed | 1,471,782 | 15,399 | (10,190 | ) | 1,476,991 | |||||||||||
U.S. agency bonds – other | 23,734 | 577 | — | 24,311 | ||||||||||||
Non-U.S. government and supranational bonds | 35,128 | — | (4,584 | ) | 30,544 | |||||||||||
Asset-backed securities | 165,719 | 1,174 | (1,089 | ) | 165,804 | |||||||||||
Corporate bonds | 1,798,610 | 38,070 | (97,012 | ) | 1,739,668 | |||||||||||
Municipal bonds | 62,177 | 2,583 | — | 64,760 | ||||||||||||
Total AFS fixed maturities | 3,562,864 | 58,115 | (112,891 | ) | 3,508,088 | |||||||||||
HTM fixed maturities: | ||||||||||||||||
Corporate bonds | 607,843 | 3,458 | (12,326 | ) | 598,975 | |||||||||||
Total HTM fixed maturities | 607,843 | 3,458 | (12,326 | ) | 598,975 | |||||||||||
Other investments | 10,816 | 1,091 | (95 | ) | 11,812 | |||||||||||
Total investments | $ | 4,181,523 | $ | 62,664 | $ | (125,312 | ) | $ | 4,118,875 | |||||||
December 31, 2014 | Original or amortized cost | Gross unrealized gains | Gross unrealized losses | Fair value | ||||||||||||
AFS fixed maturities: | ||||||||||||||||
U.S. treasury bonds | $ | 8,937 | $ | 423 | $ | — | $ | 9,360 | ||||||||
U.S. agency bonds – mortgage-backed | 1,313,834 | 19,197 | (10,588 | ) | 1,322,443 | |||||||||||
U.S. agency bonds – other | 7,213 | 775 | — | 7,988 | ||||||||||||
Non-U.S. government and supranational bonds | 54,467 | 304 | (3,128 | ) | 51,643 | |||||||||||
Asset-backed securities | 52,337 | 2,443 | — | 54,780 | ||||||||||||
Corporate bonds | 1,831,431 | 89,243 | (25,295 | ) | 1,895,379 | |||||||||||
Municipal bonds | 62,153 | 3,666 | — | 65,819 | ||||||||||||
Short term investments | 49,492 | — | — | 49,492 | ||||||||||||
Total AFS fixed maturities | 3,379,864 | 116,051 | (39,011 | ) | 3,456,904 | |||||||||||
Other investments | 10,862 | 1,709 | — | 12,571 | ||||||||||||
Total investments | $ | 3,390,726 | $ | 117,760 | $ | (39,011 | ) | $ | 3,469,475 | |||||||
The contractual maturities of our fixed maturities are shown below. Actual maturities may differ from contractual maturities because borrowers may have the right to call or prepay obligations with or without call or prepayment penalties.
F-20
MAIDEN HOLDINGS, LTD.
NOTES TO CONSOLIDATED FINANCIAL STATEMENTS
(In thousands of U.S. dollars, except share and per share data)
NOTES TO CONSOLIDATED FINANCIAL STATEMENTS
(In thousands of U.S. dollars, except share and per share data)
4. Investments (continued)
AFS fixed maturities | HTM fixed maturities | |||||||||||||||
December 31, 2015 | Amortized cost | Fair value | Amortized cost | Fair value | ||||||||||||
Maturity | ||||||||||||||||
Due in one year or less | $ | 181,769 | $ | 180,407 | $ | — | $ | — | ||||||||
Due after one year through five years | 477,902 | 475,103 | 67,371 | 66,888 | ||||||||||||
Due after five years through ten years | 1,238,535 | 1,180,221 | 540,472 | 532,087 | ||||||||||||
Due after ten years | 27,157 | 29,562 | — | — | ||||||||||||
1,925,363 | 1,865,293 | 607,843 | 598,975 | |||||||||||||
U.S. agency bonds - mortgage-backed | 1,471,782 | 1,476,991 | — | — | ||||||||||||
Asset-backed securities | 165,719 | 165,804 | — | — | ||||||||||||
Total fixed maturities | $ | 3,562,864 | $ | 3,508,088 | $ | 607,843 | $ | 598,975 | ||||||||
The following tables summarize fixed maturities in an unrealized loss position and the aggregate fair value and gross unrealized loss by length of time the security has continuously been in an unrealized loss position:
Less than 12 Months | 12 Months or More | Total | ||||||||||||||||||||||
December 31, 2015 | Fair value | Unrealized losses | Fair value | Unrealized losses | Fair value | Unrealized losses | ||||||||||||||||||
Fixed maturities | ||||||||||||||||||||||||
U.S. treasury bonds | $ | 1,119 | $ | (16 | ) | $ | — | $ | — | $ | 1,119 | $ | (16 | ) | ||||||||||
U.S. agency bonds – mortgage-backed | 443,331 | (4,113 | ) | 170,053 | (6,077 | ) | 613,384 | (10,190 | ) | |||||||||||||||
Non–U.S. government and supranational bonds | 6,958 | (365 | ) | 22,586 | (4,219 | ) | 29,544 | (4,584 | ) | |||||||||||||||
Asset-backed securities | 89,838 | (1,089 | ) | — | — | 89,838 | (1,089 | ) | ||||||||||||||||
Corporate bonds | 752,911 | (41,352 | ) | 399,779 | (67,986 | ) | 1,152,690 | (109,338 | ) | |||||||||||||||
Total temporarily impaired fixed maturities | 1,294,157 | (46,935 | ) | 592,418 | (78,282 | ) | 1,886,575 | (125,217 | ) | |||||||||||||||
Other investments | 4,905 | (95 | ) | — | — | 4,905 | (95 | ) | ||||||||||||||||
Total temporarily impaired fixed maturities and other investments | $ | 1,299,062 | $ | (47,030 | ) | $ | 592,418 | $ | (78,282 | ) | $ | 1,891,480 | $ | (125,312 | ) | |||||||||
At December 31, 2015, there were approximately 270 securities in an unrealized loss position with a fair value of $1,891,480 and unrealized losses of $125,312. Of these securities, there were 93 securities that have been in an unrealized loss position for 12 months or greater with a fair value of $592,418 and unrealized losses of $78,282.
Less than 12 Months | 12 Months or More | Total | ||||||||||||||||||||||
December 31, 2014 | Fair value | Unrealized losses | Fair value | Unrealized losses | Fair value | Unrealized losses | ||||||||||||||||||
Fixed maturities | ||||||||||||||||||||||||
U.S. agency bonds – mortgage-backed | $ | 84,264 | $ | (806 | ) | $ | 441,601 | $ | (9,782 | ) | $ | 525,865 | $ | (10,588 | ) | |||||||||
Non-U.S. government and supranational bonds | 43,712 | (2,822 | ) | 2,522 | (306 | ) | 46,234 | (3,128 | ) | |||||||||||||||
Corporate bonds | 397,173 | (14,485 | ) | 143,894 | (10,810 | ) | 541,067 | (25,295 | ) | |||||||||||||||
Total | $ | 525,149 | $ | (18,113 | ) | $ | 588,017 | $ | (20,898 | ) | $ | 1,113,166 | $ | (39,011 | ) | |||||||||
F-21
MAIDEN HOLDINGS, LTD.
NOTES TO CONSOLIDATED FINANCIAL STATEMENTS
(In thousands of U.S. dollars, except share and per share data)
NOTES TO CONSOLIDATED FINANCIAL STATEMENTS
(In thousands of U.S. dollars, except share and per share data)
4. Investments (continued)
At December 31, 2014, there were approximately 141 securities in an unrealized loss position with a fair value of $1,113,166 and unrealized losses of $39,011. Of these securities, there were 46 securities that have been in an unrealized loss position for 12 months or greater with a fair value of $588,017 and unrealized losses of $20,898.
OTTI
The Company performs quarterly reviews of its fixed maturities in order to determine whether declines in fair value below the amortized cost basis were considered other-than-temporary in accordance with applicable guidance. Based on our qualitative and quantitative OTTI review of each security within our fixed maturity portfolio, during the year ended December 31, 2015, we determined that there was a credit impairment in respect of one corporate bond. The Company does not intend to sell this security, but we do not believe it is probable that we will recover the amortized cost basis of the security. The Company has therefore recognized $1,060 of OTTI through earnings for the year ended December 31, 2015. The Company recognized $2,364 and $0 OTTI for the years ended December 31, 2014 and 2013, respectively.
In respect of the rest of our portfolio, we have determined that the unrealized losses on fixed maturities at December 31, 2015 were primarily due to widening of credit spreads since their date of purchase. Because we do not intend to sell these securities and it is not more likely than not that we will be required to do so until a recovery of fair value to amortized cost, we currently believe it is probable that we will collect all amounts due according to their respective contractual terms. Therefore, we do not consider these fixed maturities to be other-than-temporarily impaired at December 31, 2015.
The following summarizes the credit ratings of our fixed maturities:
Rating* at December 31, 2015 | Amortized cost | Fair value | % of Total fair value | ||||||||
U.S. treasury bonds | $ | 5,714 | $ | 6,010 | 0.1 | % | |||||
U.S. agency bonds | 1,495,516 | 1,501,302 | 36.6 | % | |||||||
AAA | 170,190 | 170,391 | 4.1 | % | |||||||
AA+, AA, AA- | 222,506 | 223,084 | 5.4 | % | |||||||
A+, A, A- | 1,075,550 | 1,066,794 | 26.0 | % | |||||||
BBB+, BBB, BBB- | 1,077,064 | 1,039,228 | 25.3 | % | |||||||
BB+ or lower | 124,167 | 100,254 | 2.5 | % | |||||||
Total | $ | 4,170,707 | $ | 4,107,063 | 100.0 | % | |||||
Rating* at December 31, 2014 | Amortized cost | Fair value | % of Total fair value | ||||||||
U.S. treasury bonds | $ | 8,937 | $ | 9,360 | 0.3 | % | |||||
U.S. agency bonds | 1,321,047 | 1,330,431 | 38.5 | % | |||||||
AAA | 193,280 | 202,973 | 5.9 | % | |||||||
AA+, AA, AA- | 116,936 | 120,679 | 3.5 | % | |||||||
A+, A, A- | 883,092 | 917,544 | 26.5 | % | |||||||
BBB+, BBB, BBB- | 794,244 | 814,039 | 23.5 | % | |||||||
BB+ or lower | 62,328 | 61,878 | 1.8 | % | |||||||
Total | $ | 3,379,864 | $ | 3,456,904 | 100.0 | % | |||||
*Ratings as assigned by Standard & Poor's ("S&P")
F-22
MAIDEN HOLDINGS, LTD.
NOTES TO CONSOLIDATED FINANCIAL STATEMENTS
(In thousands of U.S. dollars, except share and per share data)
NOTES TO CONSOLIDATED FINANCIAL STATEMENTS
(In thousands of U.S. dollars, except share and per share data)
4. Investments (continued)
b) Other Investments
The table below shows our portfolio of other investments:
December 31, | 2015 | 2014 | ||||||||||||
Fair value | % of Total fair value | Fair value | % of Total fair value | |||||||||||
Investment in limited partnerships | $ | 5,907 | 50.0 | % | $ | 5,581 | 44.4 | % | ||||||
Investment in quoted equity | 4,905 | 41.5 | % | 5,990 | 47.6 | % | ||||||||
Other | 1,000 | 8.5 | % | 1,000 | 8.0 | % | ||||||||
Total other investments | $ | 11,812 | 100.0 | % | $ | 12,571 | 100.0 | % | ||||||
The Company has a remaining unfunded commitment on its investment in limited partnerships of approximately $622 at December 31, 2015.
c) Net Investment Income
Net investment income was derived from the following sources:
For the Year Ended December 31, | 2015 | 2014 | 2013 | |||||||||
Fixed maturities | $ | 132,394 | $ | 118,203 | $ | 89,350 | ||||||
Cash and cash equivalents | 2,578 | 2,224 | 3,120 | |||||||||
Loan to related party | 1,865 | 1,797 | 1,857 | |||||||||
Other | 312 | 246 | 1,452 | |||||||||
137,149 | 122,470 | 95,779 | ||||||||||
Less: Investment expenses | (6,057 | ) | (5,255 | ) | (4,427 | ) | ||||||
Total | $ | 131,092 | $ | 117,215 | $ | 91,352 | ||||||
d) Realized Gains (Losses) on Investment
Realized gains or losses on the sale of investments are determined on the basis of the first in first out cost method. The following provides an analysis of net realized gains on investment included in the Consolidated Statements of Income:
For the Year Ended December 31, 2015 | Gross gains | Gross losses | Net | |||||||||
AFS fixed maturities | $ | 2,849 | $ | (543 | ) | $ | 2,306 | |||||
Other investments | 192 | — | 192 | |||||||||
Net realized gains on investment | $ | 3,041 | $ | (543 | ) | $ | 2,498 | |||||
For the Year Ended December 31, 2014 | Gross gains | Gross losses | Net | |||||||||
AFS fixed maturities | $ | 1,334 | $ | (610 | ) | $ | 724 | |||||
Other investments | 439 | — | 439 | |||||||||
Net realized gains on investment | $ | 1,773 | $ | (610 | ) | $ | 1,163 | |||||
F-23
MAIDEN HOLDINGS, LTD.
NOTES TO CONSOLIDATED FINANCIAL STATEMENTS
(In thousands of U.S. dollars, except share and per share data)
NOTES TO CONSOLIDATED FINANCIAL STATEMENTS
(In thousands of U.S. dollars, except share and per share data)
4. Investments (continued)
For the Year Ended December 31, 2013 | Gross gains | Gross losses | Net | |||||||||
AFS fixed maturities | $ | 5,598 | $ | (2,201 | ) | $ | 3,397 | |||||
Other investments | 188 | — | 188 | |||||||||
Net realized gains on investment | $ | 5,786 | $ | (2,201 | ) | $ | 3,585 | |||||
Proceeds from sales of fixed maturities classified as AFS were $129,152, $171,216 and $355,863, for the years ended December 31, 2015, 2014 and 2013, respectively.
Net unrealized (losses) gains were as follows:
December 31, | 2015 | 2014 | 2013 | |||||||||
Fixed maturities | $ | (55,024 | ) | $ | 77,040 | $ | 34,275 | |||||
Other investments | 996 | 1,709 | 570 | |||||||||
Total net unrealized (losses) gains | (54,028 | ) | 78,749 | 34,845 | ||||||||
Deferred income tax | (84 | ) | (170 | ) | (117 | ) | ||||||
Net unrealized (losses) gains, net of deferred income tax | $ | (54,112 | ) | $ | 78,579 | $ | 34,728 | |||||
Change, net of deferred income tax | $ | (132,691 | ) | $ | 43,851 | $ | (108,937 | ) | ||||
e) Restricted Cash and Cash Equivalents and Investments
We are required to maintain assets on deposit to support our reinsurance operations and to serve as collateral for our reinsurance liabilities under various reinsurance agreements. The assets on deposit are available to settle reinsurance liabilities. We also utilize trust accounts to collateralize business with our reinsurance counterparties. These trust accounts generally take the place of letter of credit requirements.
The assets in trust as collateral are primarily cash and highly rated fixed maturities. The fair value of our restricted assets was as follows:
December 31, | 2015 | 2014 | ||||||
Restricted cash and cash equivalents – third party agreements | $ | 102,837 | $ | 107,884 | ||||
Restricted cash and cash equivalents – related party agreements | 139,944 | 175,817 | ||||||
Restricted cash and cash equivalents – U.S. state regulatory authorities | 78 | 680 | ||||||
Total restricted cash and cash equivalents | 242,859 | 284,381 | ||||||
Restricted investments AFS – in trust for third party agreements at fair value (Amortized cost: 2015 – $1,081,202; 2014 – $993,974) | 1,067,602 | 1,014,878 | ||||||
Restricted investments AFS – in trust for related party agreements at fair value (Amortized cost: 2015 – $1,781,178; 2014 – $1,769,083) | 1,754,705 | 1,814,478 | ||||||
Restricted investments HTM – in trust for related party agreements at fair value (Amortized cost: 2015 – $607,843; 2014 – $0) | 598,975 | — | ||||||
Restricted investments AFS – in trust for U.S. state regulatory authorities (Amortized cost: 2015 – $4,071; 2014 – $7,269) | 4,303 | 7,606 | ||||||
Total restricted investments | 3,425,585 | 2,836,962 | ||||||
Total restricted cash and cash equivalents and investments | $ | 3,668,444 | $ | 3,121,343 | ||||
F-24
MAIDEN HOLDINGS, LTD.
NOTES TO CONSOLIDATED FINANCIAL STATEMENTS
(In thousands of U.S. dollars, except share and per share data)
NOTES TO CONSOLIDATED FINANCIAL STATEMENTS
(In thousands of U.S. dollars, except share and per share data)
5. Fair Value Measurements
a) Fair Values of Financial Instruments
ASC 825, "Disclosure About Fair Value of Financial Instruments", requires all entities to disclose the fair value of their financial instruments, both assets and liabilities recognized and not recognized in the balance sheet, for which it is practicable to estimate fair value.
The following describes the valuation techniques used by the Company to determine the fair value of financial instruments held at December 31, 2015.
U.S. government and U.S. government agencies — Bonds issued by the U.S. Treasury, the Federal Home Loan Bank, the Federal Home Loan Mortgage Corporation, Government National Mortgage Association and the Federal National Mortgage Association. The fair values of U.S. treasury bonds are based on quoted market prices in active markets, and are included in the Level 1 fair value hierarchy. We believe the market for U.S. treasury bonds is an actively traded market given the high level of daily trading volume. The fair values of U.S. government agency bonds are determined using the spread above the risk-free yield curve. As the yields for the risk-free yield curve and the spreads for these securities are observable market inputs, the fair values of U.S. government agency bonds are included in the Level 2 fair value hierarchy.
Non-U.S. government and supranational bonds — These securities are generally priced by independent pricing services. The Pricing Service may use current market trades for securities with similar quality, maturity and coupon. If no such trades are available, the Pricing Service typically uses analytical models which may incorporate spreads, interest rate data and market/sector news. As the significant inputs used to price non-U.S. government and supranational bonds are observable market inputs, the fair values of non-U.S. government and supranational bonds are included in the Level 2 fair value hierarchy.
Asset-backed securities — Comprise CMBS and CLO originated by a variety of financial institutions. These securities are priced by independent pricing services and brokers. The pricing provider applies dealer quotes and other available trade information, prepayment speeds, yield curves and credit spreads to the valuation. As the significant inputs used to price the CMBS and CLO are observable market inputs, the fair value of the CMBS and CLO is included in the Level 2 fair value hierarchy.
Corporate bonds — Bonds issued by corporations that on acquisition are rated BBB-/Baa3 or higher. These securities are generally priced by independent pricing services. The spreads are sourced from broker/dealers, trade prices and the new issue market. Where pricing is unavailable from pricing services, we obtain non-binding quotes from broker-dealers. As the significant inputs used to price corporate bonds are observable market inputs, the fair values of corporate bonds are included in the Level 2 fair value hierarchy.
Municipal bonds — Bonds issued by U.S. state and municipality entities or agencies. The fair values of municipal bonds are generally priced by independent pricing services. The pricing services typically use spreads obtained from broker-dealers, trade prices and the new issue market. As the significant inputs used to price the municipal bonds are observable market inputs, municipal bonds are classified within Level 2.
Short-term investments — Primarily commercial paper issued by corporations, all with maturities greater than 90 days and less than one year at the date of purchase. The fair values of these short-term investments are priced by independent pricing services, using market pricing and other observable market inputs for the same or similar securities obtained from a number of industry standard data providers. As the significant inputs used to price the commercial paper securities are observable market inputs, commercial paper securities are classified within Level 2.
Other investments — Includes both quoted and unquoted investments. The fair value of our quoted equity investment is obtained from the Pricing Service, reflecting the closing price quoted for the final trading day of the period and is classified within Level 1. Unquoted other investments comprise investments in limited partnerships and an investment in preference shares of a start-up insurance producer. The fair values of the limited partnerships are determined by the fund manager based on recent filings, operating results, balance sheet stability, growth and other business and market sector fundamentals, and as such, the fair values are included in the Level 3 fair value hierarchy. The fair value of the investment in preference shares of a start-up insurance producer was determined using recent private market transactions and as such, the fair value is included in the Level 3 fair value hierarchy.
Reinsurance balances receivable — The carrying values reported in the accompanying consolidated balance sheets for these financial instruments approximate their fair value due to short term nature of the assets.
Loan to related party — The carrying value reported in the accompanying consolidated balance sheets for this financial instrument approximates its fair value.
Senior notes — The amount reported in the accompanying consolidated balance sheets for these financial instruments represents the carrying value of the notes. The fair values are based on quoted prices of identical instruments in inactive markets and as such, are included in the Level 2 hierarchy.
F-25
MAIDEN HOLDINGS, LTD.
NOTES TO CONSOLIDATED FINANCIAL STATEMENTS
(In thousands of U.S. dollars, except share and per share data)
NOTES TO CONSOLIDATED FINANCIAL STATEMENTS
(In thousands of U.S. dollars, except share and per share data)
5. Fair Value Measurements (continued)
b) Fair Value Hierarchy
The Company’s estimates of fair value for financial assets and financial liabilities are based on the framework established in ASC 820. The framework is based on the inputs used in valuation and gives the highest priority to quoted prices in active markets and requires that observable inputs be used in the valuations when available. The disclosure of fair value estimates in the ASC 820 hierarchy is based on whether the significant inputs into the valuation are observable. In determining the level of the hierarchy in which the estimate is disclosed, the highest priority is given to unadjusted quoted prices in active markets and the lowest priority to unobservable inputs that reflect the Company’s significant market assumptions.
At December 31, 2015 and 2014, we classified our financial instruments measured at fair value on a recurring basis in the following valuation hierarchy:
December 31, 2015 | Quoted Prices in Active Markets for Identical Assets (Level 1) | Significant Other Observable Inputs (Level 2) | Significant Unobservable Inputs (Level 3) | Total Fair Value | ||||||||||||
AFS fixed maturities | ||||||||||||||||
U.S. treasury bonds | $ | 6,010 | $ | — | $ | — | $ | 6,010 | ||||||||
U.S. agency bonds – mortgage-backed | — | 1,476,991 | — | 1,476,991 | ||||||||||||
U.S. agency bonds – other | — | 24,311 | — | 24,311 | ||||||||||||
Non-U.S. government and supranational bonds | — | 30,544 | — | 30,544 | ||||||||||||
Asset-backed securities | — | 165,804 | — | 165,804 | ||||||||||||
Corporate bonds | — | 1,739,668 | — | 1,739,668 | ||||||||||||
Municipal bonds | — | 64,760 | — | 64,760 | ||||||||||||
Other investments | 4,905 | — | 6,907 | 11,812 | ||||||||||||
Total | $ | 10,915 | $ | 3,502,078 | $ | 6,907 | $ | 3,519,900 | ||||||||
As a percentage of total assets | 0.2 | % | 61.3 | % | 0.1 | % | 61.6 | % | ||||||||
December 31, 2014 | Quoted Prices in Active Markets for Identical Assets (Level 1) | Significant Other Observable Inputs (Level 2) | Significant Unobservable Inputs (Level 3) | Total Fair Value | ||||||||||||
AFS fixed maturities | ||||||||||||||||
U.S. treasury bonds | $ | 9,360 | $ | — | $ | — | $ | 9,360 | ||||||||
U.S. agency bonds – mortgage-backed | — | 1,322,443 | — | 1,322,443 | ||||||||||||
U.S. agency bonds – other | — | 7,988 | — | 7,988 | ||||||||||||
Non-U.S. government and supranational bonds | — | 51,643 | — | 51,643 | ||||||||||||
Asset-backed securities | — | 54,780 | — | 54,780 | ||||||||||||
Corporate bonds | — | 1,895,379 | — | 1,895,379 | ||||||||||||
Municipal bonds | — | 65,819 | — | 65,819 | ||||||||||||
Short-term investments | — | 49,492 | — | 49,492 | ||||||||||||
Other investments | 5,990 | — | 6,581 | 12,571 | ||||||||||||
Total | $ | 15,350 | $ | 3,447,544 | $ | 6,581 | $ | 3,469,475 | ||||||||
As a percentage of total assets | 0.3 | % | 66.8 | % | 0.1 | % | 67.2 | % | ||||||||
The Company utilized a Pricing Service to estimate fair value measurements for approximately 99.9% of its fixed maturities at December 31, 2015 and 2014, respectively. The Pricing Service utilizes market quotations for fixed maturity securities that have quoted market prices in active markets. Since fixed maturities other than U.S. treasury bonds generally do not trade on a daily basis, the Pricing Service prepares estimates of fair value measurements using relevant market data, benchmark curves, sector groupings and matrix pricing and these have been classified as Level 2.
F-26
MAIDEN HOLDINGS, LTD.
NOTES TO CONSOLIDATED FINANCIAL STATEMENTS
(In thousands of U.S. dollars, except share and per share data)
NOTES TO CONSOLIDATED FINANCIAL STATEMENTS
(In thousands of U.S. dollars, except share and per share data)
5. Fair Value Measurements (continued)
At December 31, 2015 and 2014, 0.1%, respectively, of the fixed maturities are valued using the market approach. At those dates, a total of two securities and one security, respectively, or approximately $4,943 and $5,016, respectively, of Level 2 fixed maturities, were priced using a quotation from a broker and/or custodian as opposed to the Pricing Service due to lack of information available. At December 31, 2015 and 2014, we have not adjusted any pricing provided to us based on the review performed by our investment managers.
The Company utilized a Pricing Service to estimate fair value measurement for the quoted equity investment reflecting the closing price quoted for the final trading day of the period and is included in Level 1. For the unquoted other investments, the Company has $5,907 or 0.1% of its investment portfolio in limited partnerships where the fair value estimate is determined by the fund manager based on recent filings, operating results, balance sheet stability, growth, other business and market sector fundamentals and an investment of $1,000 in preference shares of a start-up insurance producer, the fair value of which was determined using recent private market transactions. Due to the significant unobservable inputs in these valuations, the Company includes the estimate of the fair value of the unquoted investments as Level 3.
There have not been any transfers between Level 1 and Level 2 during the periods represented by these Consolidated Financial Statements. During the year ended December 31, 2014, there was a transfer from Level 3 to Level 1 following a private placement investment made by the Company which began trading on NASDAQ following a resale registration statement coming into effect. At December 31, 2015 and 2014, this investment is included within Level 1 of the fair value hierarchy.
c) Level 3 Financial Instruments
The Company has determined that its investments in Level 3 securities are not material to its financial position or results of operations. The following table presents changes in Level 3 of our financial instruments measured at fair value on a recurring basis for the years ended December 31, 2015 and 2014:
For the Year Ended December 31, | ||||||||
Other investments: | 2015 | 2014 | ||||||
Balance at beginning of period | $ | 6,581 | $ | 5,092 | ||||
Total realized gains – included in net realized gains on investment | 192 | 439 | ||||||
Total realized losses – included in net realized gains on investment | — | — | ||||||
Change in total unrealized gains – included in other comprehensive income (loss) | 373 | 1,139 | ||||||
Change in total unrealized losses – included in other comprehensive income (loss) | — | — | ||||||
Purchases | 217 | 6,698 | ||||||
Sales and redemptions | (456 | ) | (797 | ) | ||||
Transfers into Level 3 | — | — | ||||||
Transfers out of Level 3 | — | (5,990 | ) | |||||
Balance at end of period | $ | 6,907 | $ | 6,581 | ||||
Level 3 gains (losses) included in net income attributable to the change in unrealized gains (losses) relating to assets held at the reporting date | $ | — | $ | — | ||||
F-27
MAIDEN HOLDINGS, LTD.
NOTES TO CONSOLIDATED FINANCIAL STATEMENTS
(In thousands of U.S. dollars, except share and per share data)
NOTES TO CONSOLIDATED FINANCIAL STATEMENTS
(In thousands of U.S. dollars, except share and per share data)
5. Fair Value Measurements (continued)
(d) Financial Instruments not measured at Fair Value
The following table presents the fair value and carrying value of the financial instruments not measured at fair value:
December 31, 2015 | December 31, 2014 | |||||||||||||||
Carrying Value | Fair Value | Carrying Value | Fair Value | |||||||||||||
Financial Assets | ||||||||||||||||
HTM - corporate bonds | $ | 607,843 | $ | 598,975 | $ | — | $ | — | ||||||||
Total financial assets | $ | 607,843 | $ | 598,975 | $ | — | $ | — | ||||||||
Financial Liabilities | ||||||||||||||||
MHNA - 8.25% | $ | 107,500 | $ | 110,424 | $ | 107,500 | $ | 113,391 | ||||||||
MHNB - 8.00% | 100,000 | 105,328 | 100,000 | 106,320 | ||||||||||||
MHNC - 7.75% | 152,500 | 165,456 | 152,500 | 162,016 | ||||||||||||
Total financial liabilities | $ | 360,000 | $ | 381,208 | $ | 360,000 | $ | 381,727 | ||||||||
6. Goodwill and Intangible Assets
The Company recognizes Goodwill and Intangible Assets in connection with certain acquisitions.
Goodwill is calculated as the excess of purchase price over the net fair value of assets acquired. The Company performs an annual impairment analysis to identify potential goodwill impairment and measures the amount of goodwill impairment loss to be recognized. This annual test is performed during the fourth quarter of each year or more frequently if events or circumstances change in a way that requires the Company to perform the impairment analysis on an interim basis. Goodwill impairment testing requires an evaluation of the estimated fair value of each reporting unit to its carrying value, including the goodwill. An impairment charge is recorded if the estimated fair value is less than the carrying amount of the reporting unit. No impairments have been identified to date.
Intangible assets consist of finite and indefinite life assets. Finite life intangible assets include customer and producer relationships and trademarks. Insurance company licenses are considered indefinite life intangible assets subject to annual impairment testing.
The following tables show the analysis of goodwill and intangible assets:
Goodwill | Intangible Assets | Total | ||||||||||
December 31, 2013 | $ | 58,312 | $ | 32,301 | $ | 90,613 | ||||||
Amortization | — | (3,277 | ) | (3,277 | ) | |||||||
December 31, 2014 | 58,312 | 29,024 | 87,336 | |||||||||
Acquired during the year | 1,800 | — | 1,800 | |||||||||
Disposed during the year | (1,120 | ) | (3,200 | ) | (4,320 | ) | ||||||
Cumulative translation adjustment | (56 | ) | — | (56 | ) | |||||||
Amortization | — | (2,840 | ) | (2,840 | ) | |||||||
December 31, 2015 | $ | 58,936 | $ | 22,984 | $ | 81,920 | ||||||
F-28
MAIDEN HOLDINGS, LTD.
NOTES TO CONSOLIDATED FINANCIAL STATEMENTS
(In thousands of U.S. dollars, except share and per share data)
NOTES TO CONSOLIDATED FINANCIAL STATEMENTS
(In thousands of U.S. dollars, except share and per share data)
6. Goodwill and Intangible Assets (continued)
December 31, 2015 | Gross | Accumulated Amortization | Net | Useful Life | ||||||||||
Goodwill | $ | 58,936 | $ | — | $ | 58,936 | Indefinite | |||||||
State licenses | 4,527 | — | 4,527 | Indefinite | ||||||||||
Customer relationships | 51,400 | (32,943 | ) | 18,457 | 15 years double declining | |||||||||
Net balance | $ | 114,863 | $ | (32,943 | ) | $ | 81,920 | |||||||
December 31, 2014 | Gross | Accumulated Amortization | Net | Useful Life | ||||||||||
Goodwill | $ | 58,312 | $ | — | $ | 58,312 | Indefinite | |||||||
State licenses | 7,727 | — | 7,727 | Indefinite | ||||||||||
Customer relationships | 51,400 | (30,103 | ) | 21,297 | 15 years double declining | |||||||||
Net balance | $ | 117,439 | $ | (30,103 | ) | $ | 87,336 | |||||||
On November 4, 2015, Maiden US finalized the sale of its wholly owned subsidiary, Maiden Specialty Insurance Company, to Clear Blue Financial Holdings, LLC ("Clear Blue"). The goodwill and intangible assets disposed of by way of this sale agreement were $1,120 and $3,200, respectively. During 2015, the Company acquired Regulatory Capital Limited, trading as Insurance Regulatory Capital ("IRC"), a licensed asset manager in Ireland. IRC offers solutions designed to meet the capital and risk management needs of mid-sized insurance companies. The Company recognized goodwill of $1,800 as a result of the acquisition.
The goodwill and intangible assets are assigned to the Diversified Reinsurance segment and are subject to annual impairment testing. No impairment was recorded during the years ended December 31, 2015, 2014 and 2013.
The estimated amortization of intangible assets for the next five years is as follows:
2016 | $ | 2,461 | |
2017 | 2,133 | ||
2018 | 1,848 | ||
2019 | 1,602 | ||
2020 | 1,388 | ||
7. Long-Term Debt
Senior Notes
The Company, through its wholly owned subsidiary Maiden NA, completed public debt offerings on three separate occasions, with the issuance of senior notes in 2011, 2012 and 2013, respectively, (the "Senior Notes"). Each issuance is fully and unconditionally guaranteed by the Company and are an unsecured and unsubordinated obligation of the Company. The following table details the Company's Senior Notes issuances:
2011 Senior Notes | 2012 Senior Notes | 2013 Senior Notes | ||||||||||
Principal | $ | 107,500 | $ | 100,000 | $ | 152,500 | ||||||
Debt Issuance Costs | 2,811 | 3,406 | 5,054 | |||||||||
Net Proceeds | $ | 104,689 | $ | 96,594 | $ | 147,446 | ||||||
Other details: | ||||||||||||
Maturity date | June 15, 2041 | March 27, 2042 | December 1, 2043 | |||||||||
Earliest redeemable date (for cash) | June 15, 2016 | March 27, 2017 | December 1, 2018 | |||||||||
Coupon rate | 8.25 | % | 8.00 | % | 7.75 | % | ||||||
Effective interest rate | 8.47 | % | 8.28 | % | 8.04 | % | ||||||
F-29
MAIDEN HOLDINGS, LTD.
NOTES TO CONSOLIDATED FINANCIAL STATEMENTS
(In thousands of U.S. dollars, except share and per share data)
NOTES TO CONSOLIDATED FINANCIAL STATEMENTS
(In thousands of U.S. dollars, except share and per share data)
7. Long-Term Debt (continued)
The interest expense incurred on the Senior Notes for the year ended December 31, 2015 was $28,687 (2014 - $28,687, 2013 - $18,084), of which $1,523 was accrued at December 31, 2015 and 2014. The debt issuance costs related to the Senior Notes were capitalized and are being amortized over the life of the notes. The amount of amortization expense was $376 for the year ended December 31, 2015 (2014 - $375, 2013 - $223).
8. Reinsurance
We use retrocessional agreements ("ceded reinsurance") to mitigate volatility and to reduce our exposure on certain specialty reinsurance risks and to provide capital support. These agreements provide for recovery from reinsurers of a portion of losses and LAE under certain circumstances without relieving the Company of its obligations to the policyholders. The Company remains liable to the extent that any reinsurance company fails to meet its obligations. Losses and LAE incurred and premiums earned are reported after deduction for reinsurance. In the event that one or more of the reinsurers are unable to meet their obligations under these reinsurance agreements, the Company would not realize the full value of the reinsurance recoverable balances.
Effective January 1, 2015, the Company entered into a retrocessional quota share agreement with a highly rated global insurer to cede certain lines of business from both of our reportable segments.
The effect of ceded reinsurance on net premiums written and earned and on net loss and LAE for the years ended December 31, 2015, 2014 and 2013 was as follows:
For the Year Ended December 31, | 2015 | 2014 | 2013 | |||||||||
Premiums written | ||||||||||||
Direct | $ | 9,160 | $ | 48,565 | $ | 104,976 | ||||||
Assumed | 2,653,666 | 2,458,787 | 2,099,183 | |||||||||
Ceded | (148,710 | ) | (49,216 | ) | (107,858 | ) | ||||||
Net | $ | 2,514,116 | $ | 2,458,136 | $ | 2,096,301 | ||||||
Premiums earned | ||||||||||||
Direct | $ | 26,358 | $ | 70,807 | $ | 118,170 | ||||||
Assumed | 2,481,515 | 2,253,750 | 1,994,225 | |||||||||
Ceded | (78,804 | ) | (72,814 | ) | (111,508 | ) | ||||||
Net | $ | 2,429,069 | $ | 2,251,743 | $ | 2,000,887 | ||||||
Loss and loss adjustment expenses | ||||||||||||
Gross loss and LAE | $ | 1,687,564 | $ | 1,592,795 | $ | 1,421,328 | ||||||
Loss and LAE ceded | (53,994 | ) | (94,524 | ) | (71,698 | ) | ||||||
Net | $ | 1,633,570 | $ | 1,498,271 | $ | 1,349,630 | ||||||
The reinsurers with the three largest balances accounted for 40.9%, 35.5% and 4.8%, respectively, of the Company's reinsurance recoverable on unpaid losses balance at December 31, 2015 (2014 – 45.6%, 10.6% and 9.9%, respectively). At December 31, 2015, 99.1% of the reinsurance recoverable on unpaid losses was due from reinsurers with credit ratings from A.M Best of A, or better, and 0.9% of the reinsurance recoverable on unpaid losses was due from reinsurers without ratings. At December 31, 2015 and 2014, the Company had no valuation allowance against reinsurance recoverable on unpaid losses.
9. Reserve for Loss and Loss Adjustment Expenses
Our reserve for loss and LAE comprises:
December 31, | 2015 | 2014 | ||||||
Reserve for reported loss and LAE | $ | 1,411,712 | $ | 1,241,132 | ||||
Reserve for losses incurred but not reported | 1,098,389 | 1,030,160 | ||||||
Reserve for loss and LAE | $ | 2,510,101 | $ | 2,271,292 | ||||
F-30
MAIDEN HOLDINGS, LTD.
NOTES TO CONSOLIDATED FINANCIAL STATEMENTS
(In thousands of U.S. dollars, except share and per share data)
NOTES TO CONSOLIDATED FINANCIAL STATEMENTS
(In thousands of U.S. dollars, except share and per share data)
9. Reserve for Loss and Loss Adjustment Expenses (continued)
The following table represents a reconciliation of our beginning and ending gross and net loss and LAE reserves:
For the Year Ended December 31, | 2015 | 2014 | 2013 | |||||||||
Gross loss and LAE reserves, January 1 | $ | 2,271,292 | $ | 1,957,835 | $ | 1,740,281 | ||||||
Less: reinsurance recoverable on unpaid losses, January 1 | 75,873 | 84,036 | 110,858 | |||||||||
Net loss and LAE reserves, January 1 | 2,195,419 | 1,873,799 | 1,629,423 | |||||||||
Net incurred losses related to: | ||||||||||||
Current year | 1,558,704 | 1,479,425 | 1,351,043 | |||||||||
Prior years | 74,866 | 18,846 | (1,413 | ) | ||||||||
1,633,570 | 1,498,271 | 1,349,630 | ||||||||||
Net paid losses related to: | ||||||||||||
Current year | (457,517 | ) | (430,394 | ) | (517,606 | ) | ||||||
Prior years | (892,840 | ) | (705,397 | ) | (598,490 | ) | ||||||
(1,350,357 | ) | (1,135,791 | ) | (1,116,096 | ) | |||||||
Effect of foreign exchange movements | (39,779 | ) | (40,860 | ) | 10,842 | |||||||
Net loss and LAE reserves, December 31 | 2,438,853 | 2,195,419 | 1,873,799 | |||||||||
Reinsurance recoverable on unpaid losses, December 31 | 71,248 | 75,873 | 84,036 | |||||||||
Gross loss and LAE reserves, December 31 | $ | 2,510,101 | $ | 2,271,292 | $ | 1,957,835 | ||||||
Management believes that its use of both historical experience and industry-wide loss development factors provide a reasonable basis for estimating future losses. In the future, certain events may be beyond the control of management, such as changes in law, judicial interpretations of law, and inflation may favorably or unfavorably impact the ultimate settlement of the Company’s loss and LAE reserves.
The anticipated effect of inflation is implicitly considered when estimating liabilities for losses and LAE. While anticipated changes in claim costs due to inflation are considered in estimating the ultimate claim costs, changes in average severity of claims are caused by a number of factors that vary with the individual type of policy written. Ultimate losses are projected based on historical trends adjusted for implemented changes in underwriting standards, policy provisions, and general economic trends. Those anticipated trends are monitored based on actual development and are modified if necessary. Prior period development arises from changes to loss estimates recognized in the current year that relate to loss reserves in previous calendar years. The development reflects changes in management's best estimate of the ultimate losses under the relevant reinsurance policies after review of changes in actuarial assessments.
During 2015, the Company recorded estimated net adverse development, primarily from U.S. commercial auto business, on prior year loss reserves of $74,866 or 3.3% of prior year net loss and LAE reserves compared to net unfavorable development $18,846 or 1.0% in 2014 and net favorable development of $1,413 or 0.1% in 2013.
F-31
MAIDEN HOLDINGS, LTD.
NOTES TO CONSOLIDATED FINANCIAL STATEMENTS
(In thousands of U.S. dollars, except share and per share data)
NOTES TO CONSOLIDATED FINANCIAL STATEMENTS
(In thousands of U.S. dollars, except share and per share data)
10. Related Party Transactions
The Founding Shareholders of the Company are Michael Karfunkel, George Karfunkel and Barry Zyskind. The Founding Shareholders including Leah Karfunkel (wife of Michael Karfunkel) own or control approximately 20.3% of the outstanding shares of the Company. Michael Karfunkel is the non-executive chairman of the board of AmTrust, George Karfunkel is a director of AmTrust, and Barry Zyskind is the president, CEO and director of AmTrust. The Founding Shareholders, including Leah Karfunkel, own or control approximately 47.9% of the outstanding shares of AmTrust. AmTrust owns 11.6% of the issued and outstanding shares of National General Holdings Corporation ("NGHC") common stock, and Michael Karfunkel individually and the Michael Karfunkel 2005 Family Trust (which is controlled by Leah Karfunkel) own a combined 43.1% of the outstanding common shares of NGHC. Michael Karfunkel is the chairman and CEO of NGHC, and Barry Zyskind is a director of NGHC.
AmTrust
The following describes transactions between the Company and AmTrust:
AmTrust Quota Share Reinsurance Agreement
Effective July 1, 2007, the Company and AmTrust entered into a master agreement, as amended (the "Master Agreement"), by which they caused Maiden Bermuda, a wholly owned subsidiary of the Company, and AmTrust's Bermuda reinsurance subsidiary, AmTrust International Insurance, Ltd. ("AII"), to enter into a quota share reinsurance agreement (the "Reinsurance Agreement") by which (a) AII retrocedes to Maiden Bermuda an amount equal to 40% of the premium written by subsidiaries of AmTrust, net of the cost of unaffiliated inuring reinsurance (and in the case of AmTrust's U.K. insurance subsidiary, AmTrust Europe Limited ("AEL"), net of commissions) and 40% of losses and (b) AII transferred to Maiden Bermuda 40% of the AmTrust subsidiaries' unearned premiums, effective July 1, 2007, with respect to the current lines of business. The Master Agreement further provided that AII receives a ceding commission of 31% of ceded written premiums.
On June 11, 2008, Maiden Bermuda and AII amended the Reinsurance Agreement to add Retail Commercial Package Business to the Covered Business. AII receives a ceding commission of 34.375% on Retail Commercial Package Business.
Effective March 7, 2013, Maiden Bermuda and AII amended the Reinsurance Agreement extending the term of the agreement to June 30, 2016, and shall automatically renew for successive three-year periods thereafter. If AII or Maiden Bermuda elects to so terminate the Reinsurance Agreement, it shall give written notice to the other party hereto not less than nine months prior to the expiration of any successive three-year period. As no written notice was given by either party, the term of the agreement has been extended to June 30, 2019.
Either party is entitled to terminate on thirty days' notice or less upon the occurrence of certain early termination events, which include a default in payment, insolvency, change in control of AII or Maiden Bermuda, run-off, or a reduction of 50% or more of the shareholders' equity of Maiden Bermuda or the combined shareholders' equity of AII and the AmTrust subsidiaries.
In 2015, Maiden Bermuda and AII entered into an agreement to commute certain liabilities as of December 31, 2015. The commuted reserve value of $107,000, represents full and final settlement of all liabilities related to this business and as a result of this agreement, this business will be excluded prospectively.
Additionally, for the Specialty Program portion of Covered Business only, AII will be responsible for ultimate net loss otherwise recoverable from Maiden Bermuda to the extent that the loss ratio to Maiden Bermuda, which shall be determined on an inception to date basis from July 1, 2007 through the date of calculation, is between 81.5% and 95%. Above and below the defined corridor, Maiden Bermuda will continue to reinsure losses at its proportional 40% share per the Reinsurance Agreement.
AmTrust European Hospital Liability Quota Share Agreement ("European Hospital Liability Quota Share")
Effective April 1, 2011, Maiden Bermuda, entered into a quota share reinsurance contract with AEL and AmTrust International Underwriters Limited ("AIUL"), both wholly owned subsidiaries of AmTrust. Pursuant to the terms of the contract, Maiden Bermuda assumed 40% of the premiums and losses related to policies classified as European Hospital Liability, including associated liability coverages and policies covering physician defense costs, written or renewed on or after April 1, 2011. The contract also covers policies written or renewed on or before March 31, 2011, but only with respect to losses that occur, accrue or arise on or after April 1, 2011. The maximum limit of liability attaching shall be €5,000 (€10,000 effective January 1, 2012) or currency equivalent (on a 100% basis) per original claim for any one original policy. Maiden Bermuda will pay a ceding commission of 5%. The agreement has been renewed through March 31, 2017 and can be terminated at any April 1 by either party on four months notice.
For the year ended December 31, 2015, the Company recorded approximately $518,196 (2014 - $401,679, 2013 - $279,197) of commission expense as a result of both of these quota share arrangements with AmTrust.
F-32
MAIDEN HOLDINGS, LTD.
NOTES TO CONSOLIDATED FINANCIAL STATEMENTS
(In thousands of U.S. dollars, except share and per share data)
NOTES TO CONSOLIDATED FINANCIAL STATEMENTS
(In thousands of U.S. dollars, except share and per share data)
10. Related Party Transactions (continued)
Other Reinsurance Agreements
Effective September 1, 2010, the Company, through a subsidiary, entered into an arrangement whereby a subsidiary of AmTrust fronted a reinsurance agreement in which we assumed 80% of the gross liabilities produced under the Southern General Agency program with the other 20% being assumed by a third party. This fronting arrangement compensated AmTrust with a 5% commission of ceded written premiums. The agreement was subsequently amended, effective September 1, 2012, whereby the termination date of the agreement was extended until August 31, 2013. This agreement expired on the termination date and is currently in run-off. Pursuant to the latest amendment, we now receive 100% of the premium and reinsure 100% of the gross liabilities incurred (from the effective date). As this program is currently in run-off, we did not record any premiums earned or commission expense, respectively, for the year ended December 31, 2015 (2014 - $1,796 and $90, respectively, 2013 - $4,785 and $239, respectively).
Effective September 1, 2010, the Company, through a subsidiary, entered into a quota share reinsurance agreement with Technology Insurance Company, Inc. ("Technology"), a subsidiary of AmTrust. Under the agreement, we ceded (a) 90% of its gross liability written under the Open Lending Program ("OPL") and (b) 100% of its surplus lines general liability business under the Naxos Avondale Specialty Casualty Program ("NAXS"). Our involvement is limited to certain states where Technology was not fully licensed. The agreement also provides that we receive a ceding commission of 5% of ceded written premiums. The reinsurance agreement had a term of three years and remained continuously in force until terminated in accordance with the contract.
The OPL program was terminated on December 31, 2011, on a run-off basis, and the NAXS program was terminated on October 31, 2012. We recorded $68 of ceded premiums and $3 ceding commission income for the year ended December 31, 2015 (2014 - $171 and $8, respectively, 2013 - $928 and $186, respectively).
Effective April 1, 2012, the Company, through a subsidiary, entered into a reinsurance agreement with AmTrust's wholly owned subsidiary, AmTrust North America, Inc. ("AmTrust NA"). We indemnify AmTrust NA, on an excess of loss basis, as a result of losses occurring on AmTrust NA's new and renewal policies relating to the lines of business classified as Automobile Liability by AmTrust NA in its annual statement utilizing the specific underwriting guidelines defined in the reinsurance agreement. AmTrust NA shall retain the first $1,000 of loss, per any one policy or per any one loss occurrence. This agreement has a term of one year and automatically renews annually unless terminated pursuant to the terms of the agreement. Under this agreement, we recorded approximately $673 of net premiums earned and $166 of commission expense for the year ended December 31, 2015 ($1,241 and $643 net premiums earned and $262 and $158 commission expense for the years ended December 31, 2014 and 2013, respectively).
Collateral provided to AmTrust
a) AmTrust Quota Share Reinsurance Agreement
In order to provide AmTrust's U.S. insurance subsidiaries with credit for reinsurance on their statutory financial statements, AII, as the direct reinsurer of the AmTrust's insurance subsidiaries, has established trust accounts ("Trust Accounts") for their benefit. Maiden Bermuda has agreed to provide appropriate collateral to secure its proportional share under the Reinsurance Agreement of AII's obligations to the AmTrust subsidiaries to whom AII is required to provide collateral. This collateral may be in the form of (a) assets loaned by Maiden Bermuda to AII for deposit into the Trust Accounts, pursuant to a loan agreement between those parties, (b) assets transferred by Maiden Bermuda for deposit into the Trust Accounts, (c) a letter of credit obtained by Maiden Bermuda and delivered to an AmTrust subsidiary on AII's behalf, or (d) premiums withheld by an AmTrust subsidiary at Maiden Bermuda's request in lieu of remitting such premiums to AII. Maiden Bermuda may provide any or a combination of these forms of collateral, provided that the aggregate value thereof equals Maiden Bermuda's proportionate share of its obligations under the Reinsurance Agreement with AII.
Maiden Bermuda satisfied its collateral requirements under the Reinsurance Agreement with AII as follows:
•by lending funds in the amount of $167,975 at December 31, 2015 and 2014 pursuant to a loan agreement entered into between those parties. This loan was assigned by AII to AmTrust effective December 31, 2014 and is carried at cost. Interest is payable at a rate equivalent to the one-month LIBOR plus 90 basis points per annum; and
•effective December 1, 2008, the Company entered into a Reinsurer Trust Assets Collateral agreement to provide to AII sufficient collateral to secure its proportional share of AII's obligations to the U.S. AmTrust subsidiaries. The amount of the collateral, at December 31, 2015 was approximately $2,256,383 (2014 - $1,691,970) and the accrued interest was $15,448 (2014 - $10,413). Please refer to "Note 4. (e) Investments" for additional information.
b) European Hospital Liability Quota Share
AEL requested that Maiden Bermuda provide collateral to secure its proportional share under the European Hospital Liability Quota Share agreement. Please refer to "Note 4. (e) Investments" for additional information.
F-33
MAIDEN HOLDINGS, LTD.
NOTES TO CONSOLIDATED FINANCIAL STATEMENTS
(In thousands of U.S. dollars, except share and per share data)
NOTES TO CONSOLIDATED FINANCIAL STATEMENTS
(In thousands of U.S. dollars, except share and per share data)
10. Related Party Transactions (continued)
Brokerage Agreement
Effective July 1, 2007, the Company entered into a reinsurance brokerage agreement with AII Reinsurance Broker Ltd. ("AIIB"), a wholly owned subsidiary of AmTrust. Pursuant to the brokerage agreement, AIIB provides brokerage services relating to the Reinsurance Agreement and the European Hospital Liability Quota Share agreement for a fee equal to 1.25% of the premium assumed. The brokerage fee is payable in consideration of AIIB's brokerage services. AIIB is not the Company's exclusive broker. The agreement may be terminated upon 30 days written notice by either party. Maiden Bermuda recorded approximately $21,475, $17,229 and $12,361 of reinsurance brokerage expense for the years ended December 31, 2015, 2014 and 2013, respectively, and deferred reinsurance brokerage of $13,464 and $11,423 at December 31, 2015 and 2014, respectively, as a result of this agreement.
Asset Management Agreement
Effective July 1, 2007, the Company entered into an asset management agreement with AII Insurance Management Limited ("AIIM"), a wholly owned subsidiary of AmTrust, pursuant to which AIIM has agreed to provide investment management services to the Company. AIIM provides investment management services for a quarterly fee of 0.0375% if the average value of the account for the previous calendar quarter is greater than $1 billion. The agreement may be terminated upon 30 days written notice by either party. The Company recorded approximately $6,057, $5,214 and $4,388 of investment management fees for the years ended December 31, 2015, 2014 and 2013, respectively, as a result of this agreement.
Other
The Company entered into time sharing agreements for the lease of aircraft owned by AmTrust Underwriters, Inc. ("AUI"), a wholly owned subsidiary of AmTrust, and by AmTrust on March 1, 2011 and November 5, 2014, respectively. The agreements automatically renew for successive one-year terms unless terminated in accordance with the provisions of the agreements. Pursuant to the agreements, the Company will reimburse AUI and AmTrust for actual expenses incurred as allowed by Federal Aviation Regulations. For the year ended December 31, 2015, the Company recorded an expense of $89 (2014- $88, 2013 - $57) for the use of the aircraft.
NGHC
The following describes transactions between the Company and NGHC and its subsidiaries:
NGHC Quota Share Reinsurance Agreement ("NGHC Quota Share")
Maiden Bermuda, effective March 1, 2010, had a 50% participation in the NGHC Quota Share, by which it received 25% of net premiums of the personal lines automobile business and assumed 25% of the related net losses. The NGHC Quota Share provided that the reinsurers pay a provisional ceding commission equal to 32.5% (32.0% effective October 1, 2012) of ceded earned premium, net of premiums ceded by the personal lines companies for inuring reinsurance, subject to adjustment. The ceding commission was subject to adjustment to a maximum of 34.5% if the loss ratio for the reinsured business is 60.0% or less and a minimum of 30.5% (30.0% effective October 1, 2012) if the loss ratio was 64.5% or greater.
On August 1, 2013, the Company received notice from NGHC of the termination of the NGHC Quota Share effective on that date. The Company and NGHC mutually agreed that the termination is on a run-off basis, which means that Maiden Bermuda continued to earn premiums and remain liable for losses occurring subsequent to August 1, 2013 for any policies in force prior to and as of August 1, 2013 until those policies expire. Consequently, Maiden Bermuda recorded no ceding commission expense for the year ended December 31, 2015 (2014 - $6,509, 2013 - $75,382) as a result of this transaction.
Other
Effective April 1, 2015, Maiden US renewed the Medical Excess of Loss reinsurance agreement with wholly owned subsidiaries of NGHC, Distributors Insurance Company PCC, AIBD Insurance Company IC and Professional Services Captive Corporation IC. Pursuant to this agreement, Maiden US indemnifies on an excess of loss basis, for the amounts of net loss, paid from April 1, 2015 through March 31, 2016. Maiden US is liable for 100% of the net loss for each covered person per agreement year in excess of the $1,175 retention (2014 - $1,100) (each covered person per agreement year). Maiden US' liability shall not exceed $8,825 (2014 - $8,900) per covered person per agreement year. In addition, Maiden US continues to indemnify extra contractual obligations with a maximum liability of $2,000. This agreement terminates on March 31, 2016 and, unless mutually agreed, Maiden US will be relieved of all liability hereunder for losses incurred or paid subsequent to such termination date.
Under these agreements, Maiden US recorded $443 of premiums earned for the year ended December 31, 2015 (2014 - $190, 2013 - $180).
F-34
MAIDEN HOLDINGS, LTD.
NOTES TO CONSOLIDATED FINANCIAL STATEMENTS
(In thousands of U.S. dollars, except share and per share data)
NOTES TO CONSOLIDATED FINANCIAL STATEMENTS
(In thousands of U.S. dollars, except share and per share data)
11. Commitments, Contingencies and Concentrations
a) Concentrations of Credit Risk
At December 31, 2015 and 2014, the Company’s assets where significant concentrations of credit risk may exist include investments, cash and cash equivalents, loan to related party and reinsurance balances receivable.
The Company manages concentration of credit risk in the investment portfolio through issuer and sector exposure limitations. The Company believes it bears minimal credit risk in its cash on deposit. The Company also monitors the credit risk related to the loan to related party and its reinsurance balances receivable, within which the largest balance is due from AmTrust. To mitigate credit risk, we generally have a contractual right of offset thereby allowing us to settle claims net of any premiums or loan receivable. The Company believes these balances will be fully collectible.
b) Concentrations of Revenue
During 2015, our gross premiums written from AmTrust accounted for $1,885,974 or 70.8% of our total gross premiums written (2014 – $1,610,485 or 64.2% and 2013 – $1,169,961 or 53.1%).
c) Brokers
We market our Diversified Reinsurance segment through a combination of third-party intermediaries and directly through our own marketing efforts. For the year ended December 31, 2015, 54.6% (2014 - 57.1%, 2013 - 57.7%) of the Diversified Reinsurance segment gross premiums written was sourced through brokers. Our top three brokers represented approximately 36.9% of gross premiums written by our Diversified Reinsurance segment for the year ended December 31, 2015 (2014 - 31.6%, 2013 - 29.9%) and is comprised of Aon Benfield Inc. -17.3% (2014 - 15.8%, 2013 - 11.9%), Marsh & McLennan Companies (including Guy Carpenter) - 12.2% (2014 - 12.0%, 2013 - 12.6%), and U.S. RE Corporation - 7.4% (Tiger Risk Partners - 2014 - 3.8%, Beach & Associates, Ltd. - 2013- 5.4%).
d) Letters of Credit
At December 31, 2015 and 2014, we had letters of credit outstanding of $76,964 and $82,489, respectively. The letters of credit are for collateral purposes and are secured by cash and fixed maturities with a fair value of $108,666 (2014 - $115,151).
e) Employment agreements
The Company has entered into employment agreements with certain individuals. The employment agreements provide for option awards, executive benefits and severance payments under certain circumstances.
f) Operating Lease Commitments
The Company leases office space, an apartment, equipment and vehicles under operating leases expiring in various years through 2020. The Company's office space lease in Hamilton, Bermuda for Maiden Holdings and Maiden Bermuda, which expires on November 30, 2017, has an option to renew for another five years. The Company's total rent expense for the years ended December 31, 2015, 2014 and 2013 was $1,984, $2,220 and $2,171, respectively. Future minimum lease payments at December 31, 2015 under non-cancellable operating leases for the next five years are approximately as follows:
December 31, 2015 | |||
2016 | $ | 1,395 | |
2017 | 1,126 | ||
2018 | 534 | ||
2019 | 491 | ||
2020 | 345 | ||
$ | 3,891 | ||
g) Unfunded Commitments
The Company has an unfunded commitment on its investment in limited partnerships of approximately $622 at December 31, 2015 (2014 - $736).
F-35
MAIDEN HOLDINGS, LTD.
NOTES TO CONSOLIDATED FINANCIAL STATEMENTS
(In thousands of U.S. dollars, except share and per share data)
NOTES TO CONSOLIDATED FINANCIAL STATEMENTS
(In thousands of U.S. dollars, except share and per share data)
11. Commitments and Contingencies (continued)
h) Other Collateral
In the ordinary course of business, the Company enters into reinsurance agreements that may include terms which could require the Company to collateralize certain of its obligations.
i) Deposit Insurance
The Company maintains cash and cash equivalents balances at financial institutions in the U.S., Bermuda and other international jurisdictions. In the U.S., the Federal Deposit Insurance Corporation secures accounts up to $250. In certain other international jurisdictions, there exist similar protections. Management monitors balances in excess of insured limits and believes they do not represent a significant credit risk to the Company.
j) Legal Proceedings
Except as noted below, the Company is not a party to any material legal proceedings. From time to time, the Company is subject to routine legal proceedings, including arbitrations, arising in the ordinary course of business. These legal proceedings generally relate to claims asserted by or against the Company in the ordinary course of insurance or reinsurance operations. Based on the Company's opinion, the eventual outcome of these legal proceedings is not expected to have a material adverse effect on its financial condition or results of operations.
In April 2009, the Company learned that Bentzion S. Turin, the former Chief Operating Officer, General Counsel and Secretary of Maiden Holdings and Maiden Bermuda, sent a letter to the U.S. Department of Labor claiming that his employment with the Company was terminated in retaliation for corporate whistle blowing in violation of the whistle blower protection provisions of the Sarbanes-Oxley Act of 2002. Mr. Turin alleged concerns regarding corporate governance with respect to negotiation of the terms of the Trust Preferred Securities Offering and seeks reinstatement as Chief Operating Officer, General Counsel and Secretary of Maiden Holdings and Maiden Bermuda, back pay and legal fees incurred. On December 31, 2009, the U.S. Secretary of Labor found no reasonable cause for Mr. Turin’s claim and dismissed the complaint in its entirety. Mr. Turin objected to the Secretary's findings and requested a hearing before an administrative law judge in the U.S. Department of Labor. The Company moved to dismiss Mr. Turin's complaint, and its motion was granted by the Administrative Law Judge on June 30, 2011.
On July 13, 2011, Mr. Turin filed a petition for review of the Administrative Law Judge's decision with the Administrative Review Board in the U.S. Department of Labor. The Company filed its brief in opposition to the petition for review on October 19, 2011. On March 29, 2013, the Administrative Review Board reversed the dismissal of the complaint on procedural grounds, and remanded the case to the administrative law judge. The administrative hearing began in September 2014, and we expect it to conclude in 2016. The Company believes that it had ample reason for terminating such employment for good and sufficient legal cause, and the Company believes that the claim is without merit and is vigorously defending this claim.
k) Dividends declared
On November 4, 2015, the Company's Board of Directors authorized the following quarterly dividend:
Dividend per Share | Payable on: | Record date: | ||||||
Common shares | $ | 0.14 | January 15, 2016 | January 1, 2016 | ||||
F-36
MAIDEN HOLDINGS, LTD.
NOTES TO CONSOLIDATED FINANCIAL STATEMENTS
(In thousands of U.S. dollars, except share and per share data)
NOTES TO CONSOLIDATED FINANCIAL STATEMENTS
(In thousands of U.S. dollars, except share and per share data)
12. Earnings per Common Share
The following is a summary of the elements used in calculating basic and diluted earnings per common share:
For the Year Ended December 31, | 2015 | 2014 | 2013 | |||||||||
Numerator: | ||||||||||||
Net income attributable to Maiden | $ | 124,476 | $ | 101,391 | $ | 102,735 | ||||||
Dividends on preference shares - Series A | (12,375 | ) | (12,375 | ) | (12,375 | ) | ||||||
Dividends on convertible preference shares - Series B | (11,962 | ) | (11,962 | ) | (2,459 | ) | ||||||
Amount allocated to participating common shareholders (1) | (52 | ) | (94 | ) | (116 | ) | ||||||
Numerator for basic EPS - net income allocated to Maiden common shareholders | 100,087 | 76,960 | 87,785 | |||||||||
Potentially dilutive securities: | ||||||||||||
Dividends on convertible preference shares - Series B(2) | 11,962 | — | 2,459 | |||||||||
Numerator for diluted EPS - net income allocated to Maiden common shareholders after assumed conversion | $ | 112,049 | $ | 76,960 | $ | 90,244 | ||||||
Denominator: | ||||||||||||
Weighted average number of common shares – basic | 73,478,544 | 72,843,782 | 72,510,361 | |||||||||
Potentially dilutive securities: | ||||||||||||
Share options and restricted share units | 1,319,074 | 1,273,786 | 1,253,479 | |||||||||
Convertible preference shares(2) | 10,840,617 | — | 2,653,999 | |||||||||
Adjusted weighted average number of common shares and assumed conversions – diluted | 85,638,235 | 74,117,568 | 76,417,839 | |||||||||
Basic earnings per share attributable to Maiden common shareholders: | $ | 1.36 | $ | 1.06 | $ | 1.21 | ||||||
Diluted earnings per share attributable to Maiden common shareholders: | $ | 1.31 | $ | 1.04 | $ | 1.18 | ||||||
(1) This represents earnings allocated to the holders of non-vested restricted shares issued to the Company's employees under the 2007 Share Incentive Plan.
(2) The effect of mandatory convertible preference shares were excluded in the calculation of diluted EPS for the year ended December 31, 2014 as they were anti-dilutive. Please refer to "Notes to Consolidated Financial Statements, Note 13. Shareholders' Equity" and "Notes to Consolidated Financial Statements Note 14. Share Compensation and Pension Plans" for the terms and conditions of each of these anti-dilutive instruments. Furthermore, the current number of additional common shares that could possibly be issued on conversion, if conversion after December 31, 2015 was permitted in accordance with the terms and conditions of Form 424B Prospectus Supplement filed with the SEC, is 10,840,617, an increase of 195,456 common shares since October 1, 2013.
At December 31, 2015, no share options (2014 – 17,293; 2013 – nil) were excluded from diluted earnings per common share because they were anti-dilutive.
13. Shareholders’ Equity
At December 31, 2015, the aggregate authorized share capital of the Company is 150,000,000 shares from which the Company has issued 74,735,785 common shares, of which 73,721,140 common shares are outstanding, and issued 15,900,000 preference shares. The remaining 59,364,215 are undesignated at December 31, 2015.
a) Common Shares
The following table shows the summary of changes in the Company's common shares outstanding:
For the Year Ended December 31, | 2015 | 2014 | 2013 | ||||||
Outstanding shares – January 1 | 72,932,702 | 72,633,561 | 72,343,947 | ||||||
Issuance of vested restricted shares and restricted share units | 378,120 | 184,396 | — | ||||||
Shares repurchased | (46,458 | ) | (5,851 | ) | — | ||||
Exercise of options | 456,776 | 120,596 | 289,614 | ||||||
Outstanding shares – December 31 | 73,721,140 | 72,932,702 | 72,633,561 | ||||||
F-37
MAIDEN HOLDINGS, LTD.
NOTES TO CONSOLIDATED FINANCIAL STATEMENTS
(In thousands of U.S. dollars, except share and per share data)
NOTES TO CONSOLIDATED FINANCIAL STATEMENTS
(In thousands of U.S. dollars, except share and per share data)
13. Shareholders’ Equity (continued)
The Company's common shares have a par value of $0.01 per share. The holders of our common shares are entitled to receive dividends and are allocated one vote per common share, subject to downward adjustment under certain circumstances.
On December 24, 2012, the Company adopted a written trading plan to facilitate the repurchase of its common shares in accordance with the Company's existing share purchase reauthorization. On July 24, 2014, the Board of Directors has approved the repurchase of up to $75 million of the Company's common shares from time to time at market prices.
b) Preference Shares - Series C
On November 25 2015, the Company issued a total of 6,600,000 7.125% Preference Shares - Series C (the "Preference Shares - Series C"), par value $0.01 per share, at a price of $25 per preference share. The Company received net proceeds of $159,628 from its offering, after deducting issuance costs of $5,372, which were recognized as a reduction in additional paid-in capital. The Preference Shares - Series C have no stated maturity date and are redeemable in whole or in part at the option of the Company any time after December 15, 2020 at a redemption price of $25 per preference share plus any declared and unpaid dividends, without accumulation of any undeclared dividends. The authorized number of the Preference Shares - Series C is 6,600,000.
Dividends on the Preference Shares - Series C are non-cumulative. Consequently, in the event dividends are not declared on the Preference Shares - Series C for any dividend period, holders of Preference Shares - Series C will not be entitled to receive a dividend for such period, and such undeclared dividend will not accrue and will not be payable. The holders of Preference Shares - Series C will be entitled to receive dividend payments only when, as and if declared by the Company's board of directors or a duly authorized committee of the board of directors. Any such dividends will be payable from, and including, the date of original issue on a non-cumulative basis, quarterly in arrears.
To the extent declared, these dividends will accumulate, with respect to each dividend period, in an amount per share equal to 7.125% of the $25 liquidation preference per annum. During any dividend period, so long as any Preference Shares - Series C remain outstanding, unless the full dividends for the latest completed dividend period on all outstanding Preference Shares - Series C have been declared and paid, no dividend shall be paid or declared on the common shares.
The holders of the Preference Shares - Series C have no voting rights other than the right to elect up to two directors if preference share dividends are not declared and paid for six or more dividend periods.
c) Mandatory Convertible Preference Shares - Series B
In October 2013, the Company issued a total of 3,300,000 7.25% Mandatory Convertible Preference Shares - Series B (the "Preference Shares - Series B"), par value $0.01, at a price of $50 per preference share. The Company received net proceeds of $159,675 from the offering after deducting issuance costs of $5,325, which were recognized as a reduction in additional paid-in capital. The Preference Shares - Series B are not redeemable. The authorized number of the Preference Shares - Series B is 3,300,000.
The Company will pay cumulative dividends on each of the Preference Shares - Series B at a rate of 7.25% per annum on the initial liquidation preference of $50 per share (equivalent to $3.625 per annum per Preference Share - Series B or $0.90625 per quarter except on the initial payment date which was $0.745139). Dividends will accrue and accumulate from the date of issuance and, to the extent that the Company has lawfully available funds to pay dividends and the board of directors declares a dividend payable, it will pay dividends quarterly each year commencing on December 15, 2013, up to, and including, September 15, 2016 in cash and on September 15, 2016 or any earlier conversion date in cash, or common shares, or a combination thereof, at the Company’s election and subject to the share cap, which is an amount per share equal to the product of (i) 2 and (ii) the maximum conversion rate of 4.0322, subject to conversion rate adjustments.
On the mandatory conversion date, September 15, 2016, each of the then-outstanding Preference Shares - Series B will automatically convert into a variable number of the Company’s common shares equal to the conversion rate, which will not be more than 4.0322 of the Company's common shares and not less than 3.2258, subject to conversion rate adjustments, that are based on the volume weighted average price per share of the Company’s common shares over the forty consecutive trading day period beginning on, and including, the forty-second scheduled trading day immediately preceding September 15, 2016 (the "final averaging period"). The mandatory conversion date is the third business day immediately following the last trading day of the final averaging period. The conversion rate will be adjusted from time to time if the Company issues common shares as a dividend, increases the cash dividend from $0.09 per share or in some other cases as described under "Description of the Mandatory Convertible Preference Shares - Conversion Rate Adjustments" of the Form 424B2 Prospectus Supplement filed with the SEC on September 27, 2013.
At any time prior to September 15, 2016, other than during the fundamental change conversion period (as defined in the prospectus supplement), a holder of mandatory convertible preference shares may elect to convert such holder's mandatory convertible preference shares at the minimum conversion rate of 3.2258 shares of the common share per mandatory convertible preference share, subject to adjustment as described under "Description of Mandatory Convertible Preference Shares - Conversion Rate Adjustments" of the Form 424B2 Prospectus Supplement filed with the SEC on September 27, 2013.
F-38
MAIDEN HOLDINGS, LTD.
NOTES TO CONSOLIDATED FINANCIAL STATEMENTS
(In thousands of U.S. dollars, except share and per share data)
NOTES TO CONSOLIDATED FINANCIAL STATEMENTS
(In thousands of U.S. dollars, except share and per share data)
13. Shareholders’ Equity (continued)
The Preference Shares - Series B have no voting rights other than to elect two additional members of the board of directors if dividends on the Preference Shares - Series B have not been declared and paid for the equivalent of six or more dividend periods. For the years ended December 31, 2015, 2014 and 2013 the Company declared and paid dividends on the Preference Shares - Series B of $11,962, $11,962 and $2,459 respectively.
d) Preference Shares - Series A
On August 22, 2012, the Company issued 6,000,000 8.25% Preference Shares - Series A (the "Preference Shares - Series A"), par value $0.01 per share, at a price of $25 per preference share. The Company received net proceeds of $145,041 from its offering, after deducting issuance costs of $4,959, which were recognized as a reduction in additional paid-in capital. The Preference Shares - Series A have no stated maturity date and are redeemable in whole or in part at the option of the Company any time after August 29, 2017 at a redemption price of $25 per preference share plus any declared and unpaid dividends, without accumulation of any undeclared dividends. The authorized number of the Preference Shares - Series A is 6,000,000.
Dividends on the Preference Shares - Series A are non-cumulative. Consequently, in the event dividends are not declared on the Preference Shares - Series A for any dividend period, holders of Preference Shares - Series A will not be entitled to receive a dividend for such period, and such undeclared dividend will not accrue and will not be payable. The holders of Preference Shares - Series A will be entitled to receive dividend payments only when, as and if declared by the Company's board of directors or a duly authorized committee of the board of directors. Any such dividends will be payable from, and including, the date of original issue on a non-cumulative basis, quarterly in arrears.
To the extent declared, these dividends will accumulate, with respect to each dividend period, in an amount per share equal to 8.25% of the $25 liquidation preference per annum. During any dividend period, so long as any Preference Shares - Series A remain outstanding, unless the full dividends for the latest completed dividend period on all outstanding Preference Shares - Series A have been declared and paid, no dividend shall be paid or declared on the common shares.
The holders of the Preference Shares - Series A have no voting rights other than the right to elect up to two directors if preference share dividends are not declared and paid for six or more dividend periods. For each of the years ended December 31, 2015, 2014 and 2013, the Company declared and paid dividends on the Preference Shares - Series A of $12,375.
d) Treasury Shares
On February 19, 2014, the Company repurchased 5,851 shares from employees, at a price per share of $11.18, which represents withholdings from employees in respect of tax obligations on the issued vested restricted shares.
On January 1, 2015, February 19, 2015 and March 5, 2015, the Company repurchased 4,954 shares at a price per share of $12.79, 7,658 shares at a price per share of $14.40 and 33,846 shares at a price per share of $14.21, respectively, from employees, which represent withholdings from employees surrendered in respect of tax obligations on the vesting of restricted shares and performance based shares.
e) Accumulated Other Comprehensive (Loss) Income
The following table presents details about amounts reclassified from AOCI:
Details about AOCI Components | Consolidated Statements of Income Line Item that Includes Reclassification | For the Year Ended December 31, | ||||||||||||
Unrealized gains (losses) on AFS securities | 2015 | 2014 | 2013 | |||||||||||
Net realized (losses) gains on investment | $ | 263 | $ | (3,160 | ) | $ | 6,955 | |||||||
Net impairment losses recognized in earnings | — | (102 | ) | — | ||||||||||
Total before tax | 263 | (3,262 | ) | 6,955 | ||||||||||
Income tax expense | — | (16 | ) | (2 | ) | |||||||||
Total after tax | $ | 263 | $ | (3,278 | ) | $ | 6,953 | |||||||
F-39
MAIDEN HOLDINGS, LTD.
NOTES TO CONSOLIDATED FINANCIAL STATEMENTS
(In thousands of U.S. dollars, except share and per share data)
NOTES TO CONSOLIDATED FINANCIAL STATEMENTS
(In thousands of U.S. dollars, except share and per share data)
13. Shareholders’ Equity (continued)
The following tables set forth financial information regarding the changes in the balances of each component of AOCI for the years ended December 31, 2015, 2014 and 2013:
For the Year Ended December 31, 2015 | Change in net unrealized gains on investment | Foreign currency translation adjustments | Total | |||||||||
Beginning balance | $ | 78,579 | $ | 16,665 | $ | 95,244 | ||||||
Other comprehensive (loss) income before reclassifications | (132,428 | ) | 13,566 | (118,862 | ) | |||||||
Amounts reclassified from AOCI to net income, net of tax | (263 | ) | — | (263 | ) | |||||||
Net current period other comprehensive (loss) income | (132,691 | ) | 13,566 | (119,125 | ) | |||||||
Ending balance | (54,112 | ) | 30,231 | (23,881 | ) | |||||||
Less: AOCI attributable to noncontrolling interest | — | (114 | ) | (114 | ) | |||||||
Ending balance, Maiden shareholders | $ | (54,112 | ) | $ | 30,345 | $ | (23,767 | ) | ||||
For the Year Ended December 31, 2014 | Change in net unrealized gains on investment | Foreign currency translation adjustments | Total | |||||||||
Beginning balance | $ | 34,728 | $ | (8,927 | ) | $ | 25,801 | |||||
Other comprehensive income before reclassifications | 40,573 | 25,592 | 66,165 | |||||||||
Amounts reclassified from AOCI to net income, net of tax | 3,278 | — | 3,278 | |||||||||
Net current period other comprehensive income | 43,851 | 25,592 | 69,443 | |||||||||
Ending balance | 78,579 | 16,665 | 95,244 | |||||||||
Less: AOCI attributable to noncontrolling interest | — | (49 | ) | (49 | ) | |||||||
Ending balance, Maiden shareholders | $ | 78,579 | $ | 16,714 | $ | 95,293 | ||||||
For the Year Ended December 31, 2013 | Change in net unrealized gains on investment | Foreign currency translation adjustments | Total | |||||||||
Beginning balance | $ | 143,665 | $ | (2,539 | ) | $ | 141,126 | |||||
Other comprehensive loss before reclassifications | (101,984 | ) | (6,388 | ) | (108,372 | ) | ||||||
Amounts reclassified from AOCI to net income, net of tax | (6,953 | ) | — | (6,953 | ) | |||||||
Net current period other comprehensive loss | (108,937 | ) | (6,388 | ) | (115,325 | ) | ||||||
Ending balance | 34,728 | (8,927 | ) | 25,801 | ||||||||
Less: AOCI attributable to noncontrolling interest | — | 17 | 17 | |||||||||
Ending balance, Maiden shareholders | $ | 34,728 | $ | (8,944 | ) | $ | 25,784 | |||||
14. Share Compensation and Pension Plans
The Company’s Amended and Restated 2007 Share Incentive Plan (the "Plan"), provides for grants of options, restricted common shares and restricted share units. The total number of common shares currently reserved for issuance under the Plan is 10,000,000. The Plan is administered by the Compensation Committee of the Board of Directors (the "Committee").
Share Options
Exercise prices of options are established at or above the fair market value of the Company’s common shares at the date of grant. Under the Plan, unless otherwise determined by the Committee and provided in an award agreement, 25% of the options will become exercisable on the first anniversary of the grant date, with an additional 6.25% of the options vesting each quarter thereafter based on the grantee’s continued employment over a four-year period, and will expire ten years after grant date.
F-40
MAIDEN HOLDINGS, LTD.
NOTES TO CONSOLIDATED FINANCIAL STATEMENTS
(In thousands of U.S. dollars, except share and per share data)
NOTES TO CONSOLIDATED FINANCIAL STATEMENTS
(In thousands of U.S. dollars, except share and per share data)
14. Share Compensation and Pension Plans (continued)
The fair value of each option grant is separately estimated for each vesting date. The fair value of each option is amortized into compensation expense on a straight-line basis between the grant date for the award and each vesting date. The Company has estimated the fair value of all share option awards on the date of the grant by applying the Black-Scholes-Merton multiple-option pricing valuation model. The application of this valuation model involves assumptions that are judgmental and highly sensitive in the determination of compensation expense.
The key assumptions used in determining the fair value of options granted in 2015, 2014 and 2013 and a summary of the methodology applied to develop each assumption were as follows:
2015 | 2014 | 2013 | |||||||
Assumptions: | |||||||||
Volatility | 37.60 | % | 51.40 | % | 45.30 – 51.40 | % | |||
Risk-free interest rate | 1.55 | % | 1.77 | % | 0.85 – 1.77 | % | |||
Weighted average expected lives in years | 5.5 years | 6.1 years | 6.1 years | ||||||
Forfeiture rate | 2.16 | % | 3.45 | % | 1.60 – 3.45 | % | |||
Dividend yield rate | 4.05 | % | 3.46 | % | 3.46 – 3.55 | % | |||
Expected Price Volatility — This is a measure of the amount by which a price has fluctuated or is expected to fluctuate. Maiden began trading on May 6, 2008, thus, has a maximum of 7.6 years trading history for estimating historical volatility. Maiden's expected volatility for 2015 of 37.6% was based on the average of the implied volatility and its historical volatility, commensurate with the expected life of the options.
Risk-Free Interest Rate — This is based on the yields on U.S. Treasury constant maturity notes with a term equal to the expected life of the option. An increase in the risk-free interest rate will increase compensation expense.
Expected Lives — This is the period of time over which the options granted are expected to remain outstanding giving consideration to vesting schedules, historical exercise and forfeiture patterns. The Company uses the simplified method outlined in SEC Staff Accounting Bulletin Codification Topic 14 (SAB 14) to estimate expected lives for options granted during the period as there is insufficient observed option exercise and forfeiture behavior from which to base an estimate of the expected life. Options granted have a maximum term of ten years. An increase in the expected life will increase compensation expense.
Forfeiture Rate — This is the estimated percentage of options granted that are expected to be forfeited or cancelled before becoming fully vested. An increase in the forfeiture rate will decrease compensation expense.
Dividend Yield — This is calculated by dividing the expected annual dividend by the share price of the Company at the valuation date. An increase in the dividend yield will decrease compensation expense.
F-41
MAIDEN HOLDINGS, LTD.
NOTES TO CONSOLIDATED FINANCIAL STATEMENTS
(In thousands of U.S. dollars, except share and per share data)
NOTES TO CONSOLIDATED FINANCIAL STATEMENTS
(In thousands of U.S. dollars, except share and per share data)
14. Share Compensation and Pension Plans (continued)
The following table shows all options granted, exercised, expired and exchanged under the Plan for the years ended December 31, 2015, 2014 and 2013:
Number of Share Options | Weighted Average Exercise Price | Weighted Average Grant-Date Fair Value | Weighted Average Remaining Contractual Term | Aggregate Intrinsic Value | Range of Exercise Prices | |||||||||||||
Outstanding, December 31, 2012 | 2,795,437 | $ | 6.70 | 6.75 years | $ | 7,271 | $3.28 – 10.00 | |||||||||||
Granted | 49,000 | $ | 10.61 | $ | 2.80 | $9.99 - 11.22 | ||||||||||||
Exercised | (289,614 | ) | $ | 6.13 | $ | 1,397 | ||||||||||||
Expired | (691 | ) | $ | 7.67 | ||||||||||||||
Forfeited | (114,719 | ) | $ | 8.51 | ||||||||||||||
Outstanding, December 31, 2013 | 2,439,413 | $ | 6.76 | 5.75 years | $ | 10,174 | $3.28 - 11.22 | |||||||||||
Granted | 45,000 | $ | 12.01 | $ | 4.28 | $11.38 - 12.42 | ||||||||||||
Exercised | (120,596 | ) | $ | 4.91 | $ | 930 | ||||||||||||
Forfeited | (842 | ) | $ | 7.74 | ||||||||||||||
Outstanding, December 31, 2014 | 2,362,975 | $ | 6.95 | 4.86 years | $ | 13,791 | $3.28 - 12.42 | |||||||||||
Granted | 24,000 | $ | 13.98 | $ | 3.31 | 13.98 | ||||||||||||
Exercised | (456,776 | ) | $ | 7.27 | $ | 3,521 | ||||||||||||
Expired | (3,442 | ) | $ | 8.61 | ||||||||||||||
Forfeited | (558 | ) | $ | 9.00 | ||||||||||||||
Outstanding, December 31, 2015 | 1,926,199 | $ | 6.96 | 4.15 years | $ | 15,306 | $3.28 - 13.98 | |||||||||||
Total exercisable at December 31, 2015 | 1,874,855 | $ | 6.82 | 3.99 years | $ | 15,171 | $3.28 - 12.42 | |||||||||||
The weighted average grant date fair value was $2.13, $2.11 and $2.03 for all options outstanding at December 31, 2015, 2014 and 2013, respectively. There was $125 (2014 - $235) of total unrecognized compensation cost related to non-vested options at December 31, 2015 which will be recognized during the next 1.08 years. Cash in the amount of $3,318 was received from employees as a result of employee share option exercises during the year ended December 31, 2015 (2014 – $592, 2013 – $1,776). The Company issues new common shares upon the exercise of an option. In connection with these exercises, there was no tax benefit realized by the Company.
Restricted Shares and Share Units
The fair value of each restricted share or share unit is determined based on the market value of the Company's common shares on the date of grant. The total estimated fair value is amortized as an expense on a straight-line basis over the requisite service period as determined by the Committee.
Performance-Based Restricted Share Units
The Committee approved the formation of a long-term incentive program under the Plan on March 1, 2011. On that date, the Committee determined to award PB-RSUs to certain senior leaders of the Company. The formula for determining the amount of PB-RSUs awarded uses a combination of a percentage of the employee's base salary (based on a benchmarking analysis from our compensation consultant) divided by the closing price on NASDAQ of our common shares on that date. The grants are performance based which require that certain criteria such as operating return on common equity, underwriting performance, revenue growth and operating expense be met during the performance period to attain a payout. Each metric has a corresponding weighted percentage with a target and maximum level of performance goal set to achieve a payout. All prior, current and future PB-RSUs are paid 50% based on certain criteria stated above, while the other 50% of the payout is based upon the recommendation of the Company's CEO and the Committee's ultimate discretion of individual contribution to business results and strategic success for the performance period. Settlement of the grants can be made in either common shares or cash upon the decision of the Committee and the performance cycles are for three years.
Effective February 19, 2013, February 18, 2014 and February 17, 2015, the Committee approved the award of PB-RSUs to certain senior leaders of the Company for the fiscal years 2013-2015, 2014-2016 and 2015-2017, respectively.
F-42
MAIDEN HOLDINGS, LTD.
NOTES TO CONSOLIDATED FINANCIAL STATEMENTS
(In thousands of U.S. dollars, except share and per share data)
NOTES TO CONSOLIDATED FINANCIAL STATEMENTS
(In thousands of U.S. dollars, except share and per share data)
14. Share Compensation and Pension Plans (continued)
CEO Non-Performance-Based Restricted Share Units
On February 19, 2013, the Committee approved an award of NPB-RSUs to the Company's CEO with one-third automatically vested on February 19, 2014, a further one-third automatically vested on February 19, 2015, and the final one-third will automatically vest on February 19, 2016. The total fair value of the share units vested for the year ended December 31, 2015 was $500 (2014 - $500, 2013 - $0).
On February 18, 2014, the Committee approved an award of NPB-RSUs to the Company's CEO with one-third automatically vested on December 31, 2014, and on December 31, 2015, respectively, and the final one-third will automatically vest on December 31, 2016. The total fair value of the share units vested for the year ended December 31, 2015 was $266 (2014 - $266).
On February 17, 2015, the Committee approved an award of NPB-RSUs to the Company's CEO with one-third automatically vested on February 17, 2016, and on February 17, 2017, respectively, and the final one-third will automatically vest on February 17, 2018.
Non-CEO Discretionary Non-Performance-Based Restricted Shares ("NPB-RSs")
On February 19, 2013, pursuant to the Plan, the Committee approved an award of NPB-RSs to certain senior leaders of the Company. 50% of which vested on the first anniversary of the grant date, with an additional 50% due to vest on the second anniversary of the grant date. The total fair value of restricted shares which vested during the year ended December 31, 2015 was $479 (2014 - $479).
On February 18, 2014, pursuant to the Plan, the Committee approved an award of NPB-RSs to non-CEO named executive officers and senior leaders of the Company, 50% of which will vest on January 1, 2015, with an additional 50% due to vest on January 1, 2016. The total fair value of restricted shares which vested during the year ended December 31, 2015 was $219 (2014 - $0).
On February 17, 2015 and March 18, 2015, pursuant to the Plan, the Committee approved an award of NPB-RSs to non-CEO named executive officers and senior leaders of the Company, with some vesting over 2 years and some vesting over 3 years from the date of grant.
The following schedule shows the summary of activity under the Company's restricted awards:
CEO Non-Performance-Based Restricted Share Units | Non-CEO Non-Performance-Based Restricted Shares | Performance Based Restricted Share Units1 | |||||||||||||||||||
Number of Restricted Units | Weighted Average Grant-Date Fair Value | Number of Restricted Shares | Weighted Average Grant-Date Fair Value | Number of Restricted Units | Weighted Average Grant-Date Fair Value | ||||||||||||||||
Non-vested at December 2012 | 86,705 | $ | 8.56 | — | $ | — | 860,506 | $ | 8.34 | ||||||||||||
Awards granted | 149,701 | $ | 10.02 | 95,590 | $ | 10.02 | 359,652 | $ | 10.02 | ||||||||||||
Awards vested | (86,705 | ) | $ | 8.56 | — | $ | — | — | $ | — | |||||||||||
Awards forfeited | — | $ | — | — | $ | — | (466,296 | ) | $ | 8.31 | |||||||||||
Non-vested December 31, 2013 | 149,701 | $ | 10.02 | 95,590 | $ | 10.02 | 753,862 | $ | 9.21 | ||||||||||||
Awards granted | 70,298 | $ | 11.38 | 38,522 | $ | 11.38 | 396,672 | $ | 11.38 | ||||||||||||
Awards vested | (73,333 | ) | $ | 10.45 | (47,795 | ) | $ | 10.02 | (100,308 | ) | $ | 8.56 | |||||||||
Awards forfeited | — | $ | — | — | $ | — | (242,456 | ) | $ | 8.56 | |||||||||||
Non-vested at December 31, 2014 | 146,666 | $ | 10.45 | 86,317 | $ | 10.63 | 807,770 | $ | 10.51 | ||||||||||||
Awards granted | 64,795 | $ | 13.89 | 38,180 | $ | 13.94 | 291,730 | $ | 13.89 | ||||||||||||
Awards vested | (73,333 | ) | $ | 10.45 | (67,061 | ) | $ | 10.41 | (188,681 | ) | $ | 9.54 | |||||||||
Awards forfeited | — | $ | — | (4,284 | ) | $ | 11.38 | (165,337 | ) | $ | 10.61 | ||||||||||
Non-vested at December 31, 2015 | 138,128 | $ | 12.07 | 53,152 | $ | 13.22 | 745,482 | $ | 12.05 | ||||||||||||
1) For Performance Shares, the number of shares is stated at the maximum number that can be attained if the performance conditions are met. Forfeitures represent shares forfeited due to vesting below the maximum attainable as a result of the Company not fully meeting the performance conditions.
F-43
MAIDEN HOLDINGS, LTD.
NOTES TO CONSOLIDATED FINANCIAL STATEMENTS
(In thousands of U.S. dollars, except share and per share data)
NOTES TO CONSOLIDATED FINANCIAL STATEMENTS
(In thousands of U.S. dollars, except share and per share data)
14. Share Compensation and Pension Plans (continued)
There was $975 and $352 of total unrecognized compensation cost related to RSUs and restricted shares at December 31, 2015, both of which will be recognized during the next 1.68 years and 1.82 years, respectively.
The adoption of ASC Topic 718 "Compensation - Stock Compensation" fair value method has resulted in share-based expense in the amount of $2,938, $3,334 and $2,205 for the years ended December 31, 2015, 2014 and 2013, respectively.
Pension Plans
The Company provides pension benefits to eligible employees principally through various defined contribution plans sponsored by the Company which vary for each subsidiary. The Company’s expenses for its defined contribution plans were $1,740, $2,809 and $2,892 for the years ended December 31, 2015, 2014 and 2013, respectively.
15. Taxation
Under current Bermuda law, Maiden Holdings and Maiden Bermuda, have received an undertaking from the Bermuda government exempting them from all local income, withholding and capital gains taxes until March 31, 2035. At the present time, no such taxes are levied in Bermuda. Maiden Holdings and Maiden Bermuda believe that they operate in a manner such that they will not be considered to be engaged in a trade or business in the U.S. Accordingly, Maiden Holdings and Maiden Bermuda have not recorded any provision for U.S. taxation.
Our U.S. subsidiaries are subject to federal, state and local corporate income taxes and other taxes applicable to U.S. corporations. The provision for federal income taxes has been determined under the principles of the consolidated tax provisions of the U.S. Internal Revenue Code and Regulations. Should our U.S. subsidiaries pay a dividend outside the U.S. group, withholding taxes will apply. During 2015 the Internal Revenue Service completed its audit of our U.S. subsidiaries for tax years 2009, 2010 and 2011. The audit has been closed without any impact on our operations. Tax years 2012, 2013 and 2014 are not under examination but remain subject to examination in the U.S.
The Company has subsidiary operations in various other locations around the world, including Australia, Austria, Germany, Ireland, Netherlands, Russia, Sweden and the U.K., that are subject to relevant taxes in those jurisdictions. These subsidiaries, are not under examination, but generally remain subject to examination in all applicable jurisdictions for tax years from 2011 through 2014.
Deferred income taxes have not been accrued with respect to certain undistributed earnings of foreign subsidiaries as it is the intention that such earnings will remain reinvested or will not be taxable. If the earnings were to be distributed, as dividends or otherwise, such amounts may be subject to withholding tax in the country of the paying entity. Currently, however, no withholding taxes have been accrued.
There were no unrecognized tax benefits at December 31, 2015, 2014 and 2013. Income before taxes and income tax expense for the years ended December 31, 2015, 2014 and 2013 was as follows:
For the Year Ended December 31, | 2015 | 2014 | 2013 | |||||||||
Income before income taxes – Domestic (Bermuda) | $ | 134,012 | $ | 117,780 | $ | 125,926 | ||||||
Loss before income taxes – Foreign (U.S. and others) | (7,690 | ) | (14,083 | ) | (21,207 | ) | ||||||
Total income before income taxes | $ | 126,322 | $ | 103,697 | $ | 104,719 | ||||||
Current tax expense – Domestic (Bermuda) | $ | — | $ | — | $ | — | ||||||
Current tax expense – Foreign (U.S. and others) | 780 | 945 | 873 | |||||||||
Total current tax expense | 780 | 945 | 873 | |||||||||
Deferred tax expense – Domestic (Bermuda) | — | — | — | |||||||||
Deferred tax expense – Foreign (U.S. and others) | 1,258 | 1,219 | 990 | |||||||||
Total deferred tax expense | 1,258 | 1,219 | 990 | |||||||||
Total income tax expense | $ | 2,038 | $ | 2,164 | $ | 1,863 | ||||||
F-44
MAIDEN HOLDINGS, LTD.
NOTES TO CONSOLIDATED FINANCIAL STATEMENTS
(In thousands of U.S. dollars, except share and per share data)
NOTES TO CONSOLIDATED FINANCIAL STATEMENTS
(In thousands of U.S. dollars, except share and per share data)
15. Taxation
The following table is a reconciliation of the actual income tax rate for the years ended December 31, 2015, 2014 and 2013 to the amount computed by applying the effective tax rate of 0.0% under Bermuda law to income before income taxes:
For the Year Ended December 31, | 2015 | 2014 | 2013 | |||||||||
Income before income taxes | $ | 126,322 | $ | 103,697 | $ | 104,719 | ||||||
Income tax expense | 2,038 | 2,164 | 1,863 | |||||||||
Net income | $ | 124,284 | $ | 101,533 | $ | 102,856 | ||||||
Reconciliation of effective tax rate (% of income before income taxes) | ||||||||||||
Bermuda tax rate | — | % | — | % | — | % | ||||||
U.S. taxes at statutory rates | (2.2 | )% | (7.3 | )% | (8.7 | )% | ||||||
Valuation allowance in respect of U.S. taxes | 3.2 | % | 8.5 | % | 9.8 | % | ||||||
Other jurisdictions | 0.6 | % | 0.9 | % | 0.7 | % | ||||||
Actual tax rate | 1.6 | % | 2.1 | % | 1.8 | % | ||||||
Deferred income taxes reflect the tax impact of temporary differences between the carrying amounts of assets and liabilities for financial reporting and income tax purposes. The significant components of our deferred tax assets and liabilities at December 31, 2015 and 2014 were as follows:
December 31, | 2015 | 2014 | ||||||
Deferred tax assets: | ||||||||
Net operating losses | $ | 60,147 | $ | 54,524 | ||||
Unearned premiums | 9,459 | 8,860 | ||||||
Discounting of net loss and LAE reserves | 11,756 | 12,250 | ||||||
Net unrealized losses on investments | 4,374 | — | ||||||
Accruals not currently deductible | 109 | 1,994 | ||||||
Amortization of intangibles | 2,796 | 3,021 | ||||||
OTTI | 1,198 | 827 | ||||||
Others | 543 | 1,043 | ||||||
Deferred tax assets before valuation allowance | 90,382 | 82,519 | ||||||
Valuation allowance | 78,845 | 65,743 | ||||||
Deferred tax assets, net | 11,537 | 16,776 | ||||||
Deferred tax liabilities: | ||||||||
Deferred commission and other acquisition expenses | 10,664 | 10,119 | ||||||
Indefinite lived intangible | 1,750 | 2,870 | ||||||
Amortization of goodwill | 8,319 | 7,158 | ||||||
Net unrealized gains on investment | — | 4,831 | ||||||
Others | 866 | 1,789 | ||||||
Deferred tax liabilities | 21,599 | 26,767 | ||||||
Net deferred tax liability | $ | 10,062 | $ | 9,991 | ||||
The net deferred tax liability at December 31, 2015 was $10,062 (2014 - $9,991). A valuation allowance has been established against the net U.S. deferred tax assets which is primarily attributable to net operating losses, unearned premium and loss reserve discounting. At this time, we believe it is necessary to establish a valuation allowance against the net deferred tax assets due to insufficient positive evidence regarding the utilization of these losses. During 2015, the Company recorded an increase in the valuation allowance of $13,102 (2014 - decrease of $1,270). At December 31, 2015, the Company has an available U.S. net operating loss carry-forward of approximately $171,848 (2014 - $155,782) for income tax purposes which expires beginning in 2029.
F-45
MAIDEN HOLDINGS, LTD.
NOTES TO CONSOLIDATED FINANCIAL STATEMENTS
(In thousands of U.S. dollars, except share and per share data)
NOTES TO CONSOLIDATED FINANCIAL STATEMENTS
(In thousands of U.S. dollars, except share and per share data)
16. Statutory Requirements and Dividend Restrictions
Our insurance and reinsurance operations are subject to insurance and/or reinsurance laws and regulations in the jurisdictions in which they operate, the most significant of which are Bermuda, the United States and Sweden. These regulations include certain liquidity and solvency requirements whereby restrictions are imposed on the amount of dividends or other distributions, such as loans or cash advances, available to shareholders without prior approval of the insurance regulatory authorities.
The combined statutory capital and combined statutory net income (loss) of our principal operating subsidiaries in their respective jurisdictions were as follows:
Maiden Bermuda | Maiden US | Maiden LF | ||||||||||
Statutory Capital and Surplus | ||||||||||||
December 31, 2015 | $ | 1,813,766 | $ | 294,338 | $ | 7,601 | ||||||
December 31, 2014 | 1,289,155 | 289,224 | 8,705 | |||||||||
Statutory Net Income (Loss) | ||||||||||||
For the Year Ended December 31, 2015 | $ | 146,027 | $ | 17,439 | $ | (737 | ) | |||||
For the Year Ended December 31, 2014 | 60,016 | 16,614 | 651 | |||||||||
For the Year Ended December 31, 2013 | 109,326 | (1,305 | ) | 340 | ||||||||
At December 31, 2015, the Company's net assets were $1,349,099 (2014 - $1,241,166), of which $724,480 (2014 - $718,050) are restricted primarily as a result of solvency and liquidity requirements imposed on the Company's insurance subsidiaries by local regulators as well as collateral requirements under various reinsurance agreements.
a) Bermuda
The Bermuda Monetary Authority ("BMA") is the group supervisor of the Company and has advised that Maiden Bermuda is the designated insurer. These regulations require that a group’s available statutory capital and surplus should be equal to or exceed the value of both its Minimum Solvency Margin ("MSM") and the Enhanced Capital Requirement ("ECR"). At December 31, 2015, the Company's ECR is 70% of the amount calculated using the group Bermuda Solvency Requirement ("BSCR") model of the BMA. The Company has complied with its regulatory capital requirements at December 31, 2015.
Maiden Bermuda is registered as a Class 3B reinsurer under The Insurance Act 1978 (Bermuda), amendments thereto and related regulations (the "Insurance Act") and is required to prepare and file Statutory Financial Statements and a Statutory Financial Return with the BMA. For Bermuda registered insurance companies, there are some differences between financial statements prepared in accordance with U.S. GAAP and those prepared on a statutory basis. Certain assets are non-admitted under Bermuda regulations and are removed from the statutory balance sheet.
Under the Insurance Act, Maiden Bermuda is required to maintain a minimum share capital of $120 and a minimum statutory capital and surplus equal to the greater of MSM and the ECR. ECR is established by reference to the BSCR model. The BSCR employs a standard mathematical model that correlates the risk underwritten to the capital that is dedicated to the business. The regulatory requirements are designed to have insurers operate at or above a threshold capital level, which exceeds the BSCR. The BMA has established a target capital level ("TCL") for each Class 3B insurer equal to 120% of its ECR which serves as an early warning tool for the BMA and failure to maintain statutory capital of at least equal to the TCL will likely result in increased BMA regulatory oversight.
The statutory capital and surplus of Maiden Bermuda at December 31, 2015 was $1,813,766 (2014 - $1,289,155) and the amount required to be maintained was $314,056 at December 31, 2015 (2014 - $302,341). Maiden Bermuda is also required to maintain a minimum liquidity ratio. All requirements were met by Maiden Bermuda throughout the period.
Maiden Bermuda is prohibited from declaring or paying dividends of more than 25% of its total statutory capital and surplus, as shown in its previous financial year statutory balance sheet, unless at least seven days before payment of the dividends it files with the BMA an affidavit that it will continue to meet its minimum capital requirements as described above. In addition, Maiden Bermuda must obtain the BMA’s prior approval before reducing its total statutory capital, as shown in its previous financial year statutory balance sheet, by 15% or more. Maiden Bermuda is also restricted in paying dividends that would result in Maiden Bermuda failing to comply with the ECR as calculated based on the BSCR or cause Maiden Bermuda to fail to meet its relevant margins. Based upon the BSCR calculation, Maiden Bermuda is allowed to pay dividends or distributions not exceeding $322,289.
F-46
MAIDEN HOLDINGS, LTD.
NOTES TO CONSOLIDATED FINANCIAL STATEMENTS
(In thousands of U.S. dollars, except share and per share data)
NOTES TO CONSOLIDATED FINANCIAL STATEMENTS
(In thousands of U.S. dollars, except share and per share data)
16. Statutory Requirements and Dividend Restrictions (continued)
b) United States
Maiden US files financial statements in accordance with statutory accounting practices ("SAP") prescribed or permitted by state insurance regulatory authorities. The minimum statutory capital and surplus necessary to satisfy regulatory requirements for Maiden US for the year ended December 31, 2015 were $78,100 (2014 - $82,267). These requirements were met by Maiden US throughout the year ended December 31, 2015. Without prior approval of its domiciliary commissioner, dividends to shareholders are limited by the laws of the company's state of domicile, Missouri to the greater of 10% of statutory policyholders’ surplus at the preceding December 31, or net income, less net realized capital gain on investments, for the 12-month period ending December 31 of the preceding year. Additionally, Maiden US may only pay dividends if it has positive unassigned funds. Accordingly, the maximum dividend payments that can be made to shareholders in the next year without prior approval by the Missouri Department of Insurance is $0.
c) Sweden
The Company’s insurance subsidiary in Sweden, Maiden LF, is regulated by the Swedish Finansinspektionen ("Swedish FSA"). Maiden LF was required to maintain a minimum level of statutory capital and surplus of $4,019 at December 31, 2015 (2014 - $4,477). This requirement was met by Maiden LF throughout the year. Maiden LF is subject to statutory and regulatory restrictions under the Swedish FSA that limit the maximum amount of annual dividends or distributions paid by Maiden LF to Maiden Holdings. At December 31, 2015, Maiden LF is allowed to pay dividends or distributions not exceeding $2,178 (2014 - $2,508)
17. Subsequent Events
Dividends
On February 15, 2016, the Company's Board of Directors authorized the following quarterly dividends:
Dividend per Share | Payable on: | Record date: | ||||||
Common shares | $ | 0.14 | April 15, 2016 | April 1, 2016 | ||||
Preference shares - Series A | $ | 0.515625 | March 15, 2016 | March 1, 2016 | ||||
Preference shares - Series B | $ | 0.90625 | March 15, 2016 | March 1, 2016 | ||||
Preference shares - Series C | $ | 0.544271 | March 15, 2016 | March 1, 2016 | ||||
F-47
MAIDEN HOLDINGS, LTD.
NOTES TO CONSOLIDATED FINANCIAL STATEMENTS
(In thousands of U.S. dollars, except share and per share data)
NOTES TO CONSOLIDATED FINANCIAL STATEMENTS
(In thousands of U.S. dollars, except share and per share data)
18. Condensed Quarterly Financial Data — Unaudited
The following tables summarize our quarterly financial data:
2015 Quarters Ended | March 31 | June 30 | September 30 | December 31 | ||||||||||||
Total revenues | $ | 611,427 | $ | 647,071 | $ | 693,696 | $ | 620,917 | ||||||||
Net income | 38,534 | 26,511 | 28,515 | 30,724 | ||||||||||||
Net income attributable to Maiden common shareholders | 32,405 | 20,519 | 22,499 | 24,716 | ||||||||||||
Comprehensive income (loss) - attributable to Maiden | 50,694 | (39,962 | ) | 10,658 | (15,974 | ) | ||||||||||
Basic earnings per common share attributable to Maiden common shareholders | $ | 0.44 | $ | 0.28 | $ | 0.31 | $ | 0.34 | ||||||||
Diluted earnings per common share attributable to Maiden common shareholders | $ | 0.41 | $ | 0.27 | $ | 0.30 | $ | 0.32 | ||||||||
2014 Quarters Ended | March 31 | June 30 | September 30 | December 31 | ||||||||||||
Total revenues | $ | 552,322 | $ | 563,422 | $ | 623,506 | $ | 641,917 | ||||||||
Net income | 2,061 | 31,915 | 33,926 | 33,631 | ||||||||||||
Net (loss) income attributable to Maiden common shareholders | (4,062 | ) | 25,804 | 27,798 | 27,514 | |||||||||||
Comprehensive income - attributable to Maiden | 39,816 | 86,260 | 3,176 | 41,648 | ||||||||||||
Basic (loss) earnings per common share attributable to Maiden common shareholders | $ | (0.06 | ) | $ | 0.35 | $ | 0.38 | $ | 0.38 | |||||||
Diluted (loss) earnings per common share attributable to Maiden common shareholders | $ | (0.06 | ) | $ | 0.34 | $ | 0.36 | $ | 0.36 | |||||||
F-48
Schedule I
MAIDEN HOLDINGS, LTD.
SUMMARY OF INVESTMENTS
OTHER THAN INVESTMENTS IN RELATED PARTIES
(in thousands of U.S. dollars)
SUMMARY OF INVESTMENTS
OTHER THAN INVESTMENTS IN RELATED PARTIES
(in thousands of U.S. dollars)
December 31, 2015 | Amortized Cost* | Fair Value | Amount at Which Shown in the Balance Sheet | |||||||||
AFS fixed maturities: | ||||||||||||
U.S. treasury bonds | $ | 5,714 | $ | 6,010 | $ | 6,010 | ||||||
U.S. agency bonds – mortgage-backed | 1,471,782 | 1,476,991 | 1,476,991 | |||||||||
U.S. agency bonds – other | 23,734 | 24,311 | 24,311 | |||||||||
Non-U.S. government and supranational bonds | 35,128 | 30,544 | 30,544 | |||||||||
Asset-backed securities | 165,719 | 165,804 | 165,804 | |||||||||
Corporate bonds | 1,798,610 | 1,739,668 | 1,739,668 | |||||||||
Municipal bonds | 62,177 | 64,760 | 64,760 | |||||||||
Total AFS fixed maturities | 3,562,864 | 3,508,088 | 3,508,088 | |||||||||
HTM fixed maturities: | ||||||||||||
Corporate bonds | 607,843 | 598,975 | 607,843 | |||||||||
Total HTM fixed maturities | 607,843 | 598,975 | 607,843 | |||||||||
Other investments | 10,816 | 11,812 | 11,812 | |||||||||
Total investments | $ | 4,181,523 | $ | 4,118,875 | $ | 4,127,743 | ||||||
* Original cost of other investments and, for fixed maturities, original cost reduced by repayments and adjusted for amortization of premiums or discounts
S-1
Schedule II
MAIDEN HOLDINGS, LTD.
CONDENSED BALANCE SHEETS — PARENT COMPANY
As of December 31, 2015 and 2014
CONDENSED BALANCE SHEETS — PARENT COMPANY
As of December 31, 2015 and 2014
(In thousands of U.S. dollars, except share and per share data)
2015 | 2014 | |||||||
Assets | ||||||||
Fixed maturities, available-for-sale, at fair value (Amortized cost 2015: $42,774; 2014: $43,995) | $ | 40,189 | $ | 44,270 | ||||
Other investments, at fair value (Cost 2015: $5,000; 2014: $5,000) | 4,905 | 5,990 | ||||||
Cash and cash equivalents | 3,606 | 6,894 | ||||||
Investment in subsidiaries | 1,736,707 | 1,591,000 | ||||||
Balances due from subsidiaries | 120,100 | 99,809 | ||||||
Other assets | 1,123 | 1,387 | ||||||
Total assets | $ | 1,906,630 | $ | 1,749,350 | ||||
Liabilities | ||||||||
Accrued expenses and other liabilities | $ | 12,217 | $ | 11,226 | ||||
Balances due to subsidiaries | 546,592 | 497,430 | ||||||
Total liabilities | 558,809 | 508,656 | ||||||
Shareholders’ equity | ||||||||
Preference shares | 480,000 | 315,000 | ||||||
Common shares ($0.01 par value; 74,735,785 and 73,900,889 shares issued in 2015 and 2014, respectively; 73,721,140 and 72,932,702 shares outstanding in 2015 and 2014, respectively) | 747 | 739 | ||||||
Additional paid-in capital | 579,178 | 578,445 | ||||||
Accumulated other comprehensive income | (23,767 | ) | 95,293 | |||||
Retained earnings | 316,184 | 255,084 | ||||||
Treasury shares, at cost (1,014,645 and 968,187 shares in 2015 and 2014, respectively) | (4,521 | ) | (3,867 | ) | ||||
Total shareholders’ equity | 1,347,821 | 1,240,694 | ||||||
Total liabilities and shareholders’ equity | $ | 1,906,630 | $ | 1,749,350 | ||||
S-2
Schedule II
MAIDEN HOLDINGS, LTD.
CONDENSED STATEMENTS OF INCOME AND COMPREHENSIVE INCOME — PARENT COMPANY
For the Years Ended December 31, 2015, 2014 and 2013
(In thousands of U.S. dollars)
CONDENSED STATEMENTS OF INCOME AND COMPREHENSIVE INCOME — PARENT COMPANY
For the Years Ended December 31, 2015, 2014 and 2013
(In thousands of U.S. dollars)
For the Year Ended December 31, | 2015 | 2014 | 2013 | |||||||||
Revenues | ||||||||||||
Net investment income | $ | 2,034 | $ | 4,892 | $ | 2,773 | ||||||
Net realized gains on investment | 20 | 981 | — | |||||||||
Other fee revenue | 1,321 | — | — | |||||||||
3,375 | 5,873 | 2,773 | ||||||||||
Expenses | ||||||||||||
General and administrative expenses | 16,319 | 14,588 | 11,732 | |||||||||
Foreign exchange losses (gains) | 668 | 893 | (626 | ) | ||||||||
16,987 | 15,481 | 11,106 | ||||||||||
Loss before equity in earnings of consolidated subsidiaries | (13,612 | ) | (9,608 | ) | (8,333 | ) | ||||||
Equity in earnings of consolidated subsidiaries | 138,088 | 110,999 | 111,068 | |||||||||
Net income | 124,476 | 101,391 | 102,735 | |||||||||
Dividends on preference shares | (24,337 | ) | (24,337 | ) | (14,834 | ) | ||||||
Net income attributable to Maiden common shareholders | $ | 100,139 | $ | 77,054 | $ | 87,901 | ||||||
Comprehensive income (loss) attributable to Maiden | $ | 5,416 | $ | 170,900 | $ | (12,611 | ) | |||||
S-3
Schedule II
MAIDEN HOLDINGS, LTD.
CONDENSED STATEMENTS OF CASH FLOWS — PARENT COMPANY
For the Years Ended December 31, 2015, 2014 and 2013
(In thousands of U.S. dollars)
CONDENSED STATEMENTS OF CASH FLOWS — PARENT COMPANY
For the Years Ended December 31, 2015, 2014 and 2013
(In thousands of U.S. dollars)
For the Year Ended December 31, | 2015 | 2014 | 2013 | |||||||||
Cash flows provided by operating activities | ||||||||||||
Net income | $ | 124,476 | $ | 101,391 | $ | 102,735 | ||||||
Adjustments to reconcile net income to net cash provided by operating activities: | ||||||||||||
Equity in earnings of consolidated subsidiaries | (138,088 | ) | (110,999 | ) | (111,068 | ) | ||||||
Amortization of bond premium and discount | 222 | 414 | 1,209 | |||||||||
Net realized gains on investment | (20 | ) | (981 | ) | — | |||||||
Foreign exchange losses (gains) | 668 | 893 | (626 | ) | ||||||||
Non-cash share compensation expense | 2,938 | 3,334 | 2,205 | |||||||||
Changes in assets - (increase) decrease: | ||||||||||||
Balance due from subsidiaries | (20,930 | ) | (87,605 | ) | 42,899 | |||||||
Other assets | 237 | 536 | (862) | |||||||||
Changes in liabilities - increase (decrease) | ||||||||||||
Accounts payable and accrued liabilities | 12 | (138 | ) | 736 | ||||||||
Balances due to subsidiaries | 49,162 | 120,069 | 16,642 | |||||||||
Net cash provided by operating activities | 18,677 | 26,914 | 53,870 | |||||||||
Cash flows used in investing activities | ||||||||||||
Purchases of fixed-maturities – available-for-sale | — | (1,340 | ) | (170,882 | ) | |||||||
Purchases of other investments | — | (5,000 | ) | — | ||||||||
Proceeds from sales of fixed-maturities – available-for-sale | 1,041 | 87,032 | 90,515 | |||||||||
Proceeds from maturities and calls of fixed maturities | — | 6,857 | 46,208 | |||||||||
Investment in subsidiaries | (122,757 | ) | (84,740 | ) | (116,807 | ) | ||||||
Net cash (used in) provided by investing activities | (121,716 | ) | 2,809 | (150,966 | ) | |||||||
Cash flows used in financing activities | ||||||||||||
Preference shares issuance, net of issuance costs | 159,628 | — | 159,675 | |||||||||
Dividends paid - preference shares | (24,337 | ) | (24,337 | ) | (14,834 | ) | ||||||
Dividends paid - Maiden common shareholders | (38,204 | ) | (32,079 | ) | (19,607 | ) | ||||||
Issuance of common shares | 3,318 | 592 | 1,776 | |||||||||
Repurchase of common shares | (654 | ) | (66 | ) | — | |||||||
Net cash provided by (used in) financing activities | 99,751 | (55,890 | ) | 127,010 | ||||||||
Net (decrease) increase in cash and cash equivalents | (3,288 | ) | (26,167 | ) | 29,914 | |||||||
Cash and cash equivalents, beginning of year | 6,894 | 33,061 | 3,147 | |||||||||
Cash and cash equivalents, end of year | $ | 3,606 | $ | 6,894 | $ | 33,061 | ||||||
S-4
Schedule III
MAIDEN HOLDINGS, LTD.
SUPPLEMENTARY INSURANCE INFORMATION
(In thousands of U.S. dollars)
SUPPLEMENTARY INSURANCE INFORMATION
(In thousands of U.S. dollars)
December 31, 2015 | For the Year Ended December 31, 2015 | ||||||||||||||||||||||||||||||||||
Deferred commission and other acquisition expenses | Reserve for loss and loss adjustment expenses | Unearned premiums | Net premiums earned | Net investment income | Net loss and loss adjustment expenses | Amortization of deferred commission and other acquisition expenses | General and admin. expenses | Net premiums written | |||||||||||||||||||||||||||
Diversified Reinsurance | $ | 80,012 | $ | 1,046,471 | $ | 277,460 | $ | 744,875 | $ | — | $ | 547,296 | $ | 196,292 | $ | 37,550 | $ | 734,781 | |||||||||||||||||
AmTrust Reinsurance | 317,536 | 1,420,418 | 1,077,112 | 1,684,191 | — | 1,074,072 | 527,863 | 2,947 | 1,779,334 | ||||||||||||||||||||||||||
Total - Reportable Segments | 397,548 | 2,466,889 | 1,354,572 | 2,429,066 | — | 1,621,368 | 724,155 | 40,497 | 2,514,115 | ||||||||||||||||||||||||||
Other | — | 43,212 | — | 3 | 131,092 | 12,202 | 42 | 24,375 | 1 | ||||||||||||||||||||||||||
Total | $ | 397,548 | $ | 2,510,101 | $ | 1,354,572 | $ | 2,429,069 | $ | 131,092 | $ | 1,633,570 | $ | 724,197 | $ | 64,872 | $ | 2,514,116 | |||||||||||||||||
December 31, 2014 | For the Year Ended December 31, 2014 | ||||||||||||||||||||||||||||||||||
Deferred commission and other acquisition expenses | Reserve for loss and loss adjustment expenses | Unearned premiums | Net premiums earned | Net investment income | Net loss and loss adjustment expenses | Amortization of deferred commission and other acquisition expenses | General and admin. expenses | Net premiums written | |||||||||||||||||||||||||||
Diversified Reinsurance | $ | 87,289 | $ | 1,058,924 | $ | 293,893 | $ | 854,026 | $ | — | $ | 579,771 | $ | 233,711 | $ | 38,858 | $ | 850,049 | |||||||||||||||||
AmTrust Reinsurance | 285,232 | 1,122,479 | 913,861 | 1,378,327 | — | 893,502 | 418,908 | 2,533 | 1,610,485 | ||||||||||||||||||||||||||
Total - Reportable Segments | 372,521 | 2,181,403 | 1,207,754 | 2,232,353 | — | 1,473,273 | 652,619 | 41,391 | 2,460,534 | ||||||||||||||||||||||||||
Other | (34 | ) | 89,889 | 3 | 19,390 | 117,215 | 24,998 | 6,696 | 21,167 | (2,398 | ) | ||||||||||||||||||||||||
Total | $ | 372,487 | $ | 2,271,292 | $ | 1,207,757 | $ | 2,251,743 | $ | 117,215 | $ | 1,498,271 | $ | 659,315 | $ | 62,558 | $ | 2,458,136 | |||||||||||||||||
December 31, 2013 | For the Year Ended December 31, 2013 | ||||||||||||||||||||||||||||||||||
Deferred commission and other acquisition expenses | Reserve for loss and loss adjustment expenses | Unearned premiums | Net premiums earned | Net investment income | Net loss and loss adjustment expenses | Amortization of deferred commission and other acquisition expenses | General and admin. expenses | Net premiums written | |||||||||||||||||||||||||||
Diversified Reinsurance | $ | 88,721 | $ | 1,010,195 | $ | 321,659 | $ | 753,157 | $ | — | $ | 519,962 | $ | 190,604 | $ | 37,649 | $ | 763,374 | |||||||||||||||||
AmTrust Reinsurance | 209,439 | 803,597 | 687,357 | 988,900 | — | 653,528 | 291,559 | 1,566 | 1,169,961 | ||||||||||||||||||||||||||
Total - Reportable Segments | 298,160 | 1,813,792 | 1,009,016 | 1,742,057 | — | 1,173,490 | 482,163 | 39,215 | 1,933,335 | ||||||||||||||||||||||||||
Other | 6,748 | 144,043 | 25,738 | 258,830 | 91,352 | 176,140 | 74,415 | 19,138 | 162,966 | ||||||||||||||||||||||||||
Total | $ | 304,908 | $ | 1,957,835 | $ | 1,034,754 | $ | 2,000,887 | $ | 91,352 | $ | 1,349,630 | $ | 556,578 | $ | 58,353 | $ | 2,096,301 | |||||||||||||||||
S-5
Schedule IV
MAIDEN HOLDINGS, LTD.
SUPPLEMENTARY REINSURANCE INFORMATION
(In thousands of U.S. dollars)
SUPPLEMENTARY REINSURANCE INFORMATION
(In thousands of U.S. dollars)
For the Year Ended December 31, | (a) Gross | (b) Ceded to other companies | (c) Assumed from other companies | (d) Net amount (a) - (b) + (c) | Percentage of amount to net (c)/(d) | ||||||||||||||
2015 Premiums – General Insurance | $ | 9,160 | $ | 148,710 | $ | 2,653,666 | $ | 2,514,116 | 105.6 | % | |||||||||
2014 Premiums – General Insurance | 48,565 | 49,216 | 2,458,787 | 2,458,136 | 100.0 | % | |||||||||||||
2013 Premiums – General Insurance | 104,976 | 107,858 | 2,099,183 | 2,096,301 | 100.1 | % | |||||||||||||
S-6
Schedule VI
MAIDEN HOLDINGS, LTD.
SUPPLEMENTARY INSURANCE INFORMATION
CONCERNING PROPERTY/CASUALTY INSURANCE OPERATIONS
(In thousands of U.S. dollars)
SUPPLEMENTARY INSURANCE INFORMATION
CONCERNING PROPERTY/CASUALTY INSURANCE OPERATIONS
(In thousands of U.S. dollars)
Net loss and LAE | Paid loss and LAE | |||||||||||
For the Year Ended December 31, | Current Year | Prior Year | ||||||||||
2015 | $ | 1,558,704 | $ | 74,866 | $ | 1,350,357 | ||||||
2014 | 1,479,425 | 18,846 | 1,135,791 | |||||||||
2013 | 1,351,043 | (1,413 | ) | 1,116,096 | ||||||||
S-7