Attached files
| file | filename |
|---|---|
| 8-K - FORM 8-K - Encore Bancshares Inc | d8k.htm |
 Gulf
South Bank Conference May 10, 2011 |
 2
Forward-Looking Statements
This
presentation
may
include
forward-looking
statements.
These
forward-looking
statements
include
comments
with
respect
to
assumptions
relating
to
projected
growth,
earnings,
earnings
per
share,
capital
levels
and
ratios
and
other
financial
performance
measures,
as
well
as
management’s
short-term
and
long-term
performance,
trends,
anticipated
effects
on
results
of
operations
or
financial
condition
from
recent
and
expected
developments
or
events
relating
to
business
and
growth
strategies
and
any
other
statements,
projections
or
assumptions
that
are
not
historical
facts.
These
statements
are
based
upon
Encore
Bancshares,
Inc.’s
current
expectations
and
beliefs.
However,
these
forward-looking
statements
are
based
on
assumptions
and
are
subject
to
known
and
unknown
risks,
and
uncertainties.
Factors
that
could
cause
actual
results,
performance
or
achievements,
to
differ
materially
from
anticipated
or
projected
results,
performance
or
achievements
expressed
or
implied
by
these
forward-looking
statements
are
described
under
“Risk
Factors”
in
the
Company’s
Annual
Report
on
Form
10-K
for
the
year
ended
December
31,
2010
and
other
reports
and
documents
filed
by
the
Company
from
time
to
time
with
the
SEC.
You
should
not
place
undue
reliance
on
any
forward-looking
statements.
These
statements
speak
only
as
of
the
date
the
statement
is
made.
The
Company
undertakes
no
obligation
to
publicly
update
or
revise
any
forward-looking
statements,
whether
as
a
result
of
new
information,
future
events,
changed
circumstances
or
any
other
reason
after
the
date
the
statement
is
made. |
 3
Encore Profile
Businesses:
Community Bank,
Wealth Management and Insurance
Headquarters:
Houston, Texas
Total Assets:
$1.5 billion
Total Loans:
$0.9 billion
Total Deposits:
$1.0 billion
Assets Under Management:
$2.9 billion
Total Equity:
$168 million
Tier 1 Risk-Based Capital:
13.05%
Private Client Offices:
11*
* Additional private client office expected to be opened Q3 2011.
|
 4
Current Position
•
Emerging profitability
•
Improving net interest margin
•
Improving asset quality
•
Building Houston franchise
•
Growing fee-based businesses
•
Solid capital |
 5
Quarterly Income Statement
Three Months Ended
Mar 31,
2011
2010
Net interest income
11,095
$
11,490
$
Provision for loan losses
2,170
4,960
Noninterest income
7,066
6,909
Noninterest expense
14,355
18,264
Net earnings (loss) before taxes
1,636
(4,825)
Income taxes
484
(2,574)
Net earnings (loss)
1,152
$
(2,251)
$
Earnings (loss) available to common
594
$
(2,807)
$
Diluted earnings (loss) per share
0.05
$
(0.27)
$
$ in thousands, except diluted earnings per share |
 6
Total Revenue
$ in millions
*
Revenue excludes gain on sale of branches.
$6.9
$6.8
$7.0
$7.3
$7.1
$11.5
$10.9
$11.0
$11.1
$11.1
$0
$5
$10
$15
$20
1Q10
2Q10 *
3Q10
4Q10 *
1Q11
Net Interest Income
Noninterest Income
$18.4
$17.7
$18.0
$18.4
$18.2 |
 7
Net Interest Income *
$11.2
$11.2
$11.1
$11.1
$11.6
3.37%
2.89%
2.83%
2.92%
3.11%
$0
$6
$12
$18
$24
1Q10
2Q10
3Q10
4Q10
1Q11
0.0%
0.9%
1.8%
2.7%
3.6%
Net Interest Income
Net Interest Margin
$ in millions
*
On
taxable
–
equivalent
basis. |
 8
Noninterest Expense
$8.7
$8.5
$8.5
$8.6
$8.6
$5.7
$11.7
$12.2
$10.8
$9.7
$0
$6
$12
$18
$24
1Q10
2Q10
3Q10
4Q10
1Q11
Personnel expense
Non-personnel expense
$ in millions
$18.3
$19.4
$20.7
$20.2
$14.4 |
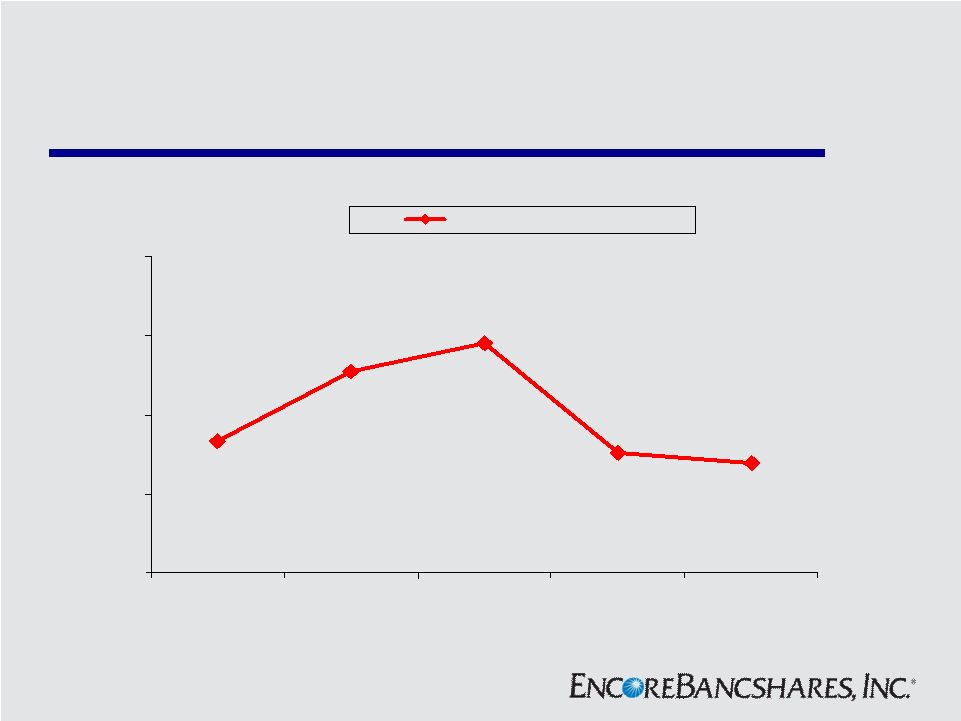 9
Delinquent Loans *
$33.5
$51.0
$58.0
$27.8
$30.5
$0
$20
$40
$60
$80
1Q10
2Q10
3Q10
4Q10
1Q11
Total delinquent loans
$ in millions
* Represents the legal loan balance of loans 30 days or more past due.
|
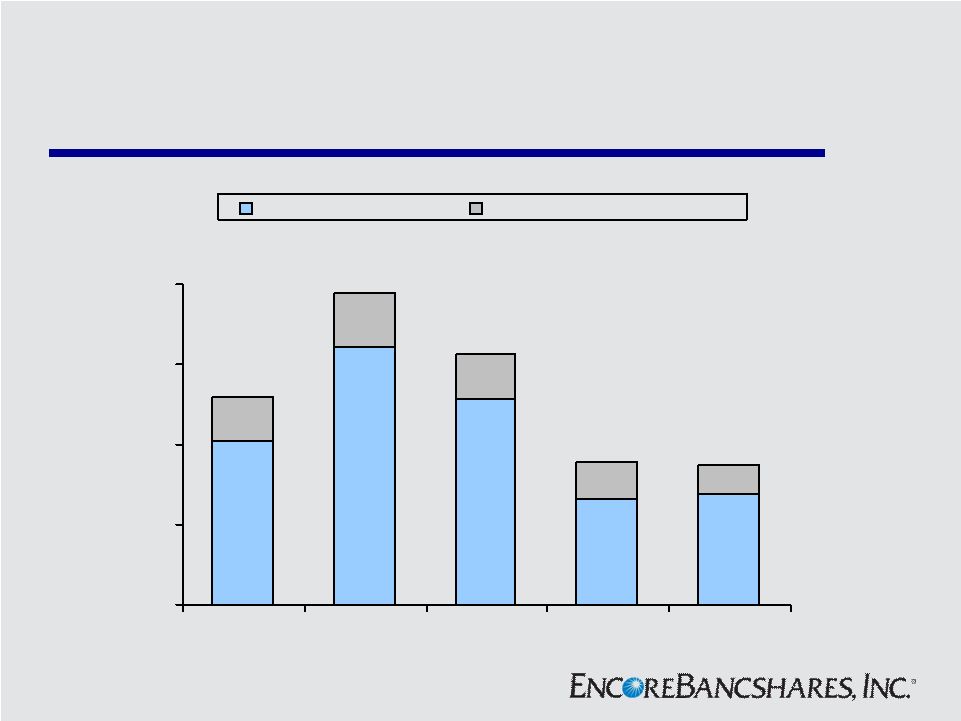 10
Non-Performing Assets
$ in millions
$11.1
$13.6
$10.8
$9.3
$7.3
$27.7
$26.5
$51.7
$64.2
$40.7
$0
$20
$40
$60
$80
1Q10
2Q10
3Q10
4Q10
1Q11
Nonaccrual loans
Investment in real estate
$51.8
$77.8
$62.5
$35.8
$35.0 |
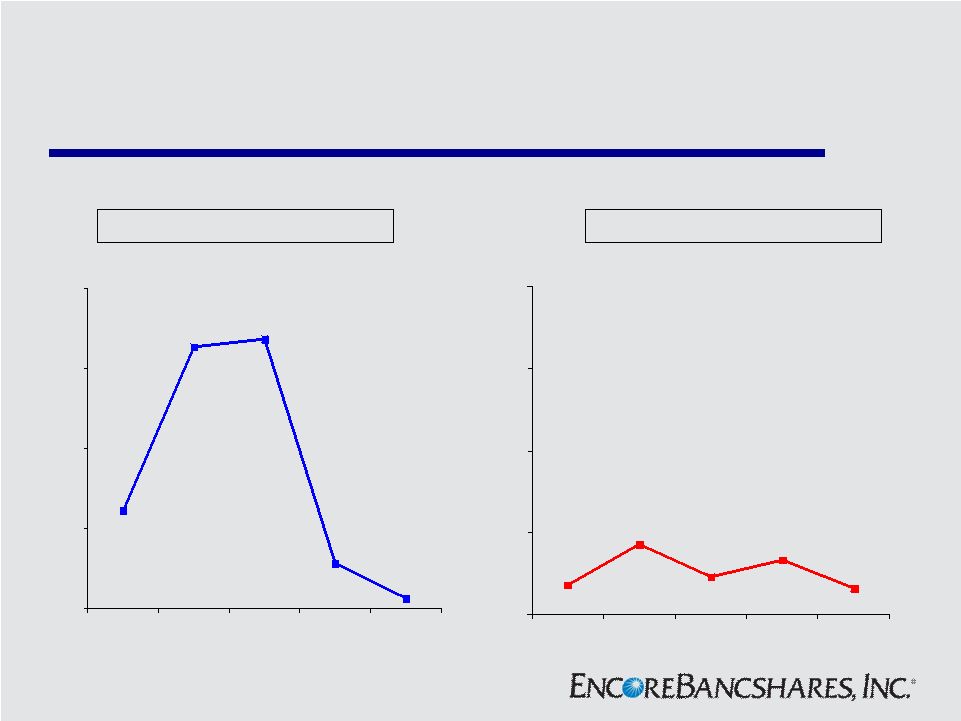 11
Net Charge-offs
$4.9
$13.5
$0.5
$2.3
$13.1
$0
$4
$8
$12
$16
1Q10
2Q10
3Q10
4Q10
1Q11
$ in millions
Commercial Net Charge-offs
$1.5
$3.4
$1.8
$2.7
$1.3
$0
$4
$8
$12
$16
1Q10
2Q10
3Q10
4Q10
1Q11
Consumer Net Charge-offs |
 12
Building Houston Franchise
•
Take advantage of market disruptions
•
Utilize strong team of experienced commercial and
private bankers
•
Leverage local decision making and local contacts
•
Continue to grow DDA deposits and commercial loan
portfolio |
 13
Houston Market
•
4
th
largest city; 6
th
largest MSA
•
Unemployment rate of 8.3% vs. 9.2% for U.S.*
•
Population growth ranked 2
nd
in the nation between
2000 and 2009
•
Second largest U.S. port based on tonnage
•
Texas entered recession a year later; exiting at the
same time
*
Not seasonally adjusted.
Source: Greater Houston Partnership; U.S. Dept. of Labor
|
 14
Houston Deposit Market Share
# of Branches
$ in Millions
Market Share %
1
JP Morgan Chase (NY)
216
41,181
$
30.01%
2
Wells Fargo (CA)
237
14,798
10.78%
3
Bank of America (NC)
119
9,755
7.11%
4
Zions (Amegy) (UT)
83
8,577
6.25%
5
BBVA (Spain)
79
7,831
5.71%
6
Comerica *
67
4,658
3.39%
7
Prosperity
56
3,039
2.21%
8
Capital One (VA)
51
2,365
1.72%
9
Woodforest
106
2,351
1.71%
10
Frost
28
2,304
1.68%
11
Regions (AL)
27
1,519
1.11%
12
Bank of Texas (OK)
15
1,379
1.00%
13
Encore
11
1,033
0.75%
June 30, 2010
* Combined with Sterling Bank.
Source: FDIC Bank Data & Statistics |
 15
Houston Market
Includes additional private client office expected to be opened Q3 2011.
|
 16
Texas Loans
$ in millions
$345
$367
$335
$320
$308
$537
$524
$557
$566
$560
$0
$300
$600
$900
$1,200
1Q10
2Q10
3Q10
4Q10
1Q11
Commercial loans
Consumer loans
$868
$886
$892
$882
$891 |
 17
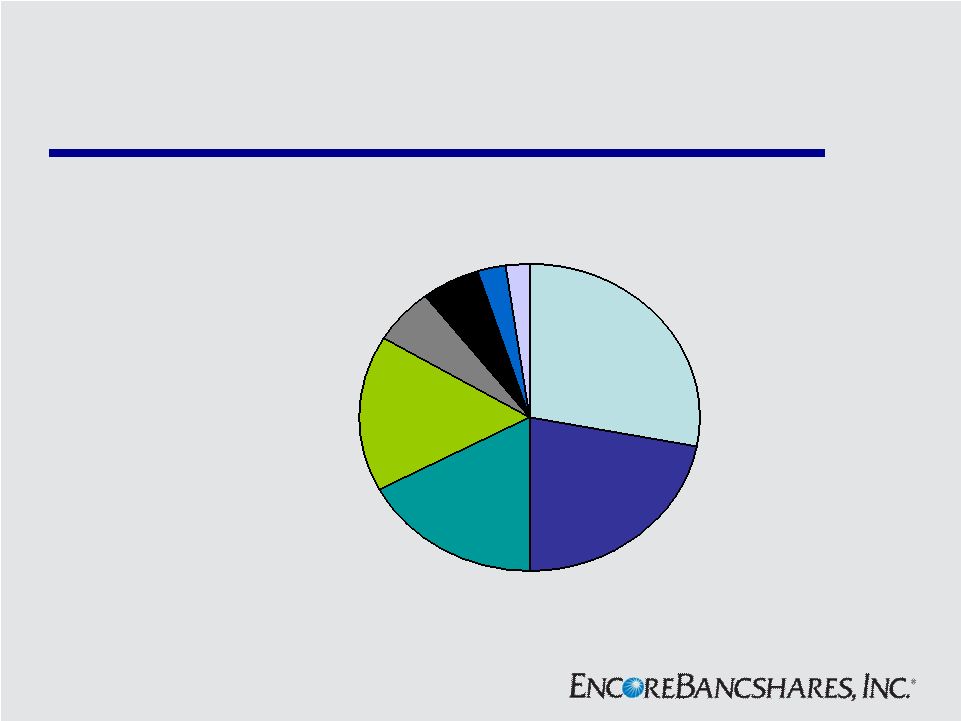
Loan Portfolio
Residential 2nd
lien
28.0%
Home equity
lines
5.9%
Consumer
2.4%
Construction
5.4%
Commercial
17.3%
Residential
1st lien
21.9%
FL Retained
2.7%
Commercial
real estate
16.4%
Excludes held-for-sale of $2.9 million.
|
 18
Residential Loan Portfolio
$0
$100
$200
$300
$400
1Q10
2Q10
3Q10
4Q10
1Q11
1st SBO
1st Mortgage
PMT
HELOC/Others
$211
$358
$216
$357
$207
$344
$205
$323
$ in millions
$330
$206 |
 19
Residential Loan Delinquency |
 20
Texas Deposits
$ in millions
$803
$833
$838
$830
$821
$156
$183
$206
$220
$220
$0
$300
$600
$900
$1,200
1Q10
2Q10
3Q10
4Q10
1Q11
Interest-bearing deposits
Noninterest-bearing deposits
$959
$1,016
$1,044
$1,050
$1,041 |
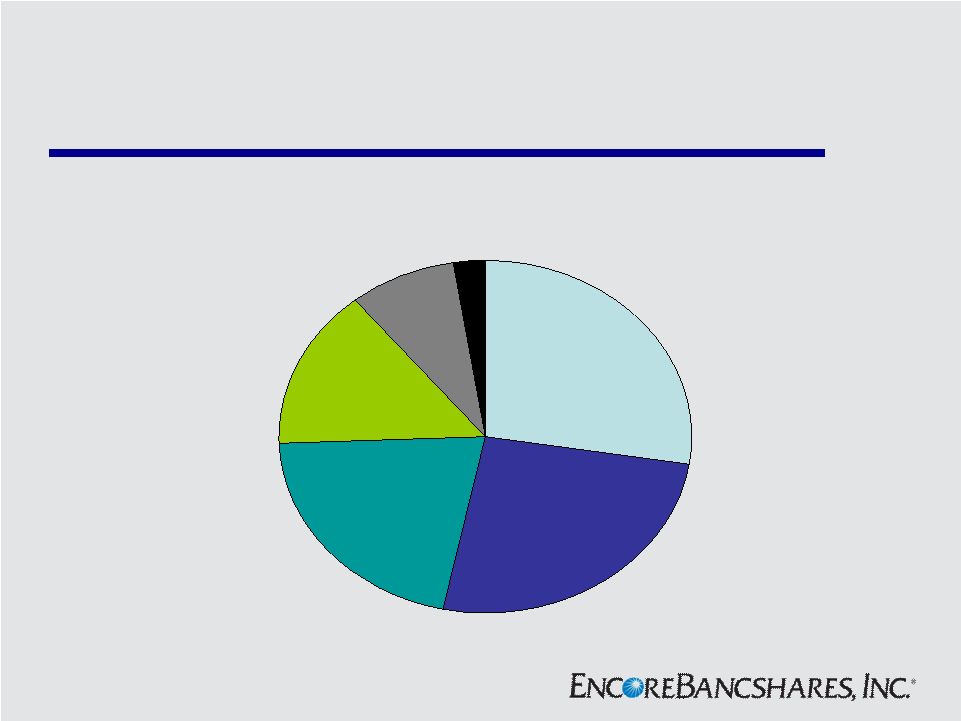 21
Deposit Mix
Money market
and savings
27.4%
Noninterest-
bearing deposits
21.1%
Interest checking
14.9%
CDs under
$250,000
25.8%
CDs over
$250,000
8.3%
Brokered
deposits
2.5% |
 22
Wealth Management
$2.8
$2.7
$2.9
$2.9
$2.6
$0
$1
$2
$3
$4
1Q10
2Q10
3Q10
4Q10
1Q11
Assets Under Management
$ in Billions |
 23
Wealth Management
$4.7
$4.7
$5.2
$5.1
$4.6
$0
$2
$4
$6
$8
1Q10
2Q10
3Q10
4Q10
1Q11
Revenues
$ in Millions |
 24
Insurance Commissions
$1.6
$1.5
$1.1
$1.4
$1.5
$0
$1
$2
$3
$4
1Q10
2Q10
3Q10
4Q10
1Q11
Commissions
$ in Millions |
 25
Solid Capital
3/31/2011
TCE/ Tangible Assets
6.91%
Leverage Ratio
9.29%
Tier 1 RBC
13.05%
Tier 1 Common RBC
8.08%
Allowance for Loan Losses/ Total Loans *
2.03%
* Excludes loans held-for-sale of $2.9 million.
|
 26
Investment Considerations
•
Solid capital position
•
Improving asset quality
•
Capacity for loan growth
•
Attractive market valuation relative to peers
•
High margin fee-based businesses
•
Desirable Houston franchise |
 27
Non-GAAP Financial Measures
March 31, 2011
Shareholders' equity (GAAP)
167,914
$
Less: Preferred stock
29,633
Goodwill and other intangible assets, net
40,374
Tangible common equity (1)
97,907
$
Total assets (GAAP)
1,458,181
$
Less: Goodwill and other intangible assets, net
40,374
Tangible assets
1,417,807
$
(1)
Tangible
common
equity,
a
non-GAAP
financial
measure,
includes
total
equity,
less
preferred
equity,
goodwill
and
other
intangible
assets.
Management
reviews
tangible
common
equity
along
with
other
measures
of
capital
as
part
of
its
financial
analyses
and
has
included
this
information
because
of
current
interest
on
the
part
of
market
participants
in
tangible
common
equity
as
a
measure
of
capital.
The
methodology
of
determining
tangible
common
equity
may
differ
among
companies.
$ in Thousands |