Attached files
Table of Contents
Index to Financial Statements
UNITED STATES
SECURITIES AND EXCHANGE COMMISSION
WASHINGTON, D.C. 20549
FORM 10-K
| x | Annual Report Pursuant to Section 13 or 15(d) of the Securities Exchange Act of 1934 For the fiscal year ended December 31, 2009. |
| ¨ | Transition Report Pursuant to Section 13 or 15(d) of the Securities Exchange Act of 1934 |
For the transition period from to .
Commission file number: 001-33598
Encore Bancshares, Inc.
(Exact name of registrant as specified in its charter)
| Texas | 76-0655696 | |
| (State or other jurisdiction of incorporation or organization) |
(IRS Employer Identification No.) | |
| Nine Greenway Plaza, Suite 1000, Houston, Texas | 77046 | |
| (Address of principal executive offices) | (Zip Code) | |
Registrant’s telephone number, including area code:(713) 787-3100
Securities registered pursuant to Section 12(b) of the Act:
| Title of each class: |
Name of each exchange on which registered: | |
| Common Stock, $1.00 par value | NASDAQ Global Market |
Securities registered pursuant to Section 12(g) of the Act: NONE
Indicate by check mark if the registrant is a well-known seasoned issuer as defined in Rule 405 of the Securities Act. Yes ¨ No x
Indicate by check mark if the registrant is not required to file reports pursuant to Section 13 or Section 15(d) of the Exchange Act. Yes ¨ No x
Indicate by check mark whether the registrant (1) has filed all reports required to be filed by Section 13 or 15(d) of the Securities Exchange Act of 1934 during the preceding 12 months (or for such shorter period that the registrant was required to file such reports) and (2) has been subject to such filing requirements for the past 90 days. Yes x No ¨
Indicate by check mark whether the registrant has submitted electronically and posted on its corporate Web site, if any, every Interactive Data File required to be submitted and posted pursuant to Rule 405 of Regulation S-T (§ 232.405 of this chapter) during the preceding 12 months (or for such shorter period that the registrant was required to submit and post such files). Yes ¨ No ¨
Indicate by check mark if disclosure of delinquent filers pursuant to Item 405 of Regulation S-K (§229.405 of this chapter) is not contained herein and will not be contained, to the best of registrant’s knowledge, in definitive proxy or information statements incorporated by reference in Part III of this Form 10-K or any amendment to this Form 10-K. ¨
Indicate by check mark whether the registrant is a large accelerated filer, an accelerated filer, a non-accelerated filer, or a smaller reporting company. See the definitions of “large accelerated filer,” “accelerated filer” and “smaller reporting company” in Rule 12b-2 of the Exchange Act. (Check one):
| Large accelerated filer ¨ | Accelerated filer x | Non-accelerated filer ¨ | Smaller reporting company ¨ | |||
| (Do not check if a smaller reporting company) |
Indicate by check mark whether the registrant is a shell company (as defined in Rule 12b-2 of the Exchange Act). Yes ¨ No x
The aggregate market value as of June 30, 2009 (the last business day of registrant’s most recently completed second quarter) of the shares of common stock held by non-affiliates of the registrant was approximately $53.2 million based on the closing price of the common stock on such date.
The number of shares outstanding of the registrant’s Common Stock, $1.00 par value, as of February 26, 2010 was 10.5 million.
DOCUMENTS INCORPORATED BY REFERENCE:
Portions of the Company’s Proxy Statement relating to the 2010 Annual Meeting of Shareholders, which will be filed within 120 days after December 31, 2009, are incorporated by reference into Part III, Items 10-14 of this Annual Report on Form 10-K.
Table of Contents
Index to Financial Statements
TABLE OF CONTENTS
2
Table of Contents
Index to Financial Statements
PART I
The disclosures set forth in this item are qualified by Item 1A. Risk Factors and by the section captioned “Special Cautionary Notice Regarding Forward-Looking Statements” in Part II, Item 6 of this Annual Report on Form 10-K and other cautionary statements set forth elsewhere in this report.
General
Encore Bancshares, Inc. (we, the Company or our) is a financial holding company and wealth management organization that provides banking, investment management, financial planning and insurance services to privately-owned businesses, professional firms, investors and affluent individuals. We are headquartered in Houston, Texas and currently manage, through our primary subsidiary Encore Bank, National Association (Encore Bank), 11 private client offices in the greater Houston area and six private client offices in southwest Florida. We also operate five wealth management offices and three insurance offices in Texas through Encore Trust, a division of Encore Bank, Linscomb & Williams, Inc. (Linscomb & Williams), a subsidiary of Encore Bank, and Town & Country Insurance Agency, Inc. (Town & Country), a subsidiary of the Company. Our principal executive office is located at Nine Greenway Plaza, Suite 1000, Houston, Texas 77046, and our telephone number is (713) 787-3100.
Our website address is www.encorebank.com. We make available free of charge on or through our website our annual reports on Form 10-K, quarterly reports on Form 10-Q, current reports on Form 8-K and all amendments to those reports filed or furnished pursuant to Section 13(a) or 15(d) of the Securities Exchange Act of 1934, as amended, as soon as reasonably practicable after such material is electronically filed with or furnished to the Securities and Exchange Commission (SEC). Information contained on our website is not incorporated by reference into this Annual Report on Form 10-K and is not part of this or any other report.
Pending Transactions
On March 15, 2010, Encore Bank executed two separate purchase and assumption agreements to sell certain assets and transfer certain liabilities of its Florida operations. The first agreement is with Ovation Holdings, Inc. (Ovation Holdings) and its proposed subsidiary bank, National Bank of Southwest Florida (NBSWF), headquartered in Port Charlotte, Florida. Ovation Holdings has entered into a definitive agreement to purchase NBSWF.
Under the terms of the first agreement, NBSWF is to assume approximately $171.6 million of deposits associated with our four private client offices located in Naples, Ft. Myers and Sun City Center, Florida. NBSWF is also expected to purchase approximately $86.2 million of loans as well as other assets, including premises and equipment. The purchase and assumption is subject to regulatory approval, the closing of the purchase of NBSWF by Ovation Holdings and customary closing conditions and is expected to close before the end of the third quarter 2010, although delays may occur.
The second agreement is with HomeBanc National Association (HomeBanc), headquartered in Lake Mary, Florida. Under the terms of this agreement, HomeBanc is to assume approximately $59.7 million of deposits and certain assets associated with our two private client offices in Clearwater and Belleair Bluffs, Florida. The transaction is subject to regulatory approval and customary closing conditions and is expected to close before the end of the third quarter 2010, although delays may occur.
The deposits and loans to be acquired represent approximately 19.4% and 8.0% of our total deposits and loans at December 31, 2009. The combined transactions will result in a pre-tax loss of approximately $1.0 million. We expect to take a charge of approximately $4.4 million in the first quarter of 2010 to adjust the assets held for sale to their agreed purchase price. The gain on the sale of the deposits with respect to each transaction will be recognized when each transaction is completed.
3
Table of Contents
Index to Financial Statements
History and Franchise Transformation
Encore Bank was founded as Guardian Savings and Loan of Dallas in 1928. In September 2000, our current Chief Executive Officer, James S. D’Agostino, Jr., led a group of primarily local Houston investors in our acquisition of Guardian for $8.0 million. At the closing of the acquisition, we recapitalized our company with $25.0 million. At the time of the acquisition, Guardian’s balance sheet was comprised primarily of investment securities and purchased loans funded principally by borrowings and certificates of deposit originated through brokers or our 24 branch offices in Atlanta, Boston, Kansas City and St. Louis, and one Houston location.
Starting in September 2000, our new management team took action to transform the bank by aligning its assets and liabilities with our business strategies. We changed the name of the bank to Encore Bank in September 2001. We targeted privately-owned businesses, professional firms, investors and affluent individuals as clients, and initiated our strategy of providing them with superior service in a “private banking” environment. In four separate transactions in the period from December 2001 to September 2003, we sold all 24 branches located outside our target markets, disposing of $674.9 million in deposits and $50.8 million in real estate. While divesting these branches, we established new private client offices in our target markets. By December 2003, we had opened nine new private client offices in Texas and southwest Florida. We also recruited new lending officers and began changing our asset mix, replacing lower yielding investment securities and purchased mortgage loans with our own higher yielding originated loans. On the liability side, we actively solicited deposits, replacing brokered deposits with core deposits. To provide capital for growth, we completed our initial public offering in July 2007. Our net proceeds, including the sale of the overallotment shares, were $41.4 million. On December 5, 2008 in connection with our participation in the Capital Purchase Program (CPP), we issued and sold to the U.S. Department of Treasury (U.S. Treasury) (i) 34,000 shares of our Fixed Rate Cumulative Perpetual Preferred Stock, Series A, par value $1.00 per share, with a liquidation value of $1,000 per share, and (ii) a warrant (Warrant) to purchase up to 364,026 shares of our common stock, at an exercise price of $14.01 per share, subject to certain anti-dilution and other adjustments, for an aggregate purchase price of $34.0 million in cash.
We have continued our transformation by hiring our new President and Chief Lending Officer in June 2009 to focus our efforts on growing commercial banking business in the Houston market. These two executives have extensive banking and lending experience and provide us the expertise to expand our commercial lending platform. We have also added several new commercial lending officers to our team in Houston. Given our pending transactions discussed above that will result in us no longer providing commercial banking services in Florida, we intend to focus our lending efforts in Houston.
We now have 17 private client offices in Texas and Southwest Florida. As of December 31, 2009, originated loans constituted 91.8% of our loan portfolio and core deposits constituted 73.1% of our total deposits. In addition to building out our core banking platform, we have also completed and integrated the following series of acquisitions to add wealth management and insurance services to our product offering:
Insurance. On April 30, 2004, we acquired Town & Country. The agency, with offices in Houston, Galveston and Fort Worth and approximately 8,100 clients, sells property and casualty insurance and is one of the largest independent agencies in the Houston area with a clientele that matches our target demographic. On January 1, 2005, Town & Country purchased certain assets and assumed certain liabilities of the Bumstead Insurance Agency, further enhancing the agency’s penetration of affluent households.
Trust. On March 31, 2005, we acquired National Fiduciary Services, N.A. and renamed the entity Encore Trust Company, N.A.,which subsequently became a division of Encore Bank (Encore Trust) as of June 30, 2007. Encore Trust provides personal trust services in the greater Houston metropolitan area, Dallas and Austin, Texas. As of December 31, 2009, Encore Trust had $899.3 million in assets under management.
Investment Management and Financial Planning. On August 31, 2005, we acquired Linscomb & Williams, an investment management and financial planning firm based in Houston. With over 30 years of experience,
4
Table of Contents
Index to Financial Statements
Linscomb & Williams is, in the opinion of management, one of Houston’s largest and most respected financial planning and investment management firms. As of December 31, 2009, Linscomb & Williams had $1.8 billion in assets under management and over 2,000 clients.
Business Strategies
We intend to use the franchise we have built and the following strategies in an effort to continue to originate loans, increase deposits and improve profitability.
Optimize our deposit mix. Increasing business and personal checking (noninterest and interest checking, or transaction deposits) is key to our strategy of decreasing our funding costs and continuing to increase our net interest margin on a taxable-equivalent basis from 3.10% for the year ended December 31, 2009. We have increased our business demand deposits, which has resulted largely from our continued growth in lending to privately-owned businesses and professional firms and our offering of cash management services. We have increased our transaction deposits to $385.3 million, or 32.3% of total deposits, as of December 31, 2009 from $251.6 million, or 30.9% of total deposits, as of December 31, 2005, a compounded annual growth rate of 11.2%. We believe that increasing our core deposits will help reduce our cost of deposits.
Continue to increase loan originations. Historically, we have grown loans organically to replace purchased mortgages as they amortize. From 2005 through 2009, we increased our total originated loans by $382.6 million, a compounded annual growth rate of 13.0%, and our total commercial loans by $162.2 million, a compounded annual growth rate of 11.4%. While we intend to continue to focus on increasing loan originations, we believe the opportunities to make prudent loans will lessen in the short term due to the current economic downturn and our clients’ desire to de-leverage. We intend to focus on generating commercial and industrial loans in Houston because of the opportunity to add business demand deposits and the relative good performance of the Houston economy. To that end, we have recently hired several experienced lenders to enhance our penetration of the business and private banking sectors.
Expand wealth management and insurance businesses. We believe that our ability to offer sophisticated wealth management products and services within a high-touch community bank framework gives us a competitive advantage over traditional brokerage firms. We believe that the current recession and stock market turmoil have created confusion and lack of trust in Wall Street. For many prospective clients, the current environment highlights the distinction of holistic wealth management approaches compared with a more limited scope in investment management. This environment offers us the opportunity to market our objective wealth management services and to offer prospects a second opinion in this financial situation. However, we expect that fluctuations in market value will impact our overall levels of assets under management in the short term.
Cost Containment. Over the past several years, we have kept expenses approximately unchanged, despite investment in new private client offices and loan officers. Our goal during the current economic downturn is to continue to maintain cost control, however, with the rise in FDIC assessments and increased costs related to managing problem assets, we expect costs will rise over the next several years. To the extent that we invest in growing our franchise in the Houston market, we intend to do so through the reallocation of resources from Florida.
Acquire compatible banks and financial services companies. We intend to continue to explore acquisition opportunities for bank and financial service companies, but will be selective in the acquisitions we pursue. In particular, we believe there could be FDIC assisted transactions that would offer the opportunity to acquire an attractive deposit franchise. We will focus on targets within our existing footprint or other attractive markets in Texas with significant core deposits and/or a potential client base compatible with our operating philosophy.
5
Table of Contents
Index to Financial Statements
Operating Philosophy
We focus on providing our banking, wealth management and insurance products and services to privately-owned businesses, professional firms, investors and affluent individuals. These clients include entrepreneurs, attorneys, doctors and other professionals, real estate developers, executives, high net worth families, and their business interests. Our individual clients generally have a net worth of between $500,000 and $20 million. We offer a broad array of products and services tailored to the objectives of our target clients, ranging from checking accounts to state-of-the-art cash management to commercial loans to sophisticated financial and estate planning, all within a high-touch community bank framework.
Our clients are served by a private banker or relationship manager who understands each client’s financial needs and offers products and services designed to meet those needs. Our private bankers and relationship managers are able to offer traditional banking services and to collaborate with investment management, financial planning, trust and insurance specialists in our subsidiaries to meet our clients’ financial needs.
Banking Services
Lending Activities
We specialize in lending to privately-owned businesses, professional firms, investors and affluent individuals. The types of loans we make to businesses include commercial loans, commercial real estate loans, real estate construction loans, revolving lines of credit, working capital loans, equipment financing and letters of credit. We intend to focus our lending efforts on commercial-related loans because they are generally higher yielding and often generate a deposit relationship. These loans are primarily originated in Houston. The types of loans we make to individuals include residential mortgage loans and mortgage loans on investment and vacation properties, unsecured and secured personal lines of credit, home equity lines of credit and overdraft protection.
In connection with our transformation, we purchased residential real estate loans and consumer loans in order to build our loan portfolio and leverage our capital. During the last several years, we have been replacing these purchased loans with our own originated loans. The following table sets forth, as of the dates indicated, the balance of outstanding loans we originated and purchased:
| December 31, | ||||||||||||||||||||
| 2009 | 2008 | 2007 | 2006 | 2005 | ||||||||||||||||
| (dollars in thousands) | ||||||||||||||||||||
| Originated loans |
$ | 989,465 | $ | 1,112,815 | $ | 954,140 | $ | 751,802 | $ | 606,907 | ||||||||||
| Purchased loans |
88,740 | 105,589 | 143,128 | 156,566 | 201,297 | |||||||||||||||
| Total loans |
$ | 1,078,205 | $ | 1,218,404 | $ | 1,097,268 | $ | 908,368 | $ | 808,204 | ||||||||||
| Originated loans to total loans |
91.8 | % | 91.3 | % | 87.0 | % | 82.8 | % | 75.1 | % | ||||||||||
The following is a discussion of our major types of lending:
Commercial Loans
Our commercial loans are primarily made within our market areas and are underwritten on the basis of the borrower’s ability to service the debt from cash flow. As a general practice, we take as collateral a lien on accounts receivable, inventory, equipment, or other assets owned by the borrower and obtain the personal guaranty of the business owner. Underwriting commercial loans focuses on an analysis of cash flow, including primary and secondary sources of repayment, and the stability of the underlying business which provides the cash flow stream for debt service. Coupled with this analysis is an assessment of the financial strength of the guarantor, the borrower’s liquidity and leverage, management experience of the owners or principals, economic conditions, industry trends and the collateral securing the loan. We require a first lien position in all collateral and the loan to value ratio of commercial loans varies based on the collateral securing the loan. Generally, loans
6
Table of Contents
Index to Financial Statements
collateralized by accounts receivable are financed at 50% to 80% of accounts receivable less than 90 days past due. Loans collateralized by inventory will be made at 50% to 80% of the inventory value. We offer a broad range of short- to medium-term commercial loans that generally have floating interest rates. As of December 31, 2009, we had $115.4 million in commercial loans, which represented 10.7% of our total loans.
Included in commercial loans as of December 31, 2009 are $18.6 million in loans to law firms, compared with $22.2 million as of December 31, 2008. We require personal guarantees of the principals of the law firm. These loans represented 16.1% of total commercial loans and 1.7% of total loans as of December 31, 2009.
Commercial Real Estate Loans
In addition to commercial loans, we originate commercial real estate mortgage loans to finance the purchase of real property, which generally consists of real estate with completed structures. Commercial real estate lending typically involves higher loan principal amounts and the repayment of these loans is dependent, in large part, on sufficient income from the properties securing the loans to cover operating expenses and debt service. As a general practice, we require our commercial real estate loans to be secured by well-managed income producing property with adequate margins and to be guaranteed by responsible parties. We look for opportunities where cash flow from the collateral provides adequate debt service coverage and the guarantor’s net worth is centered in assets other than the project we are financing.
Our commercial real estate loans are generally secured by first liens on real estate and, if rental property, an assignment of the lease, have fixed or floating interest rates and amortize over a 10- to 25-year period with balloon payments due at the end of one to ten years. Payments on loans secured by such properties are often dependent on the successful operation or management of the properties. Accordingly, repayment of these loans may be subject to adverse conditions in the real estate market or the economy to a greater extent than other types of loans.
In underwriting commercial real estate loans, we seek to minimize the risks in a variety of ways, including giving careful consideration to the property’s operating history, future operating projections, current and projected occupancy, location and physical condition. Our underwriting analysis also includes credit checks, reviews of appraisals and environmental hazards or EPA reports, the borrower’s liquidity and leverage, management experience of the owners or principals, economic conditions and industry trends. Our policies require us to visit properties on an annual basis, but our practice is to conduct more frequent visits of properties if possible. Generally, we will originate commercial real estate loans in an amount up to 80% of the value of improved property. As of December 31, 2009, we had $259.5 million in commercial real estate loans, which represented 24.0% of our total loans.
Residential Real Estate Loans
Our lending activities also include the origination of first and second lien residential real estate loans that we consider to be predominately prime, collateralized by residential real estate that is located primarily in our market areas. We offer a variety of mortgage loan products which generally are amortized over 15 to 30 years. We originate second mortgage loans through a network of brokers, primarily in the Houston, Dallas and Austin, Texas markets.
Our first lien residential real estate loans are collateralized by 1-4 family residential real estate and generally have been originated in amounts of no more than 90% of appraised value, with most being jumbo adjustable rate mortgages. We sell many of our first lien residential real estate loans, although we generally elect to keep for our own account loans that are nonconforming with an adjustable rate that adjusts within a period of not more than seven years and made to a client who has a relationship with us or the potential for a relationship. We retain a valid lien on real estate and obtain a title insurance policy that insures that the property is free of encumbrances. We also require hazard insurance in the amount of the loan and, if the property is in a flood plain as designated
7
Table of Contents
Index to Financial Statements
by the Department of Housing and Urban Development, we require flood insurance. We offer the option to borrowers to advance funds on a monthly basis from which we make disbursements for items such as real estate taxes, private mortgage insurance and hazard insurance.
Our second lien residential real estate loans are collateralized by 1-4 family residential real estate, located primarily in the Texas markets of Houston, Dallas and Austin. These loans are predominantly prime (FICO score of 660 or greater) and used as supplemental funding in the purchase of a home. Though these loans represent a second lien position on the collateral, we generally underwrite these loans with full documentation and an average combined loan to value of less than 90%. Historically, until the third quarter of 2007, we sold most of our second mortgage loans into the secondary market within 60 days of production, but as a result of the disruption in the mortgage market beginning in 2007, have elected to retain them in our loan portfolio. Given the current credit environment, we do not expect to resume sales of second mortgage loans into the secondary market in the foreseeable future.
For the year ended December 31, 2009, we originated $148.3 million in residential real estate loans, sold $48.0 million in such loans and recognized $518,000 in gains on such sales.
Since 2000, we purchased residential mortgage loans serviced by others in order to build our loan portfolio and leverage our capital. We have not purchased any loans with evidence of deterioration of credit quality for which it was probable, at acquisition date, that we would be unable to collect all contractually required payments. Other than in certain circumstances, including to meet certain regulatory requirements, we do not intend to purchase such loans in the future, as it is inconsistent with our goal of developing client relationships. As of December 31, 2009, we had $88.7 million in purchased residential real estate loans, which represented 17.3% of our residential real estate loans.
As of December 31, 2009, our residential real estate loan portfolio was $513.8 million, which represented 47.6% of our total loans. Of this amount, $75.7 million is repriceable in one year or less and an additional $83.3 million is repriceable in greater than one year to five years.
Real Estate Construction Loans
We make loans to finance the construction of residential properties to clients with a relationship with us or the potential of a relationship. We also make construction loans to custom high-end home builders who operate in the markets where our clients are located, and to a limited extent, to finance commercial properties. Substantially all of our residential construction loans are originated in our Houston market. In addition, we make loans on raw land. Real estate construction loans generally are secured by first liens on real estate and have floating interest rates. We employ a third party construction inspector to make regular inspections prior to approval of periodic draws on these loans. Underwriting guidelines similar to those described above under Commercial Real Estate Loans are also used in our construction lending activities. In the case of raw land, we will originate real estate construction loans in an amount up to 65% of the value of raw land and up to 75% of the value of land to be acquired and developed. Real estate construction loans involve additional risks attributable to the fact that loan funds are advanced upon the security of a project under construction, and the value of the project is typically dependent on its successful completion. As a result of these uncertainties, construction lending often involves the disbursement of substantial funds with repayment dependent, in part, on the success of the ultimate project rather than the ability of a borrower or guarantor to repay the loan. If we are forced to foreclose on a project prior to completion, there is no assurance that we will be able to recover the entire unpaid portion of the loan. In addition, we may be required to fund additional amounts to complete a project and may have to hold the property for an indeterminate period of time.
As of December 31, 2009, real estate construction loans totaled $87.0 million, which represented 8.1% of our total loans. Of this total, $66.7 million in real estate construction were land loans, $8.1 million were to finance residential construction with an identified purchaser, $5.0 million were to finance residential construction with no identified purchaser and $7.2 million were to finance commercial construction.
8
Table of Contents
Index to Financial Statements
Consumer Loans
Substantially all of our other consumer loan origination function exists to support client relationships. We provide a variety of consumer loans, including automobile loans, personal loans and lines of credit (secured and unsecured) and deposit account collateralized loans. The terms of these loans typically range from 1 to 10 years and vary based upon the nature of the collateral and size of the loan.
From 2002 through 2005, we originated indirect automobile and boat loans. We eliminated this lending function in the third quarter of 2005, as this type of lending was not consistent with our goal of developing client relationships. As of December 31, 2009, we had $8.4 million in consumer installment-indirect loans, which represented 0.8% of our total loans.
Generally, consumer loans entail greater risk than do real estate secured loans, particularly in the case of consumer loans that are unsecured or secured by rapidly depreciating assets such as automobiles. In such cases, any repossessed collateral for a defaulted consumer loan may not provide an adequate source of repayment for the outstanding loan balance. The remaining deficiency often does not warrant further substantial collection efforts against the borrower beyond obtaining a deficiency judgment. In addition, consumer loan collections are dependent on the borrower’s continuing financial stability, and thus are more likely to be adversely affected by job loss, divorce, illness or personal bankruptcy. Furthermore, the application of various federal and state laws may limit the amount which can be recovered on such loans. As of December 31, 2009, we had $19.8 million in other consumer loans, excluding indirect automobile and boat loans, which represented 1.9% of our total loans.
Underwriting Strategy
While Encore Bank’s legal lending limit for loans to one borrower as of December 31, 2009 was $21.6 million, we generally operate within an internal lending guideline equal to less than half of our legal lending limit. Lending officers are assigned various levels of loan approval authority based upon their respective levels of experience and expertise. Loans with relationships over the lending authority of the account officer must be approved by the loan committee, which includes Encore Bank’s Chairman of the Board, President and Chief Executive Officer, and loans with a total relationship exceeding $7.5 million must be approved by the board of directors of Encore Bank. Prior to January 1, 2009, loans over the authority of the account officer up to $2.5 million that conformed to policy were approved by a regional loan committee in Houston or Florida chaired by the respective head of the regional banking group. The regional loan committees were eliminated in an effort to centralize our credit underwriting decisions.
Loan decisions are documented as to the borrower’s business, purpose of the loan, evaluation of the repayment source and the associated risks, evaluation of collateral, covenants and monitoring requirements, and the risk rating rationale. When making consumer loans, we use standard credit scoring systems to assess the credit risk of consumers. Our loan committee generally meets weekly to evaluate applications for new and renewed loans, or modifications to loans, in which the loan relationship is above an individual loan officer’s approval authority. Our strategy for approving or disapproving loans is to follow conservative loan policies and consistent underwriting practices which include:
| • | knowing our clients; |
| • | granting loans on sound and collectible basis; |
| • | ensuring that primary and secondary sources of repayment are adequate in relation to the amount of the loan; |
| • | developing and maintaining our targeted levels of diversification for our loan portfolio as a whole and for loans within each category; and |
| • | ensuring that each loan is properly documented and that any insurance coverage requirements are satisfied. |
9
Table of Contents
Index to Financial Statements
Managing credit risk is a company-wide process. Our strategy for credit risk management includes well-defined, centralized credit policies, uniform underwriting criteria, and ongoing risk monitoring and review processes for all commercial and consumer credit exposures. The strategy also emphasizes regular credit examinations and management reviews of loans exhibiting deterioration in credit quality. In addition, a third party loan review of commercial loans is performed approximately quarterly to identify problem assets. We strive to identify potential problem loans early in an effort to aggressively seek resolution of these situations before the loans become a loss, record any necessary charge-offs promptly and maintain adequate allowance levels for probable loan losses inherent in the loan portfolio. A quarterly review of potential problem loans and the allowance for loan losses is conducted by Encore Bank’s asset classification committee, which reviews credit concerns and reports to the board of directors.
Deposit Products and Other Sources of Funds
Our primary sources of funds for use in our lending and investing activities consist of deposits, maturities and principal and interest payments on loans and securities and other borrowings. We closely monitor rates and terms of competing sources of funds and utilize those sources we believe to be most cost effective and consistent with our asset and liability management policies.
Deposits
Deposits are our principal source of funds for use in lending and for other general business purposes. We provide checking, savings, money market accounts, time deposits ranging from 7 days to five years and individual retirement accounts. For businesses, we provide a range of cash management products and services. As of December 31, 2009, core deposits (which consist of noninterest-bearing deposits, interest checking, money markets, savings and time deposits less than $100,000) were $871.5 million, or 73.1% of total deposits, while time deposits $100,000 and greater and brokered deposits made up 26.9% of total deposits. We attempt to price our deposit products in order to promote core deposit growth and maintain our liquidity requirements in order to satisfy client needs.
Borrowings, Repurchase Agreements and Junior Subordinated Debentures
We borrow from the Federal Home Loan Bank of Dallas (FHLB) pursuant to a blanket lien based on the value of our loans and securities. These borrowings provide term funding at a competitive cost and are primarily used to fund loans with longer durations. As of December 31, 2009, we had $209.9 million in long-term borrowings from the FHLB with remaining maturity of greater than one year, $95.0 million of which have various call dates prior to the maturity date.
We also obtain other overnight borrowed funds under arrangements with certain clients and investment banks whereby investment securities are sold under an agreement to repurchase the next business day. These borrowing arrangements are collateralized by pledging applicable investment securities. The borrowing costs of these arrangements are priced lower than the daily Federal funds rate. As of December 31, 2009, we had $10.7 million in repurchase agreements.
In addition, we have raised additional regulatory capital through the issuance of junior subordinated debentures in connection with trust preferred securities issuances by separate non-consolidated statutory trust subsidiaries in September 2003 and April 2007.
Wealth Management Services
We provide a wide variety of wealth management services to our clients through our subsidiary, Linscomb & Williams, and the trust division of Encore Bank, Encore Trust, which we manage as one segment. As of December 31, 2009, we had $2.7 billion in assets under management in our wealth management group.
10
Table of Contents
Index to Financial Statements
Linscomb & Williams
Linscomb & Williams is an investment management and financial planning firm that operates primarily in the Houston market. Linscomb & Williams provides fee-based financial planning services for clients and investment management services for a quarterly management fee based on the value of assets in the account. The majority of Linscomb & Williams’ fees originate from investment management services. Linscomb & Williams has been in Houston for over 30 years and all of the senior staff from the firm have remained with our company since we acquired it in August 2005. As of December 31, 2009, Linscomb & Williams had $1.8 billion in assets under management and over 2,000 clients.
Through Linscomb & Williams, we offer personal financial planning based on a comprehensive review and coordination of a client’s financial situation and objectives that may include asset preservation/protection, employee benefits, estate planning, investments and asset allocation, retirement planning, risk management and insurance and tax planning. We also assist our clients in preparing for special situations by offering financial planning tailored to specific situations such as charitable giving, death of a spouse, divorce, education funding, executive benefits/stock options, inheritance, legal settlements, long-term care, retirement plan distributions and wealth transfer. Additionally, we provide financial services for businesses through financial counseling for employees, financial planning for executives and financial workshops for employees.
Our investment management services include comprehensive investment planning and implementation for individual and business clients including understanding client objectives and risk tolerance, developing appropriate asset allocation, selecting and implementing specific investments, regular reviewing and monitoring of client portfolios and providing regular market comments, comprehensive quarterly reports and attentive servicing of each client’s needs. For discretionary investment management services, we charge a quarterly management fee in arrears, which is generally determined on a sliding scale based on the portfolio value. Our services are independent, and a key point of differentiation to our clients is that we do not have proprietary funds to sell them, and all client assets are held in custody with a third party.
We also provide investment consulting services to individuals, companies and qualified retirement plans, which may include assistance in developing a written statement of investment policy to provide guidance on asset allocation, asset allocation studies, assistance with money manager searches and/or mutual fund selection, manager and/or mutual fund performance measurement and/or portfolio monitoring, review of portfolio allocation and construction and assistance with programs of employee investment education for firms sponsoring participant-directed retirement plans.
Encore Bank’s Trust Division
Encore Trust became a division of Encore Bank as of June 30, 2007 in connection with the merger of Encore Bank with Encore Trust Company, N.A. Prior to this merger, Encore Trust Company, N.A. was a subsidiary of Encore Bank. Encore Trust provides trust services primarily to individuals in Houston, Austin and Dallas. The personal trust business focuses primarily on the Houston market to service the needs of individuals. We also administer court-appointed trusts on behalf of individuals in Houston, Austin and Dallas who receive monetary awards. As of December 31, 2009, Encore Trust had $899.3 million in assets under management.
We deliver trust services to individuals under the supervision of trust professionals. Our level of involvement—from full management to specific assistance—is based on our client’s needs, the type of trust established and the responsibilities assigned in the trust agreement. Our trust officers possess an average of 25 years of trust experience, which enables them to provide prudent and efficient management of trust assets in administering complex financial holdings. We administer personal trusts, assist with estate trust administration, handle charitable trust and foundation needs and manage employee retirement assets in retirement programs, such as profit sharing plans, defined benefit plans, money purchase plans, individual retirement plans and non-qualified retirement trusts for employee benefit trusts.
11
Table of Contents
Index to Financial Statements
We also provide management of judgment or settlement awards for minors or incapacitated persons. We handle Section 142 Trusts, Section 867 Trusts, Special Needs Trusts, 468b Qualified Settlement Fund Trusts and U.S. Government Periodic Payment Trusts, which offer alternatives to registries of the court, annuities and guardianships. While the company we acquired and made a division of Encore Bank known as Encore Trust has been in business for over 50 years, approximately ten years ago the company created a special team to focus specifically on court trust business. Court-created trusts benefit clients by providing the flexibility to adapt the administration of the trust to the needs of our clients, as those needs change, protecting assets to balance near and long-term needs, allowing distributions without court expense, providing professional money management, creating a competitive return on investment, safeguarding against inflation, providing accurate trust accounting, allowing the ability to adjust to market conditions, avoiding liability and malpractice issues and having the balance of principal returned at the trust end, unlike the payout system of annuities.
Insurance
We offer a wide variety of personal and commercial property and casualty insurance products through our insurance agency, Town & Country. With offices in Houston, Galveston and Fort Worth, Town & Country has been providing personal and commercial insurance for over 40 years. As of December 31, 2009, we had approximately 8,100 insurance clients and were one of the largest independent insurance agencies in the Houston metropolitan area. Town & Country provides commercial, personal, and life and health insurance for businesses and individuals through a staff of 35 licensed and experienced insurance professionals. Our independent insurance professionals can help clients select the coverage and price best suited to their particular needs. In addition to home, auto, business and life insurance, we also offer condominium and renters insurance, fine art coverage, personal umbrella policies and boat insurance. Our commercial coverages include general liability, auto liability, workers compensation, property, professional liability, directors and officers liability, and accounts receivable coverage. Our insurance partners include Chubb Group, Fidelity National Financial, America First, Liberty Mutual, ACE, Hanover Insurance, Progressive, Texas Mutual Insurance Company, Travelers, The Hartford, Republic, Safeco, Utica National, Zurich Insurance, Lloyds and others.
Competition
The banking, wealth management and insurance businesses are highly competitive, and our profitability depends principally on our ability to compete in the market areas in which we are located. In our banking business, we experience substantial competition in attracting and retaining deposits and in originating loans. The primary factors we encounter in competing for deposits are convenient office locations and rates offered. Direct competition for deposits comes from other commercial banks and thrift institutions, money market mutual funds and corporate and government securities which may offer more attractive rates than insured depository institutions are willing to pay. The primary factors we encounter in competing for loans include, among other things, the interest rate, loan origination fees and the range of services offered. Competition for loans normally comes from other commercial banks, thrift institutions, mortgage bankers and mortgage brokers, and insurance companies. We believe that we have been able to compete effectively with other financial institutions by emphasizing client service, by establishing long-term relationships and building client loyalty, and by providing products and services designed to address the specific needs of our clients.
Our senior management reviews rate surveys weekly to ensure that we are consistently offering competitive rates. The financial institutions included in the surveys are located in our market areas and were selected based on their asset size, branch network and their consistent advertisement of similar products. We also survey the top ten mortgage lenders in each market to ensure that our rates are competitive. In addition, newspapers we advertise in are monitored weekly to review the competition’s advertising for both deposit and loan products.
Our loan and deposit rates are set by region, which enables us to respond timely to the local market conditions. We closely monitor competitor responses regarding our rates and product types to ensure that we are emphasizing the most effective products and utilizing the most efficient rates in each market. Ultimately, we seek to balance the rate levels in each region to achieve the appropriate overall target cost of funds.
12
Table of Contents
Index to Financial Statements
In providing wealth management services, we compete with a wide variety of firms including national and regional investment management and financial planning firms, broker-dealers, accounting firms, trust companies and law firms. Many of these companies have greater resources and may already have relationships with our clients in related product areas. We believe that our ability to compete effectively with other firms is dependent upon the quality and level of service, personal relationships, price and investment performance. These factors are also the basis for competition in the insurance industry. With respect to our insurance business, some of Town & Country’s competitors are larger and have greater resources than we do and operate on an international scale. We are also in competition with insurance providers that write insurance directly for their customers as well as companies that provide self-insurance and other employer-sponsored programs.
Supervision and Regulation
The following is a summary description of the relevant laws, rules and regulations governing banks and bank holding companies and our wealth management and insurance subsidiaries. The descriptions of, and references to, the statutes and regulations below are brief summaries and do not purport to be complete. The descriptions are qualified in their entirety by reference to the specific statutes and regulations discussed.
General
The supervision and regulation of bank holding companies and their subsidiaries is intended primarily for the protection of depositors, the Deposit Insurance Fund (DIF) of the FDIC and the banking system as a whole, and not for the protection of the bank holding company, shareholders or creditors. The banking agencies have broad enforcement power over bank holding companies and banks, including the power to impose substantial fines and other penalties for violations of laws and regulations.
Various legislation and proposals to overhaul the bank regulatory system and limit the investments that a depository institution may make with insured funds are introduced in Congress from time to time. Such legislation may change banking statutes and our operating environment and that of our banking subsidiary in substantial and unpredictable ways. In addition, the Texas state legislature from time to time considers legislation affecting insurance agencies operating in the state. We cannot determine the ultimate effect that any potential legislation, if enacted, or implemented regulations with respect thereto, would have upon the financial condition or results of operations of us or our subsidiaries.
Encore Bancshares, Inc.
On March 30, 2007, we converted from a thrift holding company to a bank holding company and registered with the Board of Governors of the Federal Reserve System (Federal Reserve) under the Bank Holding Company Act of 1956, as amended (BHCA). Our conversion was accomplished in connection with the conversion of Encore Bank from a federal savings association to a national bank. On July 21, 2008, we became a financial holding company. Accordingly, we are subject to supervision, regulation and examination by the Federal Reserve. The Gramm-Leach-Bliley Act (GLBA), the BHCA and other federal laws subject financial and bank holding companies to particular restrictions on the types of activities in which they may engage, and to a range of supervisory requirements and activities, including regulatory enforcement actions for violations of laws and regulations.
Regulatory Restrictions on Dividends; Source of Strength. We are regarded as a legal entity separate and distinct from Encore Bank. The principal source of our revenue is dividends received from Encore Bank. As described in more detail below, federal law places limitations on the amount that national banks may pay in dividends, which Encore Bank must adhere to when paying dividends to us. It is the policy of the Federal Reserve that bank holding companies should pay cash dividends on common stock only out of income available over the past year and only if prospective earnings retention is consistent with the organization’s expected future needs and financial condition. The policy provides that bank holding companies should not maintain a level of
13
Table of Contents
Index to Financial Statements
cash dividends that undermines the bank holding company’s ability to serve as a source of strength to its banking subsidiaries. In addition, it is Federal Reserve policy that we inform and consult with them prior to declaring and paying a dividend that could raise safety and soundness concerns, including dividends on the Series A Preferred Stock issued to the U.S. Treasury under the CPP or interest on the subordinated debentures underlying our trust preferred securities.
Under Federal Reserve policy, a bank holding company is expected to act as a source of financial strength to each of its banking subsidiaries and commit resources to their support. Such support may be required at times when, absent this Federal Reserve policy, a holding company may not be inclined to provide it. As discussed below, a bank holding company in certain circumstances could be required to guarantee the capital plan of an undercapitalized banking subsidiary.
In the event of a bank holding company’s bankruptcy under Chapter 11 of the U.S. Bankruptcy Code, the trustee will be deemed to have assumed and to cure immediately any deficit under any commitment by the debtor holding company to any of the federal banking agencies to maintain the capital of an insured depository institution. Any claim for breach of such obligation will generally have priority over most other unsecured claims.
Scope of Permissible Activities. Under the BHCA, bank holding companies generally may not acquire a direct or indirect interest in or control of more than 5% of the voting shares of any company that is not a bank or bank holding company or from engaging in activities other than those of banking, managing or controlling banks or furnishing services to or performing services for its subsidiaries, except that it may engage in, directly or indirectly, certain activities that the Federal Reserve has determined to be closely related to banking or managing and controlling banks as to be a proper incident thereto. These activities include, among other things, numerous services and functions performed in connection with lending, investing and financial counseling and tax planning. In approving acquisitions or the addition of activities, the Federal Reserve considers, among other things, whether the acquisition or the additional activities can reasonably be expected to produce benefits to the public, such as greater convenience, increased competition, or gains in efficiency, that outweigh such possible adverse effects as undue concentration of resources, decreased or unfair competition, conflicts of interest or unsound banking practices.
The GLBA, effective March 11, 2000, eliminated many of the historical barriers to affiliations among banks, securities firms, insurance companies and other financial service providers and permits bank holding companies to become financial holding companies and thereby affiliate with securities firms and insurance companies and engage in other activities that are financial in nature.
A bank holding company may become a financial holding company by filing a declaration with the Federal Reserve Board if each of its subsidiary banks is well capitalized under the Federal Deposit Insurance Corporation Improvement Act prompt-corrective-action provisions, is well managed, and has at least a satisfactory rating under the Community Reinvestment Act of 1977. We became a financial holding company on July 21, 2008.
Safe and Sound Banking Practices. Bank holding companies are not permitted to engage in unsafe and unsound banking practices. The Federal Reserve’s Regulation Y, for example, generally requires a holding company to give the Federal Reserve prior notice of any redemption or repurchase of its own equity securities, if the consideration to be paid, together with the consideration paid for any repurchases or redemptions in the preceding year, is equal to 10% or more of the holding company’s consolidated net worth. The Federal Reserve may oppose the transaction if it believes that the transaction would constitute an unsafe or unsound practice or would violate any law or regulation. Depending upon the circumstances, the Federal Reserve could take the position that paying a dividend would constitute an unsafe or unsound banking practice.
The Federal Reserve has broad authority to prohibit activities of bank holding companies and their nonbanking subsidiaries which represent unsafe and unsound banking practices or which constitute violations of laws or regulations, and can assess civil money penalties for certain activities conducted on a knowing and reckless basis, if those activities caused a substantial loss to a depository institution. The penalties can be as high as $1.0 million for each day the activity continues.
14
Table of Contents
Index to Financial Statements
Anti-Tying Restrictions. Bank holding companies and their affiliates are prohibited from tying the provision of certain services, such as extensions of credit, to other services offered by a holding company or its affiliates.
Capital Adequacy Requirements. The Federal Reserve has adopted a system using risk-based capital guidelines to evaluate the capital adequacy of bank holding companies. Under the guidelines, specific categories of assets are assigned different risk weights, based generally on the perceived credit risk of the asset. These risk weights are multiplied by corresponding asset balances to determine a “risk-weighted” asset base. The guidelines require a minimum total risk-based capital ratio of 8.0% (of which at least 4.0% is required to consist of Tier 1 capital elements). Total capital is the sum of Tier 1 and Tier 2 capital. As of December 31, 2009, our ratio of Tier 1 capital to total risk-weighted assets was 14.80% and our ratio of total capital to total risk-weighted assets was 16.07%.
In addition to the risk-based capital guidelines, the Federal Reserve uses a leverage ratio as an additional tool to evaluate the capital adequacy of bank holding companies. The leverage ratio is a company’s Tier 1 capital divided by its average total consolidated assets. Certain highly rated bank holding companies may maintain a minimum leverage ratio of 3.0%, but other bank holding companies are required to maintain a leverage ratio of 4.0%. As of December 31, 2009, our leverage ratio was 10.55%.
The federal banking agencies’ risk-based and leverage ratios are minimum supervisory ratios generally applicable to banking organizations that meet certain specified criteria. Banking organizations not meeting these criteria are expected to operate with capital positions well above the minimum ratios. The federal bank regulatory agencies may set capital requirements for a particular banking organization that are higher than the minimum ratios when circumstances warrant. Federal Reserve guidelines also provide that banking organizations experiencing internal growth or making acquisitions will be expected to maintain strong capital positions substantially above the minimum supervisory levels, without significant reliance on intangible assets.
Imposition of Liability for Undercapitalized Subsidiaries. Bank regulators are required to take prompt corrective action to resolve problems associated with insured depository institutions whose capital declines below certain levels. In the event an institution becomes “undercapitalized,” it must submit a capital restoration plan. The capital restoration plan will not be accepted by the regulators unless each company having control of the undercapitalized institution guarantees the subsidiary’s compliance with the capital restoration plan up to a certain specified amount. Any such guarantee from a depository institution’s holding company is entitled to a priority of payment in bankruptcy.
The aggregate liability of the holding company of an undercapitalized bank is limited to the lesser of 5% of the institution’s assets at the time it became undercapitalized or the amount necessary to cause the institution to be “adequately capitalized.” The bank regulators have greater power in situations where an institution becomes “significantly” or “critically” undercapitalized or fails to submit a capital restoration plan. For example, a bank holding company controlling such an institution can be required to obtain prior Federal Reserve approval of proposed dividends, or might be required to consent to a consolidation or to divest the troubled institution or other affiliates.
Acquisitions by Bank Holding Companies. The BHCA requires every bank holding company to obtain the prior approval of the Federal Reserve before it may acquire all or substantially all of the assets of any bank, or ownership or control of any voting shares of any bank, if after such acquisition it would own or control, directly or indirectly, more than 5% of the voting shares of such bank. In approving bank acquisitions by bank holding companies, the Federal Reserve is required to consider, among other things, the financial and managerial resources and future prospects of the bank holding company and the banks concerned, the convenience and needs of the communities to be served, and various competitive factors.
Control Acquisitions. The Change in Bank Control Act (CBCA) prohibits a person or group of persons from acquiring “control” of a bank holding company unless the Federal Reserve has been notified and has not objected to the transaction. Under a rebuttable presumption established by the Federal Reserve, the acquisition of 10% or
15
Table of Contents
Index to Financial Statements
more of a class of voting stock of a bank holding company with a class of securities registered under Section 12 of the Securities Exchange Act of 1934, as amended (Exchange Act), such as us, under the circumstances set forth in the presumption, constitutes acquisition of control of our company.
In addition, the CBCA prohibits any entity from acquiring 25% (5% in the case of an acquiror that is a bank holding company) or more of a bank holding company’s or bank’s voting securities, or otherwise obtaining control or a controlling influence over a bank holding company or bank without the prior approval of the Federal Reserve. In most circumstances, an entity that owns 25% or more of the voting securities of a banking organization owns enough of the capital resources to have a controlling influence over such banking organization for purposes of the CBCA. On September 22, 2008, the Federal Reserve issued a policy statement on equity investments in bank holding companies and banks, which allows the Federal Reserve to generally be able to conclude that an entity’s investment is not “controlling” if the entity does not own in excess of 15% of the voting power and 33% of the total equity of the bank holding company or bank. Depending on the nature of the overall investment and the capital structure of the banking organization, based on the policy statement, the Federal Reserve Board will permit noncontrolling investments in the form of voting and nonvoting shares that represent in the aggregate (i) less than one-third of the total equity of the banking organization (and less than one-third of any class of voting securities, assuming conversion of all convertible nonvoting securities held by the entity) and (ii) less than 15% of any class of voting securities of the banking organization.
Encore Bank
On March 30, 2007, Encore Bank converted from a federal savings association to a national bank. As a national banking association, the deposits of Encore Bank are insured by the DIF of the FDIC. Encore Bank’s primary regulator is the Office of the Comptroller of the Currency (OCC). By virtue of the insurance of its deposits, however, Encore Bank is also subject to supervision and regulation by the FDIC. In addition, because Encore Bank is also a member of the Federal Reserve System, it is subject to regulation pursuant to the Federal Reserve Act. Such supervision and regulation subjects Encore Bank to special restrictions, requirements, potential enforcement actions and periodic examination by the OCC. Because the Federal Reserve regulates us as a holding company parent of Encore Bank, the Federal Reserve’s supervisory authority over us directly affects Encore Bank.
Financial Modernization. Under the GLBA, a national bank may establish a financial subsidiary and engage, subject to limitations on investment, in activities that are financial in nature, other than insurance underwriting, insurance company portfolio investment, real estate development, real estate investment, annuity issuance and merchant banking activities. To do so, a bank must be well capitalized, well managed and have a Community Reinvestment Act (CRA) rating of satisfactory or better. National banks with financial subsidiaries must remain well capitalized and well managed in order to continue to engage in activities that are financial in nature without regulatory actions or restrictions, which could include divestiture of the financial in nature subsidiary or subsidiaries. In addition, a bank may not acquire a company that is engaged in activities that are financial in nature unless that bank has a CRA rating of satisfactory or better. Currently, Encore Bank has a CRA rating of satisfactory.
Branching. The establishment of a branch must be approved by the OCC, which considers a number of factors, including financial history, capital adequacy, earnings prospects, character of management, needs of the community and consistency with corporate powers.
Restrictions on Transactions with Affiliates and Insiders. Transactions between Encore Bank and its non-banking affiliates, including us, are subject to Section 23A of the Federal Reserve Act. An affiliate of a bank is any company or entity that controls, is controlled by, or is under common control with that bank. In general, Section 23A imposes limits on the amount of such transactions, and also requires certain levels of collateral for loans to affiliated parties. It also limits the amount of advances to third parties which are collateralized by our securities or obligations of our non-banking subsidiaries.
16
Table of Contents
Index to Financial Statements
Affiliate transactions are also subject to Section 23B of the Federal Reserve Act which generally requires that certain transactions between the bank and its affiliates be on terms substantially the same, or at least as favorable to the bank, as those prevailing at the time for comparable transactions with or involving other nonaffiliated persons. The Federal Reserve has also issued Regulation W, which codifies prior regulations under Sections 23A and 23B of the Federal Reserve Act, and interpretive guidance with respect to affiliate transactions.
The restrictions on loans to directors, executive officers, principal shareholders and their related interests (collectively referred to herein as “insiders”) contained in the Federal Reserve Act and Regulation O apply to all insured depository institutions and their subsidiaries. These restrictions include limits on loans to one borrower and conditions that must be met before such a loan can be made. There is also an aggregate limitation on all loans to insiders and their related interests. These loans cannot exceed the institution’s total unimpaired capital and surplus, and the OCC may determine that a lesser amount is appropriate. Insiders are subject to enforcement actions for knowingly accepting loans in violation of applicable restrictions.
Restrictions on Distribution of Subsidiary Bank Dividends and Assets. Capital adequacy requirements serve to limit the amount of dividends that may be paid by Encore Bank to us as its parent company. Until capital surplus equals or exceeds capital stock, a national bank must transfer to surplus 10% of its net income for the preceding four quarters in the case of an annual dividend or 10% of its net income for the preceding two quarters in the case of a quarterly or semiannual dividend. As of December 31, 2009, Encore Bank’s capital surplus exceeded its capital stock. Without prior approval, a national bank may not declare a dividend if the total amount of all dividends declared by that bank in any calendar year exceeds the total of that bank’s retained net income for the current year and retained net income for the preceding two years. Under federal law, Encore Bank cannot pay a dividend if, after paying the dividend, it will be “undercapitalized.” The OCC may declare a dividend payment to be unsafe and unsound even though Encore Bank would continue to meet its capital requirements after the dividend.
Because we are a legal entity separate and distinct from our subsidiaries, our right to participate in the distribution of assets of any subsidiary upon the subsidiary’s liquidation or reorganization will be subject to the prior claims of the subsidiary’s creditors. In the event of a liquidation or other resolution of an insured depository institution, the claims of depositors and other general or subordinated creditors are entitled to a priority of payment over the claims of holders of any obligation of the institution to its shareholders, arising as a result of their status as shareholders, including any depository institution holding company (such as us) or any shareholder or creditor thereof.
Examinations. The OCC periodically examines and evaluates insured banks. Based upon such an evaluation, the OCC may revalue the assets of the institution and require that it establish specific reserves to compensate for the difference between the OCC-determined value and the book value of such assets.
Audit Reports. Insured institutions with total assets of $500 million or more must submit annual audit reports prepared by independent auditors to federal regulators. In some instances, the audit report of the institution’s holding company can be used to satisfy this requirement. Auditors must receive examination reports, supervisory agreements, and reports of enforcement actions. For institutions with total assets of $1 billion or more, financial statements prepared in accordance with accounting principles generally accepted in the U.S., management’s certifications concerning responsibility for the financial statements, internal controls and compliance with legal requirements designated by the OCC, and an attestation by the auditor regarding the statements of management relating to the internal controls must be submitted. For institutions with total assets of $3 billion or more, independent auditors may be required to review quarterly financial statements. The Federal Deposit Insurance Corporation Improvement Act of 1991 (FDICIA) requires that independent audit committees, consisting of outside directors only, be formed. The committees of such institutions must include members with experience in banking or financial management, must have access to outside counsel, and must not include representatives of large clients.
17
Table of Contents
Index to Financial Statements
Capital Adequacy Requirements. Similar to the Federal Reserve’s requirements for bank holding companies, the OCC has adopted regulations establishing minimum requirements for the capital adequacy of national banks. The OCC may establish higher minimum requirements if, for example, a bank has previously received special attention or has a high susceptibility to interest rate risk.
The OCC’s risk-based capital guidelines generally require national banks to have a minimum ratio of Tier 1 capital to total risk-weighted assets of 4.0% and a ratio of total capital to total risk-weighted assets of 8.0%. As of December 31, 2009, Encore Bank’s ratio of Tier 1 capital to total risk-weighted assets was 12.72% and its ratio of total capital to total risk-weighted assets was 13.98%.
The OCC’s leverage guidelines require national banks to maintain Tier 1 capital of no less than 4.0% of average total assets, except in the case of certain highly rated banks for which the requirement is 3.0% of average total assets unless a higher leverage capital ratio is warranted by the particular circumstances or risk profile of the depository institution. As of December 31, 2009, Encore Bank’s ratio of Tier 1 capital to average total assets (leverage ratio) was 9.11%
Corrective Measures for Capital Deficiencies. The federal banking regulators are required to take prompt corrective action with respect to capital-deficient institutions. Agency regulations define, for each capital category, the levels at which institutions are “well capitalized,” “adequately capitalized,” “under capitalized,” “significantly under capitalized” and “critically under capitalized.” A “well capitalized” bank has a total risk-based capital ratio of 10.0% or higher; a Tier 1 risk-based capital ratio of 6.0% or higher; a leverage ratio of 5.0% or higher; and is not subject to any written agreement, order or directive requiring it to maintain a specific capital level for any capital measure. An “adequately capitalized” bank has a total risk-based capital ratio of 8.0% or higher; a Tier 1 risk-based capital ratio of 4.0% or higher; a leverage ratio of 4.0% or higher (3.0% or higher if that bank was rated a composite 1 in its most recent examination report and is not experiencing significant growth); and does not meet the criteria for a well capitalized bank. A bank is “under capitalized” if it fails to meet any one of the ratios required to be adequately capitalized.
In addition to requiring undercapitalized institutions to submit a capital restoration plan, agency regulations authorize broad restrictions on certain activities of undercapitalized institutions including asset growth, acquisitions, branch establishment, and expansion into new lines of business. With certain exceptions, an insured depository institution is prohibited from making capital distributions, including dividends, and is prohibited from paying management fees to control persons if the institution would be undercapitalized after any such distribution or payment.
As an institution’s capital decreases, the OCC’s enforcement powers increase. A significantly undercapitalized institution is subject to mandated capital raising activities, restrictions on interest rates paid and transactions with affiliates, removal of management, and other restrictions. The OCC has only limited discretion in dealing with a critically undercapitalized institution and is required to undertake stringent measures to protect the interests of deposits and the DIF, which depending on the circumstances, could include the appointment of a receiver or conservator.
Banks with risk-based capital and leverage ratios below the required minimums may also be subject to certain administrative actions, including the termination of deposit insurance upon notice and hearing, or a temporary suspension of insurance without a hearing in the event the institution has no tangible capital.
Deposit Insurance Assessments. Encore Bank must pay assessments to the FDIC for deposit insurance protection. The FDIC maintains the DIF by designating a reserve ratio between a range of 1.15% to 1.50%. If the reserve ratio falls below 1.15%, the FDIC must adopt a restoration plan that provides that the DIF will return to 1.15% generally within 5 years. If the reserve ratio exceeds 1.35%, the FDIC must generally dividend to DIF members half of the amount above the amount necessary to maintain the DIF at 1.35%. The FDIC declares a 50% dividend when the reserve ratio reaches 1.35% and a 100% dividend when the reserve ratio reaches above
18
Table of Contents
Index to Financial Statements
1.50%. The designated reserve ratio is currently set at 1.25%. The FDIC has the discretion to price deposit insurance according to the risk for all insured institutions regardless of the level of the reserve ratio.
The DIF reserve ratio is maintained by assessing depository institutions an insurance premium based upon statutory factors that include the balance of insured deposits as well as the degree of risk the institution poses to the insurance fund. Under a risk-based assessment system required by the FDICIA, FDIC-insured depository institutions pay quarterly insurance premiums at rates based on their risk classification. Institutions assigned to higher-risk classifications (that is, institutions that pose a greater risk of loss to their respective deposit insurance funds) pay assessments at higher rates than institutions that pose a lower risk. An institution’s risk classification is assigned based on its capital levels and the level of supervisory concern the institution poses to regulators. An institution’s risk assignment includes assignment to Risk Category I, II, III, or IV.
On January 1, 2009, the FDIC increased the DIF assessment rates as part of the FDIC’s DIF restoration plan. Effective April 1, 2009, total base assessment rates range from 7 to 24 basis points for Risk Category I institutions, 17 to 43 basis points for Risk Category II institutions, 27 to 58 basis points for Risk Category III institutions, and 40 to 77.5 basis points for Risk Category IV institutions. Assessments are paid quarterly by all institutions and are based upon the assessment base that an institution reports at the end of that quarter. Risk assessments remain in effect for future assessment periods until changed by the FDIC.
In May 2009, the FDIC issued a final rule which levied a special assessment applicable to all insured depository institutions totaling 5 basis points of each institution’s total assets less Tier 1 capital as of June 30, 2009, not to exceed 10 basis points of domestic deposits. The special assessment was paid September 30, 2009 and was part of the FDIC’s efforts to rebuild the DIF. Our deposit insurance expense during 2009 included approximately $684,000 recognized in the second quarter related to the special assessment.
In November 2009, the FDIC issued a rule that required all insured depository institutions, with limited exceptions, to prepay their estimated quarterly risk-based assessments for the fourth quarter of 2009 and for all of 2010, 2011 and 2012 on December 30, 2009. The assessment was calculated by taking the institution’s actual September 30, 2009 assessment base and increasing it quarterly by an estimated 5% annual growth rate through the end of 2012. The FDIC also adopted a uniform three basis point increase in assessment rates effective on January 1, 2011. Under GAAP accounting rules, the prepaid assessments would not immediately affect a bank’s earnings. Each institution records the entire amount of the prepaid assessment as a prepaid expense, an asset on its balance sheet, as of December 30, 2009, the date the payment was made. As of December 31, 2009, and each quarter thereafter, each institution records an expense for its quarterly assessment invoiced on its quarterly statement and an offsetting credit to the prepaid assessment until the asset is exhausted. The FDIC would also have the authority to exercise its discretion as supervisor and insurer to exempt an institution from the prepayment requirement if the FDIC determines that the prepayment would significantly impair the institution’s liquidity or would otherwise create significant hardship.
Enforcement Powers. The FDIC and the other federal banking agencies have broad enforcement powers, including the power to terminate deposit insurance, impose substantial fines and other civil and criminal penalties and appoint a conservator or receiver. Failure to comply with applicable laws, regulations and supervisory agreements could subject us or our banking subsidiaries, as well as officers, directors and other institution-affiliated parties of these organizations, to administrative sanctions and potentially substantial civil money penalties. The appropriate federal banking agency may appoint the FDIC as conservator or receiver for a banking institution (or the FDIC may appoint itself, under certain circumstances) if any one or more of a number of circumstances exist, including, without limitation, the fact that the banking institution is undercapitalized and has no reasonable prospect of becoming adequately capitalized, fails to become adequately capitalized when required to do so, fails to submit a timely and acceptable capital restoration plan or materially fails to implement an accepted capital restoration plan.
19
Table of Contents
Index to Financial Statements
Brokered Deposit Restrictions. Adequately capitalized institutions (as defined for purposes of the prompt corrective action rules described above) cannot accept, renew or roll over brokered deposits except with a waiver from the FDIC, and are subject to restrictions on the interest rates that can be paid on such deposits. Undercapitalized institutions may not accept, renew, or roll over brokered deposits.
Cross-Guarantee Provisions. The Financial Institutions Reform, Recovery and Enforcement Act of 1989 (FIRREA) contains a cross-guarantee provision which generally makes commonly controlled insured depository institutions liable to the FDIC for any losses incurred in connection with the failure of a commonly controlled depository institution.
Community Reinvestment Act. Under the Community Reinvestment Act as implemented by Congress in 1977, a financial institution has a continuing and affirmative obligation, consistent with its safe and sound operation, to help meet the credit needs of its entire community, including low and moderate income neighborhoods. The CRA does not establish specific lending requirements or programs for financial institutions nor does it limit an institution’s discretion to develop the types of products and services that it believes are best suited to its particular community, consistent with the CRA. The CRA requires federal examiners, in connection with the examination of a financial institution, to assess the institution’s record of meeting the credit needs of its community and to take such record into account in its evaluation of certain applications by such institution. The CRA also requires all institutions to make public disclosure of their CRA ratings. In 2009, Encore Bank received a satisfactory rating in meeting community credit needs under the CRA in our most recent examination for CRA performance.
Consumer Laws and Regulations. In addition to the laws and regulations discussed herein, Encore Bank is also subject to certain consumer laws and regulations that are designed to protect consumers in transactions with banks. While the list set forth herein is not exhaustive, these laws and regulations include the Truth in Lending Act, the Truth in Savings Act, the Electronic Funds Transfer Act, the Expedited Funds Availability Act, the Equal Credit Opportunity Act and the Fair Housing Act, among others. These laws and regulations mandate certain disclosure requirements and regulate the manner in which financial institutions must deal with clients when taking deposits or making loans to such clients. Encore Bank must comply with all applicable provisions of these consumer protection laws and regulations as part of its ongoing compliance and client relations programs.
Privacy. In addition to expanding the activities in which banks and bank holding companies may engage, the GLBA imposes new requirements on financial institutions with respect to client privacy. The GLBA generally prohibits disclosure of client information to non-affiliated third parties unless the client has been given the opportunity to object and has not objected to such disclosure. Financial institutions are further required to disclose their privacy policies to clients annually. Financial institutions, however, will be required to comply with state law if it is more protective of client privacy than the GLBA. The privacy provisions became effective on July 1, 2002. The GLBA contains a variety of other provisions including a prohibition against ATM surcharges unless the client has first been provided notice of the imposition and amount of the fee.
Anti-Money Laundering and Anti-Terrorism Legislation. Congress enacted the Bank Secrecy Act of 1970 (BSA) to require financial institutions, including us and Encore Bank, to maintain certain records and to report certain transactions to prevent such institutions from being used to hide money derived from criminal activity and tax evasion. The BSA establishes, among other things, (1) record keeping requirements to assist government enforcement agencies in tracing financial transactions and flow of funds; (2) reporting requirements for Suspicious Activity Reports and Currency Transaction Reports to assist government enforcement agencies in detecting patterns of criminal activity; (3) enforcement provisions authorizing criminal and civil penalties for illegal activities and violations of the BSA and its implementing regulations; and (4) safe harbor provisions that protect financial institutions from civil liability for their cooperative efforts.
Title III of the Patriot Act (Patriot Act) amended the BSA and incorporates anti-terrorist financing provisions into the requirements of the BSA and its implementing regulations. Among other things, the Patriot
20
Table of Contents
Index to Financial Statements
Act requires all financial institutions, including us, Encore Bank and our nonbanking affiliates and subsidiaries, to institute and maintain a risk-based anti-money laundering compliance program that includes a customer identification program, provides for information sharing with law enforcement and between certain financial institutions by means of an exemption from the privacy provisions of the GLBA, prohibits U.S. banks and broker-dealers from maintaining accounts with foreign “shell” banks, establishes due diligence and enhanced due diligence requirements for certain foreign correspondent banking and foreign private banking accounts and imposes additional record keeping requirements for certain correspondent banking arrangements. The Patriot Act also grants broad authority to the Secretary of the U.S. Treasury to take actions to combat money laundering, and federal bank regulators are required to evaluate the effectiveness of an applicant in combating money laundering in determining whether to approve any application submitted by a financial institution. We have adopted policies, procedures and controls designed to comply with the BSA and the Patriot Act.
The U.S. Treasury’s Office of Foreign Asset Control (OFAC) administers and enforces economic and trade sanctions against targeted foreign countries, entities and individuals based on U.S. foreign policy and national security goals. As a result, financial institutions, including us and Encore Bank and our nonbanking affiliates and subsidiaries, must scrutinize transactions to ensure that they do not represent obligations of, or ownership interests in, entities owned or controlled by sanctioned targets. In addition, we and Encore Bank and our nonbanking affiliates and subsidiaries restrict transactions with certain targeted countries except as permitted by OFAC.
Concentrated Commercial Real Estate Lending Regulations. The federal banking agencies, including the FDIC, have promulgated guidance governing financial institutions with concentrations in commercial real estate lending. The guidance provides that a bank has a concentration in commercial real estate lending if (1) total reported loans for construction, land development, and other land represent 100% or more of total capital or (2) total reported loans secured by multifamily and non-farm residential properties and loans for construction, land development, and other land represent 300% or more of total capital and the bank’s commercial real estate loan portfolio has increased 50% or more during the prior 36 months. Owner occupied loans are excluded from this second category. If a concentration is present, management must employ heightened risk management practices including board and management oversight and strategic planning, development of underwriting standards, risk assessment and monitoring through market analysis and stress testing, and increasing capital requirements.
Regulation of Nonbanking Subsidiaries
Linscomb & Williams. Linscomb & Williams is a Texas corporation and an investment adviser that is registered with the SEC under the Investment Advisers Act of 1940. Under the Investment Advisers Act, an investment adviser is subject to supervision and inspection by the SEC. A significant element of supervision under the Investment Advisers Act is the requirement to make significant disclosures to the public under Part II of Form ADV of the adviser’s services and fees, the qualifications of its associated persons, financial difficulties and potential conflicts of interests. An investment adviser must keep extensive books and records, including all customer agreements, communications with clients, orders placed and proprietary trading by the adviser or any advisory representative.
Town & Country. Town & Country is a Texas corporation licensed to sell insurance policies in the State of Texas by the Texas Department of Insurance. The Texas Insurance Code provides that licensed agents are subject to regulation requirements of the Texas Department of Insurance. The requirements include maintaining books and records and continuing education. In addition, Town & Country is licensed to sell insurance in a number of other states and accordingly, is subject to regulation in those states.
Expanding Enforcement Authority
One of the major additional burdens imposed on the banking industry by FDICIA is the increased ability of banking regulators to monitor the activities of banks and their holding companies. In addition, the Federal Reserve and FDIC possess extensive authority to police unsafe or unsound practices and violations of applicable
21
Table of Contents
Index to Financial Statements
laws and regulations by depository institutions and their holding companies. For example, the FDIC may terminate the deposit insurance of any institution which it determines has engaged in an unsafe or unsound practice. The agencies can also assess civil money penalties, issue cease and desist or removal orders, seek injunctions, and publicly disclose such actions. FDICIA, FIRREA and other laws have expanded the agencies’ authority in recent years, and the agencies have not yet fully tested the limits of their powers.
Effect on Economic Environment
The policies of regulatory authorities, including the monetary policy of the Federal Reserve, have a significant effect on the operating results of bank holding companies and their subsidiaries. Among the means available to the Federal Reserve to affect the money supply are open market operations in U.S. government securities, changes in the discount rate on member bank borrowings, and changes in reserve requirements against member bank deposits. These means are used in varying combinations to influence overall growth and distribution of bank loans, investments and deposits, and their use may affect interest rates charged on loans or paid for deposits.
Federal Reserve monetary policies have materially affected the operating results of commercial banks in the past and are expected to continue to do so in the future. The nature of future monetary policies and the effect of such policies on our business and operations of us and those of our subsidiaries cannot be predicted.
Legislative Initiatives
In light of current conditions and the market outlook for continuing weak economic conditions, regulators have increased their focus on the regulation of financial institutions. A number of government initiatives designed to respond to the current conditions have been introduced recently and proposals for legislation that could substantially intensify the regulation of financial institutions are expected to be introduced in Congress and State Legislatures. Such initiatives may change banking statutes and the operating environment for us and Encore Bank in substantial and unpredictable ways. We cannot determine the ultimate effect that any potential legislation, if enacted, or implementing regulations with respect thereto, would have, upon the financial condition or results of our operations or the operations of Encore Bank. A change in statutes, regulations or regulatory policies applicable to us or Encore Bank could have a material effect on the financial condition, results of operations or business of our company and Encore Bank.
Regulatory Reform. In June 2009, the U.S. President’s administration proposed a wide range of regulatory reforms that, if enacted, may have significant effects on the financial services industry in the United States. Significant aspects of the administration’s proposals that may affect us included, among other things, proposals: (i) to reassess and increase capital requirements for banks and bank holding companies and examine the types of instruments that qualify as regulatory capital; (ii) to expand the current eligibility requirements for financial holding companies such as us so that the financial holding company must be “well capitalized” and “well managed” on a consolidated basis; (iii) to create a federal consumer financial protection agency to be the primary federal consumer protection supervisor with broad examination, supervision and enforcement authority with respect to consumer financial products and services; and (iv) to further limit the ability of banks to engage transactions with affiliates.
Separate comprehensive financial reform bills intended to address the proposals set forth by the administration were introduced in both houses of Congress in the second half of 2009 and remain under review by both the U.S. House of Representatives and the U.S. Senate. We cannot predict whether or in what form further legislation or regulations may be adopted or the extent to which we may be affected thereby.
Incentive Compensation. On October 22, 2009, the Federal Reserve issued a comprehensive proposal on incentive compensation policies (Incentive Compensation Proposal) intended to ensure that the incentive compensation policies of banking organizations do not undermine the safety and soundness of such organizations
22
Table of Contents
Index to Financial Statements
by encouraging excessive risk-taking. The Incentive Compensation Proposal, which covers all employees that have the ability to materially affect the risk profile of an organization, either individually or as part of a group, is based upon the key principles that a banking organization’s incentive compensation arrangements should (i) provide incentives that do not encourage risk-taking beyond the organization’s ability to effectively identify and manage risks, (ii) be compatible with effective internal controls and risk management, and (iii) be supported by strong corporate governance, including active and effective oversight by the organization’s board of directors. Banking organizations are instructed to begin an immediate review of their incentive compensation policies to ensure that they do not encourage excessive risk-taking and implement corrective programs as needed. Where there are deficiencies in the incentive compensation arrangements, they must be immediately addressed.
The Federal Reserve will review, as part of the regular, risk-focused examination process, the incentive compensation arrangements of banking organizations, such as us, that are not “large, complex banking organizations.” These reviews will be tailored to each organization based on the scope and complexity of the organization’s activities and the prevalence of incentive compensation arrangements. The findings of the supervisory initiatives will be included in reports of examination. Deficiencies will be incorporated into the organization’s supervisory ratings, which can affect the organization’s ability to make acquisitions and take other actions. Enforcement actions may be taken against a banking organization if its incentive compensation arrangements, or related risk-management control or governance processes, pose a risk to the organization’s safety and soundness and the organization is not taking prompt and effective measures to correct the deficiencies.
The scope and content of the U.S. banking regulators’ policies on executive compensation are continuing to develop and are likely to continue evolving in the near future. It cannot be determined at this time whether compliance with such policies will adversely affect our ability to hire, retain and motivate our key employees.
The United States government, particularly the U.S. Treasury and the FDIC, have taken a variety of extraordinary measures designed to restore confidence in the financial markets and to strengthen financial institutions, including capital injections, guarantees of bank liabilities and the acquisition of illiquid assets from banks. One such law, the ESSA granted the U.S. Treasury the authority to take a range of actions for the purpose of stabilizing and providing liquidity to the U.S. financial markets and included several programs, including many of the programs described below. We cannot predict at this time the effect that the recent legislative initiatives may have on our business, financial condition or results of operations.
U.S. Treasury Capital Purchase Program. On October 3, 2008, the Emergency Economic Stabilization Act of 2008 (EESA) (initially introduced as the Troubled Asset Relief Program or TARP) was enacted. TARP gave the U.S. Treasury authority to deploy up to $700 billion into the financial system with an objective of improving liquidity in capital markets. On October 14, 2008, the U.S. Treasury announced the CPP, which provides for direct equity investment of perpetual preferred stock by the U.S. Treasury in qualified financial institutions. The program is voluntary and requires an institution to comply with a number of restrictions and provisions, including limits on executive compensation, stock redemptions and declaration of dividends. The CPP provides for the purchase by the U.S. Treasury of perpetual senior preferred stock in an aggregate amount ranging from 1% to 3% of a participant’s risk-weighted assets. The CPP also requires a public company participant to issue to the U.S. Treasury warrants to purchase common stock equal to 15% of the capital invested by the U.S. Treasury. We elected to participate in the CPP, and on December 5, 2008, we issued and sold to the U.S. Treasury (i) 34,000 shares of Series A Preferred Stock and (ii) a Warrant to purchase up to 364,026 shares of our common stock, at an exercise price of $14.01 per share, subject to certain anti-dilution and other adjustments, for an aggregate purchase price of $34.0 million in cash.
Temporary Liquidity Guarantee Program. In November 2008, the Board of Directors of the FDIC adopted a final rule relating to the Temporary Liquidity Guarantee Program (TLGP). Under the TLGP, the FDIC will (i) guarantee, through the earlier of maturity or December 31, 2012 (extended from June 30, 2012 by subsequent amendment), certain newly issued senior unsecured debt issued by participating institutions on or after October 14, 2008, and before October 31, 2009 (extended from June 30, 2009 by subsequent amendment) and
23
Table of Contents
Index to Financial Statements
(ii) provide full FDIC deposit insurance coverage for non-interest bearing transaction deposit accounts, Negotiable Order of Withdrawal (NOW) accounts paying less than 0.5% interest per annum and Interest on Lawyers Trust Accounts held at participating FDIC insured institutions through June 30, 2010 (extended from December 31, 2009, subject to an opt-out provision, by subsequent amendment). We elected to participate in both guarantee programs and did not opt out of the six-month extension of the transaction account guarantee program. We do not intend to issue any senior unsecured dept under the TLGP. Coverage under the TLGP was available for the first 30 days without charge. The fee assessment for deposit insurance coverage was 10 basis points per quarter during 2009 on amounts in covered accounts exceeding $250,000. During the six-month extension period in 2010, the fee assessment increases to 15 basis points per quarter for institutions that are in Risk Category 1 of the risk-based premium system.
American Recovery and Reinvestment Act of 2009. On February 17, 2009, the American Recovery and Reinvestment Act of 2009 (ARRA) was signed into law. Section 7001 of the ARRA amended Section 111 of the EESA in its entirety. While the U.S. Treasury must promulgate regulations to implement the restrictions and standards set forth in Section 7001, the ARRA, among other things, significantly expands the executive compensation restrictions previously imposed by the EESA. Such restrictions apply to any entity that has received or will receive financial assistance under the TARP, and shall generally continue to apply for as long as any obligation arising from financial assistance provided under TARP, including preferred stock we issued under the CPP, remains outstanding. These ARRA restrictions shall not apply to any TARP recipient during such time when the U.S. Treasury (i) only holds a warrant to purchase common stock of such recipient or (ii) holds no preferred stock or warrant to purchase common stock of such recipient.
As a result of our participation in the CPP, the restrictions and standards set forth in Section 7001 of the ARRA are applicable to us, subject to regulations to be promulgated by the U.S. Treasury. Pursuant to Section 7001(g) of the ARRA, we are permitted to repay the $34.0 million received under the CPP, subject to approval by our primary Federal banking regulator, without regard to certain repayment restrictions in the Securities Purchase Agreement.
Employees
As of December 31, 2009, we had 309 full-time employees. Management considers our relations with employees to be good. Neither we nor Encore Bank or any of its subsidiaries are a party to any collective bargaining agreement.
An investment in our common stock involves risks. The following is a description of the material risks and uncertainties that we believe affect our business and an investment in our common stock. Additional risks and uncertainties that we are unaware of, or that we currently deem immaterial, also may become important factors that affect us and our business. If any of the risks described in this Annual Report on Form 10-K were to occur, our financial condition and results of operations could be materially and adversely affected. If this were to happen, the value of our common stock could decline significantly and you could lose all or part of your investment.
Risks Associated With Our Business
Difficult market conditions and economic trends have adversely affected the banking industry and could adversely affect our business, financial condition and results of operations.
We are operating in a challenging and uncertain economic environment, including generally uncertain conditions nationally and locally in our markets. Financial institutions continue to be affected by declines in the real estate market that have negatively impacted the credit performance of mortgage, construction and
24
Table of Contents
Index to Financial Statements
commercial real estate loans and resulted in significant write-downs of assets by many financial institutions. Concerns over the stability of the financial markets and the economy have resulted in decreased lending by financial institutions to their customers and to each other. We retain direct exposure to the residential and commercial real estate markets, and we are affected by these events. Continued declines in real estate values, home sales volumes and financial stress on borrowers as a result of the uncertain economic environment, including job losses, could have an adverse affect on our borrowers or their customers, which could adversely affect our business, financial condition and results of operations.
Our ability to assess the creditworthiness of customers and to estimate the losses as they are incurred in our loan portfolio is made more complex by these difficult market and economic conditions. We also expect to face increased regulation and government oversight as a result of these downward trends. This increased government action may increase our costs and limit our ability to pursue certain business opportunities. In addition, we may be required to pay even higher FDIC deposit insurance premiums than the recently increased level, because financial institution failures resulting from the depressed market conditions and other factors have depleted and may continue to deplete the DIF and reduce its ratio of reserves to insured deposits.
A prolonged national economic recession or further deterioration of these conditions in our markets could drive the rate of losses beyond that which has been provided for in our recent quarterly provisions for loan losses and result in the following consequences:
| • | increases in loan delinquencies; |
| • | increases in nonperforming assets and foreclosures; |
| • | decreases in demand for our products and services, which could adversely affect our liquidity position; and |
| • | decreases in the value of the collateral securing our loans, especially real estate, which could reduce customers’ borrowing power. |
A worsening of these conditions would likely exacerbate the adverse effects of these difficult economic conditions on us, our customers and the other financial institutions in our markets. As a result, we may experience increases in loan loss provisions, foreclosures, delinquencies and customer bankruptcies, as well as more restricted access to funds.
Liquidity risk could impair our ability to fund operations and jeopardize our financial condition.
Liquidity is essential to our business. An inability to raise funds at an acceptable cost through deposits, borrowings, the sale of loans and other sources could have a substantial negative effect on our liquidity. Our access to funding sources in amounts adequate to finance our activities or on terms which are acceptable to us could be impaired by factors that affect us specifically or the financial services industry or economy in general. Factors that could detrimentally impact our access to liquidity sources include a decrease in the level of our business activity as a result of a downturn in the markets in which our loans are concentrated or adverse regulatory action against us. Our ability to borrow could also be impaired by factors that are not specific to us, such as a disruption in the financial markets or negative views and expectations about the prospects for the financial services industry in light of the recent turmoil faced by banking organizations and the continued deterioration in credit markets.
Future growth or operating results may require us to raise additional capital, but that capital may not be available or it may be dilutive.
We and Encore Bank are each required by the Federal Reserve and the OCC, respectively, to maintain adequate levels of capital to support our operations. In the event that our future operating results erode capital, if Encore Bank is required to maintain capital in excess of well-capitalized standards, or if we elect to expand
25
Table of Contents
Index to Financial Statements
through loan growth or acquisitions, we may be required to raise additional capital. Our ability to raise capital will depend on conditions in the capital markets, which are outside our control, and on our financial performance. Accordingly, we cannot be assured of our ability to raise capital on favorable terms when needed, or at all. If we cannot raise additional capital when needed, we will be subject to increased regulatory supervision and the imposition of restrictions on our growth and business. These outcomes could negatively impact our ability to operate or further expand our operations through acquisitions or the establishment of additional private client offices and may result in increases in operating expenses and reductions in revenues that could have a material adverse effect on our financial condition and results of operations. In addition, in order to raise additional capital, we may need to issue shares of our common stock that would dilute the book value of our common stock and reduce our current shareholders’ percentage ownership interest to the extent they do not participate in future offerings.
Failure to complete the pending transactions for the sale of our Florida operations could materially and adversely affect our business, financial condition and results of operations.
On March 15, 2010, Encore Bank executed two separate purchase and assumption agreements to sell certain assets and transfer certain liabilities of its Florida operations, including its six private client offices. Each transaction is subject to regulatory approval and customary closing conditions. In addition, the transaction with Ovation Holdings is subject to the closing of the purchase of NBSWF by Ovation Holdings. We cannot assure you that these conditions will be met or waived, that the necessary approvals will be obtained or that we will be able to successfully consummate these transactions as currently contemplated under the definitive agreements or at all. If the transactions are not completed:
| • | the market price of our common stock may be adversely affected; |
| • | we will remain liable for transaction costs, including legal, accounting and other costs related to these transactions, and will not receive any termination fee from Ovation Holdings or HomeBanc; and |
| • | we may experience a negative reaction to the termination of either of these agreements from our customers or employees which may adversely impact our future results of operations. |
The occurrence of any of these events individually or in combination could have a material adverse effect on our business, financial condition and results of operations. In addition, if either of these agreements is terminated and our board of directors seeks another purchaser for our Florida operations, we may not be able to find a party willing to pay a price equal to or more attractive than the price that each of Ovation Holdings and HomeBanc has agreed to pay.
If we are unable to continue to transform our balance sheet by originating loans and growing core deposits and if our strategic decision to offer wealth management services and insurance products does not continue to generate new business, our business and results of operations may be negatively affected.
We have transformed our balance sheet by replacing lower yielding investment securities and purchased mortgage loans with our own higher yielding originated loans. We continue to focus on generating commercial lending relationships and transforming our balance sheet from one with a concentration in mortgages to a commercial lending specialization. We have also rolled out a full line of deposit and cash management products, which has enabled us to replace brokered deposits with core deposits. In connection with this transformation, we have disposed of our out-of-market locations and expanded the number of private client offices we operate in our target market of Texas. Additionally, we have made strategic acquisitions enabling us to offer wealth management services and insurance products to our clients. Our ability to continue the growth of originated loans and core deposits depends, in part, upon our ability to leverage our Texas offices and infrastructure, successfully attract core deposits, identify attractive commercial lending opportunities and retain experienced lending officers. Our ability to continue to successfully execute our business plan requires effective planning and management implementation, which may be affected by factors outside of our control. If we are not able to attract significant business from our target markets, our business and results of operations may be negatively affected.
26
Table of Contents
Index to Financial Statements
Our dependence on loans secured by real estate subjects us to risks relating to fluctuations in the real estate market and related interest rates and legislation that could result in significant additional costs and capital requirements that could adversely affect our financial condition and results of operations.
Approximately 86.7% of our loan portfolio as of December 31, 2009 was comprised of loans collateralized by real estate, with 66.0% of the real estate located in Texas and 21.8% located in Florida. The real estate collateral in each case provides an alternate source of repayment in the event of default by the borrower and may deteriorate in value during the time the credit is extended. The real estate markets in Florida, and to a lesser extent, Texas, have deteriorated in the last several years. A continued weakening of the real estate market in our primary market areas could have an adverse effect on the demand for new loans, the ability of borrowers to repay outstanding loans, the value of real estate and other collateral securing the loans and the value of real estate owned by us. As real estate values decline, it is also more likely that we would be required to make provisions for additional loan losses, which could adversely affect our financial condition and results of operations.
Current market conditions include an over-supply of land, lots and finished homes in many markets, including those where we do business. As of December 31, 2009, we had $87.0 million, or 8.1%, of our total loans in real estate construction loans. Of this amount, $66.7 million were land loans, $8.1 million were made to finance residential construction with an identified purchaser and $5.0 million were made to finance residential construction with no identified purchaser. Substantially all of these loans are located in the Houston area. Further, $7.2 million of real estate construction loans were made to finance commercial construction, with approximately $1.5 million of these loans made to finance construction projects located in Texas and $5.7 million in southwest Florida. Construction loans are subject to risks during the construction phase that are not present in standard residential real estate and commercial real estate loans. These risks include:
| • | the viability of the contractor; |
| • | the value of the project being subject to successful completion; |
| • | the contractor’s ability to complete the project, to meet deadlines and time schedules and to stay within cost estimates; and |
| • | concentrations of such loans with a single contractor and its affiliates. |
Real estate construction loans also present risks of default in the event of declines in property values or volatility in the real estate market during the construction phase. If we are forced to foreclose on a project prior to completion, we may not be able to recover the entire unpaid portion of the loan, may be required to fund additional amounts to complete a project and may have to hold the property for an indeterminate amount of time. If any of these risks were to occur, it could adversely affect our financial condition, results of operations and cash flows.
The federal banking agencies have issued guidance regarding high concentrations of commercial real estate loans within bank loan portfolios. The guidance requires financial institutions that exceed certain levels of commercial real estate lending compared with their total capital to maintain heightened risk management practices that address the following key elements: including board and management oversight and strategic planning, portfolio management, development of underwriting standards, risk assessment and monitoring through market analysis and stress testing, and maintenance of increased capital levels as needed to support the level of commercial real estate lending. If there is any deterioration in our commercial real estate or real estate construction portfolios or if our regulators conclude that we have not implemented appropriate risk management practices, it could adversely affect our business and result in a requirement of increased capital levels, and such capital may not be available at that time.
Our commercial real estate and commercial loans expose us to increased credit risks, and these risks will increase if we succeed in increasing these types of loans.
We focus our lending efforts on commercial-related loans and intend to grow commercial real estate and commercial loans further as a proportion of our portfolio. In general, commercial real estate loans and
27
Table of Contents
Index to Financial Statements
commercial loans yield higher returns and often generate a deposit relationship, but also pose greater credit risks than do owner-occupied residential real estate loans. As our various commercial loan portfolios increase, the corresponding risks and potential for losses from these loans will also increase.
We make both secured and some unsecured commercial loans. Unsecured loans generally involve a higher degree of risk of loss than do secured loans because, without collateral, repayment is wholly dependent upon the success of the borrowers’ businesses. Secured commercial loans are generally collateralized by accounts receivable, inventory, equipment or other assets owned by the borrower and include a personal guaranty of the business owner. Compared to real estate, that type of collateral is more difficult to monitor, its value is harder to ascertain, it may depreciate more rapidly and it may not be as readily saleable if repossessed. Further, commercial loans generally will be serviced primarily from the operation of the business, which may not be successful, and commercial real estate loans generally will be serviced from income on the properties securing the loans.
Additionally, as of December 31, 2009, 16.1% of our commercial loans were loans to law firms, which are generally made to fund case expenses and which are collateralized by the anticipated fees to be received in pending cases. We require that the amount of anticipated fees be several times greater than the amount of the loan and personal guarantees of the principals of the law firm. However, the law firm may be unsuccessful in the final outcome in these cases, and if successful, the ultimate collection of legal fees can be negatively affected by changes in regulation or legislative action, such as tort reform.
If our allowance for loan losses is not adequate to cover actual loan losses, our results of operations will be negatively affected.
The allowance for loan losses is an estimate of losses incurred through year end. As the losses are confirmed, it is possible that additional loss provisions may be needed in future periods to refine that estimate, which will be made in addition to the regular provision for estimated losses in those periods. Loans totaling $914.6 million, or 84.8%, of our loan portfolio as of December 31, 2009 represents loans originated since the beginning of 2005 and $88.7 million, or 8.2%, of our loan portfolio represents purchased loans. As a lender, we are exposed to the risk that our loan clients may not repay their loans according to the terms of these loans, and the collateral securing the payment of these loans may be insufficient to assure repayment. We make various assumptions and judgments about the collectability of our loan portfolio, including the creditworthiness of the borrowers and the value of the real estate and other assets serving as collateral for the repayment of many of our loans. We maintain an allowance for loan losses to cover an estimate of loan losses incurred in the loan portfolio at the balance sheet date. In determining the size of the allowance, we rely, among other factors, on a periodic analysis of our loan portfolio, our historical loss experience and our evaluation of general economic conditions. If our assumptions prove to be incorrect, our current allowance may not be sufficient to cover actual loan losses and adjustments may be necessary in future loss provisions. A material addition to the allowance for loan losses to correct for a material change in the estimate could cause our results of operations to be negatively affected.
In addition, federal regulators periodically review our allowance for loan losses and may require us to increase our provision for loan losses or recognize further charge-offs, based on judgments different than those of our management. Any significant increase in our allowance for loan losses or charge-offs required by these regulatory agencies could have a material adverse effect on our results of operations and financial condition.
Our profitability depends significantly on local economic conditions in the areas where our operations and loans are concentrated.
Our profitability depends on the general economic conditions in our primary markets in Texas and southwest Florida. Unlike larger banks that are more geographically diversified, we provide banking and financial services to clients primarily in the greater Houston area, including Harris, Ft. Bend and Montgomery counties, and southwest Florida, including Lee, Collier, Pinellas and Hillsborough counties. As of December 31,
28
Table of Contents
Index to Financial Statements
2009, $587.0 million, or 68.2%, of our commercial real estate, real estate construction and residential real estate loans were made to borrowers in Texas and $192.8 million, or 22.4% of such loans (which includes $26.1 million in purchased loans) were made to borrowers in Florida. The local economic conditions in these areas have a significant impact on our commercial, real estate and construction and consumer loans, the ability of the borrowers to repay these loans and the value of the collateral securing these loans. In addition, if the population or income growth in either of these regions slows, stops or declines, income levels, deposits and housing starts could be adversely affected and could result in the curtailment of our expansion, growth and profitability. Recently, economic conditions in Florida and, to a lesser extent, Texas have declined and if either of these regions experiences a downturn or a recession for a prolonged period of time, we would likely experience significant increases in nonperforming loans, which could lead to operating losses, impaired liquidity and eroding capital. While we have entered into agreements that will result in our no longer providing commercial banking services in Florida, the economic conditions in that market will continue to affect our operations while those agreements are pending. In addition, there is no guarantee that such transactions will ultimately close.
Moreover, a significant decline in general economic conditions, caused by inflation, recession, acts of terrorism, an outbreak of hostilities or other international or domestic calamities, unemployment or other factors beyond our control could impact these local economic conditions and could negatively affect the financial results of our operations.
We may be required to pay significantly higher FDIC deposit insurance premiums and assessments in the future.
Recent insured depository institution failures, as well as deterioration in banking and economic conditions, have significantly depleted the FDIC’s DIF, resulting in a decline in the ratio of reserves to insured deposits to historical lows. The FDIC anticipates that additional insured depository institutions are likely to fail in the foreseeable future so the reserve ratio may continue to decline. In addition, the deposit insurance limit on FDIC deposit insurance coverage generally has increased to $250,000 through December 31, 2013. These developments will cause the premiums assessed on us by the FDIC to increase and materially increase our noninterest expense.
On January 1, 2009, the FDIC increased the DIF assessment rates as part of the FDIC’s DIF restoration plan. Effective April 1, 2009, the assessment rate applicable to the Company increased from 7 to 15.4 basis points. In May 2009, the FDIC issued a final rule which levied a special assessment applicable to all insured depository institutions totaling 5 basis points of each institution’s total assets less Tier 1 capital as of June 30, 2009, not to exceed 10 basis points of domestic deposits. We paid a special assessment of $684,000 on September 30, 2009.
In November 2009, the FDIC issued a rule that required all insured depository institutions, with limited exceptions, to prepay their estimated quarterly risk-based assessments for the fourth quarter of 2009 and for all of 2010, 2011 and 2012 on December 30, 2009. The assessment was calculated by taking the institution’s actual September 30, 2009 assessment base and adjusting it quarterly by an estimated 5% annual growth rate through the end of 2012. Under GAAP accounting rules, the prepaid assessments would not immediately affect a bank’s earnings. Each institution records the entire amount of the prepaid assessment as a prepaid expense, an asset on its balance sheet, as of December 30, 2009, the date the payment was made. As of December 31, 2009, and each quarter thereafter, each institution records an expense for its quarterly assessment invoiced on its quarterly statement and an offsetting credit to the prepaid assessment until the asset is exhausted. The FDIC also adopted a uniform three basis point increase in assessment rates effective on January 1, 2011.
These higher FDIC assessment rates and special assessments will have an adverse impact on our results of operations. Our FDIC insurance related costs were $2.1 million for the year ended December 31, 2009 compared with $161,000 and $118,000 for the years ended December 31, 2008 and 2007, respectively. The increase was also a result of the expiration of credits used in previous years. We are unable to predict the impact in future
29
Table of Contents
Index to Financial Statements
periods, including whether and when additional special assessments will occur, in the event the economic crisis continues.
If the goodwill that we recorded in connection with business acquisitions becomes impaired, it could have a negative impact on our profitability.
Goodwill represents the amount of acquisition cost over the fair value of net assets we acquired in the purchase of another entity including our trust function, investment management and insurance subsidiaries. We review goodwill for impairment at least annually, or more frequently if events or changes in circumstances indicate the carrying value of the asset might be impaired. Examples of those events or circumstances include the following:
| • | significant adverse change in business climate; |
| • | significant unanticipated loss of clients/assets under management; |
| • | unanticipated loss of key personnel; or |
| • | significant reductions in profitability. |
We determine impairment by comparing the fair value of the reporting unit with the carrying amount of that reporting unit. If the carrying amount of the reporting unit exceeds the fair value of that reporting unit, an impairment loss is recognized based upon our calculation of the implied fair value of goodwill. Any such adjustments are reflected in our results of operations in the periods in which they become known. At December 31, 2009, our goodwill totaled $35.8 million. While we have recorded no such impairment charges since we initially recorded the goodwill, there can be no assurance that our future evaluations of goodwill will not result in findings of impairment and related write-downs, which may have a material adverse effect on our financial condition and results of operations.
The properties that we own and our foreclosed real estate assets could subject us to environmental risks and associated costs.
There is a risk that hazardous substances or wastes, contaminants, pollutants or other environmentally restricted substances could be discovered on our properties or our foreclosed assets (particularly in the case of real estate loans). In this event, we might be required to remove the substances from the affected properties or to engage in abatement procedures at our sole cost and expense. Besides being liable under applicable federal and state statutes for our own conduct, we may also be held liable under certain circumstances for actions of borrowers or other third parties with respect to property that collateralizes one or more of our loans or property that we own. Potential environmental liability could include the cost of remediation and also damages for any injuries caused to third-parties. We cannot assure you that the cost of removal or abatement will not substantially exceed the value of the affected properties or the loans secured by those properties, that we would have adequate remedies against prior owners or other responsible parties or that we would be able to resell the affected properties either prior to or following completion of any such removal or abatement procedures. If material environmental problems are discovered prior to foreclosure, we generally will not foreclose on the related collateral. Furthermore, despite actions on our part, the value of the property as collateral will generally be substantially reduced and, as a result, we may suffer a loss upon collection of the loan.
The small- to medium-sized businesses we lend to may have fewer resources to weather a downturn in the economy, which may impair a borrower’s ability to repay a loan to us, and such impairment could materially harm our operating results.
We make loans to professional firms and privately-owned businesses that are considered to be small- to medium-sized businesses. Small- to medium-sized businesses frequently have smaller market shares than their competition, may be more vulnerable to economic downturns, often need substantial additional capital to expand
30
Table of Contents
Index to Financial Statements
or compete and may experience substantial volatility in operating results, any of which may impair a borrower’s ability to repay a loan. In addition, the success of a small- to medium-sized business often depends on the management talents and efforts of one or two persons or a small group of persons, and the death, disability or resignation of one or more of these persons could have a material adverse impact on the business and its ability to repay our loan. A continued economic downturn and other events that negatively impact our target market could cause us to incur substantial credit losses that could materially harm our operating results.
Our banking business is subject to interest rate risk and fluctuations in interest rates may adversely affect our results of operations and financial condition.
The majority of our banking assets are monetary in nature and subject to risk from changes in interest rates, which are neither predictable nor controllable. Like most financial institutions, our results of operations are significantly dependent on our net interest income, which is the difference between interest earned from interest-earning assets, such as loans and investment securities, and interest paid on interest-bearing liabilities, such as deposits and borrowings. We expect that we will periodically experience “gaps” in the interest rate sensitivities of our assets and liabilities, meaning that either our interest-bearing liabilities will be more sensitive to changes in market interest rates than our interest-earning assets, or vice versa. In either event, if market interest rates should move contrary to our position, this “gap” will negatively impact our results of operations. Many factors impact interest rates, including governmental monetary policies, inflation, recession, changes in unemployment, the money supply, and international disorder and instability in domestic and foreign financial markets.
As of December 31, 2009, we were liability sensitive, meaning that our interest-bearing liabilities reprice more quickly than our interest-earning assets, so in the event of an increase in interest rates, our net interest income will be affected negatively. Although our asset liability management strategy is designed to control our risk from changes in market interest rates, it may not be able to prevent changes in interest rates from having a material adverse effect on our results of operations and financial condition.
The wealth management fees we receive may decrease as a result of poor investment performance, in either relative or absolute terms, which could decrease our revenues and results of operations.
For the year ended December 31, 2009, we received $16.9 million in fees from our wealth management business, which represented 61.8% of our total noninterest income. We derive our revenues from this business primarily from investment management fees based on assets under management and, to a lesser extent, fee-based financial planning services. Our ability to maintain or increase assets under management is subject to a number of factors, including investors’ perception of our past performance, in either relative or absolute terms, market and economic conditions, and competition from investment management companies.
Financial markets are affected by many factors, all of which are beyond our control, including general economic conditions; securities market conditions; the level and volatility of interest rates and equity prices; competitive conditions; liquidity of global markets; international and regional political conditions; regulatory and legislative developments; monetary and fiscal policy; investor sentiment; availability and cost of capital; technological changes and events; outcome of legal proceedings; changes in currency values; inflation; credit ratings; and the size, volume and timing of transactions. A decline in the fair value of the assets under management caused by a decline in general economic conditions would decrease our wealth management fee income.
Investment performance is one of the most important factors in retaining existing clients and competing for new wealth management clients. Poor investment performance could reduce our revenues and impair our growth in the following ways:
| • | existing clients may withdraw funds from our wealth management business in favor of better performing products; |
31
Table of Contents
Index to Financial Statements
| • | asset-based management fees could decline from a decrease in assets under management; |
| • | our ability to attract funds from existing and new clients might diminish; and |
| • | our wealth managers and investment advisors may depart, to join a competitor or otherwise. |
Even when market conditions are generally favorable, our investment performance may be adversely affected by the investment style of our wealth management and investment advisors and the particular investments that they make. To the extent our future investment performance is perceived to be poor in either relative or absolute terms, the revenues and profitability of our wealth management business will likely be reduced and our ability to attract new clients will likely be impaired. As such, fluctuations in the equity and debt markets can have a direct impact upon our results of operations.
Linscomb & Williams’ investment advisory contracts are subject to termination on short notice, and termination of a significant number of investment advisory contracts could have a material adverse impact on our revenues.
Linscomb & Williams derived 97.0% of its revenue for the year ended December 31, 2009 from investment advisory contracts with its clients. These contracts are typically terminable by clients without penalty upon relatively short notice (generally not more than 60 days). Our wealth management clients can terminate their relationships with us, reduce their aggregate assets under management, or shift their funds to other types of accounts with different rate structures for any number of reasons, including investment performance, changes in prevailing interest rates, inflation, changes in investment preferences of clients, changes in our reputation in the marketplace, changes in management or control of clients, loss of key investment management personnel and financial market performance. We cannot be certain that Linscomb & Williams’ management will be able to retain all of their clients. If its clients terminate their investment advisory contracts, Linscomb & Williams, and consequently we, could lose a significant portion of our revenues.
Our insurance agency’s commission revenues are based on premiums set by insurers and any decreases in these premium rates could adversely affect our operations and revenues.
Our insurance agency subsidiary, Town & Country, is engaged in insurance agency and brokerage activities. For the year ended December 31, 2009, Town & Country received $5.5 million in commissions and fees, which represented 20.0% of our total noninterest income. Town & Country derives revenues primarily from commissions paid by the insurance underwriters on the sale of insurance products to clients. These commissions are highly dependent on the premiums charged by insurance underwriters, which historically have been cyclical in nature, vary by region and display a high degree of volatility based on the prevailing economic and competitive factors that affect insurance underwriters. These factors, which are not within Town & Country’s control, include the capacity of insurance underwriters to place new business, non-underwriting profits of insurance underwriters, consumer demand for insurance products, the availability of comparable products from other insurance underwriters at a lower cost and the availability to consumers of alternative insurance products, such as government benefits and self-insurance plans.
Town & Country also receives contingent commissions, which are commissions paid by insurance underwriters based on profitability of the business, premium growth, total premium volume, or some combination of these factors. Town & Country generally receives these contingent commissions in the first and second quarters of each year. Due to the nature of these commissions, it is difficult for us to predict their payment. Increases in loss ratios experienced by insurance underwriters will result in a decreased profit to them and may result in decreases in the payment of contingent commissions to us.
Town & Country cannot predict the timing or extent of future changes in premiums and thus commissions. As a result, we cannot predict the effect that future premium rates will have on our operations. While increases in premium rates may result in revenue increases, decreases in premium rates may result in revenue decreases. These decreases may adversely affect our operations and revenues for the periods in which they occur.
32
Table of Contents
Index to Financial Statements
Our business would be harmed if we lost the services of any of our senior management team and senior relationship bankers and are unable to recruit or retain suitable replacements.
We believe that our success to date and our prospects for future success in our banking, wealth management and insurance businesses depend significantly on the continued services and performance of our chief executive officer, James S. D’Agostino, Jr., and the other members of our senior management team. While we have granted restricted stock to, and have change in control agreements with, certain key officers our ability to retain such officers may be hindered by the fact that we have not entered into employment or non-competition agreements with most of them. Therefore, they may terminate their employment with us at any time, and we could have difficulty replacing such officers with persons who are experienced in the specialized aspects of our business or who have ties to the communities within our primary market areas.
In addition, as a participant in the CPP, we are subject to the executive compensation limitations under Section 111 of EESA, as amended. The EESA contains restrictions on bonus and other incentive compensation payable to certain of our most highly compensated employees. Such restrictions and standards may further impact management’s ability to retain key officers and employees as well as our ability to compete with financial institutions that are not subject to the same limitations as we are. The unexpected loss of services of any of these key officers could materially harm our business.
Our growth could be hindered unless we are able to recruit and retain qualified employees.
Competition for highly qualified employees in a number of industries, including the financial services industry, is intense in our market areas. Our business plan includes, and is dependent upon, our hiring and retaining highly qualified and motivated executives and employees at every level and, in particular, experienced loan officers and relationship managers. We expect to experience substantial competition in our endeavor to identify, hire and retain the top-quality employees that we believe are key to our future success. If we are unable to hire and retain qualified employees, we may not be able to grow our banking, wealth management and insurance franchise and successfully execute our business plan.
We operate in a highly regulated environment and, as a result, are subject to extensive regulation and supervision and changes in federal and local laws and regulations that could adversely affect our financial performance.
We and Encore Bank are subject to extensive federal regulation and supervision. Banking regulations are primarily intended to protect depositors’ funds, federal deposit insurance funds and the banking system as a whole, not the Company’s shareholders. These regulations affect the Company’s lending practices, capital structure, investment practices, dividend policy and growth, among other things. Congress and federal regulatory agencies continually review banking laws, regulations and policies for possible changes. Any change in applicable regulations or federal legislation could have a substantial impact on us, Encore Bank and our respective operations. The current administration has proposed major changes to the banking and financial institutions regulatory regimes in the near future in light of the recent performance of and government intervention in the financial services sector and legislation to implement these changes is pending in the U.S. House of Representatives and the U.S. Senate. These proposed reforms and additional legislation and regulations or regulatory policies, including changes in interpretation or implementation of statutes, regulations or policies, could significantly affect our powers, authority and operations, or the powers, authority and operations of Encore Bank, in substantial and unpredictable ways. Further, regulators have significant discretion and power to prevent or remedy unsafe or unsound practices or violations of laws by banks and bank holding companies in the performance of their supervisory and enforcement duties. The exercise of this regulatory discretion and power could have a negative impact on us. Failure to comply with laws, regulations or policies could result in sanctions by regulatory agencies, civil money penalties and/or reputation damage, which could have a material adverse effect on our business, financial condition and results of operations.
33
Table of Contents
Index to Financial Statements
Our wealth management subsidiary, Linscomb & Williams, is registered with the SEC under the Investment Advisers Act of 1940. The Investment Advisers Act imposes numerous obligations and fiduciary duties on registered investment advisers including record-keeping, operating and marketing requirements, disclosure obligations and prohibitions on fraudulent activities. The failure of Linscomb & Williams to comply with the Investment Advisers Act and regulations promulgated thereunder could cause the SEC to institute proceedings and impose sanctions for violations of this act, including censure, termination of an investment adviser’s registration, or prohibition to serve as adviser to funds registered with the SEC and could lead to litigation by investors in those funds or harm to our reputation, any of which could adversely affect our financial performance.
In addition, our insurance subsidiary, Town & Country, is subject to regulation by the Texas Department of Insurance. State insurance regulators and the National Association of Insurance Commissioners continually re-examine existing laws and regulations, and such re-examination may result in the enactment of insurance-related laws and regulations, or the issuance of interpretations thereof, that adversely affect the financial performance of Town & Country, and hence, us.
As a regulated entity, we and Encore Bank must maintain certain required levels of regulatory capital that may limit our operations and potential growth.
We and Encore Bank are subject to various regulatory capital requirements administered by the Federal Reserve and the OCC, respectively. Failure to meet minimum capital requirements can initiate certain mandatory, and possibly additional discretionary actions by regulators that, if undertaken, could have a direct material effect on Encore Bank’s and our company’s consolidated financial statements. Under capital adequacy guidelines and the regulatory framework for prompt corrective action, Encore Bank must meet specific capital guidelines that involve quantitative measures of Encore Bank’s assets, liabilities and certain off-balance sheet commitments as calculated under these regulations.
Quantitative measures established by regulation to ensure capital adequacy require Encore Bank to maintain minimum amounts and defined ratios of total and Tier 1 capital to risk-weighted assets and of Tier 1 capital to adjusted total assets, also known as the leverage ratio. As of December 31, 2009, Encore Bank exceeded the amounts required to be well capitalized with respect to all three required capital ratios. To be well capitalized, a bank must generally maintain a leverage ratio of at least 5%, a Tier 1 risk-based capital ratio of at least 6% and a total risk-based capital ratio of at least 10%. However, the OCC could require Encore Bank to increase its capital levels. For example, regulators have recently required certain banking companies to maintain a leverage ratio of at least 8% and a total risk-based capital ratio of at least 12%. As of December 31, 2009, Encore Bank’s leverage, Tier 1 risk-based capital and total risk-based capital ratios were 9.11%, 12.72% and 13.98%, respectively.
Many factors affect the calculation of Encore Bank’s risk-based assets and its ability to maintain the level of capital required to achieve acceptable capital ratios. For example, changes in risk weightings of assets relative to capital and other factors may combine to increase the amount of risk-weighted assets in the Tier 1 risk-based capital ratio and the total risk-based capital ratio. Any increases in its risk-weighted assets will require a corresponding increase in its capital to maintain the applicable ratios. In addition, recognized loan losses in excess of amounts reserved for such losses, loan impairments, impairment losses on securities and other factors will decrease Encore Bank’s capital, thereby reducing the level of the applicable ratios.
Encore Bank’s failure to remain well capitalized for bank regulatory purposes could affect customer confidence, our ability to grow, our costs of funds and FDIC insurance costs, our ability to pay dividends on our capital stock, our ability to make acquisitions, and on our business, results of operations and financial condition. Under regulatory rules, if Encore Bank ceases to be a well capitalized institution for bank regulatory purposes, the interest rates that it pays on deposits and its ability to accept, renew or rollover brokered deposits may be restricted.
34
Table of Contents
Index to Financial Statements
We face strong competition with other financial institutions and financial service companies, which could adversely affect our results of operations and financial condition.
The banking, wealth management and insurance businesses are highly competitive, and our profitability depends heavily on our ability to compete in our markets with other financial institutions and financial service companies offering products and services at prices similar to those offered by us. In our banking business, we face vigorous competition from banks and other financial institutions, including savings and loan associations, savings banks, finance companies and credit unions. A number of these banks and other financial institutions have substantially greater resources and lending limits, larger branch systems and a wider array of banking services. We also compete with other providers of financial services, such as money market mutual funds, brokerage firms, consumer finance companies, insurance companies and governmental organizations which may offer more favorable financing than we can offer. Some of our nonbank competitors are not subject to the same extensive regulations that govern us. To the extent that we are forced to compete on the basis of price, we may not be able to maintain our current fee structure.
In our wealth management and insurance businesses, we compete with national and regional investment management and financial planning firms, broker-dealers, accounting firms, trust companies and law firms. Many of these companies are more geographically diversified and have greater resources than we do. This competition in all of our businesses may reduce or limit our margins on banking services, reduce our market share, reduce our noninterest income and adversely affect our results of operations and financial condition.
We may be adversely affected by the soundness of other financial institutions
Our ability to engage in routine funding transactions could be adversely affected by the actions and potential failures of other financial institutions. Financial institutions are interrelated as a result of trading, clearing, counterparty and other relationships. We have exposure to many different industries and counterparties, and we routinely execute transactions with a variety of counterparties in the financial services industry. As a result, defaults by, or even rumors or concerns about, one or more financial institutions with whom we do business, or the financial services industry generally, have led to market-wide liquidity problems and could lead to losses or defaults by us or by other institutions. Many of these transactions expose us to credit risk in the event of default of our counterparty or client. In addition, our credit risk may be exacerbated when the collateral we hold cannot be sold at prices that are sufficient for us to recover the full amount of our exposure. Any such losses could materially and adversely affect our financial condition and results of operations.
We are subject to losses resulting from fraudulent and negligent acts on the part of loan applicants, correspondents or other third parties.
We rely heavily upon information supplied by third parties, including the information contained in loan applications, property appraisals, title information, equipment pricing and valuation and employment and income documentation, in deciding which loans we will originate, as well as the terms of those loans. If any of the information upon which we rely is misrepresented, either fraudulently or inadvertently, and the misrepresentation is not detected prior to asset funding, the value of the asset may be significantly lower than expected, or we may fund a loan that we would not have funded or on terms we would not have extended. Whether a misrepresentation is made by the applicant or another third party, we generally bear the risk of loss associated with the misrepresentation. A loan subject to a material misrepresentation is typically unsellable or subject to repurchase if it is sold prior to detection of the misrepresentation. The sources of the misrepresentations are often difficult to locate, and it is often difficult to recover any of the monetary losses we may suffer.
An interruption in or breach in security of our information systems may result in a loss of client business and have an adverse effect on our results of operations and financial condition.
We rely heavily on communications and information systems to conduct our business. Any failure or interruption or breach in security of these systems could result in failures or disruptions in our client relationship
35
Table of Contents
Index to Financial Statements
management, general ledger, deposits, servicing or loan origination systems. We cannot assure you that such failures or interruptions will not occur or, if they do occur, that they will be adequately addressed by us. The occurrence of any failures or interruptions could result in a loss of client business and have an adverse effect on our results of operations and financial condition.
Risks Associated With an Investment in Our Common Stock
Our directors and executive officers own a significant number of shares of our common stock, allowing management further control over our corporate affairs.
As of February 26, 2010, our directors and executive officers beneficially own 26.6% of the outstanding shares of our common stock. Accordingly, these directors and executive officers are able to control, to a significant extent, the outcome of all matters required to be submitted to our shareholders for approval, including decisions relating to the election of directors, the determination of our day-to-day corporate and management policies and other significant corporate transactions.
Our corporate organizational documents and the provisions of Texas law to which we are subject may delay or prevent a change in control of our company that you may favor.
Our amended and restated articles of incorporation and amended and restated bylaws contain certain provisions which may delay, discourage or prevent an attempted acquisition or change of control of our company. These provisions include:
| • | a provision that any special meeting of our shareholders may be called only by a majority of the board of directors, the Chairman of the Board, the President or the holders of at least 50% of our total number of shares of common stock entitled to vote at the meeting; |
| • | a provision establishing certain advance notice procedures for nomination of candidates for election as directors and for shareholder proposals to be considered at an annual or special meeting of shareholders; and |
| • | a provision that denies shareholders the right to amend our bylaws. |
Our amended and restated articles of incorporation provide for noncumulative voting for directors and authorize our board of directors to issue shares of preferred stock, $1.00 par value per share, without shareholder approval and upon such terms as our board of directors may determine. The issuance of preferred stock, while providing desirable flexibility in connection with possible acquisitions, financings and other corporate purposes, could have the effect of making it more difficult for a third party to acquire, or of discouraging a third party from acquiring, a controlling interest in us. In addition, certain provisions of Texas law, including a provision which restricts certain business combinations between a Texas corporation and certain affiliated shareholders, may delay, discourage or prevent an attempted acquisition or change in control of our company.
We currently do not intend to pay dividends on our common stock. In addition, our future ability to pay dividends is subject to restrictions.
We have not paid any dividends to our holders of common stock in the past and we currently do not intend to pay any dividends on our common stock in the foreseeable future. In the event that we decide to pay dividends, there are a number of restrictions on our ability to pay dividends. It is the policy of the Federal Reserve that bank holding companies should pay cash dividends on common stock only out of income available over the past year and only if prospective earnings retention is consistent with the organization’s expected future needs and financial condition. The policy provides that bank holding companies should not maintain a level of cash dividends that undermines the bank holding company’s ability to serve as a source of strength to its banking subsidiaries.
36
Table of Contents
Index to Financial Statements
Our principal source of funds to pay dividends on our common stock will be cash dividends that we receive from Encore Bank. The payment of dividends by Encore Bank to us is subject to certain restrictions imposed by federal banking laws, regulations and authorities. The federal banking statutes prohibit federally insured banks from making any capital distributions (including a dividend payment) if, after making the distribution, the institution would be “under capitalized” as defined by statute. In addition, the relevant federal regulatory agencies have authority to prohibit an insured bank from engaging in an unsafe or unsound practice, as determined by the agency, in conducting an activity. The payment of dividends could be deemed to constitute such an unsafe or unsound practice, depending on the financial condition of Encore Bank. Regulatory authorities could impose administratively stricter limitations on the ability of Encore Bank to pay dividends to us if such limits were deemed appropriate to preserve certain capital adequacy requirements.
Future dividend payments and common stock repurchases are restricted by the terms of the U.S. Treasury’s equity investment in us.
Under the terms of the CPP, for so long as any preferred stock issued under the CPP remains outstanding, we are prohibited from increasing dividends on our common stock, and from making certain repurchases of equity securities, including our common stock, without the U.S. Treasury’s consent until the third anniversary of the U.S. Treasury’s investment or until the U.S. Treasury has transferred all of the preferred stock it purchased under the CPP to third parties. Further, as long as the preferred stock issued to the U.S. Treasury is outstanding, dividend payments and repurchases or redemptions relating to certain equity securities, including our common stock, are prohibited until all accrued and unpaid dividends are paid on such preferred stock, subject to certain limited exceptions.
The holders of our junior subordinated debentures have rights that are senior to those of our common shareholders.
We have two issues of junior subordinated debentures outstanding, with an aggregate liquidation amount totaling $20.6 million related to the issuance of trust preferred securities by our non-consolidated subsidiary trusts, which are treated as capital for regulatory ratio compliance purposes. Although these securities are viewed as capital for regulatory purposes, they are debt securities and have provisions which, in the event of noncompliance, could have an adverse effect on our operations. For example, these securities permit us to defer the periodic payment of interest for various periods, but if such payments are deferred, we would be prohibited from paying cash dividends on our common stock during deferral periods and until deferred interest is paid. Future payment of interest depends upon the earnings of Encore Bank and its subsidiaries and dividends from Encore Bank to us, which may be inadequate to service the obligations.
Item 1B. Unresolved Staff Comments
None.
37
Table of Contents
Index to Financial Statements
We operate 17 private client offices through Encore Bank. We also operate four offices of Encore Trust, three offices of Town & Country and one office of Linscomb & Williams. We lease all of our locations, except with respect to our private client offices located in the Houston area at 6330 San Felipe, 5815 Kirby, 3754 Westheimer and 5548 FM 1960 West, where in each location we own the building and lease the underlying land, and our private client office in Ft. Myers, Florida, where we own the building and underlying land. Our principal office is located at Nine Greenway Plaza, Suite 1000, Houston, Texas, 77046. The following table sets forth our banking, wealth management and insurance office locations, the date we opened or acquired them, and, with respect to our private client offices, the amount of deposits:
| Type of Office |
Date Opened/ Acquired |
Deposits as of December 31, 2009 | |||||||
| Private Client Offices—Houston Market |
(dollars in thousands) | ||||||||
| Houston, Texas |
|||||||||
| 12520 Memorial Drive |
11/01/2000 | $ | 148,043 | ||||||
| 2049 West Gray |
8/01/2002 | 89,930 | |||||||
| 6330 San Felipe |
3/17/2003 | 69,353 | |||||||
| 909 Fannin, Suite 1350 |
8/04/2003 | 74,613 | |||||||
| 6400 Fannin, Suite 222 |
2/15/2007 | 21,236 | |||||||
| 5815 Kirby |
1/20/2004 | 71,464 | |||||||
| 3754 Westheimer |
1/05/2004 | 44,515 | |||||||
| 5548 FM 1960 West |
7/14/2003 | 72,347 | |||||||
| Nine Greenway Plaza, Suite 110 |
3/21/2005 | 294,903 | |||||||
| Sugar Land, Texas |
|||||||||
| 4647 Sweetwater Blvd., Suite A |
5/30/2006 | 22,727 | |||||||
| The Woodlands, Texas |
|||||||||
| 9595 Six Pines Drive, Suite 1500 |
9/07/2004 | 45,835 | |||||||
| Private Client Offices—Florida Market |
|||||||||
| Sun City Center |
|||||||||
| 1653 Sun City Plaza, Suite 1001 |
9/04/2001 | 69,302 | |||||||
| Ft. Myers |
|||||||||
| 7920 Summerlin Lakes Dr. |
10/16/2001 | 34,025 | |||||||
| Clearwater |
|||||||||
| 2566 McCullen Booth Road, Suite G |
3/25/2002 | 23,441 | |||||||
| Belleair Bluffs |
|||||||||
| 2973 West Bay Drive |
4/08/2002 | 41,874 | |||||||
| Naples |
|||||||||
| 10600 Tamiami Trail N., Suite 604 |
4/19/2004 | 43,180 | |||||||
| 3003 Tamiami Trail, Suite 100 |
1/03/2007 | 25,048 | |||||||
| Encore Trust Offices |
|||||||||
| Houston, Texas |
|||||||||
| 11000 Richmond, Suite 215 |
3/31/2005 | N/A | |||||||
| Nine Greenway Plaza, Suite 1000 |
3/31/2005 | N/A | |||||||
| Dallas, Texas |
|||||||||
| 5956 Sherry Lane Place, Suite 630 |
3/31/2005 | N/A | |||||||
| Austin, Texas |
|||||||||
| 100 Congress Ave., Suite 2100 |
3/31/2005 | N/A | |||||||
| Town & Country Offices |
|||||||||
| Houston, Texas |
|||||||||
| 10575 Katy Freeway, Suite 150 |
4/30/2004 | N/A | |||||||
| Galveston, Texas |
|||||||||
| 1605 Tremont |
4/30/2004 | N/A | |||||||
| Ft. Worth, Texas |
|||||||||
| 3417 Hulen Street, Suite 201 |
4/01/2006 | N/A | |||||||
| Linscomb & Williams Office |
|||||||||
| Houston, Texas |
|||||||||
| 1400 Post Oak Blvd., Suite 1000 |
8/31/2005 | N/A | |||||||
38
Table of Contents
Index to Financial Statements
We and Encore Bank and its subsidiaries from time to time will be party to or otherwise involved in legal proceedings arising in the normal course of business. Management does not believe that there is any pending or threatened legal proceeding against us or Encore Bank or its subsidiaries which, if determined adversely, would have a material adverse effect on our or Encore Bank’s financial condition, results of operations or cash flows.
PART II
Item 5. Market for the Registrant’s Common Equity, Related Stockholder Matters and Issuer Purchases of Equity Securities
Common Stock Market Prices
Our common stock is listed on the NASDAQ Global Market under the ticker symbol “EBTX”. The following table presents the high and low intra-day sales prices for our common stock reported on the NASDAQ Global Market for the periods indicated:
| 2009 | 2008 | |||||||||||
| High | Low | High | Low | |||||||||
| First Quarter |
$ | 11.25 | $ | 4.29 | $ | 20.87 | $ | 16.05 | ||||
| Second Quarter |
11.00 | 6.24 | 19.94 | 15.65 | ||||||||
| Third Quarter |
9.60 | 6.86 | 19.49 | 14.07 | ||||||||
| Fourth Quarter |
8.96 | 7.53 | 17.74 | 10.25 | ||||||||
As of February 26, 2010, we had 10.5 million shares outstanding and 136 shareholders of record. The number of beneficial owners is unknown to us at this time.
Dividend Policy
Holders of our common stock are entitled to receive dividends when, as and if declared by our board of directors out of funds legally available for that purpose. We have not paid any dividends to our holders of common stock in the past and we currently do not intend to pay dividends on our common stock in the foreseeable future. In the event that we decide to pay dividends, there are a number of restrictions on our ability to do so.
For a foreseeable period of time, our principal source of cash revenues will be dividends paid by Encore Bank with respect to its capital stock. There are certain restrictions on the payment of these dividends imposed by federal banking laws, regulations and authorities. The declaration and payment of dividends on our common stock will depend upon our results of operations and financial condition, liquidity and capital requirements, the general economic and regulatory climate, our ability to service any equity or debt obligations senior to the common stock and other factors deemed relevant by our board of directors. Regulatory authorities could impose administratively stricter limitations on the ability of Encore Bank to pay dividends to us if such limits were deemed appropriate to preserve certain capital adequacy requirements.
In addition, the terms of our junior subordinated debentures may limit our ability to pay dividends on our common stock. Beginning on December 5, 2008 and until (i) the third anniversary of the U.S. Treasury’s investment, (ii) we have redeemed the Series A Preferred Stock or (iii) the U.S. Treasury has transferred the Series A Preferred Stock to a third party, the consent of the U.S. Treasury will be required for us to declare or pay any dividend or make any distribution on our common stock. Also, as long as the Series A Preferred Stock is outstanding, dividend payments on our common stock will be prohibited until all accrued and unpaid dividends
39
Table of Contents
Index to Financial Statements
are paid on the Series A Preferred Stock, subject to certain limited exceptions. Furthermore, it is Federal Reserve policy that we inform and consult with them prior to declaring and paying a dividend that could raise safety and soundness concerns, including dividends on the Series A Preferred Stock issued to the U.S. Treasury under the CPP or interest on the subordinated debentures underlying our trust preferred securities.
Recent Sales of Unregistered Securities
None.
Securities Authorized for Issuance Under Equity Compensation Plans
The following table sets forth information as of December 31, 2009 with respect to equity compensation plans approved by shareholders under which our common stock is authorized for issuance. All outstanding stock options have been issued under plans approved by shareholders.
| Plan Category |
Number of Common Shares to Be Issued Upon Exercise of Outstanding Options, Warrants and Rights (a) |
Weighted Average Exercise Price of Outstanding Options, Warrants and Rights (b) |
Number of Securities Available for Future Issuance Under Equity Compensation Plans (Excluding Securities Reflected in Column (a)) (c) | ||||
| Equity compensation plans approved by security holders |
979,750 | $ | 9.73 | 228,464 | |||
| Equity compensation plans not approved by security holders |
— | — | — | ||||
| Total |
979,750 | $ | 9.73 | 228,464 | |||
Issuer Purchases of Equity Securities
The following table sets forth information regarding repurchases of our common stock made by us during the fiscal year ended December 31, 2009:
| Month in 2009 |
Total Number of Shares Purchased (1) |
Average Price Paid Per Share |
Total Number of Shares Purchased as Part of Publicly Announced Plans or Programs (2) |
Maximum Number (or Approximate Dollar Value) of Shares that May Yet Be Purchased Under the Plans or Programs (2) | |||||
| February |
1,960 | $ | 5.49 | N/A | N/A | ||||
| April |
1,307 | 9.02 | N/A | N/A | |||||
| May |
219 | 8.04 | N/A | N/A | |||||
| November |
1,508 | 8.56 | N/A | N/A | |||||
| December |
12,124 | 8.02 | N/A | N/A | |||||
| Total |
17,118 | $ | 7.85 | N/A | N/A | ||||
| (1) | All shares of common stock reported in the table above were repurchased by us at the fair market value of our common stock in connection with the satisfaction of tax withholding obligations under restricted stock agreements between us and certain of our key employees and directors. |
| (2) | We have no publicly announced plans or programs. |
40
Table of Contents
Index to Financial Statements
Performance Graph
The following Stock Performance Graph compares the cumulative total shareholder return on our common stock for the period since our shares of common stock were registered under Section 12 of the Exchange Act on July 17, 2007 to December 31, 2009, with the cumulative total return of the Russell 2000 Index and KBW Bank Index for the same period. This presentation assumes that the value of the investment in our common stock and each index on July 17, 2007 was $100.00 and that subsequent cash dividends were reinvested. The historical stock price performance of our common stock shown on the graph below is not necessarily indicative of future stock price performance.
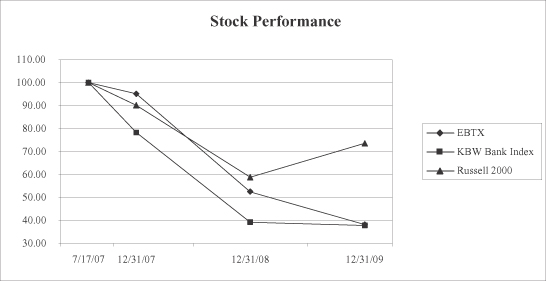
| Period Ending | ||||||||||||
| Index |
7/17/07 | 12/31/07 | 12/31/08 | 12/31/09 | ||||||||
| Encore Bancshares, Inc. |
$ | 100.00 | $ | 95.19 | $ | 52.38 | $ | 38.19 | ||||
| KBW Bank Index |
100.00 | 78.27 | 39.15 | 37.73 | ||||||||
| Russell 2000 |
100.00 | 90.13 | 58.77 | 73.58 | ||||||||
41
Table of Contents
Index to Financial Statements
Item 6. Selected Financial Data
The following table summarizes our historical consolidated financial data for the periods and at the dates indicated. You should read this information in conjunction with our audited consolidated financial statements and related notes included in this Form 10-K. You should not assume the results of operations for past periods indicate results for any future period.
| As of and for the Years Ended December 31, | |||||||||||||||||
| 2009 | 2008 | 2007 | 2006 | 2005 | |||||||||||||
| (amounts in thousands, except per share data) | |||||||||||||||||
| Operations Statement Data: |
|||||||||||||||||
| Interest income |
$ | 77,226 | $ | 81,271 | $ | 81,427 | $ | 75,810 | $ | 64,653 | |||||||
| Interest expense |
30,731 | 36,997 | 47,252 | 45,637 | 38,400 | ||||||||||||
| Net interest income |
46,495 | 44,274 | 34,175 | 30,173 | 26,253 | ||||||||||||
| Provision for loan losses |
16,660 | 29,175 | 4,029 | 3,491 | 3,198 | ||||||||||||
| Net interest income after provision for loan losses |
29,835 | 15,099 | 30,146 | 26,682 | 23,055 | ||||||||||||
| Noninterest income (1) |
27,337 | 22,945 | 30,903 | 34,926 | 29,206 | ||||||||||||
| Noninterest expense (1) |
54,424 | 51,006 | 50,544 | 50,181 | 45,374 | ||||||||||||
| Net earnings (loss) before income taxes |
2,748 | (12,962 | ) | 10,505 | 11,427 | 6,887 | |||||||||||
| Income tax expense (benefit) |
962 | (4,888 | ) | 3,121 | 3,949 | 2,098 | |||||||||||
| Net earnings (loss) |
$ | 1,786 | $ | (8,074 | ) | $ | 7,384 | $ | 7,478 | $ | 4,789 | ||||||
| Earnings (loss) available to common shareholders |
$ | (428 | ) | $ | (8,240 | ) | $ | 7,384 | $ | 7,478 | $ | 4,789 | |||||
| Common Share Data: |
|||||||||||||||||
| Basic earnings (loss) per share (2) |
$ | (0.04 | ) | $ | (0.81 | ) | $ | 0.83 | $ | 0.96 | $ | 0.68 | |||||
| Diluted earnings (loss) per share (2) |
(0.04 | ) | (0.81 | ) | 0.78 | 0.92 | 0.64 | ||||||||||
| Book value per share |
15.01 | 15.36 | 15.56 | 13.57 | 12.68 | ||||||||||||
| Tangible book value per share (3) |
11.10 | 12.05 | 12.13 | 9.01 | 8.07 | ||||||||||||
| Average common shares outstanding (2) |
10,381 | 10,205 | 8,888 | 7,756 | 7,019 | ||||||||||||
| Diluted average common shares outstanding (2) |
10,381 | 10,205 | 9,471 | 8,102 | 7,436 | ||||||||||||
| Shares outstanding at end of period (4) |
10,504 | 10,241 | 10,124 | 7,786 | 7,692 | ||||||||||||
| Period End Balance Sheet Data: |
|||||||||||||||||
| Total assets |
$ | 1,635,355 | $ | 1,587,844 | $ | 1,401,197 | $ | 1,336,843 | $ | 1,316,565 | |||||||
| Investment securities |
257,822 | 174,691 | 146,263 | 256,256 | 323,074 | ||||||||||||
| Loans receivable |
1,078,205 | 1,218,404 | 1,097,268 | 908,368 | 808,204 | ||||||||||||
| Allowance for loan losses |
26,501 | 25,105 | 11,161 | 9,056 | 8,719 | ||||||||||||
| Goodwill and other intangible assets, net |
41,150 | 33,904 | 34,722 | 35,487 | 35,442 | ||||||||||||
| Deposits |
1,191,836 | 1,100,797 | 1,041,374 | 1,030,811 | 815,074 | ||||||||||||
| Shareholders’ equity (5) |
186,668 | 185,742 | 157,479 | 105,677 | 97,513 | ||||||||||||
| Junior subordinated debentures |
20,619 | 20,619 | 20,619 | 20,619 | 20,619 | ||||||||||||
| Average Balance Sheet Data: |
|||||||||||||||||
| Total assets |
$ | 1,600,675 | $ | 1,483,021 | $ | 1,341,105 | $ | 1,316,572 | $ | 1,293,781 | |||||||
| Investment securities |
220,317 | 150,096 | 179,767 | 288,082 | 385,502 | ||||||||||||
| Loans receivable |
1,145,522 | 1,170,717 | 972,760 | 840,330 | 747,079 | ||||||||||||
| Deposits |
1,150,464 | 1,061,318 | 1,011,563 | 882,581 | 767,358 | ||||||||||||
| Shareholders’ equity (6) |
187,610 | 162,929 | 129,316 | 100,827 | 87,358 | ||||||||||||
42
Table of Contents
Index to Financial Statements
| As of and for the Years Ended December 31, | |||||||||||||||
| 2009 | 2008 | 2007 | 2006 | 2005 | |||||||||||
| (amounts in thousands, except per share data) | |||||||||||||||
| Selected Performance Ratios: |
|||||||||||||||
| Return on average assets |
0.11 | % | (0.54 | )% | 0.55 | % | 0.57 | % | 0.37 | % | |||||
| Return on average common equity (7) |
(0.27 | ) | (5.13 | ) | 5.71 | 7.42 | 5.48 | ||||||||
| Return on average tangible common equity (3)(7) |
(0.34 | ) | (6.53 | ) | 7.84 | 11.40 | 7.37 | ||||||||
| Net interest margin (TE)(8) |
3.10 | 3.18 | 2.74 | 2.46 | 2.14 | ||||||||||
| Efficiency ratio (1)(9) |
75.16 | 72.62 | 76.17 | 75.62 | 80.83 | ||||||||||
| Noninterest income to total revenue (1) |
37.03 | 34.13 | 47.49 | 53.65 | 52.66 | ||||||||||
| Asset Quality Ratios (10): |
|||||||||||||||
| Nonperforming assets to total loans and investment in real estate (11) |
4.63 | % | 2.73 | % | 1.10 | % | 1.06 | % | 0.51 | % | |||||
| Net charge-offs to average loans |
1.33 | 1.30 | 0.20 | 0.38 | 0.29 | ||||||||||
| Allowance for loan losses to year end loans |
2.46 | 2.06 | 1.02 | 1.00 | 1.08 | ||||||||||
| Allowance for loan losses to nonperforming loans (11) |
73.64 | 82.23 | 99.58 | 96.23 | 284.56 | ||||||||||
| Capital Ratios: |
|||||||||||||||
| Leverage ratio (12) |
10.55 | % | 11.61 | % | 10.47 | % | 6.90 | % | 6.23 | % | |||||
| Tier 1 risk-based capital ratio (12) |
14.80 | 14.58 | 13.59 | 10.17 | 9.89 | ||||||||||
| Total risk-based capital ratio (12) |
16.07 | 15.84 | 14.65 | 11.19 | 10.97 | ||||||||||
| Tangible common equity to tangible assets (3) |
7.31 | 7.94 | 8.98 | 5.39 | 4.85 | ||||||||||
| (1) | Prior periods adjusted to include net expenses of foreclosed real estate in noninterest expense. |
| (2) | Prior periods adjusted to include nonvested restricted stock in average common shares outstanding as required by FASB ASC 260. |
| (3) | Non-GAAP measure. See “Management’s Discussion and Analysis of Financial Condition and Results of Operations—Non-GAAP Financial Measures.” Tangible common equity includes $10.3 million of puttable common stock as of December 31, 2006 and 2005. Tangible common equity and tangible assets are calculated as follows: |
| December 31, | |||||||||||||||
| 2009 | 2008 | 2007 | 2006 | 2005 | |||||||||||
| (dollars in thousands) | |||||||||||||||
| Shareholders’ equity (GAAP) |
$ | 186,668 | $ | 185,742 | $ | 157,479 | $ | 105,677 | $ | 97,513 | |||||
| Less: Preferred stock |
28,976 | 28,461 | — | — | — | ||||||||||
| Goodwill and other intangible assets, net |
41,150 | 33,904 | 34,722 | 35,487 | 35,442 | ||||||||||
| Tangible common equity |
$ | 116,542 | $ | 123,377 | $ | 122,757 | $ | 70,190 | $ | 62,071 | |||||
| Total assets (GAAP) |
$ | 1,635,355 | $ | 1,587,844 | $ | 1,401,197 | $ | 1,336,843 | $ | 1,316,565 | |||||
| Less: Goodwill and other intangible assets, net |
41,150 | 33,904 | 34,722 | 35,487 | 35,442 | ||||||||||
| Tangible assets |
$ | 1,594,205 | $ | 1,553,940 | $ | 1,366,475 | $ | 1,301,356 | $ | 1,281,123 | |||||
| (4) | Includes nonvested restricted stock. |
| (5) | Shareholders’ equity as of December 31, 2006 and 2005 includes $10.3 million in puttable common stock. The put agreement to which the stock was subject was terminated on March 30, 2007. For a discussion of the puttable common stock, please refer to the section captioned “Management’s Discussion and Analysis of |
43
Table of Contents
Index to Financial Statements
| Financial Condition and Results of Operations—Financial Condition—Shareholders’ Equity and Puttable Common Stock,” in Part II, Item 7 of this Annual Report on Form 10-K. |
| (6) | Average shareholders’ equity for the years ended December 31, 2007, 2006 and 2005 includes $2.5 million, $10.3 million and $3.4 million in puttable common stock. |
| (7) | Return based on earnings (loss) available to common shareholders. The ratios for years ended December 31, 2007, 2006 and 2005 include puttable common stock as a part of shareholders’ equity. |
| (8) | Net interest margin is calculated by dividing net interest income by average earning assets. On taxable-equivalent basis in 2009. Taxable-equivalent amounts in prior years were immaterial. Taxable-equivalent measures are considered non-GAAP measures and are calculated as follows: |
| Years Ended December 31, | |||||||||||||||
| 2009 | 2008 | 2007 | 2006 | 2005 | |||||||||||
| (dollars in thousands) | |||||||||||||||
| Net interest income (GAAP) |
$ | 46,495 | $ | 44,274 | $ | 34,175 | $ | 30,173 | $ | 26,253 | |||||
| Taxable-equivalent adjustment |
454 | — | — | — | — | ||||||||||
| Net interest income on taxable-equivalent basis |
$ | 46,949 | $ | 44,274 | $ | 34,175 | $ | 30,173 | $ | 26,253 | |||||
| (9) | Calculated by dividing total noninterest expense, less amortization of intangibles, by the sum of net interest income plus noninterest income, excluding gains and losses on sales of securities and impairment write down on securities. |
| (10) | At period end, except net charge-offs to average loans, which is for periods ended at such dates. |
| (11) | As of December 31, 2009, accruing loans past due 90 days or more and still accruing were reclassified from nonperforming loans to a separate category. Nonperforming loans consist of nonaccrual loans, nonaccrual restructured loans and any other loan management deems to be nonperforming. |
| (12) | Regulatory capital ratios for December 31, 2009, 2008 and 2007 are for Encore Bancshares, Inc. Regulatory capital ratios for December 31, 2006 and 2005 are for Encore Bank. On March 30, 2007, we became a bank holding company and Encore Bank became a national bank. For all periods prior to March 30, 2007, the capital ratios are calculated in accordance with Office of Thrift Supervision regulations and as of March 31, 2007, the capital ratios are calculated in accordance with OCC regulations. We were not required to monitor consolidated capital ratios as a thrift holding company, but we are required to do so as a bank holding company. See the section of this Form 10-K captioned “Management’s Discussion and Analysis of Financial Condition and Results of Operations—Financial Condition—Regulatory Capital” for details relating to our regulatory capital ratios. |
44
Table of Contents
Index to Financial Statements
Item 7. Management’s Discussion and Analysis of Financial Condition and Results of Operations
SPECIAL CAUTIONARY NOTICE REGARDING FORWARD-LOOKING STATEMENTS
Statements and financial discussion and analysis contained in this Annual Report on Form 10-K that are not statements of historical fact constitute forward-looking statements made pursuant to the safe harbor provisions of the Private Securities Litigation Reform Act of 1995. These forward-looking statements are based on assumptions and involve a number of risks and uncertainties, many of which are beyond our control. The words “believe,” “may,” “should,” “anticipate,” “estimate,” “expect,” “intend,” “continue,” “would,” “could,” “hope,” “might,” “assume,” “objective,” “seek,” “plan,” “strive” and similar words, or the negatives of these words, are intended to identify forward-looking statements.
Many possible events or factors could affect our future financial results and performance and could cause our actual results to differ materially from the expectations of future results we express or imply in any forward-looking statements. In addition to the other factors discussed in the “Risk Factors” section of this Form 10-K, factors that could contribute to those differences include, but are not limited to:
| • | changes in the strength of general business or economic conditions, either nationally, regionally or in the local markets we serve, may result in, among other things, a deterioration of credit quality or a reduced demand for credit or a decline in wealth management fees; |
| • | volatility and disruption in national and international financial markets; |
| • | changes in the interest rate environment, which may reduce our margins or impact the value of changes in market rates and prices and may impact the value of securities, loans, deposits and other financial instruments; |
| • | increased credit risk in our assets and increased operating risk caused by a material change in commercial, consumer and/or real estate loans as a percentage of the total loan portfolio; |
| • | the failure to complete the pending transactions for the sale of our Florida operations; |
| • | the concentration of our loan portfolio in loans collateralized by real estate; |
| • | our level of commercial real estate and commercial loans; |
| • | incorrect assumptions underlying the establishment of and provisions made to the allowance for loan losses; |
| • | increased asset levels and changes in the composition of assets and the resulting impact on our capital levels and regulatory capital ratios; |
| • | legislative or regulatory developments including changes in laws concerning taxes, banking, securities, investment advisory, trust, insurance and other aspects of the financial services industry; |
| • | increased FDIC assessments or the imposition of special assessments; |
| • | government intervention in the U.S. financial system; |
| • | the continued service of key management personnel; |
| • | our ability to attract, motivate and retain key employees; |
| • | changes in the availability of funds resulting in increased costs or reduced liquidity; |
| • | factors that increase competitive pressure among financial services organizations, including product and pricing pressures; |
| • | risks associated with our investment in Linscomb & Williams; |
| • | the incurrence and possible impairment of goodwill associated with an acquisition and possible adverse short-term effects on our results of operations; |
45
Table of Contents
Index to Financial Statements
| • | our ability to expand and grow our business and operations, including the establishment of additional private client offices and acquisition of additional banks, and our ability to realize the cost savings and revenue enhancements we expect from such activities; and |
| • | fiscal and governmental policies of the United States federal government. |
Forward-looking statements are not guarantees of performance or results. A forward-looking statement may include a statement of the assumptions or bases underlying the forward-looking statement. We believe we have chosen these assumptions or bases in good faith and that they are reasonable. We caution you, however, that assumptions or bases almost always vary from actual results, and the differences between assumptions or bases and actual results can be material. When considering forward-looking statements, you should keep in mind the risk factors and other cautionary statements in this Form 10-K. These statements speak only as of the date of this report (or an earlier date to the extent applicable). We undertake no obligation to update publicly such forward-looking statements in light of new information or future events.
Management’s Discussion and Analysis of Financial Condition and Results of Operations analyzes the major elements of our consolidated balance sheets and consolidated statements of operations. This section should be read in conjunction with our audited consolidated financial statements and related notes as of December 31, 2009 and 2008 and for each of the three years ended December 31, 2009, which are included in this Form 10-K.
General
We generate our revenue from net interest income and noninterest income. Net interest income is the difference between interest income on interest-earning assets such as loans and securities and interest expense on interest-bearing liabilities such as client deposits and other borrowings that are used to fund those assets. Net interest income is a significant contributor to results of operations. Interest rate fluctuations, as well as changes in the amount and type of earning assets and liabilities, combine to affect net interest income.
During the past three years we have generated the largest portion of our noninterest income through trust and investment management fees. We also have an insurance agency that generates commissions on sales of insurance. Trust and investment management fees, mortgage banking income, insurance commissions and gain or loss on the sale of securities are reported in our consolidated statement of operations under “noninterest income.” Offsetting these earnings are operating expenses referred to as “noninterest expense.” Because banking is a labor intensive business, our largest operating expense is employee compensation.
While Encore Bank can trace its existence back to 1928, October 1, 2000 marked the beginning of our existing business strategy as our current ownership and management team formed our company and assumed control of Encore Bank. Since that date, we have transformed from a mortgage loan, security and wholesale deposit strategy into a more relationship driven loan and deposit strategy. In the process of this transformation, we sold a significant amount of assets, including investment securities and real estate and made significant investments in building a loan platform which would allow us to originate higher yielding commercial loans. We also made significant changes to our branch network by selling our branches in St. Louis, Kansas City, Atlanta and Boston and opening new private client offices in Houston and southwest Florida. In addition, we added the insurance and wealth management lines of business which have significantly diversified our noninterest income.
Effective March 30, 2007, Encore Bank converted from a federal savings association to a national banking association subject to supervision and regulation by the OCC. In connection with the conversion, we became a bank holding company subject to supervision and regulation by the Federal Reserve. When we acquired Encore Bank, it was primarily a mortgage lender, and the rules and regulations governing thrifts and regulation by the Office of Thrift Supervision were more suitable for an entity engaging in that activity. As we have transformed our business by increasing commercial loans, we believe that operation as a national bank regulated by the OCC is consistent with our business plan.
46
Table of Contents
Index to Financial Statements
As part of a corporate reorganization following the conversion of Encore Bank to a national banking association, on June 1, 2007, Encore Bank and Encore Trust Company, N.A. entered into an Agreement and Plan of Merger pursuant to which Encore Bank was merged with and into Encore Trust Company, N.A. as of June 30, 2007. The resulting bank, which was renamed Encore Bank, N.A., operates as a national banking association with its main office in Houston, Texas. Following the merger, the business of Encore Trust Company, N.A. is being conducted as a division of Encore Bank. Our election to become a financial holding company was effective July 21, 2008.
Throughout this building process, lower yielding purchased mortgage loans and securities have paid down or matured and been replaced with our own originated loans. Consequently, while our total assets have only increased recently, our net interest margin over this time period has improved primarily due to the higher yielding mix of earning assets.
Pending Transactions
On March 15, 2010, Encore Bank executed two separate purchase and assumption agreements to sell certain assets and transfer certain liabilities of its Florida operations. The first agreement is with Ovation Holdings and its proposed subsidiary bank, National Bank of Southwest Florida (NBSWF), headquartered in Port Charlotte, Florida. Ovation Holdings has entered into a definitive agreement to purchase NBSWF.
Under the terms of the first agreement, NBSWF is to assume approximately $171.6 million of deposits associated with our four private client offices located in Naples, Ft. Myers and Sun City Center, Florida. NBSWF is also expected to purchase approximately $86.2 million of loans as well as other assets, including premises and equipment. The purchase and assumption is subject to regulatory approval, the closing of the purchase of NBSWF by Ovation Holdings and customary closing conditions and is expected to close before the end of the third quarter 2010, although delays may occur.
The second agreement is with HomeBanc, headquartered in Lake Mary, Florida. Under the terms of this agreement, HomeBanc is to assume approximately $59.7 million of deposits and certain assets associated with our two private client offices in Clearwater and Belleair Bluffs, Florida. The transaction is subject to regulatory approval and customary closing conditions and is expected to close before the end of the third quarter 2010, although delays may occur.
The deposits and loans to be acquired represent approximately 19.4% and 8.0% of our total deposits and loans at December 31, 2009. The combined transactions will result in a pre-tax loss of approximately $1.0 million. We expect to take a charge of approximately $4.4 million in the first quarter of 2010 to adjust the assets held for sale to their agreed purchase price. The gain on the sale of the deposits with respect to each transaction will be recognized when each transaction is completed.
Payment of Contingent Consideration
Pursuant to the terms of the agreement for our acquisition of Linscomb & Williams, we were obligated to make a contingency payment to the former Linscomb & Williams shareholders. The accrued liability related to this transaction as of December 31, 2009 was $7.9 million and will be extinguished by the issuance of approximately 696,000 shares of common stock prior to the end of the first quarter 2010 and the payment of $2.1 million in cash, which has already been paid. The recording of this transaction as of December 31, 2009 resulted in approximately $7.9 million in additional goodwill, which reduced tangible book value and regulatory capital. Upon issuance of the shares during the first quarter of 2010, tangible book value and regulatory capital will be increased by approximately $5.8 million.
Critical Accounting Policies and Estimates
The accounting principles we follow and the methods of applying these principles conform with generally accepted accounting principles in the United States of America (US GAAP) and with general practices within the
47
Table of Contents
Index to Financial Statements
banking industry. Our critical accounting policies relate to (1) the allowance for loan losses, (2) income taxes and (3) goodwill and other intangible assets. These critical accounting policies require the use of estimates, assumptions and judgments which are based on information available as of the date of the relevant financial statement. Accordingly, as this information changes, future financial statements could reflect the use of different estimates, assumptions and judgments. Certain determinations inherently have a greater reliance on the use of estimates, assumptions and judgments and, as such, have a greater possibility of producing results that could be materially different than originally reported.
Allowance for Loan Losses. We maintain an allowance for loan losses sufficient to absorb estimated losses incurred in the loan portfolio through the balance sheet date. The determination of the appropriate level of the allowance is based on periodic evaluations of our loan portfolio. These evaluations are inherently subjective and require us to make numerous assumptions, estimates and judgments.
In analyzing the adequacy of the allowance for loan losses, we utilize a loan grading system for commercial loans to determine the risk potential in the portfolio and also consider the results of independent internal credit reviews. Consumer loans, including residential real estate, are evaluated periodically based on their repayment status. To determine the adequacy of the allowance, we segment our loan portfolio into loan types. The allowance consists of general and specific components. The general component is based on, among other things, the historical loan loss experience for each loan type, the growth, composition and diversification of our loan portfolio, delinquency and loan classification trends, estimated value of the underlying collateral, and the results of recent regulatory examinations. Also, new credit products and policies, economic conditions, concentrations of credit risk, and the experience and abilities of lending personnel are also taken into consideration.
In addition to the general component, nonaccrual loans graded substandard or doubtful with an outstanding balance of $250,000 or more, as well as all loans designated as troubled debt restructurings, are individually evaluated in accordance with Financial Accounting Standards Board Accounting Standards Codification (FASB ASC) 310, Receivables, to determine the level of any impairment and specific reserve.
As a final step to the evaluation process, we perform an additional review of the adequacy of the allowance based on the loan portfolio in its entirety. This enables us to mitigate, but not eliminate, the imprecision inherent in loan- and segment-level estimates of expected credit losses. This review of the allowance includes our judgmental consideration of any adjustments necessary for subjective factors such as economic uncertainties and concentration risks.
There are numerous factors that enter into the evaluation of the allowance for loan losses. Some are quantitative while others require us to make qualitative judgments. Although we believe that our processes for determining an appropriate level for the allowance adequately address the various factors that could potentially result in credit losses, the processes and their elements include features that may be susceptible to significant change. Any unfavorable differences between the actual outcome of credit-related events and our estimates and projections could require an additional provision for credit losses, which would negatively impact our results of operations in future periods. Assuming a one risk grade downgrade throughout our individually rated portfolio could imply an additional allowance requirement in the general component of approximately $1.5 million at December 31, 2009. This sensitivity analysis is hypothetical and has been provided only to indicate the potential impact that changes in the level of the criticized and classified loans may have on the allowance estimation process. We believe that given the procedures we follow in estimating incurred losses in the loan portfolio, the various components used in the current estimation processes are appropriate.
Income Taxes. The calculation of our income tax provision is complex and requires the use of estimates and judgment in its determination. We are subject to the income tax laws of the various jurisdictions where we conduct business, and we estimate income tax expense based on amounts expected to be owed to these various tax jurisdictions. We assess the appropriate tax treatment of transactions and filing positions after considering statutes, regulations, judicial precedent and other pertinent information, and we maintain tax accruals consistent
48
Table of Contents
Index to Financial Statements
with our evaluation. Changes in the estimate of accrued taxes occur periodically due to changes in tax rates, interpretations of tax laws, the status of examinations by the taxing authorities, and newly enacted statutory, judicial, and regulatory guidance that could impact the relative merits of the tax positions. These changes, when they occur, impact accrued taxes and can materially affect our operating results. On January 1, 2007, we adopted interpretive guidance related to uncertain tax positions in FASB ASC 740. For additional information, see Note H, “Income Taxes,” to our consolidated financial statements included in this Form 10-K.
Goodwill and Other Intangible Assets. Goodwill and other intangible assets that have indefinite useful lives are subject to an impairment test at least annually and more frequently if circumstances indicate their value may not be recoverable. Goodwill is tested for impairment using a two-step process that begins with an estimation of the fair value of each of our reporting units compared to its carrying value. If a reporting unit’s carrying value exceeds its fair value, a second test is completed comparing the implied fair value of the reporting unit’s goodwill to its carrying value to measure the amount of impairment. Other identifiable intangible assets that are subject to amortization are amortized on an accelerated basis over their estimated useful lives, ranging from 15 to 20 years. These amortizable intangible assets are reviewed for impairment if circumstances indicate their value may not be recoverable. Based on our goodwill impairment test as of October 1, 2009, we do not believe any of our goodwill is impaired. In addition, as of December 31, 2009, we assessed the useful lives of our other intangible assets and determined that there has not been any significant change in the original estimated useful lives.
Pending Accounting Pronouncements
Recently issued accounting pronouncements are disclosed in Note A, “Summary of Significant Accounting Policies,” to our consolidated financial statements included in this Form 10-K. Pending accounting pronouncements include:
FASB Accounting Standard Update (ASU) 2010-06, Fair Value Measurements and Disclosures (Topic 820): Improving Disclosures about Fair Value Measurements. This ASU requires some new disclosures and clarifies some existing disclosure requirements about fair value measurement as set forth in Codification Subtopic 820-10. The FASB’s objective is to improve these disclosures and, thus, increase the transparency in financial reporting. ASU 2010-06 is effective for interim and annual reporting periods beginning after December 15, 2009, except for certain disclosures related to activity in Level 3 fair value measurements. Those disclosures are effective for fiscal years beginning after December 15, 2010, and for interim periods within those fiscal years. Early application is permitted. We do not expect ASU 2010-06 to have a material effect on our consolidated financial statements.
FASB ASU 2009-16, Transfers and Servicing (Topic 860)—Accounting for Transfers of Financial Assets, which formally codifies FASB Statement No. 166, Accounting for Transfers of Financial Assets, into the FASB ASC. ASU 2009-16 represents a revision to the provisions of former FASB Statement No. 140, Accounting for Transfers and Servicing of Financial Assets and Extinguishments of Liabilities, and will require more information about transfers of financial assets, including securitization transactions, and where entities have continuing exposure to the risks related to transferred financial assets. ASU 2009-16 is effective at the start of a reporting entity’s first fiscal year beginning after November 15, 2009, or January 1, 2010, for a calendar year-end entity. Early application is not permitted. We do not expect ASU 2009-16 to have a material effect on our consolidated financial statements.
Non-GAAP Financial Measures
This report contains certain financial information determined by methods other than in accordance with US GAAP. These measures include net interest income, net interest spread and net interest margin on a taxable-equivalent basis, which is common practice in the banking industry, as well as tangible book value per share, return on average tangible common equity and tangible common equity to tangible assets. We have included in
49
Table of Contents
Index to Financial Statements
this report information related to these non-GAAP financial measures for the applicable periods presented. We believe these non-GAAP financial measures provide information useful to investors in understanding our financial results and believe that its presentation, together with the accompanying reconciliations, provides a complete understanding of factors and trends affecting our business and allows investors to view performance in a manner similar to management, the entire financial services sector, bank stock analysts and bank regulators. These non-GAAP measures should not be considered a substitute for operating results determined in accordance with GAAP and we strongly encourage investors to review our consolidated financial statements in their entirety and not to rely on any single financial measure. Because non-GAAP financial measures are not standardized, it may not be possible to compare these financial measures with other companies’ non-GAAP financial measures having the same or similar names.
In 2009, we reclassified net expenses of foreclosed real estate from other noninterest income to noninterest expense for all periods presented. These reclassifications had no impact on financial condition, results of operations or equity in any of the reported periods.
Key Financial Measures
For the year ended December 31, 2009, net earnings were $1.8 million, compared with a net loss of $8.1 million for 2008. The loss per diluted common share (as a result of deducting preferred dividends from net earnings) for the year ended December 31, 2009 was $0.04, compared with a loss per diluted common share of $0.81 for 2008. The improvement in earnings was primarily due to lower credit costs.
Our net loss was $8.1 million, or $0.81 per diluted share, for the year ended December 31, 2008, compared with net earnings of $7.4 million, or $0.78 per diluted share, for 2007. The deepening economic recession and extremely challenging financial environment significantly intensified in the last quarter of 2008. Consequently, 2008 results were driven by escalating credit costs, including additions to the allowance for loan losses, and an impairment charge related to a security. Results for 2008 include a $10.1 million, or 29.6%, improvement in net interest income. Offsetting this improvement was a $25.1 million increase in the provision for loan losses, which included a $6.0 million charge-off of a loan to a professional and a $13.9 million increase to the allowance for loan losses. The 2008 results also include a $2.0 million non-cash impairment charge on a security acquired in connection with our Community Reinvestment Act (CRA) requirements.
Our return on average assets was 0.11% for the year ended December 31, 2009 compared with (0.54)% for 2008 and 0.55% for 2007. Our return on average common equity, as a result of deducting preferred dividends from net earnings, was (0.27)% for the year ended December 31, 2009 compared with (5.13) % for 2008 and 5.71% for 2007. The return on equity includes dividends paid on the preferred stock which reduces earnings attributable to shares of common stock. The return on average common equity for a portion of 2007 includes $10.3 million in puttable common stock associated with the Linscomb & Williams acquisition. See the section of this Form 10-K captioned “—Financial Condition—Shareholders’ Equity and Puttable Common Stock” for a detailed discussion of the puttable common stock.
Our taxable-equivalent (TE) net interest margin was 3.10% for the year ended December 31, 2009 compared with 3.18% for 2008 and 2.74% in 2007. The net interest margin declined 8 basis points in 2009, reflecting a decrease in the loan portfolio. Our net interest margin continued to improve in 2008 due to our more favorable mix of earning assets, as originated loans replaced lower yielding purchased mortgage loans and securities.
Our efficiency ratio (calculated by dividing total noninterest expense, less amortization of intangibles, by the sum of net interest income plus noninterest income, excluding gains and losses on sales of securities and impairment write down on securities) was 75.16% for the year ended December 31, 2009 compared with 72.62% for 2008 and 76.17% in 2007. The efficiency ratio is a supplemental financial measure utilized in management’s internal evaluation of our performance and is not defined under US GAAP. An increase in the efficiency ratio could indicate that more resources are being utilized to generate the same dollar amount of income, while a decrease indicates a more efficient allocation of resources.
50
Table of Contents
Index to Financial Statements
Total assets increased $47.5 million, or 3.0%, to $1.6 billion as of December 31, 2009 compared with December 31, 2008 and increased $186.6 million, or 13.3%, to $1.6 billion as of December 31, 2008 compared with December 31, 2007. Our loan portfolio decreased $140.2 million, or 11.5%, to $1.1 billion as of December 31, 2009 and grew $121.1 million, or 11.0%, to $1.2 billion as of December 31, 2008. Shareholders’ equity increased $926,000, or 0.5%, to $186.7 million as of December 31, 2009, and $28.3 million, or 17.9%, to $185.7 million as of December 31, 2008.
Results of Operations
Net Interest Income
Our operating results are significantly impacted by net interest income, which represents the amount by which interest income on interest-earning assets, including securities and loans, exceeds interest expense incurred on interest-bearing liabilities, including deposits and other borrowed funds. Net interest income is a key source of our revenue. Interest rate fluctuations, as well as changes in the amount and type of interest-earning assets and interest-bearing liabilities, combine to affect net interest income. Net interest income is affected by changes in the amount and mix of interest-earning assets and interest-bearing liabilities, referred to as “volume changes.” It is also affected by changes in yields earned on interest-earning assets and rates paid on interest-bearing deposits and other borrowed funds, referred to as “rate changes.”
2009 vs 2008. Net interest income (TE) was $46.9 million for the year ended December 31, 2009, an increase of $2.7 million, or 6.0%, compared with the same period of 2008. The increase was primarily due to an increase in interest earning assets, which was partially offset by an increase in nonperforming loans. Average interest-earning assets increased $124.0 million, or 8.9%, due primarily to growth in securities and deposits in banks, which was funded by growth in deposits. For the year ended December 31, 2009, the net interest margin (TE) was 3.10%, a decrease of 8 basis points, compared with the same period of 2008. The contraction in the margin was due primarily to the change in the asset mix as average loans decreased $25.2 million, or 2.2%, and average temporary investments increased $78.5 million. This shift resulted from weak loan demand, a shortage of loans meeting our credit standards and the decision to remain liquid in expectation of rising interest rates. In addition, the increase in nonperforming loans caused a reduction in net interest income.
2008 vs. 2007. Net interest income increased $10.1 million, or 29.6%, to $44.3 million for the year ended December 31, 2008 compared with $34.2 million for 2007. The increase in net interest income was primarily due to a $142.5 million, or 11.4%, increase in average earning assets and a 44 basis point increase in our net interest margin to 3.18% in 2008. Average loans in 2008 increased $198.0 million, or 20.4%, compared with 2007. Consistent with our strategy, this increase in average loans was offset by a $29.7 million reduction in lower yielding securities. As a result of this shift, average loans increased to 84.1% of average earning assets for 2008 compared with 77.9% for 2007. The improvement in the margin was due to a combination of a more favorable asset mix, as we continued to replace low yielding mortgage related assets with higher yielding loans, and a steepening yield curve, which allowed us to decrease the pricing of our deposits by an average rate that was more than the decline in the average yield on our earning assets. Our net interest margin further benefited from an increase of $11.2 million, or 10.3%, in average noninterest-bearing deposits.
51
Table of Contents
Index to Financial Statements
The following table sets forth for the periods indicated an analysis of net interest income by each major category of interest-earning assets and interest-bearing liabilities, the average amounts outstanding, the interest earned or paid on such amounts and the average rate earned or paid. The table also sets forth the average rate earned on total interest-earning assets, the average rate paid on total interest-bearing liabilities and the net interest margin for the same periods. All balances are daily average balances and nonaccrual loans were included in average loans with a zero yield for the purpose of calculating the rate earned on total loans. To give effect to our tax-exempt securities and loans, taxable-equivalent adjustments have been made with respect to these assets in 2009. Taxable-equivalent amounts in 2008 and 2007 were immaterial.
| Years Ended December 31, | ||||||||||||||||||||||||||||||
| 2009 | 2008 | 2007 | ||||||||||||||||||||||||||||
| Average Outstanding Balance |
Interest Income/ Expense |
Average Yield/ Rate |
Average Outstanding Balance |
Interest Income/ Expense |
Average Yield/ Rate |
Average Outstanding Balance |
Interest Income/ Expense |
Average Yield/ Rate |
||||||||||||||||||||||
| (dollars in thousands) | ||||||||||||||||||||||||||||||
| Assets: |
||||||||||||||||||||||||||||||
| Interest-earning assets: |
||||||||||||||||||||||||||||||
| Loans (1) |
$ | 1,145,522 | $ | 68,175 | 5.95 | % | $ | 1,170,717 | $ | 73,748 | 6.30 | % | $ | 972,760 | $ | 67,999 | 6.99 | % | ||||||||||||
| Mortgages held-for-sale |
1,317 | 105 | 7.97 | 902 | 79 | 8.76 | 42,379 | 3,733 | 8.81 | |||||||||||||||||||||
| Securities (1) |
220,317 | 8,698 | 3.95 | 150,096 | 5,623 | 3.75 | 179,767 | 6,923 | 3.85 | |||||||||||||||||||||
| Federal funds sold and other |
148,059 | 702 | 0.47 | 69,521 | 1,821 | 2.62 | 53,880 | 2,772 | 5.14 | |||||||||||||||||||||
| Total interest-earning assets (1) |
1,515,215 | 77,680 | 5.13 | 1,391,236 | 81,271 | 5.84 | 1,248,786 | 81,427 | 6.52 | |||||||||||||||||||||
| Less: Allowance for loan losses |
(25,503 | ) | (12,408 | ) | (10,069 | ) | ||||||||||||||||||||||||
| Noninterest-earning assets |
110,963 | 104,193 | 102,388 | |||||||||||||||||||||||||||
| Total assets |
$ | 1,600,675 | $ | 1,483,021 | $ | 1,341,105 | ||||||||||||||||||||||||
| Liabilities, shareholders’ equity and puttable common stock: |
||||||||||||||||||||||||||||||
| Interest-bearing liabilities: |
||||||||||||||||||||||||||||||
| Interest checking |
$ | 186,440 | $ | 888 | 0.48 | % | $ | 187,412 | $ | 2,515 | 1.34 | % | $ | 172,701 | $ | 5,131 | 2.97 | % | ||||||||||||
| Money market and savings |
273,188 | 2,976 | 1.09 | 291,749 | 5,759 | 1.97 | 348,567 | 14,756 | 4.23 | |||||||||||||||||||||
| Time deposits |
537,963 | 17,149 | 3.19 | 461,475 | 19,597 | 4.25 | 380,847 | 18,772 | 4.93 | |||||||||||||||||||||
| Total interest-bearing deposits |
997,591 | 21,013 | 2.11 | 940,636 | 27,871 | 2.96 | 902,115 | 38,659 | 4.29 | |||||||||||||||||||||
| Borrowings and repurchase agreements |
231,648 | 8,493 | 3.67 | 225,969 | 7,781 | 3.44 | 165,647 | 7,029 | 4.24 | |||||||||||||||||||||
| Junior subordinated debentures |
20,619 | 1,225 | 5.94 | 20,619 | 1,345 | 6.52 | 20,712 | 1,564 | 7.55 | |||||||||||||||||||||
| Total interest-bearing liabilities |
1,249,858 | 30,731 | 2.46 | 1,187,224 | 36,997 | 3.12 | 1,088,474 | 47,252 | 4.34 | |||||||||||||||||||||
| Noninterest-bearing liabilities: |
||||||||||||||||||||||||||||||
| Noninterest-bearing deposits |
152,873 | 120,682 | 109,448 | |||||||||||||||||||||||||||
| Other liabilities |
10,334 | 12,186 | 13,867 | |||||||||||||||||||||||||||
| Total liabilities |
1,413,065 | 1,320,092 | 1,211,789 | |||||||||||||||||||||||||||
| Shareholders’ equity and puttable common stock |
187,610 | 162,929 | 129,316 | |||||||||||||||||||||||||||
| Total liabilities, shareholders’ equity and puttable common stock |
$ | 1,600,675 | $ | 1,483,021 | $ | 1,341,105 | ||||||||||||||||||||||||
| Net interest income (TE)(1) |
$ | 46,949 | $ | 44,274 | $ | 34,175 | ||||||||||||||||||||||||
| Net interest spread (TE)(1)(2) |
2.67 | % | 2.72 | % | 2.18 | % | ||||||||||||||||||||||||
| Net interest margin (TE)(1)(3) |
3.10 | % | 3.18 | % | 2.74 | % | ||||||||||||||||||||||||
| Net interest income (GAAP) |
$ | 46,495 | $ | 44,274 | $ | 34,175 | ||||||||||||||||||||||||
| Taxable-equivalent adjustment |
454 | — | — | |||||||||||||||||||||||||||
| Net interest income on taxable-equivalent basis |
$ | 46,949 | $ | 44,274 | $ | 34,175 | ||||||||||||||||||||||||
| (1) | Non-GAAP measure. On taxable-equivalent basis in 2009 to consistently reflect income from taxable and tax-exempt loans and securities based on a 34% federal tax rate. Taxable-equivalent amounts in 2008 and 2007 were immaterial. |
| (2) | Represents the average rate earned on interest-earning assets less the average rate paid on interest-bearing liabilities. |
| (3) | Represents net interest income as a percentage of average interest-earning assets. |
52
Table of Contents
Index to Financial Statements
The following table presents information regarding changes in interest income and interest expense for the periods indicated for each major category of interest-earning assets and interest-bearing liabilities, which distinguishes between the changes attributable to (1) changes in volume (changes in volume multiplied by old rate), (2) changes in rates (changes in rates multiplied by old volume) and (3) changes in rate-volume (changes in rate multiplied by change in volume). Changes in rate-volume are proportionately allocated between rate and volume variances.
| Years Ended December 31, | ||||||||||||||||||||||||
| 2009 vs. 2008 | 2008 vs. 2007 | |||||||||||||||||||||||
| Increase (Decrease) Due to Change In |
Total | Increase (Decrease) Due to Change In |
Total | |||||||||||||||||||||
| Volume | Rate | Volume | Rate | |||||||||||||||||||||
| (dollars in thousands) | ||||||||||||||||||||||||
| Interest-earning assets: |
||||||||||||||||||||||||
| Loans (net of unearned income) |
$ | (1,562 | ) | $ | (4,285 | ) | $ | (5,847 | ) | $ | 12,917 | $ | (7,168 | ) | $ | 5,749 | ||||||||
| Mortgages held-for-sale |
34 | (8 | ) | 26 | (3,633 | ) | (21 | ) | (3,654 | ) | ||||||||||||||
| Securities |
2,710 | 185 | 2,895 | (1,116 | ) | (184 | ) | (1,300 | ) | |||||||||||||||
| Federal funds sold and other |
1,080 | (2,199 | ) | (1,119 | ) | 658 | (1,609 | ) | (951 | ) | ||||||||||||||
| Total increase (decrease) in interest income |
2,262 | (6,307 | ) | (4,045 | ) | 8,826 | (8,982 | ) | (156 | ) | ||||||||||||||
| Interest-bearing liabilities: |
||||||||||||||||||||||||
| Interest checking |
(13 | ) | (1,614 | ) | (1,627 | ) | 405 | (3,021 | ) | (2,616 | ) | |||||||||||||
| Money market and savings |
(346 | ) | (2,437 | ) | (2,783 | ) | (2,105 | ) | (6,892 | ) | (8,997 | ) | ||||||||||||
| Time deposits |
2,925 | (5,373 | ) | (2,448 | ) | 3,641 | (2,816 | ) | 825 | |||||||||||||||
| Borrowings and repurchase agreements |
199 | 513 | 712 | 2,242 | (1,490 | ) | 752 | |||||||||||||||||
| Junior subordinated debentures |
— | (120 | ) | (120 | ) | (7 | ) | (212 | ) | (219 | ) | |||||||||||||
| Total increase (decrease) in interest expense |
2,765 | (9,031 | ) | (6,266 | ) | 4,176 | (14,431 | ) | (10,255 | ) | ||||||||||||||
| Total increase (decrease) in net interest income |
$ | (503 | ) | $ | 2,724 | $ | 2,221 | $ | 4,650 | $ | 5,449 | $ | 10,099 | |||||||||||
Provision for Loan Losses
We assess the adequacy of our allowance for loan losses by applying the provisions of FASB ASC 450-10 and 310-10. We determine specific allocations for loans considered to be impaired and assign loss factors to the remainder of the loan portfolio to determine an appropriate level of allowance for loan losses. The allowance is increased, as necessary, by making a provision for loan losses. The specific allocations for impaired loans are assigned based on an estimated net realizable value after a thorough review of the credit relationship. The potential loss factors associated with the remainder of the loan portfolio are based on our internal net loss experience, as well as other qualitative risk factors.
Generally, commercial, commercial real estate and real estate construction loans are assigned a risk grade at origination. These loans are then reviewed on a regular basis. The periodic reviews generally include loan payment and collateral status, the borrower’s financial data, and key ratios such as cash flows, operating income, liquidity and leverage. A material change in the borrower’s credit risk profile can result in an increase or decrease in the loan’s assigned risk grade. Aggregate dollar volume by risk grade is monitored on an ongoing basis. Consumer loans, including residential real estate, are evaluated periodically based on their repayment status.
53
Table of Contents
Index to Financial Statements
The provision for loan losses represents our determination of the amount necessary to be charged against the current period’s earnings to maintain the allowance for loan losses at a level that is considered adequate in relation to the estimated losses incurred in the loan portfolio through the balance sheet date. The provision was $16.7 million, $29.2 million and $4.0 million for the years ended December 31, 2009, 2008 and 2007. The changes in the provision in 2009 and 2008 primarily reflects the amount we considered necessary to absorb estimated losses incurred in the loan portfolio primarily as a result of the recessionary economic environment, weakness in our Florida market, higher net charge-offs, changes in historical loss factors and the rise in nonperforming loans which has impacted both the specific reserves we hold as well as our general allowance and qualitative factors. The provision increased from 2007 to 2008 due to higher charge-offs, particularly in commercial loans, and due to the weakening economy and lower collateral values, especially in Florida.
Noninterest Income
Noninterest income represented 37.03%, 34.13% and 47.49% of total revenue for the years ended December 31, 2009, 2008 and 2007. Noninterest income increased $4.4 million, or 19.1%, to $27.3 million for the year ended December 31, 2009, compared with 2008, primarily due to a gain on the sale of securities and the impairment write down incurred in 2008. Trust and investment management fees decreased $435,000, or 2.5%, due to lower assets under management which were a result of lower valuations in the equity markets. Insurance commissions decreased $204,000, or 3.6%, due to a soft property and casualty market. Gain on sale of securities increased $2.3 million as we sold securities to better position the balance sheet for an anticipated rise in interest rates. In addition, in 2008, we recognized an impairment of $2.0 million on an investment we acquired in connection with our CRA requirements.
Noninterest income was $22.9 million for 2008, a decrease of $8.0 million, or 25.8%, compared with 2007. The decrease was due primarily to a decrease in mortgage banking income and a $2.0 million impairment charge for the aforementioned CRA investment. Trust and investment management fees were approximately the same year over year as assets under management were significantly impacted by the decline in the stock market in third and fourth quarter of 2008. From December 31, 2007 to December 31, 2008, assets under management decreased 19.3%, however, most of the decline occurred in the second half of the year. The decrease in mortgage banking income was a result of our third quarter 2007 decision to stop selling second mortgage loans that we had originated into the secondary market. We have, to a limited extent, continued to originate and sell first mortgage loans into the secondary market.
The following table presents, for the periods indicated, the major categories of noninterest income:
| Years Ended December 31, | |||||||||||
| 2009 | 2008 | 2007 | |||||||||
| (dollars in thousands) | |||||||||||
| Trust and investment management fees |
$ | 16,894 | $ | 17,329 | $ | 17,546 | |||||
| Mortgage banking |
653 | 251 | 5,506 | ||||||||
| Insurance commissions and fees |
5,477 | 5,681 | 5,942 | ||||||||
| Net gain (loss) on sale of available-for-sale securities |
2,324 | (3 | ) | (181 | ) | ||||||
| Impairment write down on securities |
— | (1,984 | ) | — | |||||||
| Other |
1,989 | 1,671 | 2,090 | ||||||||
| Total noninterest income |
$ | 27,337 | $ | 22,945 | $ | 30,903 | |||||
Noninterest Expense
For the year ended December 31, 2009, noninterest expense was $54.4 million, an increase of $3.4 million, or 6.7%, compared with 2008. The increase was due primarily to a combination of higher compensation expense, FDIC assessments and foreclosed real estate expenses. The increase in compensation was due in part to the addition of executive management, loan workout personnel and new lenders to grow Encore Bank’s commercial
54
Table of Contents
Index to Financial Statements
lending platform. In addition, we capitalized fewer loan origination expenses due to lower loan production volumes. The $2.0 million increase in FDIC assessment expenses reflect a growing deposit base, the expiration of credits used in previous quarters, as well as higher assessment rates imposed by the FDIC, including the special assessment of $684,000 accrued in the second quarter of 2009. Foreclosed real estate expenses increased $858,000 due to higher cost of managing problem assets. Other expenses decreased $627,000, or 12.9%, due mainly to lower provision for unfunded loan commitments.
Noninterest expense was $51.0 million for the year ended December 31, 2008, up $462,000, or 0.9%, compared with $50.5 million for 2007. Professional fees were higher in 2008 due primarily to an arbitration matter that was resolved and the full year’s effect of costs related to being a public company. These costs were offset by lower compensation expense, primarily incentive compensation, and reduced outside data processing expense due to lower negotiated pricing. We also incurred $737,000 for a provision for unfunded loan commitments, which was a result of our growing loan portfolio and the deteriorating economic environment. In addition, 2007 included a nonrecurring charge for early debt extinguishment which resulted from refinancing a portion of our trust preferred securities.
The following table presents, for the periods indicated, the major categories of noninterest expense:
| Years Ended December 31, | ||||||||||
| 2009 | 2008 | 2007 | ||||||||
| (dollars in thousands) | ||||||||||
| Compensation |
$ | 30,163 | $ | 29,317 | $ | 30,117 | ||||
| Non-staff expenses: |
||||||||||
| Occupancy |
6,050 | 6,045 | 5,764 | |||||||
| Equipment |
1,695 | 1,960 | 2,076 | |||||||
| Advertising and promotion |
807 | 842 | 1,018 | |||||||
| Outside data processing |
3,173 | 2,970 | 3,479 | |||||||
| Professional fees |
4,017 | 3,470 | 2,046 | |||||||
| Intangible amortization |
681 | 749 | 838 | |||||||
| FDIC assessment |
2,115 | 161 | 118 | |||||||
| Loss on early debt extinguishment |
— | — | 391 | |||||||
| Foreclosed real estate expenses, net |
1,503 | 645 | (62 | ) | ||||||
| Other |
4,220 | 4,847 | 4,759 | |||||||
| Total noninterest expense |
$ | 54,424 | $ | 51,006 | $ | 50,544 | ||||
Income Tax Expense
The income tax provision was $962,000 for the year ended December 31, 2009, compared with a benefit of $4.9 million in 2008 and a provision of $3.1 million for 2007. The effective tax rate for the years 2009, 2008 and 2007 was 35.0%, 37.7% and 29.7%. The effective rate in 2008 was affected by lower income levels and immaterial return-to-accrual reconciliation differences booked in 2009. The effective tax rate for the year 2007 reflects a $150,000 credit due to a settlement of a tax liability for interest and penalties related to a tax position that was resolved and a lower net state income tax effect.
55
Table of Contents
Index to Financial Statements
Results of Segment Operations
We manage the company along three operating segments: banking, wealth management and insurance. The column identified as “Other” includes the parent company and the elimination of transactions between segments. The accounting policies of the individual operating segments are the same as our accounting policies described in Note A “Summary of Significant Accounting Policies” to our consolidated financial statements included in this Form 10-K. The following table presents the results of operations and total assets for each of our operating segments as of and for the periods indicated:
| Banking | Wealth Management |
Insurance | Other | Consolidated | ||||||||||||||
| (dollars in thousands) | ||||||||||||||||||
| Years Ended December 31, |
||||||||||||||||||
| 2009 |
||||||||||||||||||
| Net interest income (expense) |
$ | 47,548 | $ | 155 | $ | 17 | $ | (1,225 | ) | $ | 46,495 | |||||||
| Provision for loan losses |
16,660 | — | — | — | 16,660 | |||||||||||||
| Noninterest income |
4,781 | 16,907 | 5,649 | — | 27,337 | |||||||||||||
| Noninterest expense |
37,901 | 12,248 | 4,275 | — | 54,424 | |||||||||||||
| Earnings (loss) before income taxes |
(2,232 | ) | 4,814 | 1,391 | (1,225 | ) | 2,748 | |||||||||||
| Income tax expense (benefit) |
(896 | ) | 1,788 | 498 | (428 | ) | 962 | |||||||||||
| Net earnings (loss) |
$ | (1,336 | ) | $ | 3,026 | $ | 893 | $ | (797 | ) | $ | 1,786 | ||||||
| Total assets as of December 31, |
$ | 1,644,083 | $ | 59,618 | $ | 7,962 | $ | (76,308 | ) | $ | 1,635,355 | |||||||
| 2008 |
||||||||||||||||||
| Net interest income (expense) |
$ | 45,340 | $ | 196 | $ | 83 | $ | (1,345 | ) | $ | 44,274 | |||||||
| Provision for loan losses |
29,175 | — | — | — | 29,175 | |||||||||||||
| Noninterest income |
(139 | ) | 17,329 | 5,760 | (5 | ) | 22,945 | |||||||||||
| Noninterest expense |
35,793 | 11,057 | 4,156 | — | 51,006 | |||||||||||||
| Earnings (loss) before income taxes |
(19,767 | ) | 6,468 | 1,687 | (1,350 | ) | (12,962 | ) | ||||||||||
| Income tax expense (benefit) |
(7,298 | ) | 2,270 | 626 | (486 | ) | (4,888 | ) | ||||||||||
| Net earnings (loss) |
$ | (12,469 | ) | $ | 4,198 | $ | 1,061 | $ | (864 | ) | $ | (8,074 | ) | |||||
| Total assets as of December 31, |
$ | 1,592,933 | $ | 47,879 | $ | 6,738 | $ | (59,706 | ) | $ | 1,587,844 | |||||||
| 2007 |
||||||||||||||||||
| Net interest income (expense) |
$ | 35,282 | $ | 321 | $ | 136 | $ | (1,564 | ) | $ | 34,175 | |||||||
| Provision for loan losses |
4,029 | — | — | — | 4,029 | |||||||||||||
| Noninterest income |
7,293 | 17,546 | 6,035 | 29 | 30,903 | |||||||||||||
| Noninterest expense |
33,959 | 12,194 | 4,000 | 391 | 50,544 | |||||||||||||
| Earnings (loss) before income taxes |
4,587 | 5,673 | 2,171 | (1,926 | ) | 10,505 | ||||||||||||
| Income tax expense (benefit) |
1,130 | 1,941 | 744 | (694 | ) | 3,121 | ||||||||||||
| Net earnings (loss) |
$ | 3,457 | $ | 3,732 | $ | 1,427 | $ | (1,232 | ) | $ | 7,384 | |||||||
| Total assets as of December 31, |
$ | 1,411,934 | $ | 46,270 | $ | 9,242 | $ | (66,249 | ) | $ | 1,401,197 | |||||||
Banking. Net loss for the year ended December 31, 2009 was $1.3 million, compared with a net loss of $12.5 million in 2008. Net interest income increased $2.2 million, or 4.9%, noninterest income increased $4.9 million, and the provision for loan losses decreased $12.5 million, while noninterest expense increased $2.1 million. Our banking segment lost $12.5 million for the year ended December 31, 2008, compared with net earnings of $3.5 million in 2007. Net interest income increased $10.1 million, or 28.5%, but was offset by a decrease in noninterest income of $7.4 million and an increase in the loan loss provision of $25.1 million.
56
Table of Contents
Index to Financial Statements
Net interest income for the year ended December 31, 2009 increased $2.2 million, or 4.9%, compared with 2008, while net interest income for 2008 increased $10.1 million, or 28.5%, compared with 2007. The increases resulted primarily from an improvement in the net interest margin in 2008 and increases in earning assets in 2009 and 2008. The net interest margin improved in 2008 as a result of a more optimal mix of earning assets and funding liabilities. See the analysis of net interest income included in the section of this Form 10-K captioned “—Net Interest Income.”
The provision for loan losses for the year ended December 31, 2009 totaled $16.7 million compared with $29.2 million in 2008 and $4.0 million in 2007. See the analysis of the provision for loan losses included in the section of this Form 10-K captioned “—Provision for Loan Losses.”
Noninterest income for the year ended December 31, 2009 increased $4.9 million compared with 2008. The increase was due primarily to higher mortgage banking income and gain on sales of securities. Noninterest income for the year ended December 31, 2008 decreased $7.4 million, compared with 2007. The decrease was due mainly to lower mortgage banking income and an investment impairment.
Noninterest expense for the year ended December 31, 2009 increased $2.1 million, or 5.9%, compared with 2008, primarily due to increased FDIC assessments. Noninterest expense for the year ended December 31, 2008 increased $1.8 million, or 5.4%, compared with 2007. The increase resulted primarily from the $737,000 provision for unfunded loan commitments and higher legal and collection related expenses.
Wealth Management. Net earnings for the year ended December 31, 2009 decreased $1.2 million, or 27.9%, compared with 2008. The decrease in earnings was due primarily to higher incentive compensation. Net earnings for the year ended December 31, 2008 increased $466,000, or 12.5%, compared with 2007. The rise in net earnings was due primarily to expense management. Assets under management were $2.7 billion as of December 31, 2009 and $2.2 billion as of December 31, 2008.
Noninterest income for the year ended December 31, 2009, decreased $422,000, or 2.4%, compared with 2008, due primarily to a decrease in average assets under management, as a result of declines in the equity market, especially in the first half of 2009. Noninterest income for the year ended December 31, 2008 decreased $217,000, or 1.2%, compared with 2007. The primary factor in the decrease was a 19.3% decline in assets under management, which resulted from sharp declines in the stock market.
Noninterest expense for year ended December 31, 2009 increased $1.2 million, or 10.8%, compared with 2008, due primarily to higher incentive compensation. Noninterest expense for the year ended December 31, 2008 decreased $1.1 million, or 9.3%, compared with 2007. The decrease was due mainly to lower incentive compensation.
Insurance. Net earnings declined for the year ended December 31, 2009 compared with 2008 due primarily to higher noninterest expense as a result of higher compensation expense. Net earnings for the year ended December 31, 2008 decreased $366,000, or 25.6%, compared with 2007 due to a soft property and casualty market, which resulted in lower revenue.
Noninterest income for the year ended December 31, 2009 was essentially flat compared with 2008. Noninterest income for the year ended December 31, 2008 decreased $275,000, or 4.6%, compared with 2007. The decrease was due primarily due to a soft property and casualty market.
Noninterest expense for the year ended December 31, 2009, increased $119,000, or 2.9%, compared with 2008 as a result of higher compensation expense. Noninterest expense for the year ended December 31, 2008 increased $156,000, or 3.9%, compared with 2007.
57
Table of Contents
Index to Financial Statements
Other. Other consists primarily of interest expense on our junior subordinated debentures, which is not allocated to the business segments. Interest expense on the floating rate portion of these borrowings reflected interest rate increases and decreases from 2007 through 2009. Interest expense on these borrowings decreased in 2009 and 2008 due to the refinancing of $15.5 million of the debentures in 2007. In connection with this refinance activity, we took a $391,000 charge for early debt extinguishment, which is reflected in noninterest expense.
Financial Condition
Total assets increased $47.5 million, or 3.0%, to $1.6 billion as of December 31, 2009, compared with December 31, 2008. Our loan portfolio decreased $140.2 million, or 11.5%, to $1.1 billion as of December 31, 2009 compared with $1.2 billion as of December 31, 2008. Our securities portfolio increased $83.1 million, or 47.6%, to $257.8 million as of December 31, 2009 compared with $174.7 million as of December 31, 2008. Shareholders’ equity increased $926,000, or 0.5%, to $186.7 million as of December 31, 2009.
Total assets increased $186.6 million, or 13.3%, to $1.6 billion as of December 31, 2008, compared with $1.4 billion as of December 31, 2007. Our loan portfolio increased $121.1 million, or 11.0%, to $1.2 billion as of December 31, 2008 compared with $1.1 billion as of December 31, 2007. Our securities portfolio increased $28.4 million, or 19.4%, to $174.7 million as of December 31, 2008 compared with $146.3 million as of December 31, 2007. Shareholders’ equity increased $28.3 million, or 17.9%, to $185.7 million as of December 31, 2008. The increase was due primarily to the $34.0 million we received in connection with our issuance of Series A Preferred Stock and the Warrant to purchase our common stock to the U.S. Treasury in connection with our participation in the CPP, which was partly offset by the net loss for the year.
Loan Portfolio
Our primary lending focus is to privately-owned businesses, professional firms, investors and affluent individuals. To these clients we make commercial, commercial real estate, real estate construction, residential real estate and consumer loans. Total commercial loans, which consists of commercial, commercial real estate and real estate construction loans, accounted for 42.8% of our portfolio as of December 31, 2009. Total consumer loans, which consist of residential real estate, home equity lines of credit, consumer installment-indirect and other consumer loans, made up 57.2% of our loan portfolio as of December 31, 2009. Total loans were $1.1 billion as of December 31, 2009, a decrease of $140.2 million, or 11.5%, compared with December 31, 2008. The reduction in the loan portfolio reflected the declining debt levels by both companies and consumers and the economic slowdown. The largest reduction was in construction loans reflecting the weak residential and commercial real estate markets. Consumer installment-indirect loans also decreased during 2009. Beginning in 2005, we stopped originating indirect automobile and boat loans. With the exception of residential mortgage or home equity lines, we do not actively seek to originate consumer loans, and most of our other consumer loans are made due to requests from clients who have a relationship with us or the potential to have a relationship. As of December 31, 2009, 2008, and 2007, loans comprised 65.9%, 76.7% and 78.3% of total assets.
Total loans were $1.2 billion as of December 31, 2008, an increase of $121.1 million, or 11.0%, compared with loans of $1.1 billion as of December 31, 2007. The majority of loan growth occurred in residential real estate second lien, which increased $106.6 million, or 54.5%, and commercial real estate, which increased $37.8 million, or 19.8%, to $228.7 million. The majority of the loan growth, and substantially all of the growth in the residential second lien portfolio, was in Texas. The growth in the residential real estate portfolio was due primarily to management’s decision in the third quarter of 2007 to retain second mortgages in the loan portfolio rather than sell them. These loans are generally prime or near prime, secured by property located in Texas. This increase was partially offset by a $29.4 million, or 10.8%, decrease in residential first mortgage loans, due primarily to the continued run off in our purchased first mortgage portfolio. Consumer installment-indirect loans also decreased during 2008.
58
Table of Contents
Index to Financial Statements
The following tables summarize our loan portfolio by type of loan as of the dates indicated:
| December 31, | ||||||||||||
| 2009 | 2008 | |||||||||||
| Amount | Percent | Amount | Percent | |||||||||
| (dollars in thousands) | ||||||||||||
| Commercial: |
||||||||||||
| Commercial |
$ | 115,431 | 10.7 | % | $ | 135,534 | 11.1 | % | ||||
| Commercial real estate (1) |
259,480 | 24.0 | 228,732 | 18.8 | ||||||||
| Real estate construction (1) |
87,008 | 8.1 | 178,845 | 14.7 | ||||||||
| Total commercial |
461,919 | 42.8 | 543,111 | 44.6 | ||||||||
| Consumer: |
||||||||||||
| Residential real estate first lien (2) |
222,337 | 20.6 | 241,969 | 19.8 | ||||||||
| Residential real estate second lien (2) |
291,433 | 27.0 | 302,141 | 24.8 | ||||||||
| Home equity lines |
74,356 | 6.9 | 82,555 | 6.8 | ||||||||
| Consumer installment—indirect |
8,372 | 0.8 | 14,409 | 1.2 | ||||||||
| Consumer other |
19,788 | 1.9 | 34,219 | 2.8 | ||||||||
| Total consumer |
616,286 | 57.2 | 675,293 | 55.4 | ||||||||
| Total loans receivable |
$ | 1,078,205 | 100.0 | % | $ | 1,218,404 | 100.0 | % | ||||
| (1) | As of December 31, 2009, land loans were reclassified from commercial real estate to real estate construction for all periods. |
| (2) | Includes $88.7 million and $105.6 million of purchased loans as of December 31, 2009 and 2008. |
| December 31, | ||||||||||||||||||
| 2007 | 2006 | 2005 | ||||||||||||||||
| Amount | Percent | Amount | Percent | Amount | Percent | |||||||||||||
| (dollars in thousands) | ||||||||||||||||||
| Commercial: |
||||||||||||||||||
| Commercial |
$ | 127,583 | 11.6 | % | $ | 113,526 | 12.5 | % | $ | 98,712 | 12.2 | % | ||||||
| Commercial real estate (1) |
190,904 | 17.4 | 134,080 | 14.8 | 102,754 | 12.7 | ||||||||||||
| Real estate construction (1) |
187,118 | 17.1 | 178,318 | 19.6 | 98,221 | 12.2 | ||||||||||||
| Total commercial |
505,605 | 46.1 | 425,924 | 46.9 | 299,687 | 37.1 | ||||||||||||
| Consumer: |
||||||||||||||||||
| Residential real estate first lien (2) |
271,346 | 24.7 | 290,866 | 32.0 | 314,083 | 38.8 | ||||||||||||
| Residential real estate second lien (2) |
195,583 | 17.8 | 45,211 | 5.0 | 18,356 | 2.3 | ||||||||||||
| Home equity lines |
79,023 | 7.2 | 78,158 | 8.6 | 69,092 | 8.6 | ||||||||||||
| Consumer installment—indirect |
25,262 | 2.3 | 44,360 | 4.9 | 74,314 | 9.2 | ||||||||||||
| Consumer other |
20,449 | 1.9 | 23,849 | 2.6 | 32,672 | 4.0 | ||||||||||||
| Total consumer |
591,663 | 53.9 | 482,444 | 53.1 | 508,517 | 62.9 | ||||||||||||
| Total loans receivable |
$ | 1,097,268 | 100.0 | % | $ | 908,368 | 100.0 | % | $ | 808,204 | 100.0 | % | ||||||
| (1) | As of December 31, 2009, land loans were reclassified from commercial real estate to real estate construction for all periods. |
| (2) | Includes $142.5 million, $152.6 million and $189.1 million of purchased loans as of December 31, 2007, 2006 and 2005. |
59
Table of Contents
Index to Financial Statements
The contractual maturity ranges of our commercial and consumer loan portfolios and the amount of such loans with predetermined and adjustable interest rates in each maturity range as of dates indicated are summarized in the following table:
| December 31, 2009 | ||||||||||||
| One Year or Less |
After One Through Five Years |
After Five Years |
Total | |||||||||
| (dollars in thousands) | ||||||||||||
| Commercial: |
||||||||||||
| Commercial |
$ | 65,664 | $ | 47,394 | $ | 2,373 | $ | 115,431 | ||||
| Commercial real estate |
55,389 | 176,587 | 27,504 | 259,480 | ||||||||
| Real estate construction |
50,086 | 26,247 | 10,675 | 87,008 | ||||||||
| Total commercial |
171,139 | 250,228 | 40,552 | 461,919 | ||||||||
| Consumer: |
||||||||||||
| Residential real estate first lien |
18,235 | 14,438 | 189,664 | 222,337 | ||||||||
| Residential real estate second lien |
1,016 | 2,757 | 287,660 | 291,433 | ||||||||
| Home equity lines |
626 | 381 | 73,349 | 74,356 | ||||||||
| Consumer installment—indirect |
720 | 4,287 | 3,365 | 8,372 | ||||||||
| Consumer other |
16,844 | 2,921 | 23 | 19,788 | ||||||||
| Total consumer |
37,441 | 24,784 | 554,061 | 616,286 | ||||||||
| Total loans receivable |
$ | 208,580 | $ | 275,012 | $ | 594,613 | $ | 1,078,205 | ||||
| Loans with a predetermined interest rate |
$ | 72,205 | $ | 168,231 | $ | 336,081 | $ | 576,517 | ||||
| Loans with an adjustable interest rate |
136,375 | 106,781 | 258,532 | 501,688 | ||||||||
| Total loans receivable |
$ | 208,580 | $ | 275,012 | $ | 594,613 | $ | 1,078,205 | ||||
As of December 31, 2009, 53.5% of our total loan portfolio carried fixed interest rates and 46.5% of our loan portfolio had adjustable interest rates. Scheduled contractual principal repayments do not reflect the actual payments of loans. The average maturity of our loans is substantially less than their average contractual term because of prepayments. The average life of mortgage loans tends to increase when the current mortgage loan rates are substantially higher than rates on existing mortgage loans and, conversely, to decrease when current mortgage loan rates are substantially lower than rates on existing mortgages due primarily to refinancing of adjustable rate and fixed rate loans at lower rates.
Real Estate Loan Portfolio Concentrations
Loan concentrations may exist when there are borrowers engaged in similar activities or types of loans extended to a diverse group of borrowers that could cause those borrowers or loans to be similarly impacted by economic or other conditions. We have a geographic concentration in our residential real estate and home equity lines portfolio in Texas, Florida, Colorado and California.
60
Table of Contents
Index to Financial Statements
As of December 31, 2009, the geographic concentrations of residential mortgage and home equity lines of credit by state were as follows:
| December 31, 2009 | |||||||||||||||
| Residential Mortgage First Lien (2) |
Residential Mortgage Second Lien (2) |
Home Equity Lines |
Total | Percent of Total Loans |
|||||||||||
| (dollars in thousands) | |||||||||||||||
| Texas |
$ | 126,413 | $ | 270,009 | $ | 30,243 | $ | 426,665 | 39.5 | % | |||||
| Florida |
40,434 | 2,402 | 10,925 | 53,761 | 5.0 | ||||||||||
| Colorado |
8,410 | 6,193 | 28,849 | 43,452 | 4.0 | ||||||||||
| California |
14,699 | 2,107 | 2,373 | 19,179 | 1.8 | ||||||||||
| Other (1) |
32,381 | 10,722 | 1,966 | 45,069 | 4.2 | ||||||||||
| Total |
$ | 222,337 | $ | 291,433 | $ | 74,356 | $ | 588,126 | 54.5 | % | |||||
| (1) | Loans in any other individual state do not exceed 1.0% of total loans. |
| (2) | Includes $88.7 million of purchased loans with $15.3 million located in Texas, $26.1 million in Florida, $4.1 million in Colorado and $13.1 million in California. |
Changes in real estate values and underlying economic or market conditions for these areas are monitored regularly. Subprime loans, defined as loans in which the borrower has a FICO score of less than 620 at origination, amounted to $16.4 million at December 31, 2009. As of December 31, 2009, approximately 12.0% of our total loans consisted of residential real estate loans and home equity lines of credit that include an interest only feature as a part of the loan terms. All of these loans are considered to be prime or near prime.
We originate commercial real estate and real estate construction loans primarily to clients in our market areas in Texas and southwest Florida, and a significant portion of the property collateralizing our commercial real estate and real estate construction loans is located in these areas. Approximately 23.2% of commercial real estate loans and real estate construction loans are loans to owner occupants. In certain circumstances, these loans may be collateralized by property outside of Texas or Florida.
The following tables set forth, as of December 31, 2009, our commercial real estate loans and real estate construction loans based on the state where the property is located and based on the type of property collateralizing such loans:
| December 31, 2009 | ||||||||||||
| Commercial Real Estate |
Real Estate Construction |
Total | Percent of Total Loans |
|||||||||
| (dollars in thousands) | ||||||||||||
| Texas |
$ | 137,047 | $ | 53,484 | $ | 190,531 | 17.7 | % | ||||
| Florida |
116,468 | 33,465 | 149,933 | 13.9 | ||||||||
| Other (1) |
5,965 | 59 | 6,024 | 0.5 | ||||||||
| Total |
$ | 259,480 | $ | 87,008 | $ | 346,488 | 32.1 | % | ||||
| (1) | Loans in any other individual state do not exceed 0.5% of total loans. |
61
Table of Contents
Index to Financial Statements
| December 31, 2009 | ||||||||||||
| Commercial Real Estate |
Real Estate Construction |
Total | Percent of Total Loans |
|||||||||
| (dollars in thousands) | ||||||||||||
| 1-4 family structures |
$ | — | $ | 13,095 | $ | 13,095 | 1.2 | % | ||||
| Retail |
97,689 | 3,455 | 101,144 | 9.4 | ||||||||
| Office building |
72,936 | 734 | 73,670 | 6.8 | ||||||||
| Land |
2,186 | 40,610 | 42,796 | 4.0 | ||||||||
| Industrial and warehouse |
50,241 | 570 | 50,811 | 4.7 | ||||||||
| 1-4 family land |
— | 26,077 | 26,077 | 2.4 | ||||||||
| Multi-family |
8,654 | 2,467 | 11,121 | 1.0 | ||||||||
| Other |
27,774 | — | 27,774 | 2.6 | ||||||||
| Total |
$ | 259,480 | $ | 87,008 | $ | 346,488 | 32.1 | % | ||||
Asset Quality
We have several procedures in place to assist in maintaining the overall quality of our loan portfolio. We have established underwriting guidelines to be followed by our management and delinquency levels are monitored by Encore Bank’s asset classification committee and reviewed by Encore Bank’s board of directors for any negative or adverse trends. There can be no assurance, however, that our loan portfolio will not become subject to increasing pressures from deteriorating borrower credit due to general economic conditions.
Trends in delinquency ratios represent an indicator, among other considerations, of credit risk within the loan portfolio. The entire balance of an account is considered delinquent if the minimum payment contractually required to be made is not received by the specified date. Loans 90 days past due, the majority of which are on nonaccrual status and classified as nonperforming loans, totaled $37.5 million as of December 31, 2009, compared with $31.2 million as of December 31, 2008 and $13.4 million as of December 31, 2007. The ratio of nonperforming loans and loans 90 days past due and still accruing to total loans was 3.48% as of December 31, 2009, compared with 2.56% as of December 31, 2008 and 1.22% as of December 31, 2007.
We generally place a loan on nonaccrual status and cease to accrue interest when the loan becomes 90 days past due or when loan payment performance is deemed uncertain, and typically charge off loans no later than 120 days past due, unless the loan is both well secured and in the process of collection. Cash payments received while a loan is classified as nonaccrual are recorded as a reduction of principal as long as doubt exists as to collection. If interest on nonaccrual loans as of December 31, 2009 had been accrued under the original loan terms, approximately $3.0 million would have been recorded as income during 2009, compared with interest payments of $1.6 million actually recorded during 2009. We sometimes revise the interest rate or repayment terms resulting in a troubled debt restructuring. As of December 31, 2009, all troubled debt restructurings are included in nonperforming assets unless interest is still being accrued.
We generally obtain updated appraisals on collateral secured loans categorized as nonperforming loans and potential problem loans on an annual basis. In instances where updated appraisals reflect reduced collateral values, an evaluation of the borrower’s overall financial condition is made to determine the need, if any, for possible write downs or appropriate additions to the allowance for loan losses. We record real estate acquired through foreclosure at fair value at the time of acquisition, less estimated costs to sell the property, establishing a new cost basis.
62
Table of Contents
Index to Financial Statements
The following table presents information regarding nonperforming assets as of the dates indicated:
| December 31, | ||||||||||||||||||||
| 2009 | 2008 | 2007 | 2006 | 2005 | ||||||||||||||||
| (dollars in thousands) | ||||||||||||||||||||
| Nonaccrual loans (1) |
$ | 35,988 | $ | 30,531 | $ | 11,208 | $ | 9,411 | $ | 3,064 | ||||||||||
| Investment in real estate |
14,639 | 2,781 | 835 | 235 | 1,084 | |||||||||||||||
| Total nonperforming assets |
$ | 50,627 | $ | 33,312 | $ | 12,043 | $ | 9,646 | $ | 4,148 | ||||||||||
| Accruing loans past due 90 days or more (2) |
$ | 1,489 | $ | 646 | $ | 2,183 | $ | 96 | $ | 420 | ||||||||||
| Restructured loans still accruing |
$ | 530 | $ | — | $ | — | $ | — | $ | — | ||||||||||
| Nonperforming assets to total loans and investment in real estate (2) |
4.63 | % | 2.73 | % | 1.10 | % | 1.06 | % | 0.51 | % | ||||||||||
| (1) | Nonaccrual troubled debt restructurings are included in nonaccrual loans. |
| (2) | As of December 31, 2009, accruing loans past due 90 days or more were reclassified from nonperforming loans to a separate category for all periods. |
Nonperforming assets were $50.6 million, $33.3 million and $12.0 million as of December 31, 2009, 2008 and 2007. Our ratio of nonperforming assets to total loans and investment in real estate was 4.63% and 2.73% as of December 31, 2009 and 2008. Nonperforming loans were $36.0 million, $30.5 million and $11.2 million as of December 31, 2009, 2008 and 2007. A significant portion of nonperforming loans at these dates were commercial loans, which includes commercial, commercial real estate and real estate construction. However, the majority of the increase in nonperforming loans from December 31, 2008 to December 31, 2009 was due to residential first lien mortgage loans. Residential first lien mortgage loans are adjusted to the fair value of collateral after 180 days past due.
Commercial nonperforming loans aggregated $27.7 million as of December 31, 2009 compared with $26.1 million as of December 31, 2008. The following is a summary of the significant relationships:
Commercial Real Estate
| • | $7.9 million loan for a retail center and marina in Florida. |
| • | $1.5 million loan for a large commercial lot in Florida, partially occupied by retail business. |
| • | $1.2 million loan for office warehouses in Florida. |
| • | $1.0 million loan for office warehouses in Florida. |
Real Estate Construction
| • | $4.0 million loan to a professional for a single family residential construction loan in Houston to be occupied by the owners as their primary residence. |
| • | $3.2 million loan to a developer for a commercial real estate loan secured by residential lots and wet boat slips in Florida. |
| • | $2.4 million loan for vacant land in Florida. |
Commercial nonperforming loans were $26.1 million as of December 31, 2008. Significant relationships at that time included two loans to professionals in Houston totaling $4.0 million, which have since been resolved; a $4.8 million single family construction loan to a professional in Houston, which has been restructured, but is still classified as nonperforming; a $4.0 million land loan in Florida that is still classified as nonperforming; and a $3.0 million land loan in Florida that has been resolved.
63
Table of Contents
Index to Financial Statements
Loans 90 days past due or more and still accruing were $530,000 at December 31, 2009, compared with $0 at December 31, 2008.
Investment in real estate was $14.6 million at December 31, 2009 compared with $2.8 million at December 31, 2008, an $11.9 million increase due to a combination of a $3.6 million parcel of real estate acquired in settlement of a loan and repossession of commercial real estate property in Florida and residential real estate in Houston. As of December 31, 2009, 2008, 2007 and 2006, investment in real estate was comprised primarily of real estate acquired in settlement of loans. As of December 31, 2005, investment in real estate was comprised primarily of branch locations that were purchased but not used and decreased as the result of sales of these locations.
The following table presents information regarding nonperforming loans and the associated specific reserves within the allowance for loan losses for each loan category:
| December 31, 2009 | December 31, 2008 (1) | |||||||||||
| Outstanding Balance |
Specific Allocation of Allowance |
Outstanding Balance |
Specific Allocation of Allowance | |||||||||
| Commercial: |
||||||||||||
| Commercial |
$ | 1,829 | $ | 1,147 | $ | 5,544 | $ | 4,267 | ||||
| Commercial real estate (1) |
13,129 | 4,694 | 1,827 | 284 | ||||||||
| Real estate construction (1) |
12,773 | 142 | 18,768 | 2,737 | ||||||||
| Total commercial |
27,731 | 5,983 | 26,139 | 7,288 | ||||||||
| Consumer: |
||||||||||||
| Residential real estate first lien (2) |
7,466 | 281 | 3,601 | — | ||||||||
| Residential real estate second lien and home equity lines |
791 | — | 730 | — | ||||||||
| Consumer |
— | — | 61 | — | ||||||||
| Total consumer |
8,257 | 281 | 4,392 | — | ||||||||
| Total nonperforming loans |
$ | 35,988 | $ | 6,264 | $ | 30,531 | $ | 7,288 | ||||
| (1) | As of December 31, 2009, accruing loans past due 90 days or more were reclassified from nonperforming loans to a separate category and land loans were reclassified from commercial real estate to real estate construction for all periods. |
| (2) | Written down to fair value of collateral after becoming 180 days past due. |
The decrease in nonperforming commercial loans was primarily attributable to the payoff of a $3.0 million loan to a law firm and the resolution of several private banking loans in Houston. This decrease was more than offset by the addition of several commercial real estate loans in Florida. Nonaccrual construction loans decreased primarily due to the resolution of a commercial construction loan in Florida. The increase in residential real estate first lien nonaccrual loans was due primarily to residential loans in Florida which were purchased to meet our CRA requirements.
As discussed under “—Allowance for Loan Losses”, when management’s measured value of an impaired loan is less than the recorded investment in the loan, the amount of the impairment is recorded as a specific reserve. The specific reserves are determined on an individual loan basis based on our current evaluation of loss exposure for each credit, given the payment status, financial condition of the borrower and value of any underlying collateral. The amount of specific reserves can change from period to period as a result of changes in the circumstances of individual loans such as charge-offs, pay-offs, changes in collateral values or other factors. Notwithstanding the specific allocations of the allowance for loan losses, the total allowance is available to absorb losses from any segment of loans.
64
Table of Contents
Index to Financial Statements
We follow a loan review program designed to evaluate the credit risk in our loan portfolio. Through this loan review process, we maintain an internally classified watch list which helps management assess the overall quality of the loan portfolio and the adequacy of the allowance for loan losses. Loans included on the watch list that are not otherwise classified show warning elements where the present status portrays one or more deficiencies that require attention in the short term or where pertinent ratios of the loan account have weakened to a point where more frequent monitoring is warranted. These loans do not have all of the characteristics of a classified loan (substandard or doubtful) but do show weakened elements compared with those of a satisfactory credit.
In establishing the appropriate classification for specific assets, we consider, among other factors, the estimated value of the underlying collateral, the borrower’s ability to repay, the borrower’s repayment history and the current delinquent status. As a result of this process, loans are classified as substandard, doubtful or loss.
Loans classified as “substandard” are those loans with clear and defined weaknesses such as a highly leveraged position, unfavorable financial ratios, uncertain repayment sources or poor financial condition which may jeopardize the repayment of the debt as contractually agreed. They are characterized by the distinct possibility that we will sustain some losses if the deficiencies are not corrected. Loans classified as “doubtful” are those loans which have characteristics similar to substandard loans but with an increased risk that collection or liquidation in full is highly questionable and improbable. Loans classified as “loss” are those loans that are in the process of being charged off. Once a loan is deemed uncollectible as contractually agreed, the loan is charged off either partially or in full against the allowance for loan losses.
As of December 31, 2009, we had $112.0 million of loans classified as substandard, $373,000 classified as doubtful and none classified as loss. As of December 31, 2009, we had specific allocations of $10.1 million in the allowance for loan losses related to these classified loans. As of December 31, 2008, we had $79.3 million of loans classified as substandard, $715,000 classified as doubtful and none classified as loss. As of December 31, 2008, we had specific allocations of $9.5 million in the allowance for loan losses related to these classified loans. The increase in classified loans was due primarily to the weak economy and a deterioration of collateral values, particularly in Florida.
Allowance for Loan Losses
Our allowance for loan losses is a reserve established through charges to earnings in the form of a provision for loan losses. The allowance for loan losses is maintained at a level which we believe is adequate to absorb all estimated losses incurred in the loan portfolio through the balance sheet date. The amount of the allowance is affected by loan charge-offs, which decrease the allowance; recoveries on loans previously charged-off, which increase the allowance; and the provision for loan losses charged to earnings, which increases the allowance. In determining the provision for loan losses, we monitor fluctuations in the allowance resulting from actual charge-offs and recoveries and periodically review the size and composition of the loan portfolio in light of economic conditions. If actual losses exceed the amount of the allowance for loan losses, our results of operations could be adversely affected.
The allowance for loan losses represents our estimate of the amount necessary to provide for estimated losses incurred in the loan portfolio through the balance sheet date. Due to the uncertainty of risks in the loan portfolio, our judgment of the amount of the allowance necessary to absorb loan losses is approximate. The allowance for loan losses is also subject to regulatory examinations and determination by the regulatory agencies as to its adequacy in comparison with peer institutions.
The allowance for loan losses is comprised of two components: specific reserves and general reserves. Generally, all loans that have been identified as impaired are reviewed on a quarterly basis in order to determine whether a specific reserve is required. A loan is considered impaired when, based on current information, it is
65
Table of Contents
Index to Financial Statements
probable that we will not receive all amounts due in accordance with the contractual terms of the loan agreement. Once a loan has been identified as impaired, we measure impairment in accordance with FASB ASC 310-10, Receivables. The measurement of impaired loans is based on the present value of expected future cash flows discounted at the loan’s effective interest rate or the loan’s observable market price, or based on the fair value of the collateral if the loan is collateral-dependent. When management’s measured value of the impaired loan is less than the recorded investment in the loan, the amount of the impairment is recorded as a specific reserve. These specific reserves are determined on an individual loan basis based on our current evaluation of our loss exposure for each credit, given the payment status, financial condition of the borrower and value of any underlying collateral. Loans for which specific reserves are provided are excluded from the general reserve described below. Changes in specific reserves from period to period are the result of changes in the circumstances of individual loans such as charge-offs, pay-offs, changes in collateral values or other factors.
We also maintain a general reserve for each loan type in the loan portfolio. In determining the amount of the general reserve portion of our allowance for loan losses, we consider factors such as our historical loan loss experience, the experience, ability and effectiveness of our lending management and staff, the effectiveness of our loan policies, procedures and internal controls, strategic initiatives, the composition and concentrations of credit, changes in underlying collateral values, nonperforming and loan classification trends, the effectiveness of the internal loan review function and general economic conditions. Based on these factors, we apply estimated percentages to the various categories of loans, not including any loan that has a specific reserve allocated to it, based on our historical experience, portfolio trends and economic and industry trends. We use this information to estimate the general reserve portion of the allowance for loan losses at a level that reflects our estimate of incurred losses.
Based on an evaluation of the loan portfolio, we present a quarterly review of the allowance for loan losses to Encore Bank’s asset classification committee and our board of directors, indicating any change in the allowance for loan losses since the last review and any recommendations as to adjustments in the allowance for loan losses. This evaluation is inherently subjective as it requires estimates that are susceptible to significant revision as more information becomes available or as events change. The allowance for loan losses was $26.5 million, or 2.46% of total loans, as of December 31, 2009 compared with $25.1 million, or 2.06% of total loans as of December 31, 2008 and $11.2 million, or 1.02% of total loans as of December 31, 2007. These changes primarily reflect estimated losses incurred in the loan portfolio primarily as a result of the recessionary economic environment, weakness in our Florida market, higher net charge-offs and other qualitative factors.
66
Table of Contents
Index to Financial Statements
The following table summarizes the activity in our allowance for loan losses as of and for the periods indicated:
| As of and for the Years Ended December 31, | ||||||||||||||||||||
| 2009 | 2008 | 2007 | 2006 | 2005 | ||||||||||||||||
| (dollars in thousands) | ||||||||||||||||||||
| Average loans outstanding |
$ | 1,145,522 | $ | 1,170,717 | $ | 972,760 | $ | 840,330 | $ | 747,079 | ||||||||||
| Total loans outstanding at end of year |
$ | 1,078,205 | $ | 1,218,404 | $ | 1,097,268 | $ | 908,368 | $ | 808,204 | ||||||||||
| Allowance for loan losses at beginning of year |
$ | 25,105 | $ | 11,161 | $ | 9,056 | $ | 8,719 | $ | 7,658 | ||||||||||
| Charge-offs: |
||||||||||||||||||||
| Commercial: |
||||||||||||||||||||
| Commercial |
(2,833 | ) | (8,601 | ) | (62 | ) | (1,488 | ) | — | |||||||||||
| Commercial real estate (1) |
(1,175 | ) | (629 | ) | — | — | — | |||||||||||||
| Real estate construction (1) |
(6,780 | ) | (1,728 | ) | (79 | ) | — | — | ||||||||||||
| Total commercial |
(10,788 | ) | (10,958 | ) | (141 | ) | (1,488 | ) | — | |||||||||||
| Consumer: |
||||||||||||||||||||
| Residential real estate first lien |
(2,767 | ) | (634 | ) | (191 | ) | (97 | ) | (63 | ) | ||||||||||
| Residential real estate second lien |
(2,543 | ) | (1,323 | ) | (759 | ) | (113 | ) | (263 | ) | ||||||||||
| Home equity lines |
(1,820 | ) | (1,813 | ) | (334 | ) | (236 | ) | (12 | ) | ||||||||||
| Consumer installment—indirect |
(656 | ) | (1,016 | ) | (962 | ) | (1,362 | ) | (1,491 | ) | ||||||||||
| Consumer other |
(78 | ) | (80 | ) | (226 | ) | (558 | ) | (701 | ) | ||||||||||
| Total consumer |
(7,864 | ) | (4,866 | ) | (2,472 | ) | (2,366 | ) | (2,530 | ) | ||||||||||
| Total charge-offs |
(18,652 | ) | (15,824 | ) | (2,613 | ) | (3,854 | ) | (2,530 | ) | ||||||||||
| Recoveries: |
||||||||||||||||||||
| Commercial: |
||||||||||||||||||||
| Commercial |
2,917 | 139 | 46 | — | — | |||||||||||||||
| Commercial real estate (1) |
— | 6 | — | — | — | |||||||||||||||
| Real estate construction (1) |
6 | — | — | — | — | |||||||||||||||
| Total commercial |
2,923 | 145 | 46 | — | — | |||||||||||||||
| Consumer: |
||||||||||||||||||||
| Residential real estate first lien |
110 | 41 | 34 | 79 | 39 | |||||||||||||||
| Residential real estate second lien |
70 | 130 | 178 | 108 | 59 | |||||||||||||||
| Home equity lines |
131 | 9 | 43 | 1 | 1 | |||||||||||||||
| Consumer installment—indirect |
152 | 139 | 294 | 405 | 147 | |||||||||||||||
| Consumer other |
2 | 129 | 94 | 107 | 147 | |||||||||||||||
| Total consumer |
465 | 448 | 643 | 700 | 393 | |||||||||||||||
| Total recoveries |
3,388 | 593 | 689 | 700 | 393 | |||||||||||||||
| Net charge-offs |
(15,264 | ) | (15,231 | ) | (1,924 | ) | (3,154 | ) | (2,137 | ) | ||||||||||
| Provision for loan losses |
16,660 | 29,175 | 4,029 | 3,491 | 3,198 | |||||||||||||||
| Allowance for loan losses at end of year |
$ | 26,501 | $ | 25,105 | $ | 11,161 | $ | 9,056 | $ | 8,719 | ||||||||||
| Ratio of net charge-offs to average loans |
1.33 | % | 1.30 | % | 0.20 | % | 0.38 | % | 0.29 | % | ||||||||||
| Ratio of allowance for loan losses to year end loans |
2.46 | % | 2.06 | % | 1.02 | % | 1.00 | % | 1.08 | % | ||||||||||
| Ratio of allowance for loan losses to nonperforming loans (2) |
73.64 | % | 82.23 | % | 99.58 | % | 96.23 | % | 284.56 | % | ||||||||||
| (1) | As of December 31, 2009, land loans were reclassified from commercial real estate to real estate construction for all periods. |
| (2) | As of December 31, 2009, accruing loans past due 90 days or more were reclassified from nonperforming loans to a separate category for all periods. |
67
Table of Contents
Index to Financial Statements
Net charge-offs for 2009 were $15.3 million, or 1.33% of average total loans, compared with $15.2 million, or 1.30% of average total loans in 2008. Commercial charge-offs declined significantly, but this decrease was largely offset by increased charge-offs in commercial real estate and construction loans. Contributing to the rise in charge-offs was an increase in first mortgage residential loan charge-offs, which consisted mostly of loans in Florida that were purchased to comply with certain regulatory requirements. We also experienced an increase in second mortgage residential loan charge-offs, which resulted from the deteriorating economy and higher unemployment. Second mortgage net charge-offs increased from 0.46% of average second mortgage loans in 2008 to 0.84% of average second mortgage loans in 2009.
Commercial charge-offs consisted mainly of several loans to professionals or entrepreneurs. These charge-offs were offset by several recoveries, the most significant of which was a $2.0 million partial recovery of a private banking loan that was charged-off in 2008. Commercial real estate charge-offs consisted mainly of loans in Florida. Construction charge-offs consisted of a combination of a $2.2 million commercial construction loan in Florida, two land loans in Florida totaling $1.6 million as well as a residential construction loan in Houston.
Commercial charge-offs in 2008 include a $6.0 million charge-off for a loan to a professional and a $2.1 million partial charge-off of a $6.3 million loan to a Houston law firm. Commercial real estate charge-offs included several loans, primarily in Florida. Real estate construction charge-offs consisted of multiple small loans primarily related to residential construction in Houston. The residential real estate first lien charge-offs were primarily related to our purchased loan portfolio. The residential real estate second lien charge-offs grew at approximately the same rate as our loan portfolio. The growth in charge-offs in the home equity line of credit portfolio was primarily related to loans in California and Florida. However, as of January 2008 we no longer originated home equity lines of credit in California.
For the years 2005 to 2007, many of our charge-offs were related to consumer installment-indirect loans, a line of business that we discontinued in 2005, although we will continue to hold these types of loans until they are repaid. The higher level of charge-offs is reflected in the pricing of these loans. We began originating commercial loans in 2002, and until 2006, we did not have any charge-offs of such loans. The $1.5 million commercial loan charge-off in 2006 was related to one loan to a law firm in Houston.
68
Table of Contents
Index to Financial Statements
Allocated Allowance for Loan Losses. The following tables describe the allocation of the allowance for loan losses among various categories of loans and certain other information for the dates indicated. The allocation is made for analytical purposes and is not necessarily indicative of the categories in which future losses may occur. The total allowance is available to absorb losses from any segment of loans. The change from 2008 to 2009 reflects the deteriorating economy which has resulted in increased risk in commercial real estate and first and second mortgages.
| December 31, | ||||||||||||
| 2009 | 2008 | |||||||||||
| Amount | Percent of Loans to Total Loans |
Amount | Percent of Loans to Total Loans |
|||||||||
| (dollars in thousands) | ||||||||||||
| Commercial: |
||||||||||||
| Commercial |
$ | 4,514 | 10.7 | % | $ | 8,652 | 11.1 | % | ||||
| Commercial real estate (1) |
10,580 | 24.0 | 4,687 | 18.8 | ||||||||
| Real estate construction (1) |
2,777 | 8.1 | 5,955 | 14.7 | ||||||||
| Total commercial |
17,871 | 42.8 | 19,294 | 44.6 | ||||||||
| Consumer: |
||||||||||||
| Residential real estate first lien |
3,061 | 20.6 | 1,397 | 19.8 | ||||||||
| Residential real estate second lien |
3,673 | 27.0 | 2,757 | 24.8 | ||||||||
| Home equity lines |
1,577 | 6.9 | 1,153 | 6.8 | ||||||||
| Consumer installment—indirect |
266 | 0.8 | 318 | 1.2 | ||||||||
| Consumer other |
53 | 1.9 | 186 | 2.8 | ||||||||
| Total consumer |
8,630 | 57.2 | 5,811 | 55.4 | ||||||||
| Unallocated |
— | — | — | — | ||||||||
| Total allowance for loan losses |
$ | 26,501 | 100.0 | % | $ | 25,105 | 100.0 | % | ||||
| December 31, | ||||||||||||||||||
| 2007 | 2006 | 2005 | ||||||||||||||||
| Amount | Percent of Loans to Total Loans |
Amount | Percent of Loans to Total Loans |
Amount | Percent of Loans to Total Loans |
|||||||||||||
| (dollars in thousands) | ||||||||||||||||||
| Commercial: |
||||||||||||||||||
| Commercial |
$ | 4,107 | 11.6 | % | $ | 6,486 | 12.5 | % | $ | 4,588 | 12.2 | % | ||||||
| Commercial real estate (1) |
2,099 | 17.4 | 180 | 14.8 | 991 | 12.7 | ||||||||||||
| Real estate construction (1) |
2,181 | 17.1 | 500 | 19.6 | 617 | 12.2 | ||||||||||||
| Total commercial |
8,387 | 46.1 | 7,166 | 46.9 | 6,196 | 37.1 | ||||||||||||
| Consumer: |
||||||||||||||||||
| Residential real estate first lien |
1,086 | 24.7 | 176 | 32.0 | 467 | 38.8 | ||||||||||||
| Residential real estate second lien |
782 | 17.8 | 74 | 5.0 | 27 | 2.3 | ||||||||||||
| Home equity lines |
308 | 7.2 | 104 | 8.6 | 86 | 8.6 | ||||||||||||
| Consumer installment—indirect |
404 | 2.3 | 864 | 4.9 | 1,399 | 9.2 | ||||||||||||
| Consumer other |
194 | 1.9 | 463 | 2.6 | 544 | 4.0 | ||||||||||||
| Total consumer |
2,774 | 53.9 | 1,681 | 53.1 | 2,523 | 62.9 | ||||||||||||
| Unallocated |
— | — | 209 | — | — | — | ||||||||||||
| Total allowance for loan losses |
$ | 11,161 | 100.0 | % | $ | 9,056 | 100.0 | % | $ | 8,719 | 100.0 | % | ||||||
| (1) | As of December 31, 2009, land loans were reclassified from commercial real estate to real estate construction for all periods. |
69
Table of Contents
Index to Financial Statements
We believe that the allowance for loan losses as of December 31, 2009 is adequate to cover estimated losses incurred in the portfolio as of that date. The estimate of losses represented by the allowance is subject to change as more information becomes known. Future losses, which could vary greatly in amount, will be recognized through future loan loss provisions in the period in which such losses are determined.
Investment Securities
Securities within the securities portfolio are classified as held-to-maturity, available-for-sale or trading based on the intent and objective of the investment and the ability to hold to maturity. As of December 31, 2009, we had no securities classified as trading. Fair values of securities are based on quoted market prices where available. If quoted market prices are not available, estimated fair values are based on quoted market prices of comparable securities or are measured using independent pricing models or other model-based valuation techniques such as the present value of future cash flows.
Securities available-for-sale are carried at fair value with unrealized holding gains and losses, other than credit impairment, reported as a separate component of shareholders’ equity called other comprehensive income. Securities that are held as available-for-sale are used as a part of our asset/liability management strategy. Securities may be sold in response to interest rate changes, changes in prepayment risk or changes to underlying bank funding. Available-for-sale securities were $140.7 million as of December 31, 2009 compared with $78.8 million as of December 31, 2008 and $12.2 million as of December 31, 2007. The increase was primarily due to increased deposits and a decrease in loan originations. As of December 31, 2009, $46.1 million, or 32.8%, of the available-for-sale securities were invested in mortgage-backed securities, compared with $72.6 million, or 92.1%, as of December 31, 2008.
Securities held-to-maturity are carried at amortized historical cost. Securities that we have the intent and ability to hold until maturity are classified as held-to-maturity. Held-to-maturity securities increased to $117.2 million as of December 31, 2009 compared with $95.9 million as of December 31, 2008 and $134.1 million as of December 31, 2007, due primarily to purchases of U.S. Government, corporate and municipal bonds in 2009. Held-to-maturity securities balances declined from 2007 to 2008 through normal pay down of the mortgage backed securities.
The following tables summarize the amortized cost of securities classified as available-for-sale and held-to-maturity and their approximate fair values as of the dates shown:
| December 31, 2009 | |||||||||||||
| Amortized Cost |
Gross Unrealized Gains |
Gross Unrealized Losses |
Fair Value | ||||||||||
| (dollars in thousands) | |||||||||||||
| December 31, 2009 |
|||||||||||||
| Available-for-sale: |
|||||||||||||
| U.S. Government securities |
$ | 87,258 | $ | 117 | $ | (554 | ) | $ | 86,821 | ||||
| Securities of U.S. states and political subdivisions |
646 | — | (31 | ) | 615 | ||||||||
| Mortgage-backed securities |
45,275 | 926 | (64 | ) | 46,137 | ||||||||
| Other securities |
4,410 | 12 | (36 | ) | 4,386 | ||||||||
| Total |
137,589 | 1,055 | (685 | ) | 137,959 | ||||||||
| Marketable equity securities |
2,523 | 169 | — | 2,692 | |||||||||
| Total available-for-sale securities |
$ | 140,112 | $ | 1,224 | $ | (685 | ) | $ | 140,651 | ||||
| Held-to-maturity: |
|||||||||||||
| U.S. Government securities |
$ | 29,918 | $ | 57 | $ | (16 | ) | $ | 29,959 | ||||
| Securities of U.S. states and political subdivisions |
11,436 | 289 | (82 | ) | 11,643 | ||||||||
| Mortgage-backed securities |
57,868 | 759 | (13 | ) | 58,614 | ||||||||
| Other securities |
17,949 | 1,725 | — | 19,674 | |||||||||
| Total held-to-maturity securities |
$ | 117,171 | $ | 2,830 | $ | (111 | ) | $ | 119,890 | ||||
70
Table of Contents
Index to Financial Statements
| December 31, 2008 | December 31, 2007 | |||||||||||||||||||||||||
| Amortized Cost |
Gross Unrealized Gains |
Gross Unrealized Losses |
Fair Value |
Amortized Cost |
Gross Unrealized Gains |
Gross Unrealized Losses |
Fair Value | |||||||||||||||||||
| (dollars in thousands) | ||||||||||||||||||||||||||
| Available-for-sale: |
||||||||||||||||||||||||||
| Mortgage-backed securities |
$ | 71,897 | $ | 712 | $ | — | $ | 72,609 | $ | 3,910 | $ | — | $ | (101 | ) | $ | 3,809 | |||||||||
| Other securities |
6,218 | 49 | (60 | ) | 6,207 | 8,354 | 51 | (7 | ) | 8,398 | ||||||||||||||||
| Total |
$ | 78,115 | $ | 761 | $ | (60 | ) | $ | 78,816 | $ | 12,264 | $ | 51 | $ | (108 | ) | $ | 12,207 | ||||||||
| Held-to-maturity: |
||||||||||||||||||||||||||
| Mortgage-backed securities |
$ | 95,875 | $ | 1,057 | $ | (4 | ) | $ | 96,928 | $ | 134,056 | $ | 179 | $ | (781 | ) | $ | 133,454 | ||||||||
During the fourth quarter of 2008, we recorded a $2.0 million impairment charge on an investment security we originally acquired to satisfy our Community Reinvestment Act requirements. This security is the only one of its type in our investment portfolio and we wrote the value down to $16,000.
Certain investment securities are valued at less than their historical cost. We believe these decreases in market valuation, which relate primarily to two trust preferred securities, resulted primarily from recent disruptions in the credit markets. We have the ability and intent to hold these securities until there is a recovery in fair value and management believes the declines in fair value for these securities are temporary. Should the impairment of any of these securities become other than temporary, the cost basis of the investment will be reduced and the resulting loss recognized in results of operations in the period the other-than-temporary impairment is identified.
As of December 31, 2009, we had net unrealized gains of $3.3 million in the securities portfolio compared with net unrealized gains of $1.8 million as of December 31, 2008. The $1.5 million increase in net unrealized gains was primarily attributable to changes in market interest rates from December 31, 2008 to December 31, 2009. As of December 31, 2008, we had net unrealized gains of $1.8 million compared with net unrealized losses of $659,000 as of December 31, 2007. The $2.4 million decrease in net unrealized losses was primarily due to falling interest rates.
Mortgage-backed securities (MBSs) are securities that have been developed by pooling a number of real estate mortgages and are principally issued by “quasi-federal” agencies such as Fannie Mae and Freddie Mac. These securities are deemed to have high credit ratings, and the minimum monthly cash flows of principal and interest are guaranteed by the issuing agencies. These two issuers were recently taken over by the federal government and as a result, we believe the federal government will honor the obligations of these two companies. Other MBSs are issued by Ginnie Mae, which is a federal agency, and are guaranteed by the U.S. government.
Unlike U.S. government securities, which have a lump sum payment at maturity, MBSs provide cash flows from regular principal and interest payments and principal prepayments throughout the lives of the securities. MBSs that are purchased at a premium will generally suffer decreasing net yields as interest rates drop because homeowners tend to refinance their mortgages. Thus, the premium paid must be amortized over a shorter period. Conversely, MBSs purchased at a discount will obtain higher net yields in a decreasing interest rate environment. As interest rates rise, the opposite will generally be true. During a period of increasing interest rates, fixed rate MBSs do not tend to experience heavy prepayments of principal, and consequently the average life of this security will be lengthened. If interest rates begin to fall, prepayments will increase, thereby shortening the estimated lives of these securities.
71
Table of Contents
Index to Financial Statements
The following table summarizes the contractual maturities of investment securities on an amortized cost basis and their weighted average yields as of December 31, 2009. This table shows the contractual maturities of the related investment securities and not the estimated average lives of the securities. The contractual maturity of an MBS is the date at which the last underlying mortgage matures. In the case of a 15-year pool of loans or a 30-year pool of loans, the maturity date of the security will be the date the last payment is due on the underlying mortgages.
| December 31, 2009 | ||||||||||||||||||||||||||||||
| Due Within One Year |
After One Year but Within Five Years |
After Five Years but Within Ten Years |
After Ten Years | Amount | Yield | |||||||||||||||||||||||||
| Amount | Yield | Amount | Yield | Amount | Yield | Amount | Yield | |||||||||||||||||||||||
| (dollars in thousands) | ||||||||||||||||||||||||||||||
| Available-for-sale: |
||||||||||||||||||||||||||||||
| U.S. Government securities |
$ | 3,505 | 0.68 | % | $ | 26,499 | 1.88 | % | $ | 54,409 | 3.36 | % | $ | 2,845 | 2.27 | % | $ | 87,258 | 2.77 | % | ||||||||||
| Securities of U.S. states and political subdivisions |
— | — | — | — | — | — | 646 | 6.69 | 646 | 6.69 | ||||||||||||||||||||
| Mortgage-backed securities |
— | — | — | — | 13,863 | 4.17 | 31,412 | 2.81 | 45,275 | 3.23 | ||||||||||||||||||||
| Other securities |
— | — | — | — | — | — | 535 | 7.84 | 535 | 7.84 | ||||||||||||||||||||
| Held-to-maturity: |
||||||||||||||||||||||||||||||
| U.S. Government securities |
— | — | 14,982 | 2.28 | 4,986 | 3.61 | 9,950 | 5.01 | 29,918 | 3.41 | ||||||||||||||||||||
| Securities of U.S. states and political subdivisions |
— | — | — | — | — | — | 11,436 | 6.89 | 11,436 | 6.89 | ||||||||||||||||||||
| Mortgage-backed securities |
35,693 | 3.44 | — | — | — | — | 22,175 | 3.25 | 57,868 | 3.37 | ||||||||||||||||||||
| Other securities |
— | — | 10,553 | 6.69 | 7,396 | 7.35 | — | — | 17,949 | 6.97 | ||||||||||||||||||||
| Total |
$ | 39,198 | 3.20 | % | $ | 52,034 | 2.97 | % | $ | 80,654 | 3.88 | % | $ | 78,999 | 3.85 | % | 250,885 | 3.58 | ||||||||||||
| Equity securities |
6,398 | — | ||||||||||||||||||||||||||||
| Total securities |
$ | 257,283 | 3.49 | % | ||||||||||||||||||||||||||
Contractual maturity of an MBS is not a reliable indicator of its expected life because borrowers have the right to prepay their obligations at any time. An analysis of our MBSs as of December 31, 2009 shows the estimated average lives for fixed MBSs to be 1.64 years and for adjustable MBSs to be 4.02 years. The estimated average life will change if interest rates change. The estimated average life of the total securities portfolio was 4.25 years as of December 31, 2009.
Goodwill and Other Intangible Assets
FASB ASC 805-10, Business Combinations and FASB ASC 350-10, Intangibles—Goodwill and Other require that all business combinations initiated after June 30, 2001 be accounted for under the purchase method and address the initial recognition and measurement of goodwill and other intangible assets acquired in a business combination. FASB ASC 350-10 also addresses the accounting for goodwill and other intangible assets subsequent to their acquisition and provides that intangible assets with finite useful lives should continue to be amortized and that goodwill and intangible assets with indefinite lives should no longer be amortized, but rather, be tested annually for impairment. Based on our goodwill impairment test as of October 1, 2009, we do not believe any of our goodwill is impaired. In addition, as of December 31, 2009, we tested the useful lives of our other intangible assets and determined that there has not been any significant change in the original estimated useful lives.
72
Table of Contents
Index to Financial Statements
The change in our carrying amount of goodwill for the years ended December 31, 2009 and 2008 is as follows:
| Years Ended December 31, |
|||||||
| 2009 | 2008 | ||||||
| (dollars in thousands) | |||||||
| Balance, beginning |
$ | 27,873 | $ | 27,942 | |||
| Goodwill from acquisitions |
— | 33 | |||||
| Adjustment to purchase price (1) |
7,926 | (102 | ) | ||||
| Balance, ending |
$ | 35,799 | $ | 27,873 | |||
| (1) | Accrual of contingent purchase consideration related to Linscomb & Williams in 2009 and income tax contingency related to the acquisition of Encore Trust in 2008. |
Deposits
Deposits are our primary source of funds and we rely on our private client offices to attract and retain those deposits. We offer a variety of products, which consist of noninterest-bearing and interest-bearing checking accounts, money market and savings accounts and certificates of deposit. Deposits are gathered from individuals, partnerships and corporations in our market areas. From time to time, we also purchase brokered deposits, either through a broker to increase the duration of the deposit portfolio, or through the Certificate of Deposit Account Registry Service (CDARS), which we do as a service for our clients. Our deposits averaged $1.2 billion for the year ended December 31, 2009, $1.1 billion for 2008 and $1.0 billion for 2007.
The interest rates we pay are based on the competitive environments in each of our markets. We manage our interest expense through weekly deposit pricing reviews that compare our deposit rates with the competition and wholesale alternatives. The change in cost of our deposits reflects the impact of the increase or decrease in short term rates, such as the Federal Funds rate or the London Inter Bank Offered Rate. Because of the competitive nature of the market for deposits, our rates tend to follow these benchmarks closely. In addition, during periods of rapid loan growth, we have at times offered special deposit products or attractive rates to fund this loan growth. The average cost of deposits, including noninterest-bearing deposits, for the year ended December 31, 2009 was 1.83% compared with 2.63% for the year ended December 31, 2008. The decrease in average cost of deposits was primarily due to falling interest rates.
As of December 31, 2009, core deposits were $871.5 million, or 73.1%, of total deposits, while time deposits $100,000 and greater and brokered deposits made up 26.9% of total deposits. As of December 31, 2009, total deposits increased to $1.2 billion from year end 2008, an increase of $91.0 million, or 8.3%. During this time period, the mix of deposits changed as noninterest-bearing deposits increased $42.4 million to $174.1 million, or 32.2%, and interest checking, money market and savings and time deposits increased $48.6 million to $1.0 billion, or 5.0%. The increase in noninterest-bearing deposits was primarily due to growth in commercial clients in Houston and the increase in interest-bearing deposits was primarily due to time deposits in Houston. As of December 31, 2008, total deposits increased to $1.1 billion from year end 2007, an increase of $59.4 million, or 5.7%.
73
Table of Contents
Index to Financial Statements
The following table presents the daily average balances and weighted average rates paid on deposits for the periods indicated:
| Years Ended December 31, | ||||||||||||||||||
| 2009 | 2008 | 2007 | ||||||||||||||||
| Average Balance |
Average Rate |
Average Balance |
Average Rate |
Average Balance |
Average Rate |
|||||||||||||
| (dollars in thousands) | ||||||||||||||||||
| Noninterest-bearing deposits |
$ | 152,873 | — | % | $ | 120,682 | — | % | $ | 109,448 | — | % | ||||||
| Interest checking |
186,440 | 0.48 | 187,412 | 1.34 | 172,701 | 2.97 | ||||||||||||
| Money market and savings |
273,188 | 1.09 | 291,749 | 1.97 | 348,567 | 4.23 | ||||||||||||
| Time deposits less than $100,000 |
200,493 | 3.33 | 195,321 | 4.39 | 175,393 | 4.86 | ||||||||||||
| Core deposits |
812,994 | 1.30 | 795,164 | 2.12 | 806,109 | 3.52 | ||||||||||||
| Time deposits $100,000 and greater |
308,546 | 3.14 | 239,696 | 4.25 | 192,234 | 5.02 | ||||||||||||
| Brokered deposits |
28,924 | 2.69 | 26,458 | 3.15 | 13,220 | 4.54 | ||||||||||||
| Total deposits |
$ | 1,150,464 | 1.83 | % | $ | 1,061,318 | 2.63 | % | $ | 1,011,563 | 3.82 | % | ||||||
The following table sets forth the amount of our time deposits as of December 31, 2009 that are $100,000 and greater by time remaining until maturity:
December 31, 2009 | |||
| (dollars in thousands) | |||
| Three months or less |
$ | 79,666 | |
| Over three months through six months |
42,778 | ||
| Over six months through one year |
90,126 | ||
| Over one year |
85,593 | ||
| Total |
$ | 298,163 | |
While a majority of the time deposits in amounts of $100,000 and greater will mature within one year, we expect that a significant portion of these deposits will be renewed as the rates we offer on time deposits are competitive in the market. If a significant portion of the time deposits are not renewed, it would have an adverse effect on our liquidity. We monitor maturities and have other available funding sources such as FHLB advances to mitigate this effect.
Borrowings and Repurchase Agreements and Junior Subordinated Debentures
We utilize borrowings to supplement deposits in funding our lending and investing activities. These borrowings are typically advances from the FHLB, which have terms ranging from overnight to several years. All borrowings from the FHLB are collateralized by a blanket lien on Encore Bank’s mortgage-related assets. Additionally, we borrow from customers using investment securities as collateral and have issued junior subordinated debentures to subsidiary trusts.
Our borrowings and repurchase agreements were $220.6 million as of December 31, 2009. The outstanding balance as of December 31, 2009 includes $209.9 million in long term FHLB advances ($95.0 million of which have various call dates prior to the maturity date) and $10.7 million in repurchase agreements with clients.
We decreased our borrowings and repurchase agreements $51.4 million, or 18.9%, to $220.6 million as of December 31, 2009 from $272.0 million as of December 31, 2008. The decrease was due primarily to a decrease in repurchase agreements with clients, as clients shifted into demand deposit accounts.
74
Table of Contents
Index to Financial Statements
The following table summarizes our outstanding borrowings and repurchase agreements at the dates indicated:
| As of and for the Years Ended December 31, |
||||||||||||
| 2009 | 2008 | 2007 | ||||||||||
| (dollars in thousands) | ||||||||||||
| Ending balance |
$ | 220,612 | $ | 272,026 | $ | 173,395 | ||||||
| Average balance for the year |
231,648 | 225,969 | 165,647 | |||||||||
| Maximum month end balance during the year |
257,514 | 272,026 | 173,395 | |||||||||
| Average interest rate for the year |
3.67 | % | 3.44 | % | 4.24 | % | ||||||
| Weighted average interest rate at the end of the year |
3.82 | % | 3.12 | % | 3.95 | % | ||||||
On April 19, 2007, we issued $15.5 million of junior subordinated debentures to Encore Capital Trust III. The junior subordinated debentures, which mature on April 19, 2037, bear a fixed rate of 6.85% until April 19, 2012, at which date we may call the junior subordinated debentures, and a floating rate equal to 3 month LIBOR + 1.75% thereafter. With the proceeds of these junior subordinated debentures, on April 23, 2007 we redeemed an aggregate of $15.5 million of junior subordinated debentures we had issued on April 10, 2002 at a floating rate equal to 6 month LIBOR + 3.70%.
As of December 31, 2009, we had two issues of junior subordinated debentures outstanding totaling $20.6 million as follows:
| Description |
Issuance and Call Dates (1) |
Trust Preferred Securities Outstanding |
Interest Rate as of December 31, 2009 |
Fixed/ Adjustable |
Interest Rate Basis |
Junior Subordinated Debt Owed to Trusts |
Final Maturity Date | ||||||||||
| (dollars in thousands) | |||||||||||||||||
| Encore Statutory Trust II |
9/17/2003 | $ | 5,000 | 3.20 | % | Adjustable quarterly | 3 month LIBOR + 2.95% |
$ | 5,155 | 9/24/2033 | |||||||
| Encore Capital Trust III |
4/19/2007 | 15,000 | 6.85 | % | Fixed rate (2) | 6.85% (2) | 15,464 | 4/19/2037 | |||||||||
| (1) | Each issue of junior subordinated debentures is callable by us after five years from the issuance date. |
| (2) | The debentures bear a fixed interest rate until April 19, 2012, when the rate begins to float on a quarterly basis based on the 3 month LIBOR plus 1.75%. |
Each of the trusts is a capital or statutory business trust organized for the sole purpose of issuing trust securities and investing the proceeds in our junior subordinated debentures. The trust preferred securities of each trust represent preferred beneficial interests in the assets of the respective trusts and are subject to mandatory redemption upon payments of the junior subordinated debentures held by the trust. The common securities of each trust are wholly-owned by us. Each trust’s ability to pay amounts due on the trust preferred securities is solely dependent upon our making payment on the related junior subordinated debentures. The debentures, which are the only assets of each trust, are subordinate and junior in right of payment to all of our present and future senior indebtedness. We have fully and unconditionally guaranteed each trust’s obligations under the trust securities issued by such trust to the extent not paid or made by each trust, provided that such trust has funds available for such obligations.
Under the provisions of each issue of the junior subordinated debentures, we have the right to defer payment of interest on the debentures at any time, or from time to time, for periods not exceeding five years. If interest payments on either issue of the junior subordinated debentures are deferred, the distributions on the applicable trust preferred securities will also be deferred. However, the interest due would continue to accrue during any such interest payment deferral period.
75
Table of Contents
Index to Financial Statements
The trust preferred securities issued by the trusts are currently included in our Tier 1 capital for regulatory purposes. On March 1, 2005, the Federal Reserve adopted final rules that would continue to allow trust preferred securities to be included in Tier 1 capital, subject to stricter quantitative and qualitative limits. Currently, trust preferred securities and qualifying perpetual preferred stock are limited in the aggregate to no more than 25% of a bank holding company’s core capital elements. The new rule amends the existing limit by providing that restricted core capital elements (including trust preferred securities and qualifying perpetual preferred stock) can be no more than 25% of core capital, net of goodwill and associated deferred tax liability. Because the 25% limit currently is calculated without deducting goodwill, the final rule reduces the amount of trust preferred securities that we can include in Tier 1 capital. The amount of such excess trust preferred securities are includable in Tier 2 capital. The new quantitative limits will be fully effective on March 31, 2011. The new rules would have reduced the amount of trust preferred securities that we may include in our Tier 1 capital by $8.1 million as of December 31, 2009.
Each of the trusts issuing the trust preferred securities holds junior subordinated debentures we issued with a 30-year maturity. The final rules provide that in the last five years before the junior subordinated debentures mature, the associated trust preferred securities will be excluded from Tier 1 capital and included in Tier 2 capital, subject (together with subordinated debt and certain other investments) to an aggregate limit of 50% of Tier 1 capital. In addition, under the regulations, the trust preferred securities during this five-year period would be amortized out of Tier 2 capital by one-fifth each year and excluded from Tier 2 capital completely during the year prior to maturity of the debentures.
Liquidity
Our liquidity represents our ability to meet cash demands as they arise. Such needs can develop from loan demand, deposit withdrawals or acquisition opportunities. Potential obligations resulting from the issuance of standby letters of credit and commitments to fund future borrowings to our loan customers also affect our liquidity needs. Many of these obligations and commitments are expected to expire without being drawn upon; therefore the total commitment amounts do not necessarily represent future cash requirements affecting our liquidity position. Liquidity management involves forecasting funding requirements and maintaining sufficient capacity to meet the needs and accommodate fluctuations in asset and liability levels due to changes in our business operations or unanticipated events.
Liquidity needs of a financial institution can be met from either assets or liabilities. On the asset side, our primary sources of liquidity are cash and due from banks, federal funds sold, maturities of securities and scheduled repayments and maturities of loans. On the liability side, our principal sources of liquidity are deposits, borrowed funds and the accessibility to money and capital markets. Client deposits are our largest source of funds. For the years ended December 31, 2009 and 2008, our average deposits were $1.2 billion, or 71.9% of average total assets, and $1.1 billion, or 71.6% of average total assets.
At December 31, 2009, we had approximately $180.4 million in short term investments and $140.7 million in securities available-for-sale, which together represented 19.6% of our balance sheet. Funds are also available from borrowings from the FHLB pursuant to an existing commitment based on the value of the collateral pledged (either loans or securities) and repurchase agreements. As of December 31, 2009, we had $298.9 million in available credit from the FHLB. We monitor our liquidity closely through balance sheet analysis as well as cash flow projections to ensure that we have adequate liquidity to meet our obligations.
We develop and maintain a contingency funding plan for our liquidity position. This plan provides an operating framework to manage our liquidity position under various operating circumstances and allows us to ensure that we would be able to operate through a period of stress when access to normal sources of funding is constrained. The plan outlines sources and quantity of liquidity, highlights actions and procedures for managing through a problem period and defines roles and responsibilities. This plan is reviewed and approved annually by our Asset Liability Committee (ALCO) and the board of directors.
76
Table of Contents
Index to Financial Statements
The primary source of our parent company funding has been dividends from our subsidiary bank, the payment of which is subject to bank regulatory limitations. Accordingly, consolidated cash flows as presented in the consolidated statements of cash flows may not represent cash immediately available to us. However, the parent company maintains excess liquidity that would be sufficient to fully fund the parent company and nonbank affiliate operations for an extended period should funding from the bank be interrupted.
Shareholders’ Equity and Puttable Common Stock
Shareholders’ equity increased $926,000, or 0.5%, to $186.7 million as of December 31, 2009 compared with $185.7 million as of December 31, 2008, primarily due to the increase in net earnings. Our ratio of average shareholders’ equity to average assets increased to 11.72% as of December 31, 2009 compared with 10.99% as of December 31, 2008. In addition, our shareholder’s equity and our capital ratios were impacted by the completion of a contingency payment obligation incurred in connection with our acquisition of Linscomb & Williams. The accrued liability related to this transaction as of December 31, 2009 was $7.9 million and will be extinguished by the issuance of approximately 696,000 shares of common stock prior to the end of the first quarter 2010 and the payment of $2.1 million in cash, which has already been paid. The recording of this transaction resulted in approximately $7.9 million in additional goodwill, which reduced tangible book value and regulatory capital. Upon issuance of the shares during the first quarter of 2010, tangible book value and regulatory capital will be increased by approximately $5.8 million. If we had issued the shares at December 31, 2009, the tangible book value per share, tangible common equity ratio, Tier 1 risk-based, total risk-based and leverage capital ratios would have been $10.93, 7.68%, 15.32%, 16.59% and 10.92%.
Shareholders’ equity increased $28.3 million, or 17.9%, to $185.7 million as of December 31, 2008, compared with $157.5 million as of December 31, 2007. Our ratio of average shareholders’ equity to average assets increased to 10.99% as of December 31, 2008 compared with 9.64% as of December 31, 2007. The increase was due primarily to the $34.0 million we received from our participation in the CPP, which was partly offset by the net loss for the year.
The acquisition agreement and related put agreement, pursuant to which we issued cash and 773,616 shares of common stock in exchange for all of the shares of Linscomb & Williams, gave the shareholders of Linscomb & Williams a non-transferable right to put such stock back to us on August 31, 2009, in exchange for all of the shares of Linscomb & Williams if such put right was not otherwise extinguished pursuant to the terms of the agreement. The put option was extinguishable at any time if our common stock became listed for trading on the New York Stock Exchange, the NASDAQ National Market (now known as the NASDAQ Global Market) or the American Stock Exchange, or we were acquired by another company in a transaction in which our shareholders receive securities, cash or a combination thereof, issued by a publicly traded company on or before August 31, 2009. At December 31, 2006 and 2005, we classified the puttable common stock outside of shareholders’ equity as the ability to extinguish the put was not considered to be completely within our control. The put agreement was terminated on March 30, 2007. As a result, the puttable common stock was reclassified and included in shareholders’ equity as of March 31, 2007.
In July 2007, we completed our initial public offering of 1,904,761 shares of our common stock at $21.00 per share. In August 2007, our underwriters exercised their over-allotment option for an additional 285,714 shares of our common stock, also at $21.00 per share. Our net proceeds, including the sale of the over-allotment shares, were $41.4 million. In addition, we raised capital through the issuance of junior subordinated debentures in connection with trust preferred securities issuances by various non-consolidated statutory trust subsidiaries in September 2003 and April 2007. This capital is available for general corporate purposes, including loan and deposit growth. On December 5, 2008 in connection with our participation in the CPP, we issued and sold to the U.S. Treasury (i) 34,000 shares of our Fixed Rate Cumulative Perpetual Preferred Stock, Series A, par value $1.00 per share, with a liquidation value of $1,000 per share, and (ii) a Warrant to purchase up to 364,026 shares of our common stock, at an exercise price of $14.01 per share, subject to certain anti-dilution and other adjustments, for an aggregate purchase price of $34.0 million in cash.
77
Table of Contents
Index to Financial Statements
Regulatory Capital
We actively manage our capital. Our potential sources of capital are earnings and common or preferred equity. From time to time, we have issued trust preferred securities through a subsidiary trust either to fund organic growth or to support an acquisition. Trust preferred securities can be eligible for treatment as Tier 1 regulatory capital provided such securities comprise less than 25% of core capital elements. Any amount above this limit can be eligible for treatment as Tier 2 capital.
Each of the federal bank regulatory agencies has established minimum capital adequacy and leverage capital requirements for banking organizations. Since the conversion of Encore Bank to a national bank on March 30, 2007, Encore Bank is subject to the capital adequacy requirements of the OCC and we, as a financial holding company, are subject to the capital adequacy requirements of the Federal Reserve. As of the most recent notification from the OCC, Encore Bank was categorized as “well capitalized” under the regulatory framework for prompt corrective action. To be categorized “well capitalized” Encore Bank must maintain minimum Tier 1 leverage, Tier 1 risk-based capital, and total risk-based capital ratios as set forth in the table below. There are no conditions or events since that notification that we believe have changed Encore Bank’s capital position. We intend that Encore Bank will maintain a capital position that meets or exceeds the “well capitalized” requirements as defined by the OCC.
The following table presents capital amounts and ratios for us and Encore Bank as of December 31, 2009:
| Actual | For Capital Adequacy Purposes |
To Be Categorized as Well Capitalized Under Prompt Corrective Action Provisions |
||||||||||||||||
| Amount | Ratio | Amount | Ratio | Amount | Ratio | |||||||||||||
| (dollars in thousands) | ||||||||||||||||||
| Encore Bancshares, Inc. |
||||||||||||||||||
| Leverage |
$ | 166,276 | 10.55 | % | $ | 63,061 | 4.00 | % | $ | N/A | N/A | |||||||
| Tier 1 risk-based |
166,276 | 14.80 | 44,932 | 4.00 | N/A | N/A | ||||||||||||
| Total risk-based |
180,478 | 16.07 | 89,863 | 8.00 | N/A | N/A | ||||||||||||
| Encore Bank, N.A. |
||||||||||||||||||
| Leverage |
$ | 143,479 | 9.11 | % | $ | 63,010 | 4.00 | % | $ | 78,762 | 5.00 | % | ||||||
| Tier 1 risk-based |
143,479 | 12.72 | 45,117 | 4.00 | 67,676 | 6.00 | ||||||||||||
| Total risk-based |
157,673 | 13.98 | 90,235 | 8.00 | 112,793 | 10.00 | ||||||||||||
The risk-based capital requirements of the Federal Reserve and the OCC define capital and establish minimum capital requirements in relation to assets and off-balance sheet exposure, adjusted for credit risk. The risk-based capital standards currently in effect are designed to make regulatory capital requirements more sensitive to differences in risk profiles among bank holding companies and banks, to account for off-balance sheet exposure and to minimize disincentives for holding liquid assets. Assets and off-balance sheet items are assigned to broad risk categories, each with appropriate relative risk weights. The resulting capital ratios represent capital as a percentage of total risk-weighted assets and off-balance sheet items.
The risk-based capital standards issued by the Federal Reserve require all bank holding companies to have Tier 1 capital of at least 4.0% to be “adequately capitalized” and at least 6.0% to be “well capitalized” and total risk-based capital (Tier 1 and Tier 2) of at least 8.0% of total risk-weighted assets to be “adequately capitalized” and at least 10.0% to be “well capitalized.” Tier 1 capital generally includes common shareholders’ equity and qualifying perpetual preferred stock together with related surpluses and retained earnings, less deductions for goodwill and various other intangibles. Tier 2 capital may consist of a limited amount of intermediate-term preferred stock, a limited amount of term subordinated debt, certain hybrid capital instruments and other debt securities, perpetual preferred stock not qualifying as Tier 1 capital, and a limited amount of the general valuation allowance for loan losses. The sum of Tier 1 capital and Tier 2 capital is total risk-based capital.
78
Table of Contents
Index to Financial Statements
The Federal Reserve has also adopted guidelines which supplement the risk-based capital standards with a minimum ratio of Tier 1 capital to average total consolidated assets (leverage ratio) of 3.0% for institutions with well diversified risk, including no undue interest rate exposure; excellent asset quality; high liquidity; good earnings; and that are generally considered to be strong banking organizations, rated composite 1 under applicable federal guidelines, and that are not experiencing or anticipating significant growth. Other banking organizations are required to maintain a leverage ratio of at least 4.0% in order to be categorized as “adequately capitalized” and at least 5.0% to be categorized as “well capitalized.” These rules further provide that banking organizations experiencing internal growth or making acquisitions will be expected to maintain capital positions substantially above the minimum supervisory levels and comparable to peer group averages, without significant reliance on intangible assets.
Encore Bank is subject to capital adequacy guidelines of the OCC that are substantially similar to the Federal Reserve’s guidelines.
Asset/Liability Management
Our asset/liability and funds management policy provides us with the necessary guidelines for effective funds management, and we have established a measurement system for monitoring our net interest rate sensitivity position. We seek to maintain a sensitivity position within established guidelines.
As a financial institution, the primary component of market risk is interest rate volatility. Fluctuations in interest rates will ultimately impact both the level of income and expense recorded on most of the assets and liabilities, other than those which have a short term to maturity. Because of the nature of our operations, we are not subject to foreign exchange or commodity price risk. We do not own any trading assets.
Interest rate risk is the potential of economic loss due to future interest rate changes. These economic losses can be reflected as a loss of future net interest income and/or a loss of current fair market values. The objective is to measure the effect on net interest income and to adjust the balance sheet to minimize the inherent risk while at the same time maximizing income. We recognize that certain risks are inherent, and that the goal is to identify and understand the risks.
We actively manage our exposure to adverse changes in interest rates through asset and liability management activities within guidelines established by our ALCO. The ALCO, which is composed primarily of senior officers of Encore Bank, has the responsibility for ensuring compliance with asset/liability management policies. Interest rate risk is the exposure to adverse changes in net interest income as a result of market fluctuations in interest rates. On a regular basis, the ALCO monitors interest rate and liquidity risk in order to implement appropriate funding and balance sheet strategies.
We utilize a net interest income simulation model to analyze net interest income sensitivity. Potential changes in market interest rates and their subsequent effects on net interest income are then evaluated. The model projects the effect of instantaneous movements in interest rates of both 100 and 200 basis points. Assumptions based on the historical behavior of our deposit rates and balances in relation to changes in interest rates are also incorporated into the model. These assumptions are inherently uncertain and, as a result, the model cannot precisely measure future net interest income or precisely predict the impact of fluctuations in market interest rates on net interest income. Actual results will differ from the model’s simulated results due to timing, magnitude and frequency of interest rate changes as well as changes in market conditions and the application and timing of various management strategies.
Our interest sensitivity profile was liability sensitive as of December 31, 2009. Given an instantaneous 100 basis point increase in rates that was sustained for 12 months, our base net interest income would decrease by an estimated 1.3% for the year ended December 31, 2009. Given a 200 basis point increase in interest rates for the same period, our base net interest income would decrease by an estimated 2.3% for the year ended December 31, 2009. Given that interest rates are near zero, we did not run an instantaneous downward shock.
79
Table of Contents
Index to Financial Statements
We also manage our exposure to interest rates by structuring our balance sheet in the ordinary course of business. An important measure of interest rate risk is the relationship of the repricing period of interest-earning assets and interest-bearing liabilities. The more closely the repricing periods are correlated, the less interest rate risk we have. From time to time, we may use instruments such as leveraged derivatives, structured notes, interest rate swaps, caps, floors, financial options, financial futures contracts, or forward delivery contracts to reduce interest rate risk. As of December 31, 2009, we had no hedging instruments.
An interest rate sensitive asset or liability is one that, within a defined time period, either matures or experiences an interest rate change in line with general market interest rates. A measurement of interest rate risk is performed by analyzing the maturity and repricing relationships between interest-earning assets and interest-bearing liabilities at specific points in time (gap). Interest rate sensitivity reflects the potential effect on net interest income of a movement in interest rates. An institution is considered to be asset sensitive, or having a positive gap, when the amount of its interest-earning assets maturing or repricing within a given period exceeds the amount of its interest-bearing liabilities also maturing or repricing within that time period. Conversely, an institution is considered to be liability sensitive, or having a negative gap, when the amount of its interest-bearing liabilities maturing or repricing within a given period exceeds the amount of its interest-earning assets also maturing or repricing within that time period. During a period of rising interest rates, a negative gap would tend to affect net interest income adversely, while a positive gap would tend to increase net interest income. During a period of falling interest rates, a negative gap would tend to result in an increase in net interest income, while a positive gap would tend to affect net interest income adversely.
The following table sets forth our interest rate sensitivity analysis as of December 31, 2009:
| Volumes Subject to Repricing Within | ||||||||||||||||||||||||||||||||||
| 0-30 Days |
31-90 Days |
91-180 Days |
181-365 Days |
1-2 Years |
2-5 Years |
Over 5 Years |
Non-Rate Sensitive |
Total Balance | ||||||||||||||||||||||||||
| (dollars in thousands) | ||||||||||||||||||||||||||||||||||
| Interest-earning assets: |
||||||||||||||||||||||||||||||||||
| Loans |
$ | 342,866 | $ | 43,839 | $ | 61,820 | $ | 117,384 | $ | 148,362 | $ | 250,666 | $ | 112,016 | $ | 1,252 | $ | 1,078,205 | ||||||||||||||||
| Securities |
39,839 | 28,990 | 69,032 | 45,567 | 9,125 | 12,100 | 52,265 | 904 | 257,822 | |||||||||||||||||||||||||
| Other interest-earning assets |
191,007 | — | — | — | — | — | — | — | 191,007 | |||||||||||||||||||||||||
| Total interest-earning assets |
573,712 | 72,829 | 130,852 | 162,951 | 157,487 | 262,766 | 164,281 | 2,156 | 1,527,034 | |||||||||||||||||||||||||
| Interest-bearing liabilities: |
||||||||||||||||||||||||||||||||||
| Interest checking, money market and savings |
506,014 | — | — | — | — | — | — | — | 506,014 | |||||||||||||||||||||||||
| Time deposits |
47,579 | 89,673 | 71,490 | 145,972 | 97,679 | 59,327 | — | — | 511,720 | |||||||||||||||||||||||||
| FHLB advances |
35,000 | 50,000 | 10,000 | — | 17,000 | 95,000 | 2,938 | — | 209,938 | |||||||||||||||||||||||||
| Borrowings and repurchase agreements |
10,674 | — | — | — | — | — | — | — | 10,674 | |||||||||||||||||||||||||
| Junior subordinated debentures |
— | 5,155 | — | — | — | 15,464 | — | — | 20,619 | |||||||||||||||||||||||||
| Total interest-bearing liabilities |
599,267 | 144,828 | 81,490 | 145,972 | 114,679 | 169,791 | 2,938 | — | 1,258,965 | |||||||||||||||||||||||||
| Interest rate sensitivity gap |
$ | (25,555 | ) | $ | (71,999 | ) | $ | 49,362 | $ | 16,979 | $ | 42,808 | $ | 92,975 | $ | 161,343 | $ | 2,156 | $ | 268,069 | ||||||||||||||
| Cumulative interest rate sensitivity gap |
$ | (25,555 | ) | $ | (97,554 | ) | $ | (48,192 | ) | $ | (31,213 | ) | $ | 11,595 | $ | 104,570 | $ | 265,913 | ||||||||||||||||
| Cumulative interest rate sensitive assets to rate sensitive liabilities |
95.7 | % | 86.9 | % | 94.2 | % | 96.8 | % | 101.1 | % | 108.3 | % | 121.1 | % | ||||||||||||||||||||
| Cumulative gap as a percent of total earning assets |
(1.7 | )% | (6.4 | )% | (3.2 | )% | (2.0 | )% | 0.8 | % | 6.8 | % | 17.4 | % | ||||||||||||||||||||
80
Table of Contents
Index to Financial Statements
Certain shortcomings are inherent in the method of analysis presented in the gap table. For example, although certain assets and liabilities may have similar maturities or periods of repricing, they may react in different degrees to changes in market interest rates. Additionally, certain assets, such as adjustable-rate loans, have features that restrict changes in interest rates, both on a short-term basis and over the life of the asset. More importantly, changes in interest rates, prepayments and early withdrawal levels may deviate significantly from those assumed in the calculations in the table. As a result of these shortcomings, we focus more on a net interest income simulation model than on gap analysis. Although the gap analysis reflects a ratio of cumulative gap to total earning assets within acceptable limits, the net interest income simulation model is considered by management to be more informative in forecasting future income at risk.
We face the risk that borrowers might repay their loans sooner than the contractual maturity. If interest rates fall, our borrowers might repay their loans, forcing us to reinvest in a potentially lower yielding asset. This prepayment would have the effect of lowering the overall portfolio yield which may result in lower net interest income. We have assumed that these loans will prepay, if the borrower has sufficient incentive to do so, using prepayment tables provided by third party consultants. In addition, some of our assets, such as mortgage-backed securities or purchased loans, are held at a premium, and if these assets prepaid, we would have to write down the premium, which would temporarily reduce the yield.
Contractual Obligations
The following table presents the payments due by period for our contractual obligations (other than deposit obligations) as of December 31, 2009:
| Payments Due in Years Ended: | |||||||||||||||
| 2010 | 2011-2012 | 2013-2014 | Thereafter | Total | |||||||||||
| (dollars in thousands) | |||||||||||||||
| Operating leases |
$ | 2,965 | $ | 4,801 | $ | 3,221 | $ | 3,538 | $ | 14,525 | |||||
| FHLB advances |
— | 52,500 | 59,500 | 97,938 | 209,938 | ||||||||||
| Other borrowed funds |
10,674 | — | — | — | 10,674 | ||||||||||
| Junior subordinated debentures |
— | — | — | 20,619 | 20,619 | ||||||||||
| Total |
$ | 13,639 | $ | 57,301 | $ | 62,721 | $ | 122,095 | $ | 255,756 | |||||
FHLB advances totaling $95.0 million have various call dates prior to the maturity date.
Off-Balance Sheet Arrangements
In the normal course of business, we enter into various transactions to meet the financing needs of our clients which, in accordance with US GAAP, are not included in our consolidated balance sheet. These transactions include commitments to extend credit and standby letters of credit, which involve, to varying degrees, elements of credit risk and interest rate risk in excess of the amounts recognized in the consolidated balance sheets.
Our commitments associated with outstanding letters of credit and commitments to extend credit as of December 31, 2009 are summarized below. Since commitments associated with letters of credit and commitments to extend credit may expire unused, the amounts shown do not necessarily reflect the actual future cash funding requirements.
| Payments Due in Years Ended: | |||||||||||||||
| 2010 | 2011-2012 | 2013-2014 | Thereafter | Total | |||||||||||
| (dollars in thousands) | |||||||||||||||
| Standby letters of credit |
$ | 4,659 | $ | 593 | $ | 1,025 | $ | — | $ | 6,277 | |||||
| Commitments to extend credit |
90,312 | 19,615 | 956 | 28,697 | 139,580 | ||||||||||
| Total |
$ | 94,971 | $ | 20,208 | $ | 1,981 | $ | 28,697 | $ | 145,857 | |||||
81
Table of Contents
Index to Financial Statements
Standby Letters of Credit. Standby letters of credit are written conditional commitments we issue to guarantee the performance of a client to a third party. In the event the client does not perform in accordance with the terms of the agreement with the third party, we would be required to fund the commitment. The maximum potential amount of future payments we could be required to make is represented by the contractual amount of the commitment. If the commitment is funded, we would be entitled to seek recovery from the client.
Commitments to Extend Credit. We enter into contractual commitments to extend credit, normally with fixed expiration dates or termination clauses, at specified rates and for specific purposes. Substantially all of our commitments to extend credit are contingent upon clients maintaining specific credit standards at the time of funding. We minimize our exposure to loss under these commitments by subjecting them to credit approval and monitoring procedures.
Impact of Inflation and Changing Prices
Our financial statements and related notes included in this Form 10-K have been prepared in accordance with US GAAP. These require the measurement of financial position and operating results in historical dollars without considering changes in the relative purchasing power of money over time due to inflation. We have an asset and liability structure that is essentially monetary in nature. As a result, interest rates have a more significant impact on our performance than the effects of general levels of inflation. Periods of high inflation are often accompanied by relatively higher interest rates, and periods of low inflation are accompanied by relatively lower interest rates. As market interest rates rise or fall in relation to the rates earned on our loans and investments, the value of these assets decreases or increases.
Item 7A. Quantitative and Qualitative Disclosures About Market Risk
For information regarding the market risk of our financial instruments, see Item 7. Management’s Discussion and Analysis of Financial Condition and Results of Operation—Financial Condition—Asset/Liability Management. Our principal market risk exposure is to changes in interest rates.
Item 8. Financial Statements and Supplementary Data
The financial statements, the report thereon, the notes thereto and supplementary data commence on page F-1 of this Annual Report on Form 10-K.
Item 9. Changes in and Disagreements with Accountants on Accounting and Financial Disclosures
None.
Item 9A. Controls and Procedures
Evaluation of Disclosure Controls and Procedures
As of the end of the period covered by this report, we carried out an evaluation, under the supervision and with the participation of our management, including our Chief Executive Officer and Chief Financial Officer, of the effectiveness of the design and operation of our “disclosure controls and procedures” (as defined in Rules 13a-15(e) and 15d-15(e) under the Securities Exchange Act of 1934, as amended (the Exchange Act)) that are designed to ensure that required information is recorded, processed, summarized and reported within the required time frame, as specified in rules set forth by the Securities and Exchange Commission. Based upon that evaluation, our Chief Executive Officer and Chief Financial Officer concluded that our disclosure controls and procedures were effective as of December 31, 2009.
82
Table of Contents
Index to Financial Statements
Changes in Internal Control Over Financial Reporting
There were no changes in our internal control over financial reporting (as defined in Rules 13a-15(f) and 15d-15(f) under the Exchange Act) that occurred during the quarter ended December 31, 2009, that have materially affected, or are reasonably likely to materially affect, our internal control over financial reporting.
Management’s Report on Internal Control Over Financial Reporting
We are responsible for establishing and maintaining adequate internal control over financial reporting as defined in Rules 13a-15(f) and 15d-15(f) under the Securities Exchange Act of 1934, as amended (the Exchange Act). Our internal control over financial reporting is a process designed to provide reasonable assurance regarding the reliability of financial reporting and the preparation of financial statements for external purposes in accordance with generally accepted accounting principles.
All internal control systems, no matter how well designed, have inherent limitations. Therefore, even those systems determined to be effective can provide only reasonable assurance with respect to financial statement preparation and presentation. Because of its inherent limitations, internal control over financial reporting may not prevent or detect misstatements. Also, projections of any evaluation of effectiveness to future periods are subject to the risk that controls may become inadequate because of changes in conditions, or that the degree of compliance with the policies or procedures may deteriorate.
Management is responsible for establishing and maintaining adequate internal control over financial reporting, as such term is defined in Exchange Act Rule 13a-15(f). Management (with the participation of our Chief Executive Officer and Chief Financial Officer) conducted an evaluation of the effectiveness of internal control over financial reporting based on the framework in Internal Control—Integrated Framework issued by the Committee of Sponsoring Organizations of the Treadway Commission. This assessment included controls over the preparation of the schedules equivalent to the basic financial statements in accordance with the instructions for the Consolidated Financial Statements for Bank Holding Companies (Form FR Y-9C) to meet the reporting requirements of Section 112 of the Federal Deposit Insurance Corporation Improvement Act. Based on this evaluation, management concluded that the Company’s internal control over financial reporting was effective as of December 31, 2009.
Grant Thornton LLP, an independent registered public accounting firm, has issued an attestation report on the effectiveness of the Company’s internal control over financial reporting and issued an audit report thereon, which is included in this Annual Report on Form 10-K.
Compliance with Designated Laws and Regulations
Management is also responsible for ensuring compliance with the federal laws and regulations concerning loans to insiders and the federal and state laws and regulations concerning dividend restrictions, both of which are designated by the Federal Deposit Insurance Corporation (FDIC) as safety and soundness laws and regulations.
Management assessed its compliance with the designated safety and soundness laws and regulations and has maintained records of its determinations and assessments as required by the FDIC. Based on this assessment, management believes that the Company has complied, in all material respects, with the designated safety and soundness laws and regulations for the year ended December 31, 2009.
On March 13, 2010, the Company and Linscomb & Williams entered into a Third Amendment to the Agreement and Plan of Reorganization dated as of August 29, 2005. The amendment allows the former
83
Table of Contents
Index to Financial Statements
Linscomb & Williams shareholders to elect to receive the contingent consideration (i) entirely in shares of Company common stock or (ii) a combination of cash and shares of Company common stock; provided, however, that the aggregate amount of contingent consideration to be received in cash by the holders does not exceed 30%. The amendment also sets forth the method for determining the market value of the Company’s common stock using the average closing prices of the Company’s common stock for the ten (10) trading dates preceding March 11, 2010.
In addition, on March 15, 2010, the Company entered into an amended and restated change in control agreement with each of James S. D’Agostino and L. Anderson Creel and a change in control agreement with each of Preston Moore, Carmen A. Jordan and Charles W. Jenness. The agreements have an initial term of five years or until the executive reaches his or her normal retirement date (as defined in the agreement) and provide for, among other things, a lump sum payment to each executive officer equal to the sum of two times such officer’s base salary plus two times the average of all bonus, profit sharing and other incentive payments received by such officer for the last two fiscal years to be made upon termination of employment within two years following a change in control. In addition, upon a change in control, all outstanding stock options and nonvested restricted stock awarded to each of the executive officers pursuant to a stock incentive plan of the Company will become vested and immediately exercisable. Each agreement contains a provision that any payments under the agreement will be prohibited and/or limited to the extent necessary to be in compliance with EESA. The change in control agreements will automatically renew for subsequent one-year periods unless notice of termination is properly given by the Company or the executive officer. While each of the change in control agreements contains a post-employment confidentiality provision, no executive officer is bound by a post-employment non-competition provision.
Further, on March 15, 2010, the Company entered into indemnity agreements, the form of which was filed with the SEC as Exhibit 10.1 to the Company’s Current Report on Form 8-K filed on December 7, 2007 (each, an Indemnity Agreement), with Preston Moore and Carin Barth, each of whom is a director of the Company. Each Indemnity Agreement provides that the Company will indemnify the applicable director against any and all liabilities asserted against the applicable director to the fullest extent permitted by the Texas Business Corporation Act and any other law (including statutory laws and laws established by judicial decision) of the State of Texas, subject, however, to 12 U.S.C. § 1828(k) and the rules and regulations promulgated thereunder, which provides that the FDIC may prohibit or limit an indemnification payment to an institution-affiliated party under certain circumstances. Each Indemnity Agreement also establishes guidelines as to the defense and settlement of claims by the parties.
The above summaries of the Third Amendment to the Agreement and Plan of Reorganization and the amended and restated change in control agreements and change in control agreements are qualified in their entirety by reference to the full text of each agreement filed as an exhibit to this Annual Report on Form 10-K and incorporated by reference herein. The above summary of the Indemnity Agreements is qualified in its entirety by reference to the full text of the form of Indemnity Agreements filed as Exhibit 10.1 to the Company’s Current Report on Form 8-K filed on December 7, 2007 and incorporated by reference herein.
PART III
Item 10. Directors, Executive Officers and Corporate Governance
The information required by this Item is incorporated herein by reference under the captions “Election of Directors,” “Executive Officers,” “Section 16(a) Beneficial Ownership Reporting Compliance,” “Corporate Governance—Committees of the Board of Directors—Audit Committee,” “Corporate Governance—Director Nominations Process” and “Corporate Governance—Code of Ethics” in our definitive Proxy Statement for our 2010 Annual Meeting of Shareholders (the 2010 Proxy Statement) to be filed with the Commission pursuant to Regulation 14A under the Exchange Act within 120 days of our fiscal year end.
84
Table of Contents
Index to Financial Statements
Item 11. Executive Compensation
The information required by this Item is incorporated herein by reference under the captions “Executive Compensation and Other Matters” and “Director Compensation” in the 2010 Proxy Statement.
Item 12. Security Ownership of Certain Beneficial Owners and Management and Related Stockholder Matters
Certain information required by this Item 12 is included under “Securities Authorized for Issuance Under Equity Compensation Plans” in Part II, Item 5 of this Annual Report on Form 10-K. The information required by this Item is incorporated herein by reference under the caption “Beneficial Ownership of Common Stock by Management of the Company and Principal Shareholders” in the 2010 Proxy Statement.
Item 13. Certain Relationships and Related Transactions and Director Independence
The information required by this Item is incorporated herein by reference under the captions “Corporate Governance—Director Independence” and “Certain Relationships and Related Transactions” in the 2010 Proxy Statement.
Item 14. Principal Accounting Fees and Services
The information required by this Item 14 is incorporated herein by reference under the caption “Fees and Services of Independent Registered Public Accounting Firm” in the 2010 Proxy Statement.
PART IV
Item 15. Exhibits and Financial Statement Schedules
(a) The following documents are filed as part of this Annual Report on Form 10-K:
| 1. | Consolidated Financial Statements. Reference is made to Part II, Item 8, of this Annual Report on Form 10-K. |
| 2. | Financial Statement Schedules. These schedules are omitted as the required information is inapplicable or the information is presented in the consolidated financial statements or related notes. |
| 3. | The exhibits to this Annual Report on Form 10-K listed below have been included only with the copy of this report filed with the Securities and Exchange Commission. We will furnish a copy of any exhibit to shareholders upon written request to Encore Bancshares, Inc. and payment of a reasonable fee. |
Each exhibit marked with an asterisk is filed or furnished with this Annual Report on Form 10-K as noted below.
| Exhibit (1) |
Description | |
| 2.1 | Stock Purchase Agreement, dated as of September 21, 2004, by and among Encore Bancshares, Inc., National Fiduciary Services, N.A., Memorial Funding, Inc. and William E. and Kathleen Mercer (incorporated herein by reference to Exhibit 2.2 to Encore Bancshares, Inc.’s Registration Statement on Form S-1, Registration No. 333-142735 (the S-1 Registration Statement)) | |
| 2.2 | Amendment to Stock Purchase Agreement, dated as of March 15, 2005, by and among Encore Bancshares, Inc., National Fiduciary Services, N.A., Memorial Funding, Inc. and William E. and Kathleen Mercer (incorporated herein by reference to Exhibit 2.3 to the S-1 Registration Statement) | |
| 2.3 | Agreement and Plan of Reorganization, dated as of August 29, 2005, by and between Encore Bancshares, Inc. and Linscomb & Williams, Inc. (incorporated herein by reference to Exhibit 2.4 to the S-1 Registration Statement) | |
85
Table of Contents
Index to Financial Statements
| Exhibit (1) |
Description | |
| 2.4 | First Amendment to Agreement and Plan of Reorganization, dated July 28, 2006, by and between Encore Bancshares, Inc. and Linscomb & Williams, Inc. (incorporated herein by reference to Exhibit 2.5 to the S-1 Registration Statement) | |
| 2.5 | Second Amendment to Agreement and Plan of Reorganization, dated March 30, 2007, by and between Encore Bancshares, Inc. and Linscomb & Williams, Inc. (incorporated herein by reference to Exhibit 2.6 to the S-1 Registration Statement) | |
| 2.6* | Third Amendment to Agreement and Plan of Reorganization, dated March 13, 2010, by and between Encore Bancshares, Inc. and Linscomb & Williams, Inc. | |
| 2.7 | Stock Purchase Agreement, dated June 28, 2006, by and among Regions Bank, Encore Trust Company and RF Trust Company, Inc. (incorporated herein by reference to Exhibit 2.7 to the S-1 Registration Statement) | |
| 2.8 | Agreement and Plan of Merger, dated as of June 1, 2007, by and between Encore Trust Company, N.A. and Encore Bank, N.A. (incorporated herein by reference to Exhibit 2.8 to the S-1 Registration Statement) | |
| 2.9 | Letter Agreement, dated December 5, 2008, including the Securities Purchase Agreement—Standard Terms incorporated by reference therein, by and between Encore Bancshares, Inc. and the United States Department of the Treasury (incorporated herein by reference to Exhibit 10.1 to Encore Bancshares, Inc.’s Current Report on Form 8-K filed on December 8, 2008) | |
| 3.1 | Amended and Restated Articles of Incorporation of Encore Bancshares, Inc. (incorporated herein by reference to Exhibit 3.1 to the S-1 Registration Statement) | |
| 3.2 | Articles of Amendment to Articles of Incorporation of Encore Bancshares, Inc. (incorporated herein by reference to Exhibit 3.2 to the S-1 Registration Statement) | |
| 3.3 | Statement of Designations establishing the terms of the Series A Preferred Stock of Encore Bancshares, Inc. (incorporated herein by reference to Exhibit 3.1 to Encore Bancshares, Inc.’s Current Report on Form 8-K filed on December 8, 2008) | |
| 3.4 | Amended and Restated Bylaws of Encore Bancshares, Inc. (incorporated herein by reference to Exhibit 3.3 to the S-1 Registration Statement) | |
| 4.1 | Form of specimen certificate representing shares of Encore Bancshares, Inc. common stock (incorporated herein by reference to Exhibit 4.1 to the S-1 Registration Statement) | |
| 4.2 | Warrant, dated December 5, 2008, to purchase 364,026 shares of Encore Bancshares, Inc.’s Common Stock (incorporated herein by reference to Exhibit 4.1 to Encore Bancshares, Inc.’s Current Report on Form 8-K filed on December 8, 2008) | |
| 4.3 | Form of Certificate for Encore Bancshares, Inc.’s Fixed Rate Cumulative Perpetual Preferred Stock, Series A, par value $1.00 per share (incorporated herein by reference to Exhibit 4.2 to Encore Bancshares, Inc.’s Current Report on Form 8-K filed on December 8, 2008) | |
| 10.1† | Encore Bancshares, Inc. 2000 Stock Incentive Plan, as amended (incorporated herein by reference to Exhibit 10.1 to the S-1 Registration Statement) | |
| 10.2† | Form of Encore Bancshares, Inc. Stock Option Award Terms and Conditions and corresponding notice (incorporated herein by reference to Exhibit 10.2 to the S-1 Registration Statement) | |
| 10.3†* | Form of Encore Bancshares, Inc. Restricted Stock Award Agreement and corresponding notice | |
| 10.4† | Encore Bancshares, Inc. 2008 Stock Awards and Incentive Plan (incorporated herein by reference to Exhibit 4.2 to Encore Bancshares, Inc.’s Registration Statement on Form S-8, Registration No. 333-150996 (the S-8 Registration Statement)) | |
86
Table of Contents
Index to Financial Statements
| Exhibit (1) |
Description | |
| 10.5† | Form of Encore Bancshares, Inc. Incentive Stock Option Agreement (incorporated herein by reference to Exhibit 4.3 to the S-8 Registration Statement) | |
| 10.6† | Form of Encore Bancshares, Inc. Nonqualified Stock Option Agreement (incorporated herein by reference to Exhibit 4.4 to the S-8 Registration Statement) | |
| 10.7†* | Form of Encore Bancshares, Inc. Restricted Stock Agreement | |
| 10.8†* | Form of Encore Bancshares, Inc. Long-Term Restricted Stock Agreement | |
| 10.9† | Executive Employment Agreement dated April 7, 2008 between William Reed Moraw and Town & Country Insurance Agency, Inc. (incorporated herein by reference to Exhibit 10.1 to Encore Bancshares, Inc.’s Quarterly Report on Form 10-Q for the quarter ended March 31, 2008) | |
| 10.10†* | Amended and Restated Letter Change-in-Control Agreement dated March 15, 2010 between James S. D’Agostino, Jr. and Encore Bancshares, Inc. | |
| 10.11† | Letter Employment Agreement dated January 29, 2010 between J. Harold Williams and Encore Bancshares, Inc. (incorporated herein by reference to Exhibit 10.1 to Encore Bancshares, Inc.’s Current Report on Form 8-K filed on February 3, 2010) | |
| 10.12† | Letter Employment Agreement dated January 29, 2010 between G. Walter Christopherson and Encore Bancshares, Inc. (incorporated herein by reference to Exhibit 10.2 to Encore Bancshares, Inc.’s Current Report on Form 8-K filed on February 3, 2010) | |
| 10.13†* | Amended and Restated Letter Change-in-Control Agreement dated March 15, 2010 between L. Anderson Creel and Encore Bancshares, Inc. | |
| 10.14†* | Letter Change-in-Control Agreement dated March 15, 2010 between Preston Moore and Encore Bancshares, Inc. | |
| 10.15†* | Letter Change-in-Control Agreement dated March 15, 2010 between Carmen A. Jordan and Encore Bancshares, Inc. | |
| 10.16†* | Letter Change-in-Control Agreement dated March 15, 2010 between Charles W. Jenness and Encore Bancshares, Inc. | |
| 10.17† | Form of Indemnity Agreement with directors of Encore Bancshares, Inc. (incorporated herein by reference to Exhibit 10.1 to Encore Bancshares, Inc.’s Current Report on Form 8-K filed on December 7, 2007) | |
| 10.18† | Form of Indemnity Agreement with directors of Encore Bank, N.A. (incorporated herein by reference to Exhibit 10.2 to Encore Bancshares, Inc.’s Current Report on Form 8-K filed on December 7, 2007) | |
| 10.19† | Form of Executive Compensation Letter Agreement with senior executive officers of Encore Bancshares, Inc. (incorporated herein by reference to Exhibit 10.3 to Encore Bancshares, Inc.’s Current Report on Form 8-K filed on December 8, 2008) | |
| 21.1 | List of Subsidiaries of Encore Bancshares, Inc. (incorporated herein by reference to Exhibit 21.1 to Encore Bancshares, Inc.’s Annual Report on Form 10-K for the year ended December 31, 2008) | |
| 23.1* | Consent of Grant Thornton LLP, independent registered public accounting firm. | |
| 31.1* | Certification of the Chief Executive Officer pursuant to Rule 13a-14(a) of the Securities Exchange Act of 1934, as amended. | |
| 31.2* | Certification of the Chief Financial Officer pursuant to Rule 13a-14(a) of the Securities Exchange Act of 1934, as amended. | |
87
Table of Contents
Index to Financial Statements
| Exhibit (1) |
Description | |
| 32.1** | Certification of the Chief Executive Officer and Chief Financial Officer pursuant to 18 U.S.C. Section 1350, adopted pursuant to Section 906 of the Sarbanes-Oxley Act of 2002. | |
| 99.1* | Certification of the Principal Executive Officer and Principal Financial Officer pursuant to Section 111(b)(4) of the Emergency Economic Stabilization Act of 2008. | |
| † | Management contract or compensatory plan arrangement. |
| * | Filed with this Annual Report on Form 10-K. |
| ** | Furnished with this Annual Report on Form 10-K. |
| (1) | Encore Bancshares, Inc. has other long term debt agreements that meet the exclusion set forth in Section 601(b)(4)(iii)(A) of Regulation S-K. We hereby agree to furnish a copy of such agreements to the Commission upon request. |
88
Table of Contents
Index to Financial Statements
Pursuant to the requirements of Section 13 or 15(d) of the Securities Exchange Act of 1934, the registrant has duly caused this report to be signed on its behalf by the undersigned, thereunto duly authorized.
| ENCORE BANCSHARES, INC. | ||||
| (Registrant) | ||||
| Dated: March 16, 2010 |
By: | /s/ James S. D’Agostino, Jr.
| ||
| James S. D’Agostino, Jr. | ||||
| Chairman of the Board and | ||||
| Chief Executive Officer | ||||
Pursuant to the requirements of the Securities Exchange Act of 1934, this report has been signed below by the following persons on behalf of the Registrant and in the capacities and on the dates indicated.
| Signature |
Title |
Date | ||
| /s/ James S. D’Agostino, Jr. James S. D’Agostino, Jr. |
Chairman of the Board and Chief Executive Officer (Principal Executive Officer) | March 16, 2010 | ||
| /s/ L. Anderson Creel L. Anderson Creel |
Executive Vice President and Chief Financial Officer (Principal Accounting and Financial Officer) | March 16, 2010 | ||
| /s/ Preston Moore Preston Moore |
Director and President | March 16, 2010 | ||
| /s/ Carin M. Barth Carin M. Barth |
Director | March 16, 2010 | ||
| /s/ G. Walter Christopherson G. Walter Christopherson |
Director | March 16, 2010 | ||
| /s/ Charles W. Jenness Charles W. Jenness |
Director | March 16, 2010 | ||
| /s/ John Bryan King John Bryan King |
Director | March 16, 2010 | ||
| /s/ Walter M. Mischer, Jr. Walter M. Mischer, Jr. |
Director | March 16, 2010 | ||
| /s/ Edwin E. Smith Edwin E. Smith |
Director | March 16, 2010 | ||
| /s/ Eugene H. Vaughan Eugene H. Vaughan |
Director | March 16, 2010 | ||
| /s/ David E. Warden David E. Warden |
Director | March 16, 2010 | ||
| /s/ Randa Duncan Williams Randa Duncan Williams |
Director | March 16, 2010 | ||
89
Table of Contents
Index to Financial Statements
INDEX TO CONSOLIDATED FINANCIAL STATEMENTS
| Consolidated Financial Statements |
||
| F-2 | ||
| Consolidated Balance Sheets as of December 31, 2009 and 2008 |
F-4 | |
| Consolidated Statements of Operations for the Years Ended December 31, 2009, 2008 and 2007 |
F-5 | |
| F-6 | ||
| Consolidated Statements of Cash Flows for the Years Ended December 31, 2009, 2008 and 2007 |
F-7 | |
| F-8 | ||
F-1
Table of Contents
Index to Financial Statements
REPORT OF INDEPENDENT REGISTERED PUBLIC ACCOUNTING FIRM
The Board of Directors and Shareholders of
Encore Bancshares, Inc.
We have audited the consolidated balance sheets of Encore Bancshares, Inc. (a Texas corporation) and subsidiaries (the Company) as of December 31, 2009 and 2008, and the related consolidated statements of operations, changes in shareholders’ equity and cash flows for each of the three years in the period ended December 31, 2009. These financial statements are the responsibility of the Company’s management. Our responsibility is to express an opinion on these financial statements based on our audits.
We conducted our audits in accordance with the standards of the Public Company Accounting Oversight Board (United States). Those standards require that we plan and perform the audit to obtain reasonable assurance about whether the financial statements are free of material misstatement. An audit also includes examining, on a test basis, evidence supporting the amounts and disclosures in the financial statements. An audit also includes assessing the accounting principles used and significant estimates made by management, as well as evaluating the overall financial statement presentation. We believe that our audits provide a reasonable basis for our opinion.
In our opinion, the consolidated financial statements referred to above present fairly, in all material respects, the financial position of Encore Bancshares, Inc. and subsidiaries as of December 31, 2009 and 2008, and the results of their operations and their cash flows for each of the three years in the period ended December 31, 2009, in conformity with accounting principles generally accepted in the United States of America.
As discussed in Note A to the consolidated financial statements, the Company changed their method of accounting for uncertainty in income taxes on January 1, 2007.
We have also audited, in accordance with the standards of the Public Company Accounting Oversight Board (United States), Encore Bancshares, Inc.’s internal control over financial reporting as of December 31, 2009, based on criteria established in Internal Control—Integrated Framework issued by the Committee of Sponsoring Organizations of the Treadway Commission (COSO) and our report dated March 16, 2010 expressed an unqualified opinion on the Company’s internal control over financial reporting.
/s/ Grant Thornton LLP
Houston, Texas
March 16, 2010
F-2
Table of Contents
Index to Financial Statements
REPORT OF INDEPENDENT REGISTERED PUBLIC ACCOUNTING FIRM
The Board of Directors and Shareholders of
Encore Banchshares, Inc.
We have audited Encore Bancshares, Inc.’s (a Texas Corporation) internal control over financial reporting as of December 31, 2009, based on criteria established in Internal Control—Integrated Framework issued by the Committee of Sponsoring Organizations of the Treadway Commission (COSO). Encore Bancshares, Inc.’s management is responsible for maintaining effective internal control over financial reporting and for its assessment of the effectiveness of internal control over financial reporting, included in the accompanying Management’s Report on Internal Control Over Financial Reporting. Our responsibility is to express an opinion on Encore Bancshares, Inc.’s internal control over financial reporting based on our audit.
We conducted our audit in accordance with the standards of the Public Company Accounting Oversight Board (United States). Those standards require that we plan and perform the audit to obtain reasonable assurance about whether effective internal control over financial reporting was maintained in all material respects. Our audit included obtaining an understanding of internal control over financial reporting, assessing the risk that a material weakness exists, testing and evaluating the design and operating effectiveness of internal control based on the assessed risk, and performing such other procedures as we considered necessary in the circumstances. We believe that our audit provides a reasonable basis for our opinion.
A company’s internal control over financial reporting is a process designed to provide reasonable assurance regarding the reliability of financial reporting and the preparation of financial statements for external purposes in accordance with generally accepted accounting principles. Because management’s assessment and our audit were conducted to also meet reporting requirements of Section 112 of the Federal Deposit Insurance Corporation Improvement Act (FDICIA), management’s assessment and our audit of Encore Bancshares, Inc.’s internal control over financial reporting included controls over the preparation of financial statements in accordance with the instructions to the Consolidated Financial Statements for Bank Holding Companies (Form FR Y-9C). A company’s internal control over financial reporting includes those policies and procedures that (1) pertain to the maintenance of records that, in reasonable detail, accurately and fairly reflect the transactions and dispositions of the assets of the company; (2) provide reasonable assurance that transactions are recorded as necessary to permit preparation of financial statements in accordance with generally accepted accounting principles, and that receipts and expenditures of the company are being made only in accordance with authorizations of management and directors of the company; and (3) provide reasonable assurance regarding prevention or timely detection of unauthorized acquisition, use, or disposition of the company’s assets that could have a material effect on the financial statements.
Because of its inherent limitations, internal control over financial reporting may not prevent or detect misstatements. Also, projections of any evaluation of effectiveness to future periods are subject to the risk that controls may become inadequate because of changes in conditions, or that the degree of compliance with the policies or procedures may deteriorate.
In our opinion, Encore Bancshares, Inc. maintained, in all material respects, effective internal control over financial reporting as of December 31, 2009, based on criteria established in Internal Control—Integrated Framework issued by COSO.
We also have audited, in accordance with the standards of the Public Company Accounting Oversight Board (United States), the consolidated balance sheets of Encore Bancshares, Inc. and subsidiaries as of December 31, 2009 and 2008, and the related consolidated statements of operations, changes in shareholders’ equity and cash flows for each of the three years in the period ended December 31, 2009, and our report dated March 16, 2010 expressed an unqualified opinion on those consolidated financial statements.
/s/ Grant Thornton LLP
Houston, Texas
March 16, 2010
F-3
Table of Contents
Index to Financial Statements
Encore Bancshares, Inc. and Subsidiaries
CONSOLIDATED BALANCE SHEETS
(Amounts in thousands, except per share amounts)
| December 31, | ||||||||
| 2009 | 2008 | |||||||
| ASSETS | ||||||||
| Cash and due from banks |
$ | 16,796 | $ | 23,044 | ||||
| Interest-bearing deposits in banks |
172,984 | 91,459 | ||||||
| Federal funds sold and other temporary investments |
7,396 | 3,549 | ||||||
| Cash and cash equivalents |
197,176 | 118,052 | ||||||
| Securities available-for-sale, at estimated fair value |
140,651 | 78,816 | ||||||
| Securities held-to-maturity, at amortized cost |
117,171 | 95,875 | ||||||
| Mortgages held-for-sale |
1,058 | 150 | ||||||
| Loans receivable |
1,078,205 | 1,218,404 | ||||||
| Allowance for loan losses |
(26,501 | ) | (25,105 | ) | ||||
| Net loans receivable |
1,051,704 | 1,193,299 | ||||||
| Federal Home Loan Bank of Dallas stock, at cost |
9,569 | 9,534 | ||||||
| Investment in real estate |
14,639 | 2,781 | ||||||
| Premises and equipment, net |
15,484 | 17,362 | ||||||
| Cash surrender value of life insurance policies |
15,339 | 14,686 | ||||||
| Goodwill |
35,799 | 27,873 | ||||||
| Other intangible assets, net |
5,351 | 6,031 | ||||||
| Accrued interest receivable and other assets |
31,414 | 23,385 | ||||||
| $ | 1,635,355 | $ | 1,587,844 | |||||
| LIABILITIES AND SHAREHOLDERS’ EQUITY | ||||||||
| Deposits: |
||||||||
| Noninterest-bearing |
$ | 174,102 | $ | 131,709 | ||||
| Interest-bearing |
1,017,734 | 969,088 | ||||||
| Total deposits |
1,191,836 | 1,100,797 | ||||||
| Borrowings and repurchase agreements |
220,612 | 272,026 | ||||||
| Junior subordinated debentures |
20,619 | 20,619 | ||||||
| Accrued interest payable and other liabilities |
15,620 | 8,660 | ||||||
| Total liabilities |
1,448,687 | 1,402,102 | ||||||
| Commitments and contingencies |
||||||||
| Shareholders’ equity: |
||||||||
| Preferred stock, $1 par value, 20,000 shares authorized; 34 shares issued at December 31, 2009 and 2008; aggregate liquidation preference of $34,222 in 2009 and $34,127 in 2008 |
28,976 | 28,461 | ||||||
| Common stock, $1 par value, 50,000 shares authorized; 10,527 shares at December 31, 2009 and 10,247 shares at December 31, 2008 issued |
10,527 | 10,247 | ||||||
| Additional paid-in capital |
116,084 | 115,489 | ||||||
| Retained earnings |
31,095 | 31,523 | ||||||
| Common stock in treasury, at cost (23 shares at December 31, 2009 and 6 shares at December 31, 2008) |
(233 | ) | (98 | ) | ||||
| Accumulated other comprehensive income |
219 | 120 | ||||||
| Total shareholders’ equity |
186,668 | 185,742 | ||||||
| $ | 1,635,355 | $ | 1,587,844 | |||||
The accompanying notes are an integral part of these statements.
F-4
Table of Contents
Index to Financial Statements
Encore Bancshares, Inc. and Subsidiaries
CONSOLIDATED STATEMENTS OF OPERATIONS
(Amounts in thousands, except per share amounts)
| Years Ended December 31, | ||||||||||||
| 2009 | 2008 | 2007 | ||||||||||
| Interest income: |
||||||||||||
| Loans, including fees |
$ | 67,901 | $ | 73,748 | $ | 67,999 | ||||||
| Mortgages held-for-sale |
105 | 79 | 3,733 | |||||||||
| Securities |
8,518 | 5,623 | 6,923 | |||||||||
| Federal funds sold and other temporary investments |
702 | 1,821 | 2,772 | |||||||||
| Total interest income |
77,226 | 81,271 | 81,427 | |||||||||
| Interest expense: |
||||||||||||
| Deposits |
21,013 | 27,871 | 38,659 | |||||||||
| Borrowings and repurchase agreements |
8,493 | 7,781 | 7,029 | |||||||||
| Junior subordinated debentures |
1,225 | 1,345 | 1,564 | |||||||||
| Total interest expense |
30,731 | 36,997 | 47,252 | |||||||||
| Net interest income |
46,495 | 44,274 | 34,175 | |||||||||
| Provision for loan losses |
16,660 | 29,175 | 4,029 | |||||||||
| Net interest income after provision for loan losses |
29,835 | 15,099 | 30,146 | |||||||||
| Noninterest income: |
||||||||||||
| Trust and investment management fees |
16,894 | 17,329 | 17,546 | |||||||||
| Mortgage banking |
653 | 251 | 5,506 | |||||||||
| Insurance commissions and fees |
5,477 | 5,681 | 5,942 | |||||||||
| Net gain (loss) on sale of available-for-sale securities |
2,324 | (3 | ) | (181 | ) | |||||||
| Impairment write down on securities |
— | (1,984 | ) | — | ||||||||
| Other |
1,989 | 1,671 | 2,090 | |||||||||
| Total noninterest income |
27,337 | 22,945 | 30,903 | |||||||||
| Noninterest expense: |
||||||||||||
| Compensation |
30,163 | 29,317 | 30,117 | |||||||||
| Occupancy |
6,050 | 6,045 | 5,764 | |||||||||
| Equipment |
1,695 | 1,960 | 2,076 | |||||||||
| Advertising and promotion |
807 | 842 | 1,018 | |||||||||
| Outside data processing |
3,173 | 2,970 | 3,479 | |||||||||
| Professional fees |
4,017 | 3,470 | 2,046 | |||||||||
| Intangible amortization |
681 | 749 | 838 | |||||||||
| Loss on early debt extinguishment |
— | — | 391 | |||||||||
| FDIC assessment |
2,115 | 161 | 118 | |||||||||
| Foreclosed real estate expenses, net |
1,503 | 645 | (62 | ) | ||||||||
| Other |
4,220 | 4,847 | 4,759 | |||||||||
| Total noninterest expense |
54,424 | 51,006 | 50,544 | |||||||||
| Net earnings (loss) before income taxes |
2,748 | (12,962 | ) | 10,505 | ||||||||
| Income tax expense (benefit) |
962 | (4,888 | ) | 3,121 | ||||||||
| Net earnings (loss) |
$ | 1,786 | $ | (8,074 | ) | $ | 7,384 | |||||
| Earnings (loss) available to common shareholders |
$ | (428 | ) | $ | (8,240 | ) | $ | 7,384 | ||||
| Earnings (loss) per common share: |
||||||||||||
| Basic |
$ | (0.04 | ) | $ | (0.81 | ) | $ | 0.83 | ||||
| Diluted |
(0.04 | ) | (0.81 | ) | 0.78 | |||||||
| Average common shares outstanding |
10,381 | 10,205 | 8,888 | |||||||||
| Diluted average common shares outstanding |
10,381 | 10,205 | 9,471 | |||||||||
The accompanying notes are an integral part of these statements.
F-5
Table of Contents
Index to Financial Statements
Encore Bancshares, Inc. and Subsidiaries
CONSOLIDATED STATEMENTS OF CHANGES IN SHAREHOLDERS’ EQUITY
Years Ended December 31, 2007, 2008 and 2009
(Amounts in thousands)
| Preferred Stock |
Common Stock | Additional Paid-in Capital |
Retained Earnings |
Common Stock in Treasury |
Accumulated Other Comprehensive Income (Loss) |
Total Shareholders’ Equity |
||||||||||||||||||||||||
| Shares | Amount | |||||||||||||||||||||||||||||
| Balance at January 1, 2007 |
$ | — | 7,016 | $ | 7,016 | $ | 57,585 | $ | 32,529 | $ | (69 | ) | $ | (1,650 | ) | $ | 95,411 | |||||||||||||
| Reclassification of puttable common stock |
— | 774 | 774 | 9,492 | — | — | — | 10,266 | ||||||||||||||||||||||
| Adoption of FASB ASC 740 |
— | — | — | — | (150 | ) | — | — | (150 | ) | ||||||||||||||||||||
| Stock-based compensation cost recognized in earnings |
— | — | — | 1,131 | — | — | — | 1,131 | ||||||||||||||||||||||
| Issuance of common shares in public offering, net of costs |
— | 2,191 | 2,191 | 39,214 | — | — | — | 41,405 | ||||||||||||||||||||||
| Issuance of common shares for exercise of options |
— | 84 | 84 | 696 | — | — | — | 780 | ||||||||||||||||||||||
| Issuance of restricted stock |
— | 75 | 75 | (75 | ) | — | — | — | — | |||||||||||||||||||||
| Forfeitures of restricted stock |
— | (12 | ) | (12 | ) | 12 | — | — | — | — | ||||||||||||||||||||
| Excess tax benefit from stock-based compensation |
— | — | — | 118 | — | — | — | 118 | ||||||||||||||||||||||
| Comprehensive income: |
||||||||||||||||||||||||||||||
| Net earnings |
— | — | — | — | 7,384 | — | — | 7,384 | ||||||||||||||||||||||
| Change in net unrealized loss on securities available-for-sale, net of deferred tax expense of $636 and reclassification adjustment |
— | — | — | — | — | — | 1,134 | 1,134 | ||||||||||||||||||||||
| Total comprehensive income |
8,518 | |||||||||||||||||||||||||||||
| Balance at December 31, 2007 |
— | 10,128 | 10,128 | 108,173 | 39,763 | (69 | ) | (516 | ) | 157,479 | ||||||||||||||||||||
| Stock-based compensation cost recognized in earnings |
— | — | — | 1,235 | — | — | — | 1,235 | ||||||||||||||||||||||
| Issuance of preferred stock and common stock warrants |
28,422 | — | — | 5,578 | — | — | — | 34,000 | ||||||||||||||||||||||
| Issuance of common shares for exercise of options |
— | 48 | 48 | 454 | — | — | — | 502 | ||||||||||||||||||||||
| Issuance of restricted stock |
— | 79 | 79 | (79 | ) | — | — | — | — | |||||||||||||||||||||
| Forfeitures of restricted stock |
— | (8 | ) | (8 | ) | 8 | — | — | — | — | ||||||||||||||||||||
| Excess tax benefit from stock-based compensation |
— | — | — | 120 | — | — | — | 120 | ||||||||||||||||||||||
| Purchase of treasury stock (2 shares) |
— | — | — | — | — | (29 | ) | — | (29 | ) | ||||||||||||||||||||
| Comprehensive income (loss): |
||||||||||||||||||||||||||||||
| Net loss |
— | — | — | — | (8,074 | ) | — | — | (8,074 | ) | ||||||||||||||||||||
| Change in net unrealized loss on securities available-for-sale, net of deferred tax expense of $358 and reclassification adjustment |
— | — | — | — | — | — | 636 | 636 | ||||||||||||||||||||||
| Total comprehensive income (loss) |
(7,438 | ) | ||||||||||||||||||||||||||||
| Dividend on preferred stock and amortization of preferred stock discount |
39 | — | — | — | (166 | ) | — | — | (127 | ) | ||||||||||||||||||||
| Balance at December 31, 2008 |
28,461 | 10,247 | 10,247 | 115,489 | 31,523 | (98 | ) | 120 | 185,742 | |||||||||||||||||||||
| Stock-based compensation cost recognized in earnings |
— | — | — | 1,018 | — | — | — | 1,018 | ||||||||||||||||||||||
| Issuance of restricted stock |
— | 297 | 297 | (297 | ) | — | — | — | — | |||||||||||||||||||||
| Forfeitures of restricted stock |
— | (17 | ) | (17 | ) | 17 | — | — | — | — | ||||||||||||||||||||
| Excess tax expense from stock-based compensation |
— | — | — | (143 | ) | — | — | — | (143 | ) | ||||||||||||||||||||
| Purchase of treasury stock (17 shares) |
— | — | — | — | — | (135 | ) | — | (135 | ) | ||||||||||||||||||||
| Comprehensive income: |
||||||||||||||||||||||||||||||
| Net earnings |
— | — | — | — | 1,786 | — | — | 1,786 | ||||||||||||||||||||||
| Change in net unrealized gain on securities available-for-sale, net of deferred tax expense of $115 and reclassification adjustment |
— | — | — | — | — | — | 99 | 99 | ||||||||||||||||||||||
| Total comprehensive income |
1,885 | |||||||||||||||||||||||||||||
| Dividends on preferred stock and amortization of preferred stock discount |
515 | — | — | — | (2,214 | ) | — | — | (1,699 | ) | ||||||||||||||||||||
| Balance at December 31, 2009 |
$ | 28,976 | 10,527 | $ | 10,527 | $ | 116,084 | $ | 31,095 | $ | (233 | ) | $ | 219 | $ | 186,668 | ||||||||||||||
The accompanying notes are an integral part of these statements.
F-6
Table of Contents
Index to Financial Statements
Encore Bancshares, Inc. and Subsidiaries
CONSOLIDATED STATEMENTS OF CASH FLOWS
(Amounts in thousands)
| Years Ended December 31, | ||||||||||||
| 2009 | 2008 | 2007 | ||||||||||
| Cash flows from operating activities: |
||||||||||||
| Net earnings (loss) |
$ | 1,786 | $ | (8,074 | ) | $ | 7,384 | |||||
| Adjustments to reconcile net earnings (loss) to net cash provided by operating activities: |
||||||||||||
| Provision for loan losses |
16,660 | 29,175 | 4,029 | |||||||||
| Amortization of premiums and discounts, net |
804 | 1,292 | 1,624 | |||||||||
| Stock-based compensation |
1,018 | 1,235 | 1,131 | |||||||||
| Depreciation |
2,870 | 2,800 | 2,494 | |||||||||
| Gain on sale of loans |
(518 | ) | (162 | ) | (4,949 | ) | ||||||
| (Gain) loss on sale of foreclosed real estate |
356 | 164 | (34 | ) | ||||||||
| Realized (gain) loss on sales of available-for-sale securities, net |
(2,324 | ) | 3 | 181 | ||||||||
| Impairment write down on securities |
— | 1,984 | — | |||||||||
| Loss on early debt extinguishment |
— | — | 391 | |||||||||
| Increase in mortgages held-for-sale |
(48,913 | ) | (24,025 | ) | (173,776 | ) | ||||||
| Proceeds from sale of mortgage loans |
48,523 | 25,449 | 235,098 | |||||||||
| Federal Home Loan Bank of Dallas stock dividends |
(25 | ) | (199 | ) | (353 | ) | ||||||
| Increase in value of life insurance policies |
(653 | ) | (595 | ) | (540 | ) | ||||||
| Deferred income tax benefit |
(1,361 | ) | (6,732 | ) | (2,216 | ) | ||||||
| Excess tax benefit from stock-based compensation |
— | (120 | ) | (118 | ) | |||||||
| (Increase) decrease in accrued interest receivable |
75 | 617 | (81 | ) | ||||||||
| Increase in other assets |
(6,586 | ) | (749 | ) | (99 | ) | ||||||
| Increase (decrease) in accrued interest payable |
(117 | ) | 252 | (170 | ) | |||||||
| Increase (decrease) in other liabilities |
(942 | ) | (49 | ) | 346 | |||||||
| Net cash provided by operating activities |
10,653 | 22,266 | 70,342 | |||||||||
| Cash flows from investing activities: |
||||||||||||
| Purchases of available-for-sale securities |
(258,494 | ) | (72,430 | ) | (16,727 | ) | ||||||
| Principal collected on available-for-sale securities |
21,941 | 4,418 | 14,933 | |||||||||
| Proceeds from sales of available-for-sale securities |
176,855 | 150 | 71,071 | |||||||||
| Purchases of held-to-maturity securities |
(62,137 | ) | (1,129 | ) | — | |||||||
| Principal collected on held-to-maturity securities |
41,118 | 39,027 | 30,406 | |||||||||
| Proceeds from sales of held-to-maturity securities |
— | — | 7,414 | |||||||||
| Acquisition of real estate |
(1,917 | ) | — | — | ||||||||
| Proceeds from sales of foreclosed real estate |
4,796 | 2,628 | 1,331 | |||||||||
| Cash paid for acquisition |
— | (33 | ) | (73 | ) | |||||||
| Loan purchases |
— | — | (26,371 | ) | ||||||||
| Proceeds from sales of loans receivable |
— | 55 | — | |||||||||
| Loan originations and principal collections, net |
108,732 | (141,630 | ) | (161,591 | ) | |||||||
| Purchases of Federal Home Loan Bank stock |
(10 | ) | (4,477 | ) | (3,661 | ) | ||||||
| Redemption of Federal Home Loan Bank stock |
— | 1,022 | 5,853 | |||||||||
| Purchases of premises and equipment |
(297 | ) | (2,877 | ) | (7,746 | ) | ||||||
| Net cash provided (used) by investing activities |
30,587 | (175,276 | ) | (85,161 | ) | |||||||
| Cash flows from financing activities: |
||||||||||||
| Net increase in deposits |
91,039 | 59,423 | 10,563 | |||||||||
| Decrease in short term Federal Home Loan Bank of Dallas borrowings |
— | — | (55,000 | ) | ||||||||
| Proceeds from long term Federal Home Loan Bank of Dallas borrowings |
— | 115,000 | 85,000 | |||||||||
| Repayment of long term Federal Home Loan Bank of Dallas borrowings |
(47 | ) | (25,015 | ) | (25,000 | ) | ||||||
| Increase (decrease) in repurchase agreements |
(51,305 | ) | 8,831 | (3,152 | ) | |||||||
| Payments on notes payable |
(62 | ) | (185 | ) | (185 | ) | ||||||
| Proceeds from issuance of junior subordinated debentures |
— | — | 15,464 | |||||||||
| Retirement of junior subordinated debentures |
— | — | (15,855 | ) | ||||||||
| Excess tax benefit from stock-based compensation |
— | 120 | 118 | |||||||||
| Proceeds from issuance of preferred stock and common stock warrants |
— | 34,000 | — | |||||||||
| Proceeds from issuance of common stock, net of purchase of treasury stock |
(135 | ) | 473 | 42,185 | ||||||||
| Preferred dividends paid |
(1,606 | ) | — | — | ||||||||
| Net cash provided by financing activities |
37,884 | 192,647 | 54,138 | |||||||||
| Net increase in cash and cash equivalents |
79,124 | 39,637 | 39,319 | |||||||||
| Cash and cash equivalents at beginning of year |
118,052 | 78,415 | 39,096 | |||||||||
| Cash and cash equivalents at end of year |
$ | 197,176 | $ | 118,052 | $ | 78,415 | ||||||
| Supplementary cash flows information: |
||||||||||||
| Interest paid on deposits and borrowed funds |
$ | 30,848 | $ | 36,745 | $ | 47,422 | ||||||
| Income taxes paid |
1,035 | 3,602 | 4,958 | |||||||||
| Noncash operating, investing and financing activities: |
||||||||||||
| Real estate acquired in satisfaction of loans |
15,788 | 5,192 | 837 | |||||||||
| Reclassification of puttable common stock |
— | — | 10,266 | |||||||||
| Accrual of contingent consideration |
7,926 | — | — | |||||||||
The accompanying notes are an integral part of these statements.
F-7
Table of Contents
Index to Financial Statements
Encore Bancshares, Inc. and Subsidiaries
NOTES TO CONSOLIDATED FINANCIAL STATEMENTS
December 31, 2009, 2008 and 2007
(Amounts in thousands, except per share amounts)
NOTE A—SUMMARY OF SIGNIFICANT ACCOUNTING POLICIES
A summary of our significant accounting policies applied in the preparation of the accompanying financial statements follows. Our accounting principles and the methods of applying them are in conformity with both accounting principles generally accepted in the United States of America (US GAAP) and prevailing practices of the banking industry.
Basis of Presentation
Encore Bancshares, Inc. is a financial holding company that was formed on March 28, 2000 as Guardian Holdings, Inc. and had no operations until it acquired GSF Holding, Inc., now known as Encore Holdings, Inc. (Encore Holdings), and its wholly-owned subsidiary, Guardian Savings and Loan Association effective September 30, 2000. Guardian Savings and Loan Association, a federally chartered savings institution, changed its name to Guardian Savings Bank effective September 28, 2000 and then to Encore Bank (the Bank) effective September 1, 2001. The Bank converted from a federal savings association to a national banking association effective March 30, 2007 and changed its name to Encore Bank, National Association. In connection with the conversion, we became a bank holding company and Encore Holdings was merged into Encore Bancshares, Inc. As part of a corporate reorganization following the conversion of the Bank to a national banking association, as of June 30, 2007, the Bank was merged with and into Encore Trust Company, N.A. (Encore Trust). The resulting bank, which was renamed Encore Bank, National Association (Encore Bank), operates as a national banking association with its main office in Houston, Texas. Since the merger, the business of Encore Trust is being conducted as a division of Encore Bank. Our election to become a financial holding company was effective July 21, 2008.
Principles of Consolidation
The accompanying consolidated financial statements include the accounts of Encore Bancshares, Inc. (we, the Company or our), Encore Bank, Linscomb & Williams, Inc. (Linscomb & Williams), and Town & Country Insurance Agency, Inc. (Town & Country). All significant intercompany balances and transactions have been eliminated.
Nature of Operations
We are primarily in the business of attracting deposits and investing these funds in loans and securities, as well as providing trust and investment management services and property and casualty insurance products.
We provide a variety of financial services through our seventeen private client offices located in the greater Houston area and southwest Florida, and five wealth management offices and three insurance offices in Texas. Our product offerings, places of business and service delivery are positioned to best meet the needs of professional firms, privately-owned businesses, investors and affluent individuals.
Use of Estimates
The preparation of financial statements in conformity with US GAAP requires us to make estimates and assumptions that affect the reported amounts of assets and liabilities and disclosure of contingent assets and liabilities at the dates of the financial statements and the reported amounts of revenue and expenses during the reported periods. Actual results could differ from those estimates. Material estimates that we consider particularly susceptible to significant change in the near term relate to the determination of the allowance for loan losses, the valuation of deferred tax assets, and the valuation of goodwill and other intangible assets.
F-8
Table of Contents
Index to Financial Statements
Encore Bancshares, Inc. and Subsidiaries
NOTES TO CONSOLIDATED FINANCIAL STATEMENTS
December 31, 2009, 2008 and 2007
(Amounts in thousands, except per share amounts)
Cash and Cash Equivalents
Cash and cash equivalents include cash, demand deposits at other financial institutions, federal funds sold and certificates of deposit that have an initial or remaining maturity when purchased of three months or less.
Securities
Securities are classified among two categories at the time the securities are purchased: held-to-maturity and available-for-sale. We reassess these classifications periodically. We do not hold trading securities.
Debt securities that we have the positive intent and ability to hold to maturity are classified as “held-to-maturity” and recorded at amortized cost. Debt securities that we might not hold until maturity and marketable equity securities are classified as “available-for-sale” and recorded at fair value, with unrealized gains and losses, after applicable taxes, excluded from earnings and reported in other comprehensive income. Marketable equity securities without a readily determinable market value are classified as “available-for-sale” and recorded at cost.
We recognize purchase premiums and discounts on securities in interest income using the interest method over the contractual lives, adjusted for actual prepayments. Declines in the fair value of cost basis, held-to-maturity and available-for-sale securities below their cost that are deemed to be other than temporary are reflected in earnings as realized losses. In estimating other than temporary impairment losses, we consider (1) the length of time and the extent to which the fair value has been less than cost, (2) the financial condition and near-term prospects of the issuer, (3) whether we intend to sell the security, and (4) if we do not intend to sell the security, whether it is more likely than not we will be required to sell the security before the recovery of its amortized cost. Gains and losses on the sale of securities are recorded on the trade date and are determined using the specific identification method.
Loans Receivable
Loans that we have the intent and ability to hold for the foreseeable future or until maturity or pay-off generally are reported at their outstanding unpaid principal balances adjusted for the allowance for loan losses, and any deferred fees or costs on originated loans. We accrue interest income on the unpaid principal balance. Loan origination fees, net of certain direct origination costs, are deferred and recognized as an adjustment of the related loan yield using the interest method. Discounts and premiums on loans purchased are amortized to income using the interest method over the remaining period to contractual maturity, adjusted for prepayments. We have not purchased loans with evidence of deterioration of credit quality for which it was probable, at acquisition, that we will be unable to collect all contractually required payments receivable.
The accrual of interest on loans is discontinued when, in management’s opinion, the borrower may be unable to meet payment obligations as they become due, as well as when required by regulatory provisions. When the interest accrual is discontinued, all unpaid interest is charged off against interest income. Subsequently, we recognize income only to the extent cash payments are received until, in our judgment, the borrower’s ability to make periodic interest and principal payments are reasonably assured, in which case the loan is returned to accrual status. We typically charge off loans no later than 120 days past due unless the loan is well secured and in process of collection. However, we charge off all loans when the loan principal and interest is deemed not collectible.
F-9
Table of Contents
Index to Financial Statements
Encore Bancshares, Inc. and Subsidiaries
NOTES TO CONSOLIDATED FINANCIAL STATEMENTS
December 31, 2009, 2008 and 2007
(Amounts in thousands, except per share amounts)
Allowance for Loan Losses
We consider a loan impaired when, based on current information and events, it is probable that we will be unable to collect the scheduled payments of principal and interest when due according to the contractual terms of the loan agreement. We generally consider a period of delay in payment to include delinquency up to 90 days. We measure impaired loans and related allowance for loan losses based on the present value of expected future cash flows discounted at the loan’s effective interest rate or based on the fair value of the collateral if the loan is collateral dependent. Loans without a specific reserve are collectively evaluated for impairment based on, among other things, historical loss experience, the growth, composition and diversification of the loan portfolio, general economic conditions and nonperforming and loan classification trends.
We charge the provision for losses on loans to operations based on our periodic evaluation of the adequacy of the allowance for loan losses. We may ultimately incur losses different from our current estimates. We report adjustments to the allowance for loan losses in the period such adjustments become known or can be reasonably estimated.
Mortgages Held-for-Sale
We carry mortgages held-for-sale at the lower of cost or estimated fair value in the aggregate. Fair value is based on commitments on hand from investors or prevailing market prices. Gains and losses on sales are recorded in noninterest income and determined on a specific identification basis.
Insurance Commissions and Fees
We recognize commission revenue as of the effective date of the insurance policy or the date the customer is billed, whichever is later. We also receive contingent commissions from insurance companies as additional incentive for achieving specified premium volume goals and/or the loss experience of the insurance placed by us. We recognize contingent commissions from insurance companies when determinable, which is generally when such commissions are received or when we receive data from the insurance companies that allows the reasonable estimation of these amounts. We record commission adjustments, including policy cancellations and override commissions, when the adjustments become reasonably estimable, which is generally in the period in which they occur.
Assets Under Administration and Asset Management Fees
We do not include assets held in fiduciary or agency capacities in the consolidated balance sheets, since such items are not our assets.
We record fees from asset management activities on the accrual basis, over the period in which the service is provided. Our fees are a function of the market value of assets administered and managed, the volume of transactions, and fees for other services rendered, as set forth in the underlying client agreement. This revenue recognition involves the use of estimates and assumptions, including components that are calculated based on estimated asset valuations and transaction volumes.
F-10
Table of Contents
Index to Financial Statements
Encore Bancshares, Inc. and Subsidiaries
NOTES TO CONSOLIDATED FINANCIAL STATEMENTS
December 31, 2009, 2008 and 2007
(Amounts in thousands, except per share amounts)
Off-Balance-Sheet Credit Related Financial Instruments
In the ordinary course of business, we have entered into commitments to extend credit, including commitments under commercial lines of credit and letters of credit. We record these financial instruments when they are funded. We maintain a reserve that covers estimated credit losses on these commitments which is generally based on the historical loss factors for each type of loan commitment. This reserve is included in other liabilities, with any increases or decreases to the reserve included in noninterest expense.
Investment in Real Estate
We initially record real estate acquired in settlement of loans at fair value at the date of foreclosure, establishing a new cost basis. Fair value is defined as the amount of cash or cash equivalent value of other consideration that a real estate parcel would yield in a current sale between a willing buyer and a willing seller—that is, in other than a forced or liquidation sale, less selling costs. Subsequent to foreclosure, we perform periodic valuations and the real estate is carried at the lower of its carrying amount or fair value less selling costs. Subsequent declines in value below the new cost basis are recorded through the use of a valuation allowance with a charge to other noninterest expense. Subsequent increases in value up to the amount of the valuation allowance are included in other noninterest expense. Required development costs associated with foreclosed property under construction are capitalized. Operating expenses, net of related income, and gains and losses on disposition are included in other noninterest expense. Recognition of gain on sale of real estate is dependent upon the transaction meeting certain criteria relating to the nature of the property sold and the terms of the sale. Under certain circumstances, the gain, or a portion thereof, is deferred until the necessary criteria are met. At December 31, 2009 and 2008, investment in real estate held for sale consisted of real estate acquired in settlement of loans of $14,639 and $2,781.
Federal Home Loan Bank of Dallas Stock
Federal Home Loan Bank of Dallas (FHLB) stock is a restricted investment security, carried at cost, and evaluated for impairment. Both cash and stock dividends received on FHLB stock are reported as income.
Premises and Equipment
Land is carried at cost. We record buildings, leasehold improvements and equipment at cost and we depreciate using the straight-line method over the estimated useful lives of the assets ranging from 1.5 to 30 years. Leasehold improvements are depreciated over the shorter of the estimated life of the asset or the lease term including option periods where failure to renew results in an economic penalty. Capitalized costs, including interest, related to the construction of facilities are depreciated over the shorter of the estimated life of the asset or the lease term of the facility. Maintenance and repairs are charged to appropriate expense accounts in the period incurred. Material improvements are capitalized and depreciated over their estimated useful lives. The cost and accumulated depreciation relating to assets retired or otherwise disposed of are eliminated from the accounts, and any resulting gains or losses are credited or charged to income.
We record premises and equipment to be disposed of at the lower of the carrying amount or estimated fair value less selling costs. Any loss due to the write down of assets is recognized currently in the consolidated statements of operations.
F-11
Table of Contents
Index to Financial Statements
Encore Bancshares, Inc. and Subsidiaries
NOTES TO CONSOLIDATED FINANCIAL STATEMENTS
December 31, 2009, 2008 and 2007
(Amounts in thousands, except per share amounts)
Goodwill
Goodwill is recorded when the purchase price is higher than the fair value of net assets acquired in a business combination. Goodwill is not amortized, but is tested for impairment at least annually.
Other Intangible Assets
Other intangible assets are acquired assets that lack physical substance but can be distinguished from goodwill because of contractual or other legal rights or because the asset is capable of being sold or exchanged either on its own or in combination with a related contract, asset, or liability. Our intangible assets relate to client relationships. Other intangibles are amortized using accelerated methods over their estimated useful lives, ranging from 15 to 20 years. We review these intangibles for impairment whenever events or changes in circumstances indicate that their carrying values may not be recoverable.
Advertising Costs
We expense advertising costs as incurred.
Derivatives and Hedging Activities
We may enter into derivative contracts in order to hedge the risk of market interest rate changes on certain assets and liabilities and other firm commitments. On the date a derivative contract is entered into, it is designated a fair value hedge, a cash flow hedge or does not receive a hedging designation in accordance with FASB ASC 815, Derivatives and Hedging. A fair value hedge hedges exposure to changes in the fair value of an asset, liability or firm commitment due to their fixed rate terms. Changes in the fair value of the hedging instrument are included in other comprehensive income for the effective portion of the hedge and are offset by changes in the fair value of the hedged item. The net effect resulting from the ineffective portion of a hedging instrument is reflected in earnings. A cash flow hedge hedges exposure to the variability in cash flows associated with an existing asset or liability or a forecasted transaction due to their variable terms. The effective portion of changes in the fair value of the hedging instrument is included in accumulated other comprehensive income and is subsequently reclassified into earnings as the hedged item impacts earnings. Any ineffective portion is recognized in current earnings. If the derivative contract is not given a hedging designation, the change in fair value of the contract is recognized currently in earnings. At December 31, 2009 and 2008, we had no derivative instruments outstanding.
Income Taxes
We determine deferred income tax assets and liabilities using the balance sheet method, as clarified by FASB ASC 740. Under this method, the net deferred tax asset or liability is determined based on the tax effects of the temporary differences between the book and tax bases of the various balance sheet assets and liabilities and gives current recognition to changes in tax rates and laws. Valuation allowances are established when necessary to reduce deferred tax assets to the amount expected to be realized. FASB ASC 740 requires that we recognize the financial statement benefit of a tax position only after determining that the relevant tax authority would more likely than not sustain the position following an audit. For tax positions meeting the more-likely-than-not threshold, the amount recognized in the financial statements is the largest benefit that has a greater than 50 percent likelihood of being realized upon ultimate settlement with the relevant tax authority.
F-12
Table of Contents
Index to Financial Statements
Encore Bancshares, Inc. and Subsidiaries
NOTES TO CONSOLIDATED FINANCIAL STATEMENTS
December 31, 2009, 2008 and 2007
(Amounts in thousands, except per share amounts)
Encore Bank is included in our consolidated federal income tax return. Under a tax sharing policy, federal income tax expense is allocated to individual subsidiaries as if the tax was calculated on a separate return basis. Federal income tax benefits are allocated to individual subsidiaries to the extent the deductions are utilized in the consolidated return.
Stock-Based Compensation
We measure and recognize compensation expense for all stock-based payments at fair value in accordance with FASB ASC 718, Compensation—Stock Compensation.
Comprehensive Income
US GAAP generally requires that recognized revenue, expenses, gains and losses be included in net earnings. Although certain changes in assets and liabilities, such as unrealized gains and losses on available-for-sale securities, are reported as a separate component of the equity section of the balance sheet, such items, along with net earnings, are components of comprehensive income.
The changes in the components of other comprehensive income (loss) are as follows:
| 2009 | 2008 | 2007 | ||||||||||
| Unrealized holding gains (losses) on available-for-sale securities arising during period |
$ | (2,110 | ) | $ | 997 | $ | 1,951 | |||||
| Reclassification adjustment for gains (losses) included in income |
2,324 | (3 | ) | (181 | ) | |||||||
| Net pre-tax gain recognized in other comprehensive income |
214 | 994 | 1,770 | |||||||||
| Tax expense |
(115 | ) | (358 | ) | (636 | ) | ||||||
| Net-of-tax impact on comprehensive income |
$ | 99 | $ | 636 | $ | 1,134 | ||||||
Fair Values of Financial Instruments
We estimate the fair value of financial instruments based on the fair value hierarchy established in FASB ASC 820, Fair Value Measurements and Disclosures. Fair value estimates involve uncertainties and matters of judgment regarding interest rates, credit risk, prepayments, and other factors, especially in the absence of bench marks for particular items. Changes in assumptions or in market conditions could significantly affect the estimates. For more information on the fair value of our financial instruments, see Note R—Fair Value of Assets and Liabilities.
Transfer of Financial Assets
Transfers of financial assets are accounted for as sales when we surrender control over the assets. Control over transferred assets is deemed to be surrendered when (i) the assets have been isolated from us, (ii) the transferee obtains the right to pledge or exchange the transferred assets, and (iii) we do not maintain effective control over the transferred assets through an agreement to repurchase them before their maturity.
F-13
Table of Contents
Index to Financial Statements
Encore Bancshares, Inc. and Subsidiaries
NOTES TO CONSOLIDATED FINANCIAL STATEMENTS
December 31, 2009, 2008 and 2007
(Amounts in thousands, except per share amounts)
Basic and Diluted Earnings (Loss) Per Common Share
We calculate basic earnings (loss) per common share using earnings (loss) available to common shareholders (net earnings (loss) after deducting preferred dividends) divided by the weighted average of common shares outstanding during the period, including nonvested restricted stock. Diluted earnings per common share include the dilutive effect of stock options granted, using the treasury stock method, and contingent share-based consideration related to our acquisition of Linscomb & Williams.
Loss Contingencies
We record loss contingencies, including claims and legal actions arising in the ordinary course of business, as liabilities when the likelihood of loss is probable and the amount or range of loss can be reasonably estimated.
Reclassifications
In 2009, we reclassified net expenses of foreclosed real estate from other noninterest income to noninterest expense for all periods presented. These reclassifications had no impact on financial condition, results of operations or equity in any of the reported periods.
Adoption of Updates to the FASB Codification
On January 1, 2009, we adopted the following updates to the FASB Codification:
FASB ASC 260, Earnings Per Share, provides that unvested share-based payment awards that contain nonforfeitable rights to dividends or dividend equivalents (whether paid or unpaid) are participating securities and shall be included in the computation of earnings per share pursuant to the two-class method. We determined that our outstanding nonvested restricted stock awards are participating securities. Accordingly, earnings per common share is computed using the two-class method prescribed by FASB ASC 260. In accordance with the adoption of the provisions of this standard, all previously reported earnings per common share data has been retrospectively adjusted to conform to the new computation method.
FASB ASC 805, Business Combinations, provides additional guidance regarding the recognition, measurement and disclosure of assets and liabilities arising from contingencies in a business combination. FASB ASC 805 is effective for assets or liabilities arising from contingencies we acquire in business combinations occurring after January 1, 2009. The adoption of FASB ASC 805 had no effect on our consolidated financial statements; however, the future effect is dependant upon whether we make any acquisitions and the specifics of those acquisitions.
FASB ASC 810, Consolidation, establishes accounting and reporting standards for the noncontrolling interest in a subsidiary and for the deconsolidation of a subsidiary. In addition, FASB ASC 810 also includes expanded disclosure requirements regarding the interests of the parent and its noncontrolling interest. The adoption of FASB ASC 810 did not have a material effect on our consolidated financial statements.
Subsequent to January 1, 2009, we adopted the following updates to the FASB Codification:
FASB ASC 855, Subsequent Events, issued in May 2009, establishes general standards of accounting for and disclosure of events that occur after the balance sheet date but before financial statements are issued or are
F-14
Table of Contents
Index to Financial Statements
Encore Bancshares, Inc. and Subsidiaries
NOTES TO CONSOLIDATED FINANCIAL STATEMENTS
December 31, 2009, 2008 and 2007
(Amounts in thousands, except per share amounts)
available to be issued. The adoption of FASB ASC 855 did not have a material effect on our consolidated financial statements; however, any future effect is dependent on the occurrence of subsequent events that fall under the scope of this standard.
FASB ASC 825-10-65 amends FASB ASC 825, Financial Instruments, to require an entity to provide disclosures about fair value of financial instruments at interim reporting periods. Under FASB ASC 825-10-65, a publicly traded company shall include disclosures about the fair value of its financial instruments whenever it issues summarized financial information for interim reporting periods. In addition, entities must disclose, in the body or in the accompanying notes of its summarized financial information for interim reporting periods and in its financial statements for annual reporting periods, the fair value of all financial instruments for which it is practicable to estimate that value, whether recognized or not recognized in the statement of financial position.
FASB ASC 820, Fair Value Measurements and Disclosures, affirms that the objective of fair value when the market for an asset is not active is the price that would be received to sell the asset in an orderly transaction, and clarifies and includes additional factors for determining whether there has been a significant decrease in market activity for an asset when the market for that asset is not active. FASB ASC 820 requires an entity to base its conclusion about whether a transaction was not orderly on the weight of the evidence and expands certain disclosure requirements. FASB ASC 820 is effective for interim and annual periods ending after June 15, 2009, and shall be applied prospectively. The adoption of FASB ASC 820 did not have a material effect on our consolidated financial statements.
FASB ASC 320, Investments—Debt and Equity Securities, (i) changes existing guidance for determining whether an impairment of a debt security is other than temporary and (ii) replaces the existing requirement that the entity’s management assert it has both the intent and ability to hold an impaired security until recovery with a requirement that management assert: (a) it does not have the intent to sell the security; and (b) it is more likely than not it will not have to sell the security before recovery of its cost basis. Under FASB ASC 320, declines in the fair value of held-to-maturity and available-for-sale debt securities below their cost that are deemed to be other than temporary are reflected in earnings as realized losses to the extent the impairment is related to credit losses. The amount of the impairment related to other factors is recognized in other comprehensive income. The adoption of FASB ASC 320 did not have a material effect on our consolidated financial statements.
F-15
Table of Contents
Index to Financial Statements
Encore Bancshares, Inc. and Subsidiaries
NOTES TO CONSOLIDATED FINANCIAL STATEMENTS
December 31, 2009, 2008 and 2007
(Amounts in thousands, except per share amounts)
NOTE B—SECURITIES AVAILABLE-FOR-SALE AND SECURITIES HELD-TO-MATURITY
Securities available-for-sale and held-to-maturity consisted of the following:
| Amortized Cost |
Gross Unrealized Gains |
Gross Unrealized Losses |
Fair Value | ||||||||||
| December 31, 2009 |
|||||||||||||
| Available-for-sale: |
|||||||||||||
| U.S. Government securities |
$ | 87,258 | $ | 117 | $ | (554 | ) | $ | 86,821 | ||||
| Securities of U.S. states and political subdivisions |
646 | — | (31 | ) | 615 | ||||||||
| Mortgage-backed securities |
45,275 | 926 | (64 | ) | 46,137 | ||||||||
| Other securities |
4,410 | 12 | (36 | ) | 4,386 | ||||||||
| Total |
137,589 | 1,055 | (685 | ) | 137,959 | ||||||||
| Marketable equity securities |
2,523 | 169 | — | 2,692 | |||||||||
| Total available-for-sale securities |
$ | 140,112 | $ | 1,224 | $ | (685 | ) | $ | 140,651 | ||||
| Held-to-maturity: |
|||||||||||||
| U.S. Government securities |
$ | 29,918 | $ | 57 | $ | (16 | ) | $ | 29,959 | ||||
| Securities of U.S. states and political subdivisions |
11,436 | 289 | (82 | ) | 11,643 | ||||||||
| Mortgage-backed securities |
57,868 | 759 | (13 | ) | 58,614 | ||||||||
| Other securities |
17,949 | 1,725 | — | 19,674 | |||||||||
| Total held-to-maturity securities |
$ | 117,171 | $ | 2,830 | $ | (111 | ) | $ | 119,890 | ||||
| December 31, 2008 |
|||||||||||||
| Available-for-sale: |
|||||||||||||
| Mortgage-backed securities |
$ | 71,897 | $ | 712 | $ | — | $ | 72,609 | |||||
| Other securities |
4,202 | — | (60 | ) | 4,142 | ||||||||
| Total |
76,099 | 712 | (60 | ) | 76,751 | ||||||||
| Marketable equity securities |
2,016 | 49 | — | 2,065 | |||||||||
| Total available-for-sale securities |
$ | 78,115 | $ | 761 | $ | (60 | ) | $ | 78,816 | ||||
| Held-to-maturity: |
|||||||||||||
| Mortgage-backed securities |
$ | 95,875 | $ | 1,057 | $ | (4 | ) | $ | 96,928 | ||||
F-16
Table of Contents
Index to Financial Statements
Encore Bancshares, Inc. and Subsidiaries
NOTES TO CONSOLIDATED FINANCIAL STATEMENTS
December 31, 2009, 2008 and 2007
(Amounts in thousands, except per share amounts)
We own certain debt securities with unrealized losses as of December 31, 2009 and 2008. These securities, with unrealized losses segregated by length of impairment at year end, were as follows:
| Description of Securities |
Number of Securities |
Fair Value |
Unrealized Losses |
||||||
| December 31, 2009 |
|||||||||
| Less than 12 months |
|||||||||
| Available-for-sale: |
|||||||||
| U.S. Government securities |
6 | $ | 29,054 | $ | (554 | ) | |||
| Securities of U.S. states and political subdivisions |
1 | 615 | (31 | ) | |||||
| Mortgage-backed securities |
2 | 8,353 | (64 | ) | |||||
| Total available-for-sale securities |
9 | $ | 38,022 | $ | (649 | ) | |||
| Held-to-maturity: |
|||||||||
| U.S. Government securities |
1 | $ | 4,966 | $ | (16 | ) | |||
| Securities of U.S. states and political subdivisions |
5 | 1,910 | (82 | ) | |||||
| Total held-to-maturity securities |
6 | $ | 6,876 | $ | (98 | ) | |||
| More than 12 months |
|||||||||
| Available-for-sale: |
|||||||||
| Other securities |
2 | $ | 498 | $ | (36 | ) | |||
| Held-to-maturity: |
|||||||||
| Mortgage-backed securities |
5 | $ | 789 | $ | (13 | ) | |||
| December 31, 2008: |
|||||||||
| Less than 12 months |
|||||||||
| Available-for-sale: |
|||||||||
| Other securities |
1 | $ | 310 | $ | (38 | ) | |||
| Held-to-maturity: |
|||||||||
| Federal agency mortgage-backed securities |
2 | $ | 536 | $ | (1 | ) | |||
| More than 12 months |
|||||||||
| Available-for-sale: |
|||||||||
| Other securities |
1 | $ | 165 | $ | (22 | ) | |||
| Held-to-maturity: |
|||||||||
| Federal agency mortgage-backed securities |
3 | $ | 287 | $ | (3 | ) | |||
We do not believe any of the above securities are impaired due to credit quality. These securities have unrealized losses primarily due to changes in market interest rates. We expect to recover the entire amortized cost of these securities since we do not intend to sell the securities. Additionally, it is more likely than not that we will not be required to sell these securities before recovery of our cost basis. Accordingly, as of December 31, 2009 and 2008, we believe the impairments detailed in the table are temporary and no impairment loss has been recorded in the accompanying consolidated statements of operations.
F-17
Table of Contents
Index to Financial Statements
Encore Bancshares, Inc. and Subsidiaries
NOTES TO CONSOLIDATED FINANCIAL STATEMENTS
December 31, 2009, 2008 and 2007
(Amounts in thousands, except per share amounts)
The following table shows the amortized cost and estimated fair value of securities by contractual maturity at December 31, 2009. Contractual maturities may differ from expected maturities because borrowers may have the right to call or prepay obligations with or without call or prepayment schedules. Mortgage-backed securities and equity securities are shown separately since they are not due at a single maturity date.
| Available-for-Sale Securities |
Held-to-Maturity Securities | |||||||||||
| Amortized Cost |
Fair Value |
Amortized Cost |
F air Value | |||||||||
| Within one year |
$ | 3,505 | $ | 3,513 | $ | — | $ | — | ||||
| Over one year through five years |
26,499 | 26,541 | 25,535 | 26,362 | ||||||||
| After five years through ten years |
54,409 | 53,861 | 12,382 | 13,313 | ||||||||
| Over ten years |
4,026 | 4,019 | 21,386 | 21,601 | ||||||||
| Total |
88,439 | 87,934 | 59,303 | 61,276 | ||||||||
| Mortgage-backed and equity securities |
51,673 | 52,717 | 57,868 | 58,614 | ||||||||
| Total securities |
$ | 140,112 | $ | 140,651 | $ | 117,171 | $ | 119,890 | ||||
Mortgage-backed securities consist of federal agency pass-through securities and have a weighted average yield of 3.31% and 4.05% at December 31, 2009 and 2008. As of December 31, 2009, the mortgage-backed securities have contractual maturities from less than a year to 2038. Accrued interest receivable on mortgage-backed securities was $350 and $637 at December 31, 2009 and 2008.
At December 31, 2009 and 2008, securities with a carrying value of $47,954 and $75,698 were pledged as collateral for repurchase agreements, public funds, trust deposits, and for other purposes, as required or permitted by law.
Gross realized gains on sales of available-for-sale securities were $2,535, $0 and $24 for the years ended December 31, 2009, 2008 and 2007. Gross realized losses on sales of available-for-sale securities were $211, $3 and $217 for the years ended December 31, 2009, 2008 and 2007. Gross realized gains and losses on sales of held-to-maturity securities were $24 and $12 in 2007 and none in 2009 and 2008. In 2008, we recorded a $1,984 impairment write down on an available-for-sale equity security acquired in connection with our Community Reinvestment Act requirements.
Mortgage-backed securities previously classified as available-for-sale were transferred to held-to-maturity during 2004. The amortized cost and fair value at the time of transfer were $127,049 and $128,782. The securities were transferred at fair value and the unrealized gain net of tax was recorded in accumulated other comprehensive income. Amortization of unrealized gain was $376, $236 and $76 for the years ended December 31, 2009, 2008 and 2007.
F-18
Table of Contents
Index to Financial Statements
Encore Bancshares, Inc. and Subsidiaries
NOTES TO CONSOLIDATED FINANCIAL STATEMENTS
December 31, 2009, 2008 and 2007
(Amounts in thousands, except per share amounts)
NOTE C—LOANS RECEIVABLE
Loans receivable at December 31 consisted of the following:
| 2009 | 2008 | |||||
| Commercial: |
||||||
| Commercial |
$ | 115,431 | $ | 135,534 | ||
| Commercial real estate (1) |
259,480 | 228,732 | ||||
| Real estate construction (1) |
87,008 | 178,845 | ||||
| Total commercial |
461,919 | 543,111 | ||||
| Consumer: |
||||||
| Residential real estate first lien |
222,337 | 241,969 | ||||
| Residential real estate second lien |
291,433 | 302,141 | ||||
| Home equity lines |
74,356 | 82,555 | ||||
| Consumer installment—indirect |
8,372 | 14,409 | ||||
| Consumer other |
19,788 | 34,219 | ||||
| Total consumer |
616,286 | 675,293 | ||||
| Total loans receivable |
$ | 1,078,205 | $ | 1,218,404 | ||
| (1) | As of December 31, 2009, land loans were reclassified from commercial real estate to real estate construction for all periods. |
Included in loans receivable is $3,123 and $3,348 of net deferred loan origination costs and unamortized premium and discount at December 31, 2009 and 2008. Consumer other loans include client overdrafts of $235 and $331 as of December 31, 2009 and 2008.
Changes in the allowance for loan losses were as follows for the years ended December 31:
| 2009 | 2008 | 2007 | ||||||||||
| Balance at beginning of year |
$ | 25,105 | $ | 11,161 | $ | 9,056 | ||||||
| Provision for loan losses |
16,660 | 29,175 | 4,029 | |||||||||
| Loans charged-off |
(18,652 | ) | (15,824 | ) | (2,613 | ) | ||||||
| Recoveries of loans previously charged-off |
3,388 | 593 | 689 | |||||||||
| Balance at December 31, |
$ | 26,501 | $ | 25,105 | $ | 11,161 | ||||||
Accrued interest receivable on loans was $3,941 and $4,802 at December 31, 2009 and 2008.
F-19
Table of Contents
Index to Financial Statements
Encore Bancshares, Inc. and Subsidiaries
NOTES TO CONSOLIDATED FINANCIAL STATEMENTS
December 31, 2009, 2008 and 2007
(Amounts in thousands, except per share amounts)
The following is a summary of information pertaining to impaired and nonaccrual loans at December 31:
| 2009 | 2008 | 2007 | |||||||
| Impaired loans on nonaccrual without a valuation allowance |
$ | 20,032 | $ | 10,408 | $ | — | |||
| Impaired loans on nonaccrual with a valuation allowance |
14,591 | 15,272 | 6,901 | ||||||
| Impaired loans still accruing with a valuation allowance |
530 | — | — | ||||||
| Total impaired loans (1) |
$ | 35,153 | $ | 25,680 | $ | 6,901 | |||
| Valuation allowance related to impaired loans |
$ | 6,264 | $ | 7,288 | $ | 2,581 | |||
| Total nonaccrual loans |
$ | 35,988 | $ | 30,531 | $ | 11,208 | |||
| Total accruing loans past due 90 days or more |
$ | 1,489 | $ | 646 | $ | 2,183 | |||
| Average investment in impaired loans for the years ended December 31 |
$ | 34,888 | $ | 20,770 | $ | 6,857 | |||
| (1) | Does not include consumer loans which are not evaluated separately for impairment. |
At December 31, 2009, impaired loans on nonaccrual with a valuation allowance consisted of $1,791 commercial, $10,414 commercial real estate, $886 real estate construction and $1,500 residential real estate first lien. Interest income recognized after a loan is impaired is not material. No additional funds are committed to be advanced in connection with impaired loans.
NOTE D—PREMISES AND EQUIPMENT
Premises and equipment at December 31 was comprised of the following:
| Life in Years | 2009 | 2008 | ||||||||
| Land |
$ | 1,849 | $ | 1,849 | ||||||
| Building |
30 years | 4,662 | 4,663 | |||||||
| Furniture and equipment |
3-10 years | 8,181 | 7,942 | |||||||
| Leasehold improvements |
1.5-20 years | 12,550 | 12,718 | |||||||
| Construction in progress—facilities |
195 | 202 | ||||||||
| 27,437 | 27,374 | |||||||||
| Accumulated depreciation |
(11,953 | ) | (10,012 | ) | ||||||
| $ | 15,484 | $ | 17,362 | |||||||
F-20
Table of Contents
Index to Financial Statements
Encore Bancshares, Inc. and Subsidiaries
NOTES TO CONSOLIDATED FINANCIAL STATEMENTS
December 31, 2009, 2008 and 2007
(Amounts in thousands, except per share amounts)
During 2005, we moved our corporate headquarters and entered into a sublease, classified as an operating lease from February 2007 and ending December 2014. We do not have the option to renew the sublease at the end of the lease term. Certain other offices and branch locations are operated as leased premises. We have the option to renew certain of these leases upon the completion of the non-cancelable lease term. The cost of lease extensions is not included below. Rental expense under operating lease agreements in 2009, 2008 and 2007 was approximately $2,843, $2,938 and $3,044. Lease cost is recognized on a straight-line basis over the lease term. Future minimum rental commitments associated with these leases are as follows:
| Years Ended December 31, |
Amount | ||
| 2010 |
$ | 2,965 | |
| 2011 |
2,717 | ||
| 2012 |
2,084 | ||
| 2013 |
1,730 | ||
| 2014 |
1,491 | ||
| Thereafter |
3,538 | ||
| $ | 14,525 | ||
NOTE E—GOODWILL AND OTHER INTANGIBLE ASSETS
We have reporting segments with goodwill, which are insurance in the amount of $3,092 and wealth management in the amount of $32,707. During the year ended December 31, 2009, goodwill increased $7,926 within the wealth management reporting segment due to the accrual of contingent consideration for Linscomb & Williams. In the first quarter of 2010, $2,095 cash was paid and 696 shares of common stock will be issued to settle this accrued consideration.
Each reporting segment is tested for impairment at least annually. The fair value of each of the reporting segments is established using appropriate weighted market and income approaches. Our impairment tests indicate that an impairment charge was not required.
The changes in the carrying amount of goodwill for the years ended December 31, 2009 and 2008 are as follows:
| 2009 | 2008 | ||||||
| Balance as of January 1 |
$ | 27,873 | $ | 27,942 | |||
| Goodwill from business combinations |
— | 33 | |||||
| Adjustment to purchase price |
7,926 | (102 | ) | ||||
| Impairment losses |
— | — | |||||
| Balance as of December 31 |
$ | 35,799 | $ | 27,873 | |||
Other intangible assets as of December 31, 2009 and 2008 are detailed in the following table:
| 2009 | 2008 | |||||||||||||||||||
| Gross Carrying Amount |
Accumulated Amortization |
Net Carrying Amount |
Gross Carrying Amount |
Accumulated Amortization |
Net Carrying Amount | |||||||||||||||
| Amortizing intangible assets: |
||||||||||||||||||||
| Client relationships |
$ | 9,419 | $ | (4,068 | ) | $ | 5,351 | $ | 9,419 | $ | (3,388 | ) | $ | 6,031 | ||||||
F-21
Table of Contents
Index to Financial Statements
Encore Bancshares, Inc. and Subsidiaries
NOTES TO CONSOLIDATED FINANCIAL STATEMENTS
December 31, 2009, 2008 and 2007
(Amounts in thousands, except per share amounts)
Estimated amortization expense for the following years ended December 31 is as follows:
| 2010 |
$ | 634 | |
| 2011 |
564 | ||
| 2012 |
520 | ||
| 2013 |
483 | ||
| 2014 |
451 |
NOTE F—DEPOSITS
Interest-bearing deposits at December 31 are as follows:
| 2009 | 2008 | |||||
| Interest checking |
$ | 211,174 | $ | 197,384 | ||
| Money market and savings |
294,840 | 252,571 | ||||
| Time deposits less than $100 |
191,372 | 188,302 | ||||
| Time deposits $100 and greater |
298,163 | 274,903 | ||||
| Brokered deposits |
22,185 | 55,928 | ||||
| Total interest-bearing deposits |
$ | 1,017,734 | $ | 969,088 | ||
At December 31, 2009, the scheduled maturities of time and brokered deposits are as follows:
| 2010 |
$ | 354,334 | |
| 2011 |
98,059 | ||
| 2012 |
25,003 | ||
| 2013 |
16,624 | ||
| 2014 |
17,700 | ||
| Thereafter |
— | ||
| $ | 511,720 | ||
Interest expense by type of deposit for the years ended December 31 is as follows:
| 2009 | 2008 | 2007 | |||||||
| Interest checking |
$ | 888 | $ | 2,515 | $ | 5,131 | |||
| Money market and savings |
2,976 | 5,759 | 14,756 | ||||||
| Time deposits |
16,370 | 18,763 | 18,172 | ||||||
| Brokered deposits |
779 | 834 | 600 | ||||||
| $ | 21,013 | $ | 27,871 | $ | 38,659 | ||||
We are required to maintain average cash balances on hand or with the Federal Reserve Bank. At December 31, 2009 and 2008, these reserve balances amounted to $3,203 and $2,579.
F-22
Table of Contents
Index to Financial Statements
Encore Bancshares, Inc. and Subsidiaries
NOTES TO CONSOLIDATED FINANCIAL STATEMENTS
December 31, 2009, 2008 and 2007
(Amounts in thousands, except per share amounts)
NOTE G—BORROWINGS AND REPURCHASE AGREEMENTS
Subject to certain limitations, we may borrow funds from the FHLB in the form of advances. Our credit availability from the FHLB is based on our financial and operating condition and the amount of collateral available to the FHLB. These borrowings were collateralized by a blanket lien on our mortgage-related assets. Following is a summary of outstanding borrowings from the FHLB at December 31, 2009:
| Amount | Interest Rate Range | Maturity Date Range | Call Date | |||||||
| $ | 17,000 | 3.43-3.98 | % | 01/11/11-06/27/11 | None | |||||
| 35,500 | 3.66-4.22 | 01/11/12-09/04/12 | None | |||||||
| 59,500 | 3.54-4.37 | 01/11/13-11/26/13 | None | |||||||
| 2,938 | 4.79 | 08/03/15 | None | |||||||
| 10,000 | 4.14 | 12/07/16 | 06/07/10 | |||||||
| 10,000 | 4.23 | 04/05/17 | 04/05/10 | |||||||
| 15,000 | 4.17 | 04/05/17 | 04/05/10 | |||||||
| 10,000 | 4.52 | 05/09/17 | 05/09/10 | |||||||
| 50,000 | 4.15 | 08/01/17 | 05/01/10 | |||||||
| $ | 209,938 | |||||||||
Each advance is payable per terms of the agreement. We are eligible to borrow up to an additional $298,908 at December 31, 2009.
We also have borrowed funds from clients in the form of repurchase agreements. As of December 31, 2009, we had $10,674 outstanding at an interest rate of 0.10% maturing January 4, 2010.
During 2009, the maximum amount of repurchase agreements outstanding at any month end and the daily average amount outstanding were $47,486 and $21,677.
The contractual maturities of borrowings and repurchase agreements at December 31, 2009 are as follows:
| 2010 |
$ | 10,674 | |
| 2011 |
17,000 | ||
| 2012 |
35,500 | ||
| 2013 |
59,500 | ||
| 2015 |
2,938 | ||
| 2016 |
10,000 | ||
| 2017 |
85,000 | ||
| $ | 220,612 | ||
There can be significant penalties for the early pay-off of FHLB borrowings. There were no early debt extinguishments related to these borrowings during 2009, 2008 or 2007.
F-23
Table of Contents
Index to Financial Statements
Encore Bancshares, Inc. and Subsidiaries
NOTES TO CONSOLIDATED FINANCIAL STATEMENTS
December 31, 2009, 2008 and 2007
(Amounts in thousands, except per share amounts)
NOTE H—INCOME TAXES
Allocation of federal and state income taxes between current and deferred portions for the years ended December 31 is as follows:
| 2009 | 2008 | 2007 | ||||||||||
| Current tax provision |
||||||||||||
| Federal |
$ | 1,940 | $ | 1,673 | $ | 5,529 | ||||||
| State |
379 | 292 | 256 | |||||||||
| 2,319 | 1,965 | 5,785 | ||||||||||
| Deferred tax benefit |
||||||||||||
| Federal |
(1,319 | ) | (6,657 | ) | (2,590 | ) | ||||||
| State |
(38 | ) | (196 | ) | (74 | ) | ||||||
| (1,357 | ) | (6,853 | ) | (2,664 | ) | |||||||
| $ | 962 | $ | (4,888 | ) | $ | 3,121 | ||||||
The reasons for the differences between the amounts computed by applying the statutory federal income tax rate of 34% in 2009, 35% in 2008 and 2007 and the reported income tax expense (benefit) for the years ended December 31 are summarized below:
| 2009 | 2008 | 2007 | ||||||||||
| Income tax expense (benefit) computed at federal statutory rate |
$ | 934 | $ | (4,537 | ) | $ | 3,677 | |||||
| State income tax expense, net of federal effect |
234 | 190 | 101 | |||||||||
| Tax exempt interest income |
(400 | ) | (296 | ) | (335 | ) | ||||||
| Increase in cash surrender value |
(222 | ) | (208 | ) | (189 | ) | ||||||
| Adjustment to recognition and measurement of tax positions |
— | — | (150 | ) | ||||||||
| Adjustment to prior period |
263 | — | — | |||||||||
| Other |
153 | (37 | ) | 17 | ||||||||
| Income tax expense (benefit), as reported |
$ | 962 | $ | (4,888 | ) | $ | 3,121 | |||||
F-24
Table of Contents
Index to Financial Statements
Encore Bancshares, Inc. and Subsidiaries
NOTES TO CONSOLIDATED FINANCIAL STATEMENTS
December 31, 2009, 2008 and 2007
(Amounts in thousands, except per share amounts)
The components of net deferred tax assets and liabilities included in accrued interest receivable and other assets are as follows at December 31:
| 2009 | 2008 | |||||
| Deferred tax assets: |
||||||
| Premises and equipment |
$ | 943 | $ | 815 | ||
| Allowance for loan losses |
9,465 | 8,751 | ||||
| Deferred revenues |
432 | 442 | ||||
| Stock-based compensation |
1,324 | 1,359 | ||||
| Nonaccrual interest |
303 | 182 | ||||
| Other |
891 | 1,134 | ||||
| Total deferred tax assets |
13,358 | 12,683 | ||||
| Deferred tax liabilities: |
||||||
| Other intangible assets |
981 | 1,209 | ||||
| Gain on sale of assets |
299 | 363 | ||||
| Federal Home Loan Bank of Dallas stock |
402 | 650 | ||||
| Net unrealized gain on available-for-sale securities |
140 | 67 | ||||
| Total deferred tax liabilities |
1,822 | 2,289 | ||||
| Net deferred tax assets |
$ | 11,536 | $ | 10,394 | ||
We have determined that a valuation allowance is not required for any of the deferred tax assets since it is more likely than not that these assets will be realized because they are supported by recoverable taxes paid in prior years, future reversals of existing temporary differences and to a lesser extent, anticipated future taxable income and tax planning strategies.
We had no penalties or interest accrued at December 31, 2009. The effective tax rate for the year ended December 31, 2009, was 35.0% as compared to 37.7% in 2008.
At January 1, 2007, the total amount of unrecognized tax benefits was $1,023, none of which was related to tax benefits that, if recognized, would affect the annual effective tax rate. During the third quarter of 2007, we recognized the full amount of these unrecognized tax benefits when we filed for an application for an accounting method change with the IRS. A reconciliation of the beginning and ending amount of unrecognized tax benefits is as follows:
| Balance at January 1, 2007 |
$ | 1,023 | ||
| Settlements |
(1,023 | ) | ||
| Balance at December 31, 2007 |
$ | — | ||
We had no unrecognized tax benefits for the years ended December 31, 2009 and 2008.
We file income tax returns in U.S. federal and various state and local taxing jurisdictions. In general, we are no longer subject to income tax examinations for years prior to 2006. We have elected to recognize both interest and penalties as a component of income tax expense.
F-25
Table of Contents
Index to Financial Statements
Encore Bancshares, Inc. and Subsidiaries
NOTES TO CONSOLIDATED FINANCIAL STATEMENTS
December 31, 2009, 2008 and 2007
(Amounts in thousands, except per share amounts)
NOTE I—REGULATORY MATTERS AND DIVIDENDS FROM SUBSIDIARIES
Regulatory Capital Compliance
We and Encore Bank are subject to various regulatory capital adequacy requirements administered by the Board of Governors of the Federal Reserve System (Federal Reserve) and the Office of the Comptroller of the Currency (OCC). Actual and minimum total risk-based, Tier 1 risk-based and Tier 1 leverage ratios as of December 31, 2009 and 2008, are set forth in the following table:
| Actual | For Capital Adequacy Purposes |
To Be Categorized as Well Capitalized Under Prompt Corrective Action Provisions |
||||||||||||||||
| Amount | Ratio | Amount | Ratio | Amount | Ratio | |||||||||||||
| December 31, 2009 |
||||||||||||||||||
| Tier 1 capital (to average assets) |
||||||||||||||||||
| Tier 1 (leverage) |
||||||||||||||||||
| Encore Bancshares, Inc. |
$ | 166,276 | 10.55 | % | $ | 63,061 | 4.00 | % | N/A | N/A | ||||||||
| Encore Bank, N.A. |
143,479 | 9.11 | 63,010 | 4.00 | $ | 78,762 | 5.00 | % | ||||||||||
| Tier 1 capital (to risk-based assets) |
||||||||||||||||||
| Encore Bancshares, Inc. |
$ | 166,276 | 14.80 | % | $ | 44,932 | 4.00 | % | N/A | N/A | ||||||||
| Encore Bank, N.A. |
143,479 | 12.72 | 45,117 | 4.00 | $ | 67,676 | 6.00 | % | ||||||||||
| Total capital (to risk-based assets) |
||||||||||||||||||
| Encore Bancshares, Inc. |
$ | 180,478 | 16.07 | % | $ | 89,863 | 8.00 | % | N/A | N/A | ||||||||
| Encore Bank, N.A. |
157,673 | 13.98 | 90,235 | 8.00 | $ | 112,793 | 10.00 | % | ||||||||||
| December 31, 2008 |
||||||||||||||||||
| Tier 1 capital (to average assets) |
||||||||||||||||||
| Tier 1 (leverage) |
||||||||||||||||||
| Encore Bancshares, Inc. |
$ | 172,927 | 11.61 | % | $ | 59,567 | 4.00 | % | N/A | N/A | ||||||||
| Encore Bank, N.A. |
120,150 | 8.08 | 59,463 | 4.00 | $ | 74,329 | 5.00 | % | ||||||||||
| Tier 1 capital (to risk-based assets) |
||||||||||||||||||
| Encore Bancshares, Inc. |
$ | 172,927 | 14.58 | % | $ | 47,448 | 4.00 | % | N/A | N/A | ||||||||
| Encore Bank, N.A. |
120,150 | 10.16 | 47,308 | 4.00 | $ | 70,962 | 6.00 | % | ||||||||||
| Total capital (to risk-based assets) |
||||||||||||||||||
| Encore Bancshares, Inc. |
$ | 187,890 | 15.84 | % | $ | 94,896 | 8.00 | % | N/A | N/A | ||||||||
| Encore Bank, N.A. |
135,051 | 11.42 | 94,616 | 8.00 | $ | 118,270 | 10.00 | % | ||||||||||
As of the most recent notification from the OCC, Encore Bank was categorized as well capitalized under the regulatory framework for prompt corrective action. To be categorized well capitalized, Encore Bank must maintain minimum Tier 1 leverage, Tier 1 risk-based capital, and total risk-based capital ratios as set forth in the above table. As part of Encore Bank’s conversion to a national bank, the OCC required that Encore Bank meet certain additional capital requirements. Specifically, as of December 31, 2008, Encore Bank was required to have a leverage ratio of at least 7.75%.
F-26
Table of Contents
Index to Financial Statements
Encore Bancshares, Inc. and Subsidiaries
NOTES TO CONSOLIDATED FINANCIAL STATEMENTS
December 31, 2009, 2008 and 2007
(Amounts in thousands, except per share amounts)
Dividend Policy
Federal law places limitations on the amount that national banks may pay in dividends, which Encore Bank must adhere to when paying dividends to us. Encore Bank’s current practice is not to pay any dividends, except to cover our expenses. See Note K for further restrictions on dividends.
NOTE J—STOCK-BASED COMPENSATION
Our shareholders approved a stock awards and incentive plan in 2008 (2008 Stock Awards and Incentive Plan) and a stock incentive plan in 2000 (2000 Stock Incentive Plan) which authorize the issuance of up to 2,150 shares of common stock under “incentive stock” and “nonqualified stock” options, stock appreciation rights, restricted stock awards, performance awards and phantom stock awards. The general terms of awards under the 2008 Stock Awards and Incentive Plan and the 2000 Stock Incentive Plan shall be specified by the Compensation Committee of the Board of Directors at the date of grant. At December 31, 2009, all options granted under the 2000 Stock Incentive Plan have a maximum term of 10 years, and vest on the third anniversary of the grant date. No options have been granted under the 2008 Stock Awards and Incentive Plan.
Stock Options
The fair value of options granted is estimated on the date of grant using the Black-Scholes option-pricing model. This model requires input of highly subjective assumptions, changes to which can materially affect the fair value estimate. Additionally, there may be other factors that would otherwise have a significant effect on the value of employee stock options granted but not considered by the model. No options were granted in 2009, 2008 or 2007.
As a result of applying the provisions of FASB ASC 718 during the years ended December 31, 2009, 2008 and 2007, we recognized $0, $7 and $96 of compensation cost for employee stock options, net of forfeitures, in the accompanying consolidated statements of operations.
A summary of employee option activity as of December 31, 2009, and changes during the year then ended is as follows:
| Options |
Shares | Weighted Average Exercise Price |
Weighted Average Remaining Contractual Term |
Aggregate Intrinsic Value | |||||||
| Outstanding at January 1, 2009 |
740 | $ | 10.32 | ||||||||
| Forfeited |
(24 | ) | 12.52 | ||||||||
| Outstanding at December 31, 2009 |
716 | $ | 10.25 | 2.74 years | $ | 4 | |||||
| Vested |
716 | $ | 10.25 | 2.74 years | $ | 4 | |||||
| Exercisable at December 31, 2009 |
716 | $ | 10.25 | 2.74 years | $ | 4 | |||||
F-27
Table of Contents
Index to Financial Statements
Encore Bancshares, Inc. and Subsidiaries
NOTES TO CONSOLIDATED FINANCIAL STATEMENTS
December 31, 2009, 2008 and 2007
(Amounts in thousands, except per share amounts)
In addition, we have issued stock options under the 2000 Stock Incentive Plan to non-employees for various services rendered. The cost of these services was measured based on the estimated fair value of the award at date of grant. The estimated cost is recognized over the period the service was required to be rendered.
A summary of non-employee option activity as of December 31, 2009, and changes during the year then ended is as follows:
| Options |
Shares | Weighted Average Exercise Price |
Weighted Average Remaining Contractual Term |
Aggregate Intrinsic Value | ||||||
| Outstanding at January 1 and December 31, 2009 |
264 | $ | 8.31 | 1.71 years | $ | 5 | ||||
| Vested |
264 | $ | 8.31 | 1.71 years | $ | 5 | ||||
| Exercisable at December 31, 2009 |
264 | $ | 8.31 | 1.71 years | $ | 5 | ||||
We recognized $1 of compensation cost for non-employee stock options, net of forfeitures, in the accompanying consolidated statements of operations in 2007 and none in 2009 and 2008. The total intrinsic value of options exercised during the years ended December 31, 2009, 2008 and 2007 was $0, $356 and $551. Cash received from option exercises for the years ended December 31, 2009, 2008 and 2007 was $0, $502 and $780.
Share Awards
We also grant shares of restricted stock pursuant to our 2008 Stock Awards and Incentive Plan and our 2000 Stock Incentive Plan. These shares of restricted stock vest over a period of three to five years. We account for restricted stock grants by recording the fair value of the grant as compensation expense over the vesting period. Compensation expense related to restricted stock was $1,018, $1,228 and $1,034 for the years ended December 31, 2009, 2008 and 2007.
A summary of the status of our nonvested shares of restricted stock as of December 31, 2009, and changes during the year then ended is as follows:
| Nonvested Shares |
Shares | Weighted Average Grant Date Fair Value | ||||
| Outstanding at January 1, 2009 |
345 | $ | 15.41 | |||
| Granted |
297 | 8.53 | ||||
| Vested |
(93 | ) | 12.61 | |||
| Forfeited |
(17 | ) | 16.29 | |||
| Outstanding at December 31, 2009 |
532 | $ | 12.01 | |||
As of December 31, 2009, unrecognized compensation cost for all nonvested share-based compensation arrangements expected to vest, totaled $2,942 which is expected to be recognized over a weighted average remaining period of 2.93 years.
F-28
Table of Contents
Index to Financial Statements
Encore Bancshares, Inc. and Subsidiaries
NOTES TO CONSOLIDATED FINANCIAL STATEMENTS
December 31, 2009, 2008 and 2007
(Amounts in thousands, except per share amounts)
NOTE K—PREFERRED STOCK
We are authorized to issue 20,000 shares of preferred stock. The preferred stock (or other securities convertible in whole or in part into preferred stock) is available for issuance from time to time for various purposes, including, without limitation, making future acquisitions, raising additional equity capital and financing. Subject to certain limits set by our Articles of Incorporation, the preferred stock (or such convertible securities) may be issued on such terms and conditions, and at such times and in such situations, as the Board of Directors in its sole discretion determines to be appropriate, without any further approval or action by the shareholders (unless otherwise required by laws, rules, regulations or agreements applicable to us).
On December 5, 2008, we issued 34 shares of our Fixed Rate Cumulative Perpetual Preferred Stock, Series A, par value $1.00 per share, with a liquidation value of $1,000 per share (Series A Preferred Stock) and a warrant to purchase up to 364 shares of our common stock at an exercise price of $14.01 per share (Warrant) to the United States Department of the Treasury (Treasury) for an aggregate purchase price of $34,000 in cash. Cumulative dividends on the Series A Preferred Stock are paid quarterly and will accrue on the liquidation preference at a rate of 5% per annum for the first five years, and at a rate of 9% per annum thereafter. The Series A Preferred Stock has no maturity date and ranks senior to our common stock with respect to the payment of dividends and distributions and amounts payable upon liquidation, dissolution and winding up of the Company. The Series A Preferred Stock generally is non-voting.
The proceeds from Treasury were allocated based on the relative fair values of the Series A Preferred Stock and the Warrant. The fair value of the Series A Preferred Stock was determined using a market rate of 15.5% and the discount on the Series A Preferred Stock will be accreted to par value over a ten year period. The fair value of the Warrant was determined on issuance date using the Black-Scholes option-pricing model.
Pursuant to the Securities Purchase Agreement between us and Treasury, and as amended by the American Recovery and Reinvestment Act of 2009 (Recovery Act), we may redeem the Series A Preferred Stock in whole or in part, at par plus accrued and unpaid dividends after February 15, 2012. Prior to this date, we may redeem the Series A Preferred Stock, in whole or in part, at par plus accrued and unpaid dividends. Any redemption is subject to the approval of the Board of Governors of the Federal Reserve System. Additionally, the Recovery Act imposes new and more stringent limits on executive compensation for participants in the Capital Purchase Program. Treasury is required to promulgate regulations to implement these changes; however, until Treasury promulgates such regulations, it is unclear how exactly these changes will apply to participants in the Capital Purchase Program.
The Warrant is immediately exercisable and expires ten years after issuance. The number of shares of our common stock underlying the Warrant and the exercise price are subject to adjustment for certain dilutive events. Treasury has agreed not to exercise voting power with respect to any shares of common stock issued upon exercise of the Warrant. Until such time as Treasury ceases to own any of our debt or equity securities, compensation of certain of our executives will be limited.
In addition, we are restricted from paying any dividends on our Series A Preferred Stock if required payments on our outstanding junior subordinated debentures (Note Q) are not made or deferred. Beginning on December 5, 2008 and until December 5, 2011, or until we have redeemed the Series A Preferred Stock or Treasury has transferred the Series A Preferred Stock to a third party, the consent of Treasury will be required for us to declare or pay any dividend or make any distribution on our common stock. Also, as long as the Series A Preferred Stock is outstanding, dividend payments will be prohibited until all accrued and unpaid dividends are
F-29
Table of Contents
Index to Financial Statements
Encore Bancshares, Inc. and Subsidiaries
NOTES TO CONSOLIDATED FINANCIAL STATEMENTS
December 31, 2009, 2008 and 2007
(Amounts in thousands, except per share amounts)
paid on the Series A Preferred Stock, subject to certain limited exceptions. Furthermore, it is Federal Reserve policy that we inform and consult with them prior to declaring and paying a dividend that could raise safety and soundness concerns, including dividends on the Series A Preferred Stock issued to Treasury under the Capital Purchase Program or interest on the subordinated debentures underlying our trust preferred securities.
NOTE L—INITIAL PUBLIC OFFERING
In July 2007, we completed our initial public offering of 1,905 shares of common stock at $21.00 per share. In August 2007, our underwriters exercised their over-allotment option for an additional 286 shares of common stock, also at $21.00 per share. Our common shares are listed on the NASDAQ Global Market under the symbol “EBTX”.
Our net proceeds, including the over-allotment shares, were $41,405, after underwriting discounts of $3,220 and $1,375 in offering expenses. The net proceeds is available to contribute to the capital of Encore Bank to support anticipated balance sheet growth and for general corporate purposes, including possible future acquisitions. Since the offering, the net proceeds that were not contributed to Encore Bank have been invested in short-term investments.
NOTE M—OFF-BALANCE SHEET FINANCIAL INSTRUMENTS
In the normal course of business, we enter into various credit related financial instruments with off-balance sheet risk to meet the financing needs of our clients. These financial instruments principally include commitments to extend credit and letters of credit. These instruments involve, to varying degrees, elements of credit and interest rate risk in excess of the amount recognized in the accompanying consolidated balance sheets.
Our exposure to credit loss in the event of nonperformance by the other party to the financial instrument for commitments to extend credit and letters of credit written is represented by the contractual notional amount of those instruments. We follow the same credit policies in making commitments and conditional obligations as we do for on-balance sheet instruments. The credit risk involved and collateral required in issuing letters of credit are essentially the same as those involved in extending loan facilities to clients.
Our principal commitments as of December 31 are as follows:
| 2009 | 2008 | |||||
| Commitments to extend credit |
$ | 139,580 | $ | 188,800 | ||
| Standby letters of credit |
6,277 | 3,465 | ||||
Commitments to extend credit are agreements to lend to a client as long as there is no violation of any condition established in the contract and have fixed expiration dates or other termination clauses. Some of the commitments are expected to expire without being drawn upon, so that the total commitment amounts do not necessarily represent future cash requirements. Letters of credit are commitments issued by us to guarantee the performance of a client to a third party, primarily borrowing arrangements. We evaluate each client’s credit worthiness on a case-by-case basis. The extension of credit is based on our credit evaluation of the client. Collateral held varies but may include cash, securities, accounts receivable, inventory, property, plant and equipment, and income-producing commercial properties. Included in unfunded commitments in 2009 are residential mortgages totaling $30,248. The fair value of these commitments is not significant.
F-30
Table of Contents
Index to Financial Statements
Encore Bancshares, Inc. and Subsidiaries
NOTES TO CONSOLIDATED FINANCIAL STATEMENTS
December 31, 2009, 2008 and 2007
(Amounts in thousands, except per share amounts)
Periodically we use forward interest rate locks to hedge the risk of changes in the fair value of newly originated mortgages held-for-sale. Net losses of $458 for 2007 (zero in 2009 and 2008) from these activities are included in the consolidated statements of operations in “Mortgage banking”. There were no derivatives outstanding at December 31, 2009 and 2008.
NOTE N—CONCENTRATION OF CREDIT RISK
Our primary market areas are Houston, Texas and southwest Florida and we grant loans to clients located primarily within these geographical areas. Although we have a diversified loan portfolio, a substantial portion of our client’s ability to honor their contracts is dependent upon the economic stability of the respective geographic area. We evaluate each client’s creditworthiness on a case-by-case basis.
NOTE O—COMMITMENTS AND CONTINGENCIES
We are a defendant in legal actions arising from transactions conducted in the ordinary course of business. We believe, after consultation with legal counsel, that the ultimate liability, if any, arising from such actions will not have a material adverse effect on our consolidated financial statements.
NOTE P—RELATED PARTY TRANSACTIONS
Deposits of executive officers and directors were $28,445 and $25,182 (including time deposits of $1,089 and $1,476) at December 31, 2009 and 2008.
Loans to executive officers, significant shareholders, directors and their related interests (related parties) for the years ended December 31 were as follows:
| 2009 | 2008 | |||||||
| Balance at January 1 |
$ | 21,912 | $ | 8,209 | ||||
| New loans |
7,103 | 22,967 | ||||||
| Repayments |
(14,031 | ) | (9,264 | ) | ||||
| Balance at December 31 |
$ | 14,984 | $ | 21,912 | ||||
At December 31, 2009 and 2008, $0 and $1,198 of borrowed funds in the form of repurchase agreements were outstanding to related parties. As of December 31, 2009, we are paying monthly rent of $22 to lease two private client offices from related parties. Lease expense for these two offices was $268 in 2009.
NOTE Q—JUNIOR SUBORDINATED DEBENTURES
In September 2003, we formed Encore Statutory Trust II (the Statutory Trust), a statutory business trust. We purchased all the common securities of the Statutory Trust for $155. The Statutory Trust issued $5,000 of preferred securities. The sole assets of the Statutory Trust are our junior subordinated debentures with an aggregate principal amount of $5,155, which are due September 24, 2033. The interest payable on the junior subordinated debentures is payable at a per annum rate equal to LIBOR plus 2.95%, reset quarterly. Cash distributions on the common and preferred securities are made in the same amount and to the extent interest on the junior subordinated debentures is received by the Statutory Trust. The securities are redeemable in whole at
F-31
Table of Contents
Index to Financial Statements
Encore Bancshares, Inc. and Subsidiaries
NOTES TO CONSOLIDATED FINANCIAL STATEMENTS
December 31, 2009, 2008 and 2007
(Amounts in thousands, except per share amounts)
any time on any March 17, June 17, September 17 or December 17 on or after September 17, 2008, or earlier in the event of certain changes or amendments to regulatory requirements or federal tax rules.
In April 2007, we formed Encore Capital Trust III (Trust III), a statutory business trust, and purchased all the common securities of Trust III for $464. Trust III issued $15,000 of preferred securities. The sole assets of Trust III are our junior subordinated debentures with an aggregate principal amount of $15,464, which are due April 19, 2037. The junior subordinated debentures bear a fixed rate of 6.85% until April 19, 2012, at which date we may call the debentures, and a floating rate equal to 3 month LIBOR + 1.75% thereafter. Cash distributions on the common and preferred securities are made in the same amount and to the extent interest on the junior subordinated debentures is received by Trust III. With the proceeds of these junior subordinated debentures, we redeemed the $15,464 in junior subordinated debentures originally issued on April 10, 2002 at a floating rate equal to 6 month LIBOR + 3.70%. We recorded a loss on early debt extinguishment of $391 in noninterest expense in connection with this redemption.
Each trust is considered a variable interest entity. Although we own all of the outstanding common stock of the Statutory Trust and Trust III, we are not required to include them in our consolidated financial statements.
Our obligations under the junior subordinated debentures, the related indenture, the trust agreement relating to the trust securities, and the guarantee constitute a full and unconditional guarantee by us of the obligations of the Trusts under the respective preferred securities.
NOTE R—FAIR VALUE OF ASSETS AND LIABILITIES
We use fair value measurements to record fair value adjustments to certain assets and to determine fair value disclosures. Securities available-for-sale are recorded at fair value on a recurring basis. Additionally, from time to time, we may be required to record at fair value other assets on a nonrecurring basis such as certain loans, goodwill and other intangible assets and investment in real estate. These nonrecurring fair value adjustments typically involve application of lower-of-cost-or-market accounting or write downs of individual assets.
In accordance with FASB ASC 820, Fair Value Measurements and Disclosures, we group our financial assets and financial liabilities measured at fair value in three levels, based on the markets in which the assets and liabilities are traded and the reliability of the assumptions used to determine fair value. These levels are:
| • | Level 1—Valuations for assets and liabilities traded in active exchange markets, such as the New York Stock Exchange. Level 1 also includes U.S. Treasury, other U.S. government and agency mortgage-backed securities that are traded by dealers or brokers in active markets. Valuations are obtained from readily available pricing sources for market transactions involving identical assets or liabilities. |
| • | Level 2—Valuations for assets and liabilities traded in less active dealer or broker markets. Valuations are obtained from third party pricing services for identical or comparable assets or liabilities. |
| • | Level 3—Valuations for assets and liabilities that are derived from other valuation methodologies, including option pricing models, discounted cash flow models and similar techniques, and not based on market exchange, dealer, or broker traded transactions. Level 3 valuations incorporate certain assumptions and projections in determining the fair value assigned to such assets or liabilities. |
F-32
Table of Contents
Index to Financial Statements
Encore Bancshares, Inc. and Subsidiaries
NOTES TO CONSOLIDATED FINANCIAL STATEMENTS
December 31, 2009, 2008 and 2007
(Amounts in thousands, except per share amounts)
The table below presents the balances of assets measured at fair value on a recurring basis as of December 31, 2009:
| Description |
Total | Level 1 | Level 2 | ||||||
| U.S. Government securities |
$ | 86,821 | $ | 86,821 | $ | — | |||
| Securities of U.S. states and political subdivisions |
615 | — | 615 | ||||||
| Mortgage-backed securities |
46,137 | — | 46,137 | ||||||
| Other securities (1) |
3,395 | 3,395 | — | ||||||
| Total available-for-sale securities |
$ | 136,968 | $ | 90,216 | $ | 46,752 | |||
| (1) | Excludes cost-basis equity securities of $3,683. |
The table below presents the balances of assets measured at fair value on a recurring basis as of December 31, 2008:
| Description |
Total | Level 2 | ||||
| Mortgage-backed securities |
$ | 72,609 | $ | 72,609 | ||
| Other securities (1) |
2,524 | 2,524 | ||||
| Total available-for-sale securities |
$ | 75,133 | $ | 75,133 | ||
| (1) | Excludes cost-basis equity securities of $3,683. |
For assets measured at fair value on a nonrecurring basis during 2009 that were still held on the balance sheet at December 31, 2009, the following table provides the level of valuation assumptions used to determine the amount of adjustment and the carrying value of the related individual assets at period end:
| Description |
Total | Level 2 | Losses for the Year Ended December 31, 2009 | ||||||
| Loans (1) |
$ | 33,362 | $ | 33,362 | $ | 3,572 | |||
| Investment in real estate (2) |
14,639 | 14,639 | 271 | ||||||
| Total |
$ | 48,001 | $ | 48,001 | $ | 3,843 | |||
| (1) | Represents carrying value of loans and related write downs for which adjustments are based on the appraised value of the collateral. |
| (2) | Represents carrying value of foreclosed assets measured at fair value upon initial recognition or subsequent impairment. |
F-33
Table of Contents
Index to Financial Statements
Encore Bancshares, Inc. and Subsidiaries
NOTES TO CONSOLIDATED FINANCIAL STATEMENTS
December 31, 2009, 2008 and 2007
(Amounts in thousands, except per share amounts)
For assets measured at fair value on a nonrecurring basis during 2008 that were still held on the balance sheet at December 31, 2008, the following table provides the level of valuation assumptions used to determine the amount of adjustment and the carrying value of the related individual assets at period end:
| Description |
Total | Level 2 | Level 3 | Losses for the Year Ended December 31, 2008 | ||||||||
| Loans (1) |
$ | 20,185 | $ | 20,185 | $ | — | $ | 1,634 | ||||
| Cost-basis equity securities |
16 | — | 16 | 1,984 | ||||||||
| Total |
$ | 20,201 | $ | 20,185 | $ | 16 | $ | 3,618 | ||||
| (1) | Represents carrying value of loans and related write downs for which adjustments are based on the appraised value of the collateral. |
The following table summarizes the carrying values and estimated fair values of financial instruments as of December 31:
| 2009 | 2008 | |||||||||||
| Carrying Amount |
Estimated Fair Value |
Carrying Amount |
Estimated Fair Value | |||||||||
| Financial assets: |
||||||||||||
| Cash and cash equivalents |
$ | 197,176 | $ | 197,176 | $ | 118,052 | $ | 118,052 | ||||
| Securities available-for-sale |
140,651 | 140,651 | 78,816 | 78,816 | ||||||||
| Securities held-to-maturity |
117,171 | 119,890 | 95,875 | 96,928 | ||||||||
| Mortgages held-for-sale |
1,058 | 1,058 | 150 | 150 | ||||||||
| Loans receivable, net |
1,051,704 | 1,073,467 | 1,193,299 | 1,220,926 | ||||||||
| Federal Home Loan Bank of Dallas stock |
9,569 | 9,569 | 9,534 | 9,534 | ||||||||
| Accrued interest receivable |
5,490 | 5,490 | 5,565 | 5,565 | ||||||||
| Financial liabilities: |
||||||||||||
| Deposits |
$ | 1,191,836 | $ | 1,192,584 | $ | 1,100,797 | $ | 1,102,255 | ||||
| Borrowings and repurchase agreements |
220,612 | 226,775 | 272,026 | 277,802 | ||||||||
| Accrued interest payable |
1,227 | 1,227 | 1,344 | 1,344 | ||||||||
| Junior subordinated debentures |
20,619 | 21,400 | 20,619 | 21,198 | ||||||||
| Accrued contingent consideration |
7,926 | 7,926 | — | — | ||||||||
Under FASB ASC 820, we base our fair values on the price that would be received to sell an asset or paid to transfer a liability in an orderly transaction between market participants at the measurement date. It is our policy to maximize the use of observable inputs and minimize the use of unobservable inputs when developing fair value measurements, in accordance with the fair value hierarchy in FASB ASC 820.
Fair value measurements where there exists limited or no observable market data and, therefore, are based primarily upon our own estimates, are often calculated based on current pricing policy, the economic and competitive environment, the characteristics of the asset or liability and other such factors. Therefore, the results cannot be determined with precision and may not be realized in an actual sale or immediate settlement of the asset or liability. Additionally, there may be inherent weaknesses in any calculation technique, and changes in the underlying assumptions used, including discount rates and estimates of future cash flows, that could significantly affect the results of current or future values.
F-34
Table of Contents
Index to Financial Statements
Encore Bancshares, Inc. and Subsidiaries
NOTES TO CONSOLIDATED FINANCIAL STATEMENTS
December 31, 2009, 2008 and 2007
(Amounts in thousands, except per share amounts)
The following is a description of valuation methodologies used for assets and liabilities recorded at fair value, non-financial assets and non-financial liabilities, and for estimating fair value for financial instruments not recorded at fair value (FASB ASC 820 disclosures).
Cash and Cash Equivalents
The carrying amounts reported in the consolidated balance sheets for cash and cash equivalents approximate those assets’ fair values.
Securities
Fair value measurement of securities is based upon quoted prices, if available. If quoted prices are not available, fair values are measured using independent pricing models or other model-based valuation techniques such as the present value of future cash flows. Securities available-for-sale are recorded at fair value on a recurring basis.
Loans Receivable
We do not record loans at fair value on a recurring basis. As such, valuation techniques discussed herein for loans are primarily for estimating fair value for FASB ASC 820 disclosure purposes. However, from time to time, we record nonrecurring fair value adjustments to loans to reflect (1) partial write downs that are based on the observable market price or current appraised value of the collateral, or (2) the full charge-off of the loan carrying value. The fair value estimates for FASB ASC 820-10-35 purposes differentiate loans based on their financial characteristics, such as product classification, loan category, pricing features and remaining maturity.
The fair value of commercial and commercial real estate loans is calculated by discounting contractual cash flows using discount rates that reflect our current pricing for loans with similar characteristics and remaining maturity.
For real estate 1-4 family first and junior lien mortgages, fair value is calculated by discounting contractual cash flows, adjusted for prepayment estimates, using discount rates based on current industry pricing or our own estimate of an appropriate risk-adjusted discount rate for loans of similar size, type, credit quality, remaining maturity and repricing characteristics.
For all other consumer loans, the fair value is generally calculated by discounting the contractual cash flows, adjusted for prepayment estimates, based on the current rates we offer for loans with similar characteristics.
The fair value of significant nonperforming loans is based on recent external appraisals. Where appraisals are not available, estimated cash flows are discounted using a rate commensurate with the credit risk associated with those cash flows. Assumptions regarding credit risk, cash flows and discount rates are judgmentally determined using available market information and specific borrower information.
Mortgages Held-for-Sale
Mortgages held-for-sale are carried at the lower of cost or market value. The fair value of loans held for sale is based on commitments on hand from investors or prevailing market prices. As such, we classify loans subjected to nonrecurring fair value adjustments as Level 2.
F-35
Table of Contents
Index to Financial Statements
Encore Bancshares, Inc. and Subsidiaries
NOTES TO CONSOLIDATED FINANCIAL STATEMENTS
December 31, 2009, 2008 and 2007
(Amounts in thousands, except per share amounts)
Federal Home Loan Bank of Dallas Stock
The fair value of FHLB stock is estimated to be equal to its carrying amount as reported in the accompanying balance sheet, given it is not a publicly traded equity security, it has an adjustable dividend rate, and all transactions in the stock are executed at the stated par value.
Investment in Real Estate
Investment in real estate is primarily foreclosed properties securing residential loans and commercial real estate. Foreclosed assets are adjusted to fair value less costs to sell upon transfer of the loans to investment in real estate. Subsequently, these assets are carried at the lower of carrying value or fair value less costs to sell. Fair value is generally based upon independent market prices or appraised values of the property and, accordingly, we classify foreclosed assets as Level 2.
Goodwill and Other Intangible Assets
We assess goodwill for impairment annually, and more frequently in certain circumstances. We assess goodwill for impairment on a reporting unit level using appropriate weighted market and income approaches. Impairment exists when the carrying amount of the goodwill exceeds its implied fair value. We recognize impairment losses as a charge to noninterest expense and an adjustment to the carrying value of the goodwill asset. Subsequent reversals of goodwill impairment are prohibited.
We amortize client relationship intangibles on an accelerated basis based on useful lives of 15 to 20 years. We review these intangibles for impairment whenever events or changes in circumstances indicate that their carrying amounts may not be recoverable. Impairment is indicated if the sum of undiscounted estimated future net cash flows is less than the carrying value of the asset. Impairment is permanently recognized by writing down the asset to the extent that the carrying value exceeds the estimated fair value.
Deposits
The fair value of deposits with no stated maturity, such as noninterest-bearing checking accounts and money market accounts, is equal to the amount payable upon demand as of December 31, 2009 and 2008. The fair value of certificates of deposit is based on the lower of redemption or discounted value of contractual cash flows. Discount rates for certificates of deposit are estimated using current market rates.
Borrowings and Repurchase Agreements
The fair values of our borrowings and repurchase agreements are estimated using discounted cash flow analyses based on our current incremental borrowing rates for similar types of borrowing arrangements.
Fair value of FHLB advances is estimated using the rates currently being offered for advances with similar remaining maturities.
Junior Subordinated Debentures
The fair values of our junior subordinated debentures with floating interest rates are estimated to be equal to their carrying value reported in the consolidated balance sheets since these instruments reprice periodically
F-36
Table of Contents
Index to Financial Statements
Encore Bancshares, Inc. and Subsidiaries
NOTES TO CONSOLIDATED FINANCIAL STATEMENTS
December 31, 2009, 2008 and 2007
(Amounts in thousands, except per share amounts)
according to prevailing market interest rates. The discounted cash flow method is used to estimate the fair value of our fixed rate debentures. Contractual cash flows are discounted using rates currently offered for new debentures with similar remaining maturities.
Accrued Interest
The carrying amounts of accrued interest are considered to approximate their fair values due to their short-term nature.
Accrued Contingent Consideration
The fair value of the accrued contingent consideration is estimated to be equal to its carrying amount as reported in the accompanying balance sheet, as the amount of the liability is fixed and will be paid within ninety days.
Unrecognized Financial Instruments
The fair value of commitments to extend credit is estimated using the fees currently charged to enter into similar agreements, taking into account the remaining terms of the agreement and the present creditworthiness of the counterparties. For fixed-rate loan commitments, fair value also considers the difference between current levels of interest rates and the committed rates. The fair value of guarantees and letters of credit is based on fees currently charged for similar agreements or on the estimated cost to terminate them or otherwise settle the obligations with the counterparties at the reporting date.
We have reviewed the unfunded portion of commitments to extend credit as well as standby and other letters of credit, and have determined that the fair value of such financial instruments is not material.
Nonfinancial Instruments
We have not considered the value of our long term relationships with depositors, commonly known as core deposit intangibles, when estimating the fair value of deposit liabilities. These intangibles are considered to be separate intangible assets that are not financial instruments. Nonetheless, financial institutions’ core deposits have typically traded at premiums to their book values under both historical and current market conditions.
NOTE S—EMPLOYEE BENEFIT PLAN
We have implemented a defined contribution plan (Plan) covering all eligible personnel. Contribution expense related to the Plan was $572, $555 and $616 for the years ended December 31, 2009, 2008 and 2007.
NOTE T—EARNINGS (LOSS) PER COMMON SHARE
On January 1, 2009, we adopted FASB ASC 260, Earnings Per Share, which requires that nonvested restricted stock be included in the calculation of basic average common shares outstanding for all periods presented. Prior to January 1, 2009, we had included the effect of nonvested restricted stock in the calculation of diluted average common shares outstanding.
F-37
Table of Contents
Index to Financial Statements
Encore Bancshares, Inc. and Subsidiaries
NOTES TO CONSOLIDATED FINANCIAL STATEMENTS
December 31, 2009, 2008 and 2007
(Amounts in thousands, except per share amounts)
The factors used in the earnings (loss) per common share computation follow:
| 2009 | 2008 | 2007 | |||||||||
| Basic: |
|||||||||||
| Earnings (loss) available to common shareholders |
$ | (428 | ) | $ | (8,240 | ) | $ | 7,384 | |||
| Average common shares outstanding, including nonvested restricted stock |
10,381 | 10,205 | 8,888 | ||||||||
| Per Share |
$ | (0.04 | ) | $ | (0.81 | ) | $ | 0.83 | |||
| Diluted: |
|||||||||||
| Average common shares outstanding |
10,381 | 10,205 | 8,888 | ||||||||
| Add: Net effect of the assumed exercise of stock options |
— | — | 419 | ||||||||
| Contingent share-based consideration |
— | — | 164 | ||||||||
| Diluted average common shares outstanding |
10,381 | 10,205 | 9,471 | ||||||||
| Per Share |
$ | (0.04 | ) | $ | (0.81 | ) | $ | 0.78 | |||
| Anti-dilutive stock options and warrants not included in treasury stock method computation |
1,351 | 1,043 | 9 | ||||||||
| Preferred dividends deducted from net earnings |
2,214 | 166 | — | ||||||||
No dividends have been declared on common stock.
NOTE U—SEGMENT INFORMATION
We have three lines of business which are banking, wealth management and insurance, which are delineated by the products and services that each segment offers. The segments are managed separately with different clients, employees, systems, risks and marketing strategies. Banking includes our commercial and private client banking services. Wealth management provides personal wealth management services through Encore Trust, a division of Encore Bank, and Linscomb & Williams, and insurance includes the selling of property and casualty insurance products by Town & Country.
The accounting policies of each line of business are the same as those described in the summary of significant accounting policies. Revenues, expenses, and assets are recorded by each line of business, and we separately review financial information. In addition to direct expenses, each line of business was allocated certain general corporate expenses such as executive administration, accounting, internal audit, and human resources based on the average asset level of the operating segment.
Activities that are not directly attributable to the reportable operating segments, including the elimination of inter-company transactions, are presented under “Other”.
F-38
Table of Contents
Index to Financial Statements
Encore Bancshares, Inc. and Subsidiaries
NOTES TO CONSOLIDATED FINANCIAL STATEMENTS
December 31, 2009, 2008 and 2007
(Amounts in thousands, except per share amounts)
Financial results by operating segment were as follows:
| Banking | Wealth Management |
Insurance | Other | Consolidated | ||||||||||||||
| 2009 |
||||||||||||||||||
| Net interest income (expense) |
$ | 47,548 | $ | 155 | $ | 17 | $ | (1,225 | ) | $ | 46,495 | |||||||
| Provision for loan losses |
16,660 | — | — | — | 16,660 | |||||||||||||
| Noninterest income |
4,781 | 16,907 | 5,649 | — | 27,337 | |||||||||||||
| Noninterest expense |
37,901 | 12,248 | 4,275 | — | 54,424 | |||||||||||||
| Earnings (loss) before income taxes |
(2,232 | ) | 4,814 | 1,391 | (1,225 | ) | 2,748 | |||||||||||
| Income tax expense (benefit) |
(896 | ) | 1,788 | 498 | (428 | ) | 962 | |||||||||||
| Net earnings (loss) |
$ | (1,336 | ) | $ | 3,026 | $ | 893 | $ | (797 | ) | $ | 1,786 | ||||||
| Total assets at December 31, |
$ | 1,644,083 | $ | 59,618 | $ | 7,962 | $ | (76,308 | ) | $ | 1,635,355 | |||||||
| 2008 |
||||||||||||||||||
| Net interest income (expense) |
$ | 45,340 | $ | 196 | $ | 83 | $ | (1,345 | ) | $ | 44,274 | |||||||
| Provision for loan losses |
29,175 | — | — | — | 29,175 | |||||||||||||
| Noninterest income |
(139 | ) | 17,329 | 5,760 | (5 | ) | 22,945 | |||||||||||
| Noninterest expense |
35,793 | 11,057 | 4,156 | — | 51,006 | |||||||||||||
| Earnings (loss) before income taxes |
(19,767 | ) | 6,468 | 1,687 | (1,350 | ) | (12,962 | ) | ||||||||||
| Income tax expense (benefit) |
(7,298 | ) | 2,270 | 626 | (486 | ) | (4,888 | ) | ||||||||||
| Net earnings (loss) |
$ | (12,469 | ) | $ | 4,198 | $ | 1,061 | $ | (864 | ) | $ | (8,074 | ) | |||||
| Total assets at December 31, |
$ | 1,592,933 | $ | 47,879 | $ | 6,738 | $ | (59,706 | ) | $ | 1,587,844 | |||||||
| 2007 |
||||||||||||||||||
| Net interest income (expense) |
$ | 35,282 | $ | 321 | $ | 136 | $ | (1,564 | ) | $ | 34,175 | |||||||
| Provision for loan losses |
4,029 | — | — | — | 4,029 | |||||||||||||
| Noninterest income |
7,293 | 17,546 | 6,035 | 29 | 30,903 | |||||||||||||
| Noninterest expense |
33,959 | 12,194 | 4,000 | 391 | 50,544 | |||||||||||||
| Earnings (loss) before income taxes |
4,587 | 5,673 | 2,171 | (1,926 | ) | 10,505 | ||||||||||||
| Income tax expense (benefit) |
1,130 | 1,941 | 744 | (694 | ) | 3,121 | ||||||||||||
| Net earnings (loss) |
$ | 3,457 | $ | 3,732 | $ | 1,427 | $ | (1,232 | ) | $ | 7,384 | |||||||
| Total assets at December 31, |
$ | 1,411,934 | $ | 46,270 | $ | 9,242 | $ | (66,249 | ) | $ | 1,401,197 | |||||||
F-39
Table of Contents
Index to Financial Statements
Encore Bancshares, Inc. and Subsidiaries
NOTES TO CONSOLIDATED FINANCIAL STATEMENTS
December 31, 2009, 2008 and 2007
(Amounts in thousands, except per share amounts)
NOTE V—PARENT COMPANY ONLY CONDENSED FINANCIAL INFORMATION
Condensed financial statements pertaining only to Encore Bancshares, Inc. are presented below. Investments in subsidiaries are stated using the equity method of accounting.
Condensed Balance Sheets
| December 31, | ||||||
| 2009 | 2008 | |||||
| Assets: |
||||||
| Cash and due from banks |
$ | 27,606 | $ | 49,725 | ||
| Total cash and cash equivalents |
27,606 | 49,725 | ||||
| Investment in subsidiaries |
186,545 | 154,498 | ||||
| Other assets |
1,694 | 2,541 | ||||
| $ | 215,845 | $ | 206,764 | |||
| Liabilities: |
||||||
| Junior subordinated debentures |
$ | 20,619 | $ | 20,619 | ||
| Accrued contingent consideration |
7,926 | — | ||||
| Accrued interest payable and other liabilities |
632 | 403 | ||||
| Total liabilities |
29,177 | 21,022 | ||||
| Shareholders’ equity |
186,668 | 185,742 | ||||
| $ | 215,845 | $ | 206,764 | |||
Condensed Statements of Operations
| Years Ended December 31, | ||||||||||||
| 2009 | 2008 | 2007 | ||||||||||
| Income: |
||||||||||||
| Other non-interest income |
$ | — | $ | (5 | ) | $ | 29 | |||||
| Total income |
— | (5 | ) | 29 | ||||||||
| Expense: |
||||||||||||
| Interest expense |
1,225 | 1,345 | 1,564 | |||||||||
| Loss on early debt extinguishment |
— | — | 391 | |||||||||
| Other |
626 | 535 | 150 | |||||||||
| Total expense |
1,851 | 1,880 | 2,105 | |||||||||
| Loss before income taxes and equity in undistributed earnings (losses) of subsidiaries |
(1,851 | ) | (1,885 | ) | (2,076 | ) | ||||||
| Income tax benefit |
634 | 549 | 718 | |||||||||
| Equity in undistributed earnings (losses) of subsidiaries |
3,003 | (6,738 | ) | 8,742 | ||||||||
| Net earnings (loss) |
$ | 1,786 | $ | (8,074 | ) | $ | 7,384 | |||||
F-40
Table of Contents
Index to Financial Statements
Encore Bancshares, Inc. and Subsidiaries
NOTES TO CONSOLIDATED FINANCIAL STATEMENTS
December 31, 2009, 2008 and 2007
(Amounts in thousands, except per share amounts)
Condensed Statements of Cash Flows
| Years Ended December 31, | ||||||||||||
| 2009 | 2008 | 2007 | ||||||||||
| Operating Activities: |
||||||||||||
| Net earnings (loss) |
$ | 1,786 | $ | (8,074 | ) | $ | 7,384 | |||||
| Adjustments to reconcile net earnings (loss) to net cash from operating activities: |
||||||||||||
| Equity in undistributed (earnings) losses of subsidiaries |
(3,003 | ) | 6,738 | (8,742 | ) | |||||||
| Loss on early debt extinguishment |
— | — | 391 | |||||||||
| Change in prepaid expenses and other assets |
704 | (818 | ) | 298 | ||||||||
| Change in accrued interest payable and other liabilities |
278 | 25 | (12 | ) | ||||||||
| Net cash from operating activities |
(235 | ) | (2,129 | ) | (681 | ) | ||||||
| Investing Activities: |
||||||||||||
| Capital contributions to subsidiaries |
(20,000 | ) | (15,000 | ) | (10,000 | ) | ||||||
| Net cash from investing activities |
(20,000 | ) | (15,000 | ) | (10,000 | ) | ||||||
| Financing Activities: |
||||||||||||
| Proceeds from issuance of junior subordinated debentures |
— | — | 15,464 | |||||||||
| Retirement of junior subordinated debentures |
— | — | (15,855 | ) | ||||||||
| Excess tax benefit (expense) from stock-based compensation |
(143 | ) | 120 | 118 | ||||||||
| Proceeds from issuance of preferred stock and common stock warrants |
— | 34,000 | — | |||||||||
| Proceeds from issuance of common stock, net of purchase of treasury stock |
(135 | ) | 473 | 42,185 | ||||||||
| Preferred dividends paid |
(1,606 | ) | — | — | ||||||||
| Net cash from financing activities |
(1,884 | ) | 34,593 | 41,912 | ||||||||
| Net change in cash and cash equivalents |
(22,119 | ) | 17,464 | 31,231 | ||||||||
| Cash and cash equivalents at beginning of year |
49,725 | 32,261 | 1,030 | |||||||||
| Cash and cash equivalents at end of year |
$ | 27,606 | $ | 49,725 | $ | 32,261 | ||||||
F-41
Table of Contents
Index to Financial Statements
Encore Bancshares, Inc. and Subsidiaries
NOTES TO CONSOLIDATED FINANCIAL STATEMENTS
December 31, 2009, 2008 and 2007
(Amounts in thousands, except per share amounts)
NOTE W—QUARTERLY FINANCIAL DATA (UNAUDITED)
| Fourth Quarter | Third Quarter | Second Quarter | First Quarter | |||||||||||||||||||||||
| 2009 | 2008 | 2009 | 2008 | 2009 | 2008 | 2009 | 2008 | |||||||||||||||||||
| Interest income |
$ | 18,555 | $ | 20,193 | $ | 19,517 | $ | 20,481 | $ | 19,529 | $ | 20,065 | $ | 19,625 | $ | 20,532 | ||||||||||
| Interest expense |
6,934 | 8,251 | 7,562 | 8,873 | 8,071 | 9,220 | 8,164 | 10,653 | ||||||||||||||||||
| Net interest income |
11,621 | 11,942 | 11,955 | 11,608 | 11,458 | 10,845 | 11,461 | 9,879 | ||||||||||||||||||
| Provision for loan losses |
3,009 | 18,648 | 7,685 | 5,249 | 2,927 | 3,777 | 3,039 | 1,501 | ||||||||||||||||||
| Net interest income after provision for loan losses |
8,612 | (6,706 | ) | 4,270 | 6,359 | 8,531 | 7,068 | 8,422 | 8,378 | |||||||||||||||||
| Noninterest income |
8,093 | 3,561 | 6,813 | 6,100 | 6,327 | 6,635 | 6,104 | 6,649 | ||||||||||||||||||
| Noninterest expense |
14,687 | 12,487 | 13,289 | 12,198 | 13,711 | 13,072 | 12,737 | 13,249 | ||||||||||||||||||
| Net earnings (loss) before income taxes |
2,018 | (15,632 | ) | (2,206 | ) | 261 | 1,147 | 631 | 1,789 | 1,778 | ||||||||||||||||
| Income tax expense (benefit) |
435 | (5,679 | ) | (453 | ) | 33 | 326 | 150 | 654 | 608 | ||||||||||||||||
| Net earnings (loss) |
$ | 1,583 | $ | (9,953 | ) | $ | (1,753 | ) | $ | 228 | $ | 821 | $ | 481 | $ | 1,135 | $ | 1,170 | ||||||||
| Earnings (loss) available to common shareholders |
$ | 1,029 | $ | (10,119 | ) | $ | (2,306 | ) | $ | 228 | $ | 267 | $ | 481 | $ | 582 | $ | 1,170 | ||||||||
| Earnings (loss) per common share: |
||||||||||||||||||||||||||
| Basic |
$ | 0.10 | $ | (0.99 | ) | $ | (0.22 | ) | $ | 0.02 | $ | 0.03 | $ | 0.05 | $ | 0.06 | $ | 0.12 | ||||||||
| Diluted |
0.09 | (0.99 | ) | (0.22 | ) | 0.02 | 0.02 | 0.04 | 0.05 | 0.11 | ||||||||||||||||
NOTE X—SUBSEQUENT EVENT
On March 15, 2010, Encore Bank executed two separate purchase and assumption agreements to sell certain assets and transfer certain liabilities of its Florida operations. The first agreement is with Ovation Holdings and its proposed subsidiary bank, National Bank of Southwest Florida (NBSWF), headquartered in Port Charlotte, Florida. Ovation Holdings has entered into a definitive agreement to purchase NBSWF.
Under the terms of the first agreement, NBSWF is to assume approximately $171.6 million of deposits associated with our four private client offices located in Naples, Ft. Myers and Sun City Center, Florida. NBSWF is also expected to purchase approximately $86.2 million of loans as well as other assets, including premises and equipment. The purchase and assumption is subject to regulatory approval, the closing of the purchase of NBSWF by Ovation Holdings and customary closing conditions and is expected to close before the end of the third quarter 2010, although delays may occur.
The second agreement is with HomeBanc, headquartered in Lake Mary, Florida. Under the terms of this agreement, HomeBanc is to assume approximately $59.7 million of deposits and certain assets associated with our two private client offices in Clearwater and Belleair Bluffs, Florida. The transaction is subject to regulatory approval and customary closing conditions and is expected to close before the end of the third quarter 2010, although delays may occur.
The deposits and loans to be acquired represent approximately 19.4% and 8.0% of our total deposits and loans at December 31, 2009. The combined transactions will result in a pre-tax loss of approximately $1.0 million. We expect to take a charge of approximately $4.4 million in the first quarter of 2010 to adjust the assets held for sale to their agreed purchase price. The gain on the sale of the deposits with respect to each transaction will be recognized when each transaction is completed.
F-42