Attached files
| file | filename |
|---|---|
| 8-K - FORM 8-K - CenterState Bank Corp | d8k.htm |
 Investor Presentation
First Quarter 2011
Exhibit 99.1 |
 This presentation contains forward-looking statements, as defined by Federal
Securities Laws, relating to present or future trends or factors affecting
the operations, markets and products
of
CenterState
Banks,
Inc.
(CSFL).
These
statements
are
provided
to
assist
in
the
understanding of future financial performance. Any such statements are based on
current expectations and involve a number of risks and uncertainties. For a
discussion of factors that may cause such forward-looking statements to
differ materially from actual results, please refer to CSFL’s most
recent Form 10-Q and Form 10-K filed with the Securities Exchange
Commission. CSFL undertakes no obligation to release revisions to these
forward-looking statements or reflect events or circumstances after the
date of this presentation. Forward Looking Statement
2 |
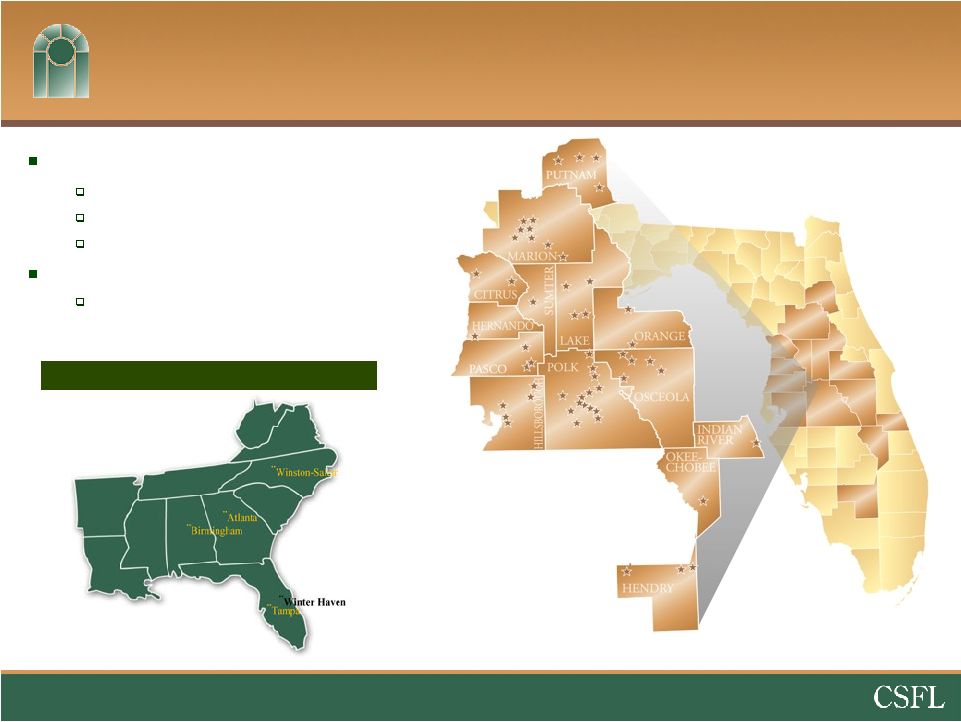 Corporate Overview
Headquartered in Davenport, FL
$2.2 billion in assets
$1.2 billion in loans
$1.9 billion in deposits
Company formed: June 2000
2 Subsidiary Banks; 59 locations
3
Correspondent Banking market |
 4
2010 Initiatives
Vero Beach Office
Opened May 2010
$40 million in deposits
$13 million in loans
1,280 new accounts
Okeechobee Office
Opened June 2010
$26 million in deposits
1,531 new accounts
Wealth Management
Joe Keating and team on board May of 2010
$109 million of new assets under management
3 FDIC Acquisitions
Total assets acquired –
$371MM
Stable core deposits
Performing to model
Delayed systems conversion |
 5
2011 Initiatives
TD Transaction
Acquired 4 branches in Putnam County, FL –
January 20, 2011
Acquired $121 million in loans and $115 million in deposits
$11 million bargain purchase gain
Credit Protection –
2 year “Put Back”
agreement with TD Bank
Core Processing System Conversions
All 4 Legacy Bank conversions completed
3 FDIC Banks slated for Third Quarter 2011
Evaluating Acquisition Opportunities
FDIC
Branch P&A –
TD acquisition
Whole banks |
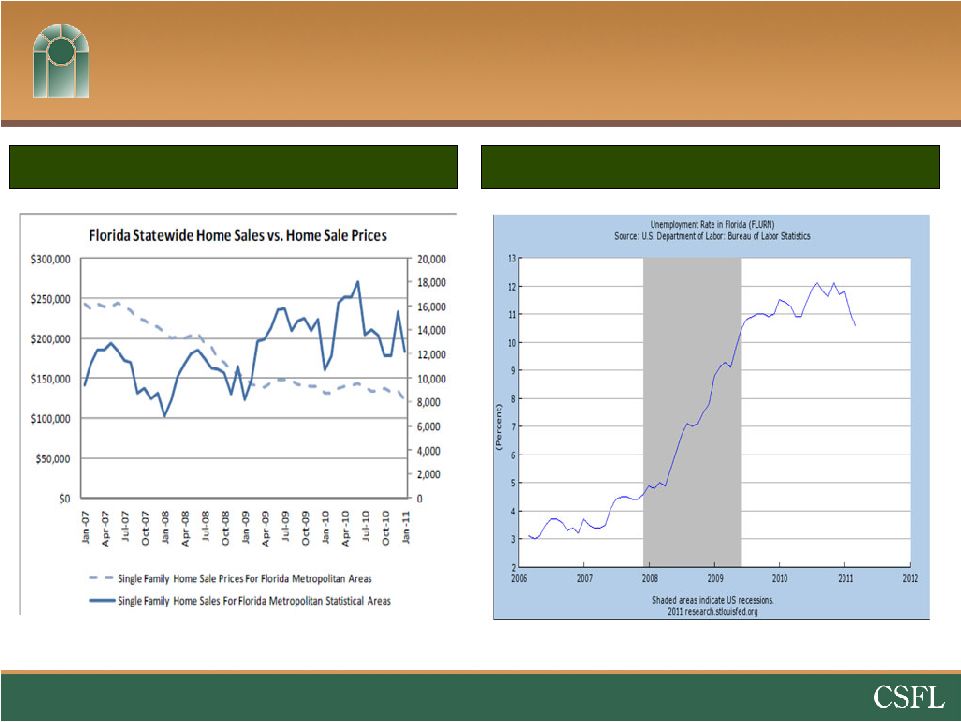 Florida Economy Slowly Recovering
6
Source:
Sterne,
Agee
and
Leach,
Inc.
and
the
US
Department
of
Labor
Home Prices Flat
Unemployment Down in 1Q |
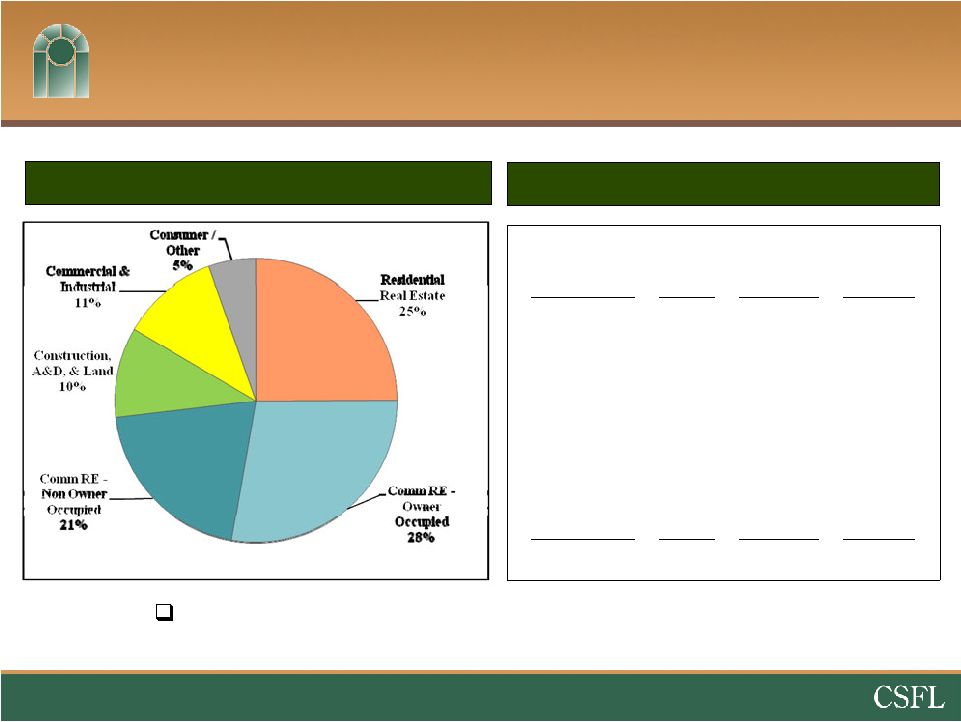 Loan Portfolio
(excluding FDIC Covered Loans)
Total Loans by Type (%)
Total Loans Detail
7
Loan Type
No. of
Loans
03/31/11
Balance
Avg Loan
Balance
Residential Real
Estate
3,006
$259MM
$86,000
Commercial
Real Estate
1,431
501MM
350,000
Construction,
A&D, & Land
590
107MM
181,000
Commercial &
Industrial
1,045
116MM
111,000
Consumer
/Other
3,399
56MM
16,000
Total
9,471
$1,039MM
$110,000
Includes $115MM of loans purchased from TD Bank which are
subject to a 2 year “Put Back”
option . |
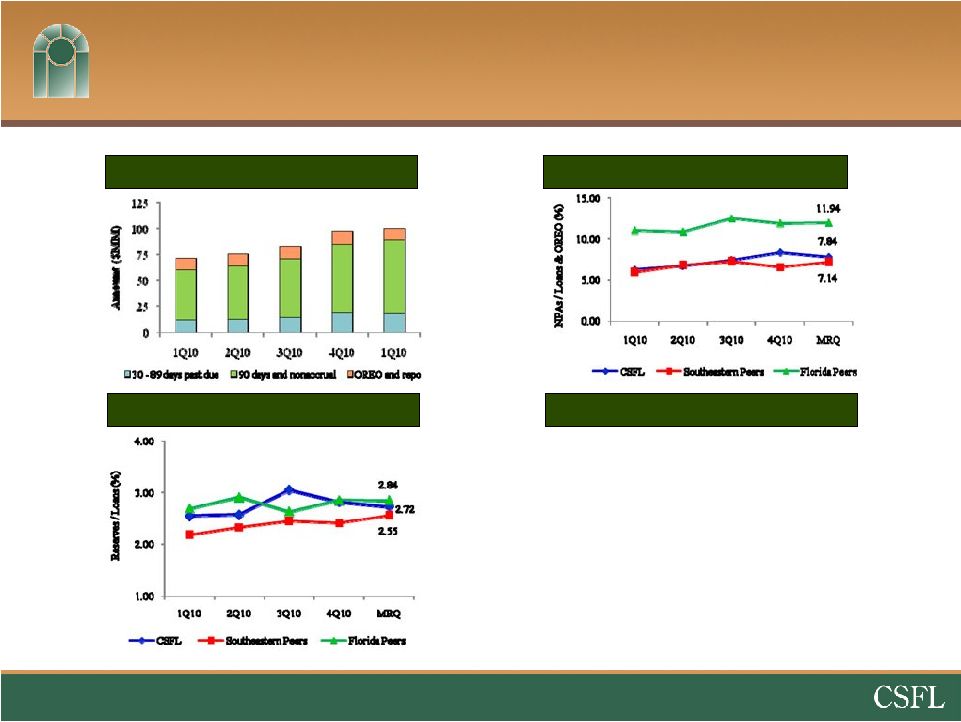 Credit Quality Trends
NPAs / Loans & OREO (%)
Credit Cycle Burn Down
Problem Loan Trends ($MM)
Reserves / Loans (%)
8
Source: SNL Financial
Nonperforming assets include 90 days or more past due.
Florida peers include publicly traded banks and thrifts headquartered in
Florida. Southeastern peers include publicly traded financial
institutions located in AL, AR, FL, GA, MS, NC, SC, TN VA, and WV with total assets between $2 and $5 billion.
Since 12-31-07, 8.1% of the
loan portfolio balance has
been expensed as a write
down or elevated reserves. |
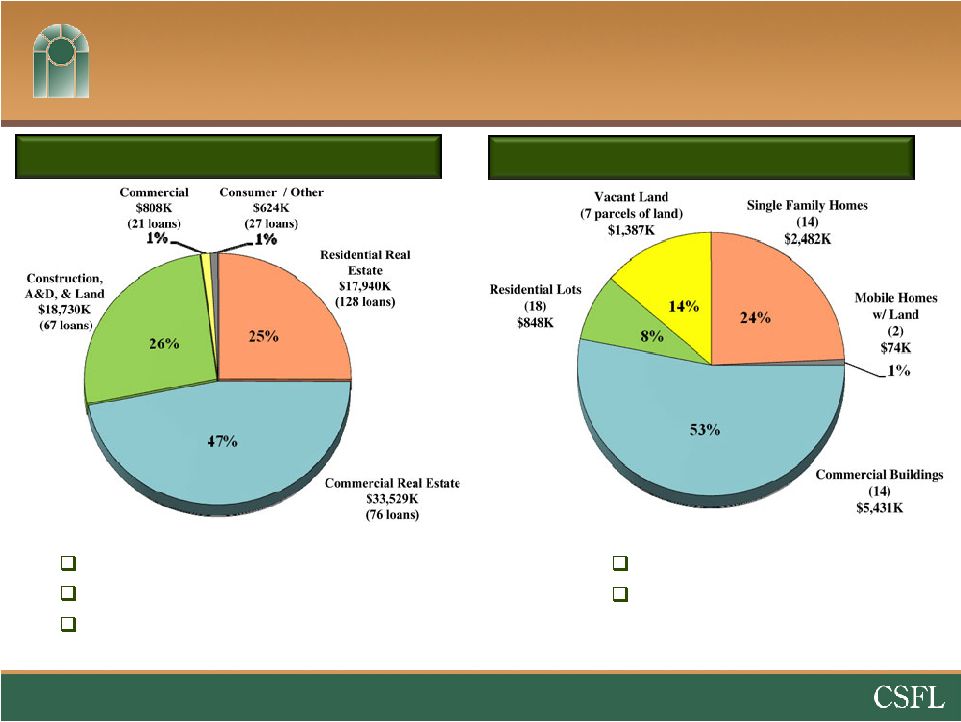 Non-Performing Loans
Other Real Estate Owned
$71,631,000 (6.89% of Gross Loans,)
29% of NPLs are current
75% of legal unpaid loan balance
(net of specific reserves and partial charge-offs)
$10,222,000
60% of legal unpaid loan
balance at repossession date
9
Data as of 3/31/11
NonPerforming Assets
(excluding FDIC Covered Assets) |
 Conservative Balance Sheet
Total Risk-Based Capital Ratio –
18.0% at 3/31/11
Loans
/
Assets
of
55%
at
3/31/11
Approximately 24% of loans have credit protection
15%
of loans are covered by loss sharing agreements with the FDIC
9%
are subject to a 2 year “Put Back”
agreement with TD Bank
41% of assets backed by the US Government
Low Concentration Levels
CRE
at
139%
of
capital
vs.
300%
guidance
CD&L
at
34%
of
capital
vs.
100%
guidance
Operating leverage yet untapped
10 |
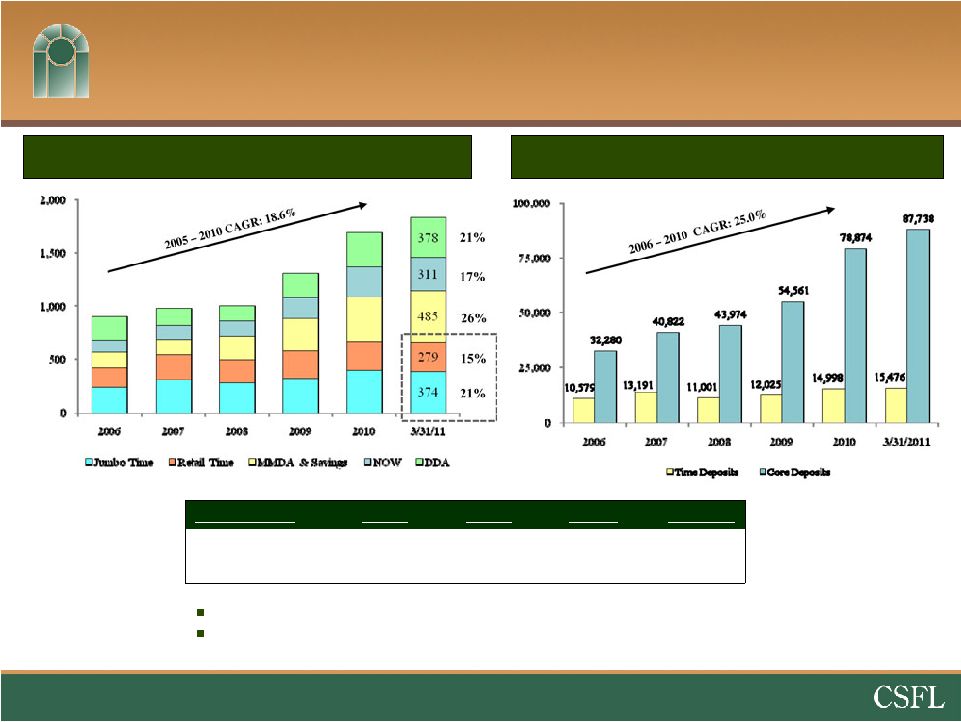 Core Deposit Focus
Value of core deposits not fully realized in this low rate
environment. Approximately
103,214
total
accounts
-
$17,710
average
balance
per
account
Core deposits defined as non-time deposits.
Total Deposits ($MM)
Number of Deposit Accounts
11
DDA and NOW
3/31/10
3/31/11
Change
% Change
Balance
$418MM
$689MM
$271MM
65%
No. of Accounts
40,753
67,859
27,106
67% |
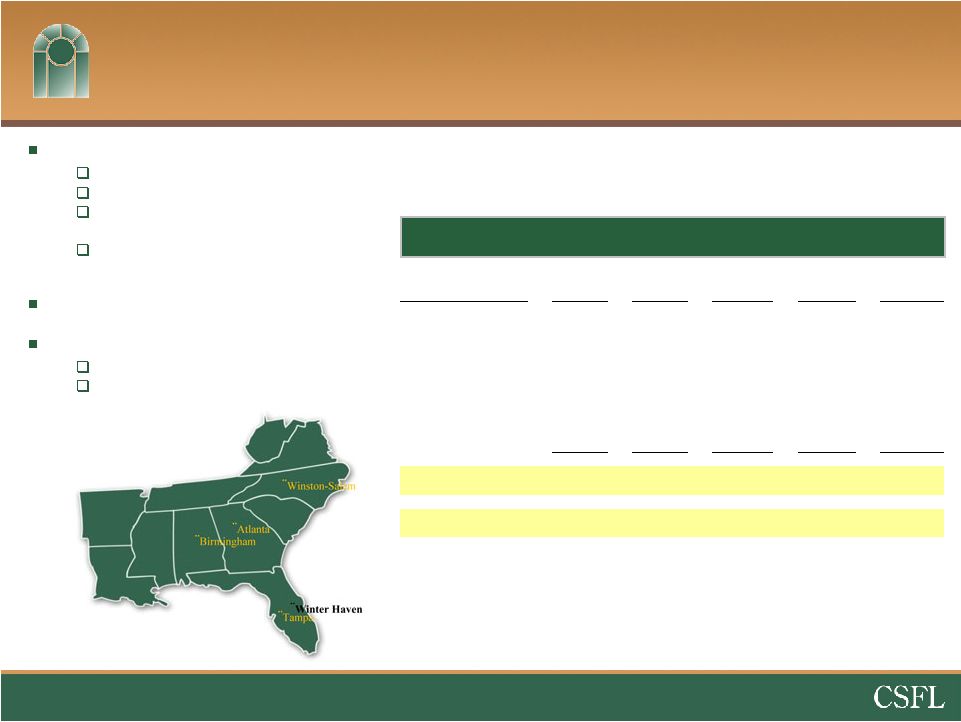 Correspondent Banking Division
Primary business lines
Bond Sales
Fed funds
Safekeeping, bond accounting, and
asset/liability consulting services
No loan participations / holding company
loan product
Customer base –
520 community banks
Opportunity
Bank Clearing & Cash Management
Talent Recruiting / M&A
Division Contribution
12
($000s, except per share)
1Q10
2Q10
3Q10
4Q10
1Q11
Net Interest Income
$1,526
$1,319
$1,148
$974
$662
Non-Interest Income
6,622
7,758
12,358
7,576
4,984
Non-Interest Expense
(6,164)
(6,740)
(9,249)
(6,689)
(4,978)
Income Tax Expense
(764)
(900)
(1,564)
(700)
(251)
Net Income Impact
$1,220
$1,437
$2,693
$1,161
$417
EPS Impact
$0.05
$0.05
$0.09
$0.04
$0.01 |
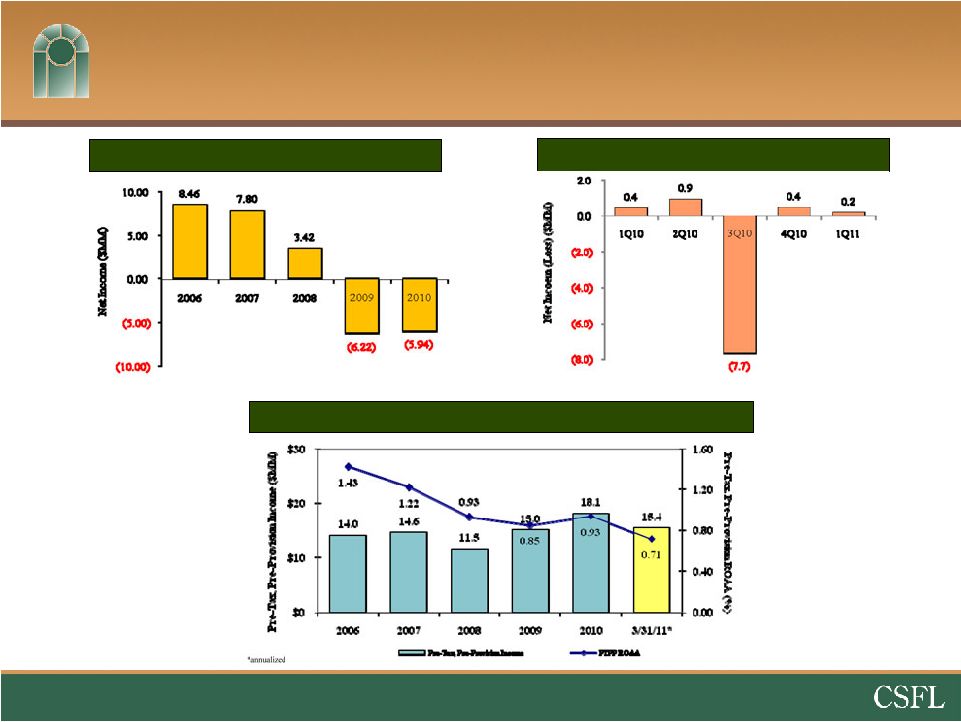 Profitability
Net
Income
($MM)
–
5
yr
history
Pre-Tax Pre Provision Income & ROAA(%)
13
Net
Income
($MM)
–
5
quarter
history |
 Summary
Energetic & experienced local management team taking
advantage of opportunities
Turmoil offers significant organic growth opportunities
Regulator support for continued growth strategy
Increased FDIC-assisted deals coming to our market in the
next 6 –
9 months
Elevated temporary operating expenses due to acquisitions
and conversions
Unprecedented opportunities to add shareholder value
14 |