Attached files
| file | filename |
|---|---|
| 8-K - 8-K - FiberTower CORP | a11-11713_18k.htm |
| EX-99.1 - EX-99.1 - FiberTower CORP | a11-11713_1ex99d1.htm |
Exhibit 99.2
|
|
FiberTower Corporation First Quarter 2011 Results May 6, 2011 |
|
|
Safe Harbor Statement Statements included in this presentation which are not historical in nature are “forward-looking” statements, as that term is defined in the Private Securities Litigation Reform Act of 1995 or by the Securities and Exchange Commission, or SEC, in its rules, regulations and releases. Forward-looking statements relate to expectations, beliefs, projections, future plans and strategies, anticipated events or trends and similar expressions concerning matters that are not historical facts. These include statements regarding, among other things, our future financial performance and results of operations, including guidance for expected positive 2011 Adjusted EBITDA, our expected range of 2011 capital expenditures and expected 2011 SG&A reductions, our financial and business prospects, the deployment of services, capital requirements, financing prospects, planned capital expenditures, expected cost per site, anticipated customer growth, expansion plans, and anticipated cash balances. There are many risks, uncertainties and other factors that can prevent the achievement of goals or cause results to differ materially from those expressed or implied by these forward-looking statements. These include, among other things, negative cash flows and operating and net losses, additional liquidity requirements, potential loss of significant customers, downturns in the wireless communication industry, regulatory costs and restrictions, potential loss of FCC licenses, equipment supply disruptions and cost increases, competition from alternative backhaul service providers and technologies, along with those risk factors described in the Company’s Annual Reports on Form 10-K and Quarterly Reports on Form 10-Q, as filed with the SEC. |
|
|
Kurt Van Wagenen – First Quarter Discussion |
|
|
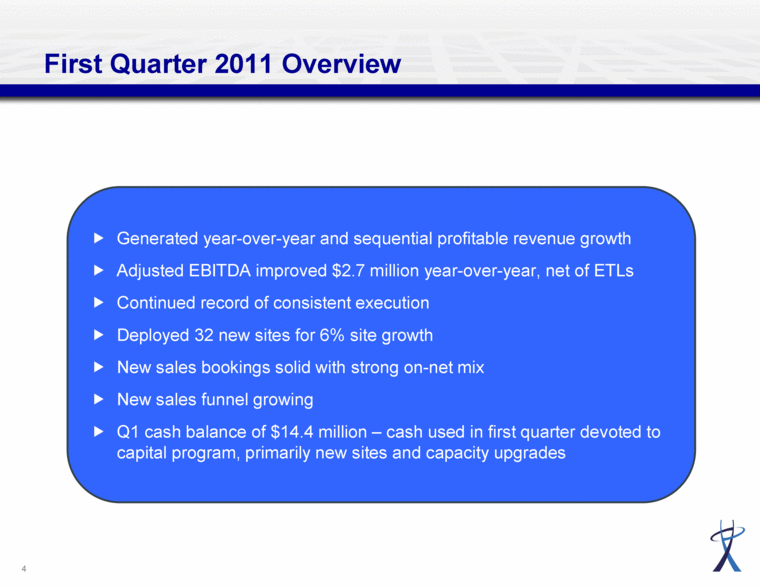
First Quarter 2011 Overview Generated year-over-year and sequential profitable revenue growth Adjusted EBITDA improved $2.7 million year-over-year, net of ETLs Continued record of consistent execution Deployed 32 new sites for 6% site growth New sales bookings solid with strong on-net mix New sales funnel growing Q1 cash balance of $14.4 million – cash used in first quarter devoted to capital program, primarily new sites and capacity upgrades |
|
|
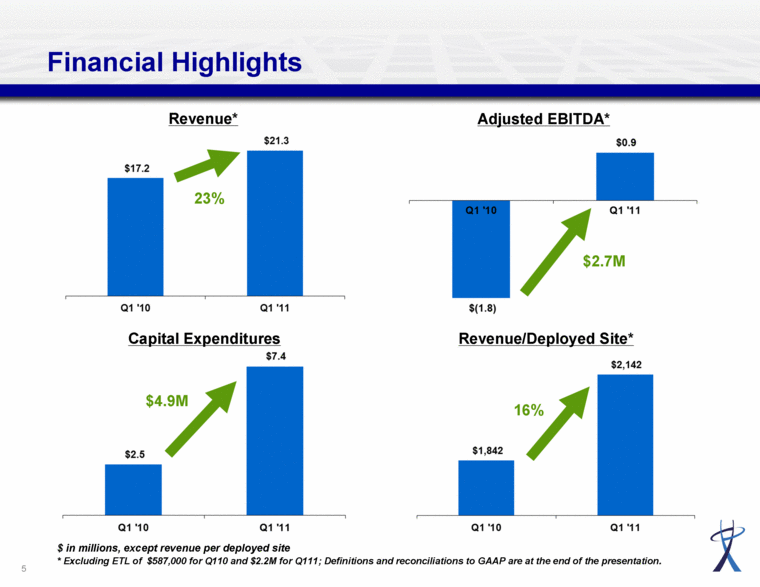
Financial Highlights Capital Expenditures Revenue/Deployed Site* $ in millions, except revenue per deployed site * Excluding ETL of $587,000 for Q110 and $2.2M for Q111; Definitions and reconciliations to GAAP are at the end of the presentation. 23% 16% $2.7M $4.9M Revenue* Adjusted EBITDA* Q3 '09 Q3 '10 |
|
|
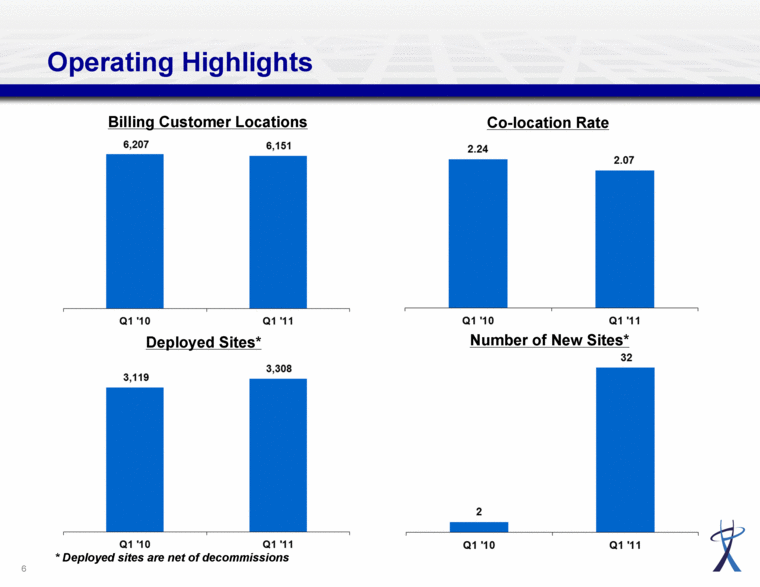
Operating Highlights Billing Customer Locations Co-location Rate Number of New Sites* * Deployed sites are net of decommissions Deployed Sites* |
|
|
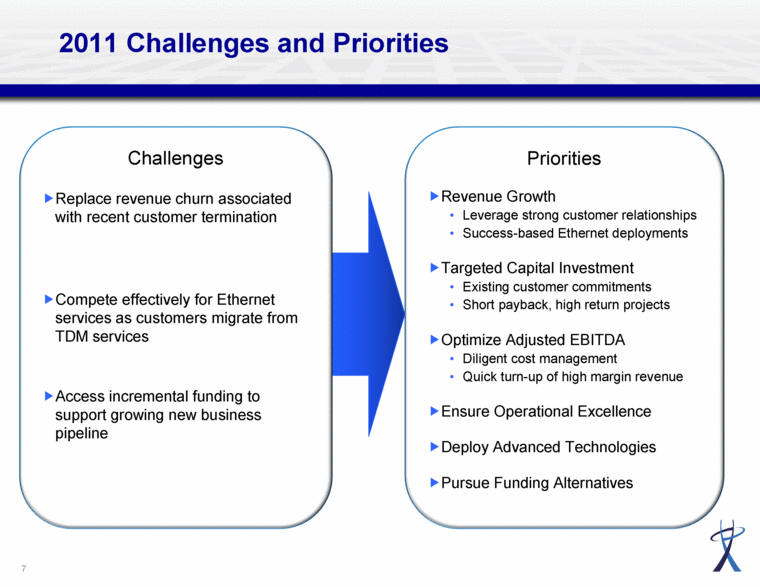
2011 Challenges and Priorities Priorities Revenue Growth Leverage strong customer relationships Success-based Ethernet deployments Targeted Capital Investment Existing customer commitments Short payback, high return projects Optimize Adjusted EBITDA Diligent cost management Quick turn-up of high margin revenue Ensure Operational Excellence Deploy Advanced Technologies Pursue Funding Alternatives Challenges Replace revenue churn associated with recent customer termination Compete effectively for Ethernet services as customers migrate from TDM services Access incremental funding to support growing new business pipeline |
|
|
Thomas Scott - Financial Review |
|
|
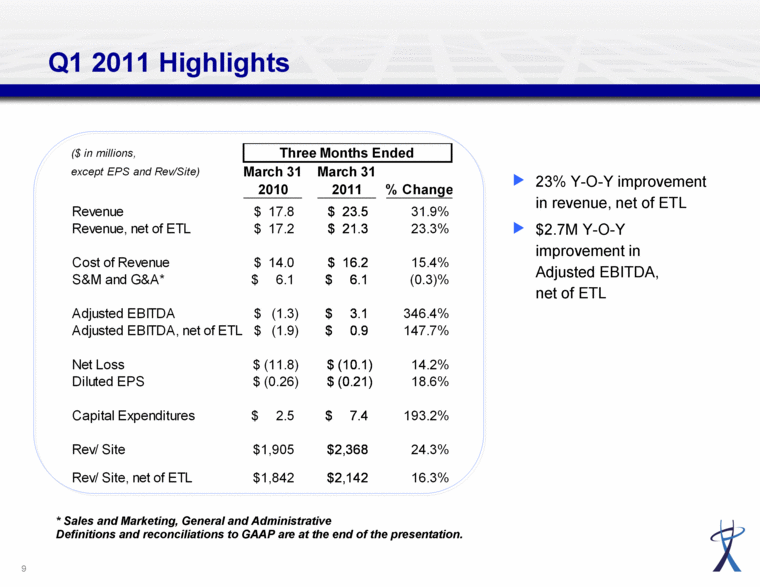
Q1 2011 Highlights 23% Y-O-Y improvement in revenue, net of ETL $2.7M Y-O-Y improvement in Adjusted EBITDA, net of ETL * Sales and Marketing, General and Administrative Definitions and reconciliations to GAAP are at the end of the presentation. ($ in millions, except EPS and Rev/Site) March 31 March 31 2010 2011 % Change Revenue 17.8 $ 23.5 $ 31.9% Revenue, net of ETL 17.2 $ 21.3 $ 23.3% Cost of Revenue 14.0 $ 16.2 $ 15.4% S&M and G&A* 6.1 $ 6.1 $ (0.3)% Adjusted EBITDA (1.3) $ 3.1 $ 346.4% Adjusted EBITDA, net of ETL (1.9) $ 0.9 $ 147.7% Net Loss (11.8) $ (10.1) $ 14.2% Diluted EPS (0.26) $ (0.21) $ 18.6% Capital Expenditures 2.5 $ 7.4 $ 193.2% Rev/ Site 1,905 $ 2,368 $ 24.3% Rev/ Site, net of ETL 1,842 $ 2,142 $ 16.3% Three Months Ended |
|
|
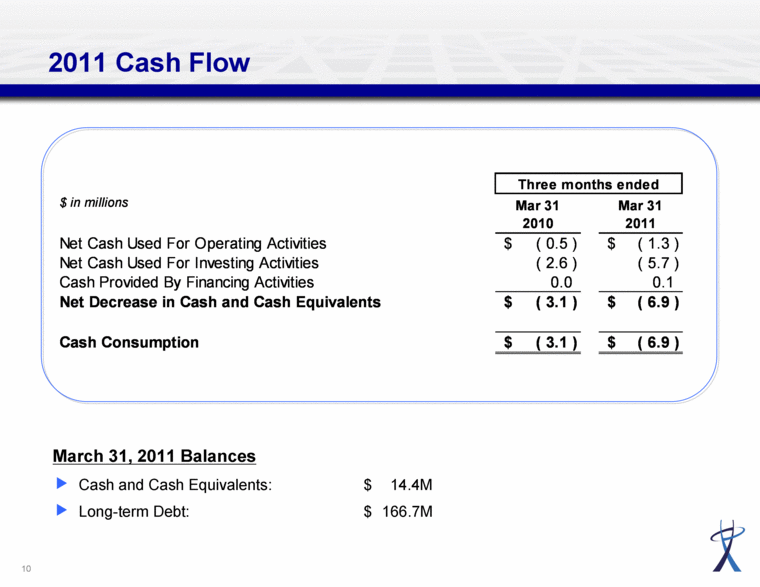
2011 Cash Flow March 31, 2011 Balances Cash and Cash Equivalents: $ 14.4M Long-term Debt: $ 166.7M $ in millions Mar 31 2010 Mar 31 2011 Net Cash Used For Operating Activities ( 0.5 ) $ ( 1.3 ) $ Net Cash Used For Investing Activities ( 2.6 ) ( 5.7 ) Cash Provided By Financing Activities 0.0 0.1 Net Decrease in Cash and Cash Equivalents ( 3.1 ) $ ( 6.9 ) $ Cash Consumption ( 3.1 ) $ ( 6.9 ) $ Three months ended |
|
|
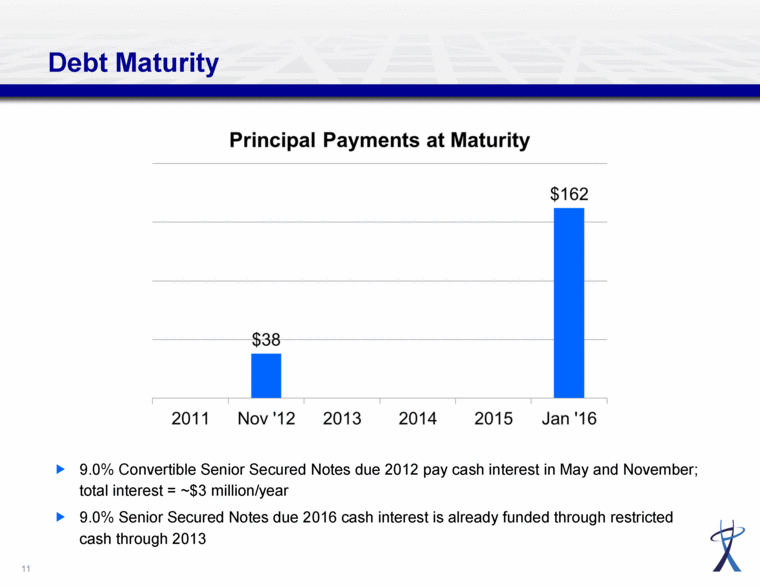
Debt Maturity 9.0% Convertible Senior Secured Notes due 2012 pay cash interest in May and November; total interest = ~$3 million/year 9.0% Senior Secured Notes due 2016 cash interest is already funded through restricted cash through 2013 |
|
|
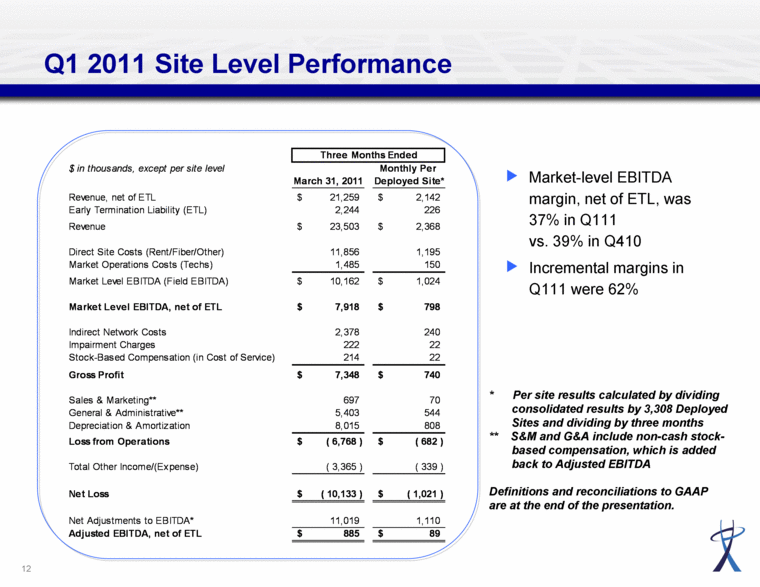
Q1 2011 Site Level Performance Market-level EBITDA margin, net of ETL, was 37% in Q111 vs. 39% in Q410 Incremental margins in Q111 were 62% * Per site results calculated by dividing consolidated results by 3,308 Deployed Sites and dividing by three months ** S&M and G&A include non-cash stock-based compensation, which is added back to Adjusted EBITDA Definitions and reconciliations to GAAP are at the end of the presentation. $ in thousands, except per site level Monthly Per March 31, 2011 Deployed Site* Revenue, net of ETL 21,259 $ 2,142 $ Early Termination Liability (ETL) 2,244 226 Revenue 23,503 $ 2,368 $ Direct Site Costs (Rent/Fiber/Other) 11,856 1,195 Market Operations Costs (Techs) 1,485 150 Market Level EBITDA (Field EBITDA) 10,162 $ 1,024 $ Market Level EBITDA, net of ETL 7,918 $ 798 $ Indirect Network Costs 2,378 240 Impairment Charges 222 22 Stock-Based Compensation (in Cost of Service) 214 22 Gross Profit 7,348 $ 740 $ Sales & Marketing** 697 70 General & Administrative** 5,403 544 Depreciation & Amortization 8,015 808 Loss from Operations ( 6,768 ) $ ( 682 ) $ Total Other Income/(Expense) ( 3,365 ) ( 339 ) Net Loss ( 10,133 ) $ ( 1,021 ) $ Net Adjustments to EBITDA* 11,019 1,110 Adjusted EBITDA, net of ETL 885 $ 89 $ Three Months Ended |
|
|
Q&A |
|
|
Appendix |
|
|
Non-GAAP Financial Measures Adjusted EBITDA is a non-GAAP (Generally Accepted Accounting Principles) financial measure, used to monitor the financial performance of our operations. This measurement, together with GAAP measures such as revenue and loss from operations, assists management in its decision-making processes relating to the operation of our business. Adjusted EBITDA is defined as net income (loss) from operations before interest, taxes, depreciation and amortization, impairment and restructuring charges, severance related to reduction in force, stock-based compensation, gain on early extinguishment of debt, debt exchange expenses and other income (expense). Adjusted EBITDA is not a substitute for loss from operations, net loss, or cash flow used provided by (used for) operating activities as determined in accordance with GAAP, as a measure of performance or liquidity. In addition, our presentation of Adjusted EBITDA may not be comparable to similarly titled measures reported by other companies. This non-GAAP financial measure should be viewed in addition to, and not as an alternative for, our reported financial results as determined in accordance with GAAP. Adjusted EBITDA has significant limitations as an analytical tool, and you should not consider it in isolation or as a substitute for analysis of our results as reported under GAAP. |
|
|
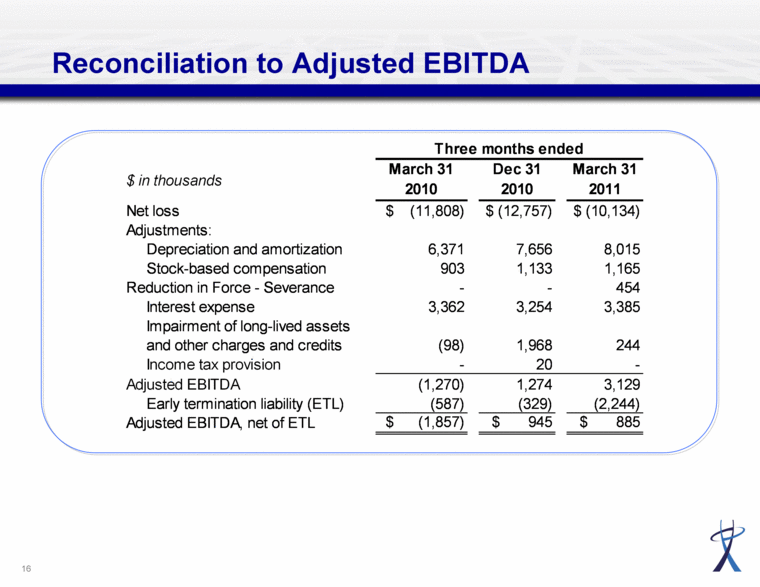
Reconciliation to Adjusted EBITDA $ in thousands March 31 2010 Dec 31 2010 March 31 2011 Net loss $ (11,808) $ (12,757) $ (10,134) Adjustments: Depreciation and amortization 6,371 7,656 8,015 Stock-based compensation 903 1,133 1,165 Reduction in Force - Severance - - 454 Interest expense 3,362 3,254 3,385 Impairment of long-lived assets and other charges and credits (98) 1,968 244 Income tax provision - 20 - Adjusted EBITDA (1,270) 1,274 3,129 Early termination liability (ETL) (587) (329) (2,244) Adjusted EBITDA, net of ETL $ (1,857) $ 945 $ 885 Three months ended |
|
|
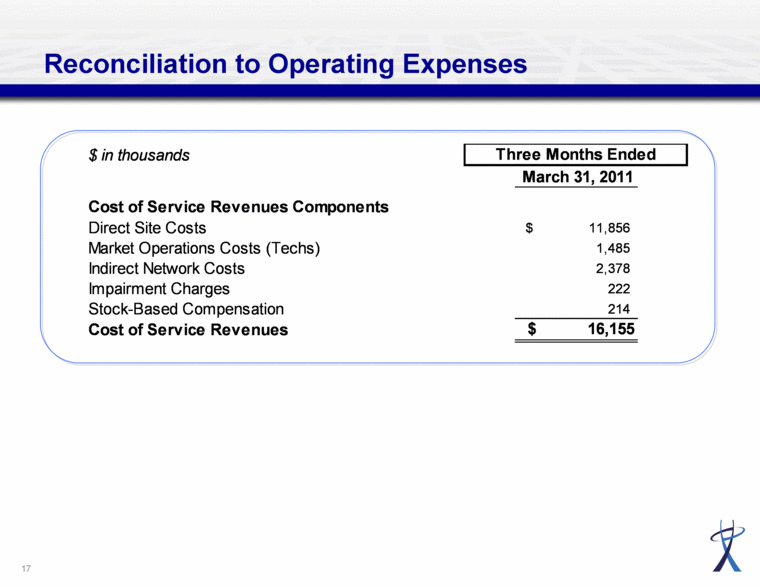
Reconciliation to Operating Expenses $ in thousands March 31, 2011 Cost of Service Revenues Components Direct Site Costs 11,856 $ Market Operations Costs (Techs) 1,485 Indirect Network Costs 2,378 Impairment Charges 222 Stock-Based Compensation 214 Cost of Service Revenues $ 16,155 Three Months Ended |

