Attached files
| file | filename |
|---|---|
| EX-4.7 - EXHIBIT 4.7 - FiberTower CORP | a2197208zex-4_7.htm |
| EX-4.9 - EXHIBIT 4.9 - FiberTower CORP | a2197208zex-4_9.htm |
| EX-4.4 - EXHIBIT 4.4 - FiberTower CORP | a2197208zex-4_4.htm |
| EX-4.11 - EXHIBIT 4.11 - FiberTower CORP | a2197208zex-4_11.htm |
| EX-4.16 - EXHIBIT 4.16 - FiberTower CORP | a2197208zex-4_16.htm |
| EX-21.1 - EXHIBIT 21.1 - FiberTower CORP | a2197208zex-21_1.htm |
| EX-4.12 - EXHIBIT 4.12 - FiberTower CORP | a2197208zex-4_12.htm |
| EX-32.1 - EXHIBIT 32.1 - FiberTower CORP | a2197208zex-32_1.htm |
| EX-31.2 - EXHIBIT 31.2 - FiberTower CORP | a2197208zex-31_2.htm |
| EX-4.13 - EXHIBIT 4.13 - FiberTower CORP | a2197208zex-4_13.htm |
| EX-23.1 - EXHIBIT 23.1 - FiberTower CORP | a2197208zex-23_1.htm |
| EX-31.1 - EXHIBIT 31.1 - FiberTower CORP | a2197208zex-31_1.htm |
| EX-4.17 - EXHIBIT 4.17 - FiberTower CORP | a2197208zex-4_17.htm |
| EX-32.2 - EXHIBIT 32.2 - FiberTower CORP | a2197208zex-32_2.htm |
UNITED STATES
SECURITIES AND EXCHANGE COMMISSION
Washington, D.C. 20549
FORM 10-K
ý |
ANNUAL REPORT PURSUANT TO SECTION 13 OR 15(d) OF THE SECURITIES EXCHANGE ACT OF 1934 |
|
For the Fiscal Year Ended December 31, 2009 |
||
o |
TRANSITION REPORT PURSUANT TO SECTION 13 OR 15(d) OF THE SECURITIES EXCHANGE ACT OF 1934 |
|
For the transition period from to |
||
Commission File Number 000-21091
FIBERTOWER CORPORATION
(Exact name of registrant as specified in its charter)
| Delaware (State or other jurisdiction of incorporation or organization) |
52-1869023 (I.R.S. Employer Identification No.) |
185 Berry Street
Suite 4800
San Francisco, CA 94107
(Address of Principal executive offices)
(415) 659-3500
(Registrant's telephone number, including area code)
Securities registered pursuant to Section 12(b) of the Act:
| Title of each class | Name of each exchange on which registered: | |
|---|---|---|
| Common stock, par value $0.001 | Nasdaq Global Market |
Securities registered pursuant to Section 12(g) of the Act: None
Indicate by check mark if the registrant is a well-known seasoned issuer, as defined in Rule 405 of the Securities Act. Yes o No ý
Indicate by check mark if the registrant is not required to file reports pursuant to Section 13 or Section 15 (d) of the Securities Act. Yes o No ý
Indicate by check mark whether the registrant: (1) has filed all reports required to be filed by Section 13 or 15(d) of the Securities Exchange Act of 1934 during the preceding 12 months (or for such shorter period that the registrant was required to file such reports), and (2) has been subject to such filing requirements for the past 90 days. Yes ý No o
Indicate by check mark whether the registrant has submitted electronically and posted on its corporate website, if any, every Interactive Data File required to be submitted and posted pursuant to Rule 405 of Regulation S-T (§232.405 of this chapter) during the preceding 12 months (or for such shorter period that the registrant was required to submit and post such files). Yes o No o
Indicate by check mark if disclosure of delinquent filers pursuant to Item 405 of Regulation S-K (§ 229.405 of this chapter) is not contained herein, and will not be contained, to the best of registrant's knowledge, in definitive proxy or information statements incorporated by reference in Part III of this Form 10-K or any amendment to this Form 10-K. o
Indicate by check mark whether the registrant is a large accelerated filer, an accelerated filer, a non-accelerated filer, or a smaller reporting company. See definition of "large accelerated filer", "accelerated filer" and "smaller reporting company" in Rule 12b-2 of the Exchange Act. (Check one):
| Large accelerated filer o | Accelerated filer ý | Non-accelerated filer o (Do not check if a smaller reporting company) |
Smaller reporting company o |
Indicate by check mark whether the registrant is a shell company (as defined in Rule 12b-2 of the Securities Exchange Act of 1934): Yes o No ý
As of June 30, 2009, the aggregate market value of the voting and non-voting common stock held by non-affiliates was $61 million based on the closing price of the Company's common stock on the Nasdaq Global Market on that day. Shares held by executive officers and directors and by each person who owned 5% or more of the outstanding common stock have been excluded in that such persons may be deemed affiliates. This determination of affiliate status is not necessarily a conclusive determination for other purposes.
The registrant had 45,799,118 shares of its common stock outstanding as of February 26, 2010.
Portions of the Proxy Statement for the registrant's 2010 Annual Meeting of Stockholders are incorporated by reference in Part III of this Form 10-K to the extent stated herein. The Proxy Statement will be filed with the Commission within 120 days of the registrant's fiscal year ended December 31, 2009.
2
FORWARD LOOKING STATEMENTS
This Form 10-K includes "forward-looking" statements, as that term is defined in the Private Securities Litigation Reform Act of 1995 or by the Securities and Exchange Commission, or SEC, in its rules, regulations and releases. Forward looking statements relate to expectations, beliefs, projections, future plans and strategies, anticipated events or trends and similar expressions concerning matters that are not historical facts. These include statements regarding, among other things, our financial and business prospects, the deployment of our services, capital requirements, financing prospects, planned capital expenditures, expected cost per site, anticipated customer growth, expansion plans and anticipated cash balances.
There are many risks, uncertainties and other factors that can prevent the achievement of goals or cause results to differ materially from those expressed or implied by these forward-looking statements. These include, among other things, negative cash flows and operating and net losses, additional liquidity requirements, potential loss of significant customers, downturns in the wireless communication industry, regulatory costs and restrictions, potential loss of FCC licenses, equipment supply disruptions and cost increases, competition from alternative backhaul service providers and technologies, along with those risk factors described in Item 1A of this Form 10-K.
FiberTower Overview
We are a leading alternative provider of facilities-based backhaul services to wireless carriers. Facilities-based providers own or lease a substantial portion of the property and equipment necessary to provide backhaul services. Backhaul is the transport of voice, video and data traffic from a wireless carrier's mobile base station, or cell site, to its mobile switching center, or MSC, or other exchange point where the traffic is then switched onto a wireline telecommunications network. We provide backhaul services nationally by utilizing our wireless spectrum assets and fiber relationships to construct and operate high-coverage, high-capacity hybrid microwave and fiber networks. Our services provide wireless carriers a long-term solution for their increasing demand for backhaul capacity while giving them increased availability and reliability.
As of December 31, 2009:
- •
- We provide service to 6,317 billing customer locations at 2,788 billing sites in 13 markets throughout the U.S.;
- •
- We have master service agreements with nine U.S. wireless carriers;
- •
- We have extensive relationships with fiber service providers giving us access to over 1,000 MSCs and 125,000 fiber-based
aggregation points;
- •
- We own a national spectrum portfolio of 24 GHz and 39 GHz wide-area spectrum licenses, including over 740 MHz
in the top 20 U.S. metropolitan areas and, in the aggregate, approximately 1.55 billion channel pops calculated as the number of channels in a given area multiplied by the population, as
measured in the 2000 census, covered by these channels. We believe our spectrum portfolio represents one of the largest and most comprehensive collections of millimeter wave spectrum in the U.S. Our
licenses extend over substantially all of the continental U.S., covering areas with a total population of approximately 300 million; and
- •
- We hold separate service agreements with Verizon Business and Qwest Communications, as their fixed wireless partner on the General Services Administration Networx contract to provide fixed wireless government-grade primary transport and physically diverse network transport services.
3
The service agreement with Verizon Business also allows us to provide government-grade services for other Verizon Business-managed contracts.
We offer our customers transport services based on a variety of protocols such as time division multiplexing ("TDM"), SONET and Ethernet. In general, we provide these services between a wireless carrier's cell site and mobile switching center, but also provide wireless-only connections and fiber-based transport.
Our network is designed to be modular and to enable us to offer our customers a high degree of coverage cost-effectively as compared to other solutions. We deploy networks to existing towers, rooftops, or other sites where wireless carriers have deployed cell sites. At each of these physical locations, or sites, there may be more than one wireless carrier's cell site—each of which we refer to as a customer location. When possible, we provide service to multiple customers at a single site, using a shared infrastructure in order to increase our capital efficiency. We generally generate revenue in proportion to the number of customers on a site, the amount of bandwidth used by each customer at that site, and the price charged for each increment of bandwidth. This revenue, after subtracting the cost of fiber service transport, is available to cover a fixed cost base consisting of items such as rent, insurance, utilities, and field technicians.
We have invested significant capital to build and expand our network. As a result, we have incurred net losses and negative cash flows from operating and investing activities since our inception, and we expect that we will continue to incur operating and net losses and negative cash flows for the next few years as we continue to invest to expand our network. If market conditions warrant, we expect to be able to slow the amount of capital expenditures to a level consistent with the business needs at that time. Our long-term economic model is designed to allow replicable, scalable individual market builds so that we can increase or decrease our market deployment schedule based on available cash. As a result, the amount and timing of our long-term capital needs will depend on the extent of our network deployment. As our business is in its early stages, we regularly evaluate our plans and strategy, and these evaluations often result in changes, some of which may be material and may significantly modify our cash requirements.
FiberTower Corporation History
Exchange Offer and Redemption of Debt
On October 26, 2009, we initiated an offer to exchange, which we refer to as the "Exchange Offer," any and all of our existing 9.00% Convertible Senior Secured Notes Due 2012 ("Notes due 2012") for 9.00% Mandatorily Redeemable Convertible Senior Secured Notes Due 2012 (the "Interim Notes"). The Interim Notes were mandatorily redeemable for a combination of cash, shares of our common stock, and 9.00% Senior Secured Notes Due 2016 ("Notes due 2016"). We refer to the mandatory redemption of the Interim Notes as the "Mandatory Redemption."
Upon the expiration of the Exchange Offer on December 1, 2009, we had received tenders of $266.8 million principal amount of the Notes due 2012, representing approximately 90.8% of the outstanding Notes due 2012.
On December 15, 2009, our stockholders approved the issuance of shares of common stock to be issued upon the Mandatory Redemption. In order to provide a sufficient number of authorized shares of common stock for the issuance of shares in the Mandatory Redemption, on December 18, 2009, we effected a 1-for-10 reverse stock split of our common stock.
4
On December 22, 2009, we completed the Mandatory Redemption, whereby $266.8 million of the Interim Notes were exchanged in consideration for:
- •
- 30,578,567 shares of common stock (on a post-reverse stock split basis), representing approximately 67% of our
outstanding shares on a fully diluted basis, with a fair value upon issuance of $156.6 million;
- •
- approximately $12.7 million in cash; and
- •
- approximately $113.5 million in principal amount of Notes due 2016.
The purpose of the Exchange Offer and Mandatory Redemption transactions was to reduce our outstanding debt and cash interest requirements and extend the maturity of our outstanding debt. As a result of the Exchange Offer and Mandatory Redemption, the total carrying value of our outstanding debt was reduced by $171.7 million, the maturity of a substantial portion of our debt was extended from 2012 to 2016 and our annual cash interest payments were reduced by more than $20.0 million to approximately $6.0 million.
In connection with the consummation of the Exchange Offer and redemption of debt, the resignations of the following individuals serving on our Board of Directors became effective: John D. Beletic, Randall A. Hack, Mark E. Holliday, John B. Muleta and Neil S. Subin. We intend to reduce the size of our Board from nine to seven members and have appointed John K. Braniff to fill one of the vacancies created by the resignations. We are completing the process of evaluating new board members. In order to maintain continuity and provide for a sufficient number of independent directors, we reappointed Messrs. Holliday and Hack to serve on the Board until our next Annual Meeting of Stockholders. John P. Kelly has been appointed the Chairman of the Board of Directors.
See Note 1, Organization and Business and Note 8, Long-term Debt, in the Notes to Consolidated Financial Statements (included in this Form 10-K) for additional information on the Exchange Offer and redemption of debt.
First Avenue/FiberTower merger
On August 29, 2006, First Avenue Networks, Inc., which we refer to in this Form 10-K as First Avenue, completed its merger with FiberTower Network Services Corp. FiberTower Network Services Corp. was formerly known as FiberTower Corporation, and we refer to that company in this Form 10-K as Old FiberTower. We refer to this merger in this Form 10-K as the First Avenue/FiberTower merger.
First Avenue, as the surviving entity of the First Avenue/FiberTower merger, changed its name to FiberTower Corporation and our common stock continues to be listed on the Nasdaq Global Market under the symbol "FTWR." Previously the First Avenue stock traded under the symbol "FRNS."
The First Avenue/FiberTower merger was accounted for as a "reverse acquisition." As a result, all financial information and statements prior to the First Avenue/FiberTower merger included in this Report reflect only the financial results of Old FiberTower on a historical basis after applying the First Avenue/FiberTower merger exchange ratio to historical share-related data. All financial information and financial statements subsequent to the First Avenue/FiberTower merger include the historical results of operations of Old FiberTower and the results of operations of First Avenue from the effective date of the First Avenue/FiberTower merger.
First Avenue was incorporated in Delaware in 1993. Old FiberTower was incorporated in Delaware in 2000.
5
Industry Overview
Backhaul, a critical component of a wireless carrier's network, is the transport component between a cell site and a carrier's mobile switching center or other exchange point. Key factors driving demand for backhaul services include the nationwide rollout of third (3G) and fourth (4G, such as WiMax or LTE) generation networks, the continued rise in voice, video and data usage, and expansion of wireless carriers' geographic coverage. Additionally, according to a report by Visant Strategies, a market research firm, 3G and 4G technologies will require greater backhaul capacity than is in use today. Visant Strategies expects the wireless carriers to connect each 3G and 4G base station with 20-50 megabits per second of capacity initially.
The majority of backhaul traffic in the U.S. is currently transported over a wired infrastructure, typically copper-based T-1 circuits and in some places, fiber optic-based facilities. Copper-based networks are extensively deployed today, but, as backhaul traffic demands increase, the existing copper-based T-1 circuits will approach their capacity limits to transport voice and data traffic. Currently, fiber optic networks, which have a higher capacity for the transport of voice and data traffic as compared to copper networks, service only approximately 10% of existing cell sites, but we expect this number to increase over time. We believe that the cost-prohibitive nature of building fiber optic networks will require multiple transport mediums to be utilized to cover a high percentage of sites with high capacity solutions.
Hybrid networks provide an alternative to the traditional wired backhaul infrastructure. These networks utilize both fiber and microwave connections to provide backhaul transport services to cell sites. Fiber connections are utilized when available and economic, while fixed wireless is used to extend coverage to the remaining sites.
Business Strategy
We seek to grow long-term shareholder value by positioning ourselves to provide long-term solutions for the increasing demand for backhaul capacity. Key elements of our strategy include:
Expand Our Networks Based on Identified Demand. We seek to identify areas of demand in our existing 13 markets and new markets by working closely with our customers to design high-coverage, high-capacity backhaul networks using both microwave and fiber. Our 13 markets continue to have incremental sites to deploy and we are actively submitting sales proposals outside of our existing markets where we have an opportunity to reach scale.
Leverage Existing Network and Customer Relationships. We have already deployed 2,788 billing sites in our 13 markets serving 6,317 billing customer locations. We continue to focus sales and operational resources to improve efficiency by providing incremental backhaul capacity to existing customers and by selling carriers at our existing sites that we have not previously sold. These resources utilize our existing customer relationships, assets and expertise to maximize our financial returns and usage.
Continue to Develop Additional Revenue Sources. Our goal is to use our expertise in backhaul transport to develop new solutions that meet the needs of our customers and expand the types of customers to whom we provide backhaul. In 2007, we first launched Ethernet-based backhaul services and we have continued to expand this product to multiple customers and in 2009 we continued to add revenue derived from sales on our fiber-based assets. Additionally, we are working with Verizon and Qwest to develop the U.S. Government as a new backhaul customer as well as working with fiber service providers as potential wholesale customers for our transport services.
Allocate Capital Efficiently. We are focused on allocating our capital efficiently by balancing new site growth with increasing existing network utilization. We anticipate that we will use between
6
$25 million and $30 million of cash for capital expenditures during 2010. However, our decisions to invest additional capital in structural enhancements or build activities are generally based upon whether such investments exhibit sufficient revenue potential to achieve acceptable risk-adjusted returns. We have the ability to reduce capital spending if market conditions warrant.
FiberTower Strengths
We believe the following strengths will assist us in implementing our strategy:
Extensive Operating Experience Deploying Hybrid Networks. We have a demonstrated expertise in designing, deploying and operating hybrid microwave/fiber networks to provide high-capacity carrier-class backhaul transport services. We deployed our first network in Dallas, TX in 2003 and have expanded to serve 2,788 billing sites across 13 markets throughout the U.S. with over 250 fiber points of presence.
Ability to Design Solutions to Meet Customer Requirements. Our networks are designed to be flexible in order to meet the changing requirements of our customers. We launched as a T1 service provider in 2003 and have continued to evolve our network to add new packet-based protocols such as Ethernet.
Premier Portfolio of Spectrum Assets. Our 24 GHz spectrum and 39 GHz spectrum licenses represent what we believe to be the largest collection of wide-area millimeter wave spectrum licenses in the U.S. for backhaul and similar applications, providing breadth of geographic coverage, depth in key markets and complementary technical and propagation characteristics. Our spectrum enables us to use a wide range of radio technologies. Our spectrum portfolio includes, on average, over 740 MHz in the top 20 U.S. metropolitan areas and, in the aggregate, approximately 1.55 billion channel pops. These 742 wide-area licenses, which include 639 licenses for 39 GHz spectrum and 103 licenses for 24 GHz spectrum, extend over substantially all of the continental U.S., with a population of approximately 300 million. We also possess over 3,300 point-to-point microwave licenses.
Significant Industry Relationships. We have built our networks by forming deep relationships with key infrastructure providers such as tower companies and fiber service providers. Crown Castle International Corp. is an investor in FiberTower and holds approximately 6% of our outstanding stock as of December 31, 2009 and we have master service agreements with tower owners representing 139,000 towers across the U.S. Additionally, we have successfully integrated over 25 different fiber service providers into our network solutions. We plan to continue to develop and grow these relationships as we expand our network.
Experienced and Proven Senior Management Team. Our management team includes key personnel who have previously held senior positions at major communications companies including AT&T, Verizon, Neon Communications, T-Mobile, Flarion Technologies, IDT Spectrum, Nextel, Nortel Networks, Teligent and Winstar Communications.
7
Product and Services
As of December 31, 2009, we offered backhaul transport services to major wireless carriers in the following 13 markets:
| Atlanta | Houston | |
| Boston | New York/New Jersey | |
| Chicago | Pittsburgh | |
| Cleveland | San Antonio/Austin/Waco | |
| Dallas/Fort Worth | Washington DC/N. Virginia/S. Maryland | |
| Denver | West Florida | |
| Detroit |
Backhaul transport bridges the distance between cell sites and the landline fiber optic infrastructure. Our services provide this connection through a hybrid approach that utilizes both wireless radios and wireline fiber-based networks. The main service offerings include:
- •
- TDM/SONET. These services include selling individual
T-1s to carrier customers and have also included selling larger bulk capacity services such as n × Tl, DS-3 and up to OC-N Level SONET
services provided over fiber and wireless.
- •
- Ethernet. In 2007, we began offering Ethernet-based services to the cell site. These services are offered over the same network as our other services and range in speeds from 5 Mbps to in excess of 150 Mbps.
We sell these backhaul services directly to wireless carriers, generally under three or five-year service contracts. Our connections are designed to support all voice, video and data applications and all air interface technologies currently required by our customers.
Sales and Marketing
Our national sales organization primarily focuses on two types of customers: national carriers and regional carriers. National carriers typically have presence in all or most of our deployed markets whereas regional carriers usually have presence in a subset of our markets.
Our sales approach consists of working with customers in a consultative manner to design networks that fit their needs and meet our economic requirements. Our sales organization is assisted by staff providing sales engineering, research, proposal and customer development support, working closely with the sales teams on customer pricing, invoicing, contract management and sales programs.
We have entered into master services agreements with AT&T Mobility, Clearwire, Leap, Metro PCS, Sprint Nextel, T-Mobile, Revol, U.S. Cellular and Verizon Wireless.
We hold separate service agreements with Verizon Business and Qwest Communications, as their fixed wireless partner on the General Services Administration Networx contract to provide fixed wireless government-grade primary transport and physically diverse network transportation services. The service agreement with Verizon Business also allows us to provide government-grade services for other Verizon Business-managed contracts. We intend to continue to develop government-related relationships and future revenue opportunities.
8
Our Network
Network Architecture
The networks we deploy consist of both a wireless and wireline component. The wireless portion utilizes a Point-to-Point radio link over the 11 GHz, 18 GHz, 23 GHz, 24 GHz and 39 GHz microwave radio spectrum. The 11 GHz, 18 GHz and 23 GHz spectrum is licensed to us on a site-by-site basis by the FCC. The 24 GHz and 39 GHz spectrum is our own licensed spectrum.
Using the licensed radio spectrum, we transport voice, video and data traffic from wireless carrier base stations to aggregation sites, known as Fiber Exchange Points, or FEPs. At these FEPs, the customer traffic is transferred from the wireless network to a fiber-based wireline network. The aggregated traffic streams are converted at the FEP sites for delivery to carrier Mobile Switching Centers, or MSCs, or other drop-off locations over fiber optic networks.
Multiple FEP sites, strategically positioned throughout our markets, support carrier traffic grooming, aggregation and signal handoff to fixed network fiber optic facilities for transport to carrier MSCs or other drop-off points. These fiber facilities are typically provided in the form of dark fiber transport leases by national or regional fiber service providers, or FSPs. In certain cases, we utilize lit fiber capacity where dark fiber is not available or economically feasible.
We currently have equipment in place at FEP sites not currently using dark fiber which can be modified to utilize dark fiber for a relatively small incremental cost. This enables us to reap significant cost savings, increase operating leverage and enhance control and reliability over transmissions to carrier MSCs or other drop-off locations.
We enter into leases at cell sites and FEPs, which provide space to place our equipment on the tower or other structure as well as ground space for an equipment cabinet. We also generally obtain rights from customers to place similar equipment in their MSC or other exchange point and, in certain circumstances, to place equipment in their space at a cell site.
Network Deployment and Management
We manage the deployment of our networks using both internal resources as well as national and regional telecommunications contractors. In mature markets, our own local team may lead market expansion projects or direct local telecommunications contractors. For new markets where we do not yet have an established presence, we typically engage a major telecommunications deployment partner to manage the network deployment.
We manage and monitor our networks on a 24 hour per day, seven day per week basis from our Network Operating Centers (NOCs). We operate a primary NOC in San Francisco, California, with a back-up system in Dallas, Texas. Through our scalable back office systems and business processes, we enable customers to have visibility across the network and to access an integrated suite of management tools that provides insight into network status and repair activities. Our online reporting applications and processes enable increased service quality as they allow for immediate analysis of network faults and as a result, minimize repair times and outage minutes.
Equipment
We purchase equipment from major telecommunications equipment manufacturers and typically maintain multiple vendors for critical types of network equipment in order to ensure availability and reliability of supply. We have designed our network to use equipment that is widely available in high volume and deployed in large scale worldwide.
Advances in technology and increased competition among manufacturers have led to the development of new network equipment, such as antennas, which are less costly, more compact and
9
capable of supporting higher transmission capacities. This has led to several economic and operational benefits for us including lower rent expense, reduced structural analysis costs and deployment lead times, increased flexibility in equipment placement, and zoning fee reductions.
Our Spectrum
Our spectrum portfolio includes 639 licenses for channels in the 38.6-40.0 GHz (39 GHz) spectrum and 103 licenses in the 24 GHz spectrum and extends over substantially all of the continental U.S., with a population of approximately 300 million. We have one of the largest and most comprehensive FCC-granted millimeter wave spectrum license portfolios in the U.S. including, on average, over 740 MHz in the top 20 metropolitan areas. In the aggregate, our licenses represent approximately 1.55 billion channel pops.
The following table summarizes our license holdings and total channel pops in the 50 largest U.S. markets.
10
License Holdings and Channel Pops in All Markets
Basic Economic Area
|
24 GHz Wide-Area Licensed Channels(1) |
39 GHz Wide-Area Licensed Channels(2) |
Total Channel Pops(3) |
|||||||
|---|---|---|---|---|---|---|---|---|---|---|
New York, NY |
5 | 4 | 115.9 | |||||||
Los Angeles, CA |
5 | 4 | 115.8 | |||||||
Chicago, IL |
5 | 3 | 71.1 | |||||||
Washington, DC/Baltimore, MD |
5 | 3 | 62.1 | |||||||
San Francisco, CA |
5 | 4 | 55.1 | |||||||
Detroit, MI |
5 | 5 | 54.5 | |||||||
Philadelphia, PA |
4 | 4 | 49.5 | |||||||
Dallas, TX |
5 | 3 | 48.5 | |||||||
Houston, TX |
5 | 3 | 43.1 | |||||||
Atlanta, GA |
5 | 3 | 38.8 | |||||||
Boston, MA |
5 | 3 | 35.4 | |||||||
Miami, FL |
5 | 3 | 29.2 | |||||||
Seattle, WA |
5 | 3 | 26.6 | |||||||
Minneapolis, MN |
5 | 2 | 25.8 | |||||||
Phoenix, AZ |
5 | 2 | 25.3 | |||||||
Cleveland, OH |
5 | 4 | 25.1 | |||||||
Pittsburgh, PA |
4 | 5 | 24.5 | |||||||
St. Louis, MO |
5 | 3 | 23.2 | |||||||
San Diego, CA |
4 | 2 | 22.9 | |||||||
Tampa, FL |
5 | 2 | 18.9 | |||||||
Portland, OR |
4 | 4 | 18.6 | |||||||
Indianapolis, IN |
4 | 4 | 17.9 | |||||||
Denver, CO |
2 | 3 | 17.4 | |||||||
San Antonio, TX |
4 | 3 | 16.4 | |||||||
Kansas City, MO |
4 | 4 | 15.9 | |||||||
Orlando, FL |
1 | 4 | 14.6 | |||||||
Puerto Rico |
0 | 1 | 14.4 | |||||||
Sacramento, CA |
4 | 2 | 13.0 | |||||||
Milwaukee, WI |
4 | 3 | 12.8 | |||||||
Columbus, OH |
2 | 4 | 12.1 | |||||||
Cincinnati, OH |
3 | 3 | 11.9 | |||||||
Salt Lake City, UT |
1 | 3 | 11.5 | |||||||
Raleigh, NC |
1 | 6 | 11.5 | |||||||
Nashville, TN |
1 | 4 | 10.7 | |||||||
New Orleans, LA |
1 | 5 | 9.9 | |||||||
Oklahoma City, OK |
1 | 5 | 9.5 | |||||||
Greenville, SC |
1 | 3 | 9.1 | |||||||
Charlotte, NC |
1 | 4 | 9.0 | |||||||
Rochester, NY |
1 | 5 | 8.5 | |||||||
Albany, NY |
1 | 5 | 8.4 | |||||||
Syracuse, NY |
1 | 4 | 8.3 | |||||||
Jacksonville, FL |
1 | 4 | 8.1 | |||||||
Austin, TX |
1 | 5 | 7.8 | |||||||
Las Vegas, NV |
1 | 2 | 7.5 | |||||||
Grand Rapids, MI |
0 | 4 | 7.5 | |||||||
Memphis, TN |
1 | 3 | 6.8 | |||||||
Louisville, KY |
1 | 4 | 6.7 | |||||||
Norfolk, VA |
2 | 3 | 6.7 | |||||||
Buffalo, NY |
1 | 4 | 6.6 | |||||||
Birmingham, AL |
1 | 4 | 5.7 | |||||||
Total Top 50 Markets |
148 | 177 | 1,236.1 | |||||||
Grand Total All Markets and Legacy Licenses |
179 | 634.6 | 1,549.6 | |||||||
- (1)
- 24 GHz SMSA licenses represent those licenses granted by the FCC that encompass Statistical Metropolitan Service Areas. FiberTower holds 102 such SMSAs. BEAs represent Basic Economic Areas. FiberTower holds
11
one BEA license in the 24 GHz band. For both SMSAs and BEAs in the 24 GHz band, each channel represents 80 MHz.
- (2)
- 39
GHz BEA licenses represent only those licenses granted by the FCC that encompass Basic Economic Areas. FiberTower holds 352 such BEAs. 39 GHz Rectangular
Service Area (RSA) or "legacy" licenses were granted prior to the FCC awarding BEAs at auction. The RSAs were grandfathered into Basic Economic Areas and have different regulatory characteristics.
FiberTower holds 290 RSAs. Two RSA's hold 2 channels. Five RSAs hold a half channel. For both 39 GHz BEAs and 39 GHz RSAs, each channel represents 100 MHz.
- (3)
- Total channel pops shown in millions of pops per Basic Economic Area (based on 2000 census data).
Competition
We compete with a range of diversified telecommunications services providers. Our competitors include:
Incumbent and Competitive Local Exchange Carriers. The mobile wireless backhaul services market is currently dominated by Incumbent Local Exchange Carriers, or ILECs, including AT&T, Verizon, Embarq, and Qwest which provide backhaul services primarily over copper lines but increasingly over fiber. These carriers own significant network assets and often have affiliated relationships with their mobile wireless carrier customers, such as AT&T's relationship with AT&T Mobility and Verizon's relationship with Verizon Wireless.
Cable Multiple System Operators. Cable multiple system operators, or MSOs, including Cox, Time Warner Cable, Bright House and Comcast, among others, are moving to offer broadband access over their networks and offer or are considering offering backhaul services.
Wireless Carriers. The wireless carriers have constructed their own wireless and wireline backhaul networks in certain geographic regions and have the ability to build more of these networks.
Fiber Service Providers. Fiber services providers, including Level 3 Communications, Time Warner Telecom, Zayo Broadband, DukeNet and FPL FiberNet are moving aggressively to provide direct fiber optic links to cell towers.
Emerging Competition. Satellite providers that use spectrum suitable for high-bandwidth transport services could emerge as competitors. Some 4G equipment manufacturers are also promoting using "in-band" equipment (i.e., equipment that uses the mobile carrier's own spectrum) to provide backhaul. In addition to us, a number of companies, some of which have significant spectrum assets, have launched, or are considering launching fixed wireless backhaul networks including Tower Cloud, Telecom Transport Management Inc. and IDT Spectrum (a subsidiary of IDT Corporation).
Our primary competition are the ILECs who provide approximately 90% of the backhaul services purchased today. FiberTower competes with the ILECs and others by providing service at a discount to the market price typically charged by the ILEC. In addition, we offer a provisioning schedule which is generally much quicker than our competitors that meets minimum service reliability requirements of our customers and oftentimes improves upon services currently provided by our competition.
Many competitors are well-established and have larger and better developed networks and systems, longer standing relationships with customers and suppliers, greater name recognition and greater financial, technical and marketing resources than we have. These competitors can often subsidize competing services with revenues from other sources, such as customer services, content or advertising, and thus may offer their services at lower prices. These or other competitors may also reduce the prices of their services significantly or may offer backhaul connectivity with other services, which could make their services more attractive to customers. Given the intense competition, we may be unable to compete effectively with these and other technologies and service providers and, consequently, we may
12
be unable to attract customers and grow and maintain our sales, or we may experience difficulty in developing long-term opportunities.
Employees
As of December 31, 2009, we had 144 employees, of whom 98 were in Engineering, Market/Field Operations, and Network Operations, the payroll-related costs of which are classified as Cost of Service Revenues; 12 were in Sales and Marketing; and 34 were in General and Administrative. In May 2008, management announced staffing reductions throughout FiberTower as part of its cost reduction efforts. See Note 4, Restructuring Charges, in the Notes to Consolidated Financial Statements for further information.
None of our employees are represented by a collective bargaining agreement. We believe our relations with our employees are satisfactory and that our continued success will depend, in part, on our ability to attract and retain highly qualified and motivated employees and on maintaining positive working relations with current employees
REGULATORY ENVIRONMENT
Government Regulation
Our wireless broadband services are subject to regulation by the FCC and to a lesser extent, the Commerce Department, General Services Administration and the State Department. We may also be subject to telecommunications regulation by state and local governmental agencies. At the federal level, the FCC has jurisdiction over the use of the electromagnetic spectrum (i.e., wireless transmissions) and has exclusive jurisdiction over all interstate telecommunications services (those that originate in one state and terminate in another state). State regulatory commissions have jurisdiction over intrastate communications (those that originate and terminate in the same state). Municipalities may regulate limited aspects of our business by, for example, imposing zoning requirements and requiring installation permits. The regulations are continually evolving. On a broader level, this includes changes resulting from presidential or congressional election cycles. On a more specific level, these changes occur through rulemaking and other administrative and judicial proceedings. It is possible that regulatory, legislative or judicial changes could have an adverse effect on our business.
2008 and 2010 Federal Elections. The November 2008 presidential and congressional elections brought, and will continue to bring, regulatory and legislative change. This includes new or refreshed broadband stimulus programs, a new emphasis on the FCC developing a national broadband policy due to Congress on March 17, 2010 and different FCC oversight priorities, along with a new FCC Chairman and two new FCC Commissioners who were all seated in 2009. The congressional elections scheduled for November 2010 may also bring additional changes to the emphasis placed on new and existing policies and programs.
Federal Regulation and Programs
FCC Licensing. As an FCC licensee and FCC regulated entity, we are subject to comprehensive regulatory oversight, including regulations constraining foreign ownership of us, rules governing our licenses and radio equipment, and rules related to construction and operation of our services. In addition, we are subject to certain regulatory and other fees levied by the FCC for certain classes of licenses and services. Under certain circumstances, including certain violations of FCC rules, our licenses may be revoked, canceled, conditioned, not renewed upon expiration or we may be fined. Among other things, the Communications Act of 1934, as amended, and the FCC rules and regulations impose requirements on radio licensees and carriers that include regulations on the ownership, operation, acquisition and sale of the broadband operating radio systems that are needed to provide the services we offer.
13
Wide-area licensing. We hold wide-area licenses in the 24.25-24.45 GHz and 25.05-25.25 GHz (24 GHz) and 38.6-40.0 GHz (39 GHz) bands. The FCC operational rules generally provide significant flexibility to licensees operating in both the 24 GHz and 39 GHz bands. For example, licensees are permitted to offer point-to-multipoint and point-to-point services, and, at least in the 39 GHz band, will be permitted to provide mobile device services upon adoption of inter-licensee coordination policies.
Point-to-point licensing. In addition to our 24 GHz and 39 GHz wide-area licenses, we also provide transmission links utilizing point-to-point licensed spectrum licensed by the FCC in other bands, including 6 GHz, 10 GHz, 11 GHz, 18 GHz and 23 GHz bands. We hold over 3,000 point-to-point licenses. A point-to-point licensee may only operate from the exact geographic coordinates identified on the license. Any changes that require operation at another coordinate require either a license modification or a new license. The FCC generally processes such applications for point-to-point microwave licenses on a routine basis.
License Renewal. Our spectrum licenses in the 24 GHz and 39 GHz bands are granted for ten-year terms with renewal dates ranging from 2010 to 2020. On October 1, 2008, renewal applications for our 39 GHz licenses that were scheduled to expire in 2007 received either i) ten-year renewals for licenses deemed constructed or ii) ten-year renewals contingent upon meeting construction requirements which the FCC extended until June 1, 2012. Recent applications to renew or extend construction deadlines for 39 GHz licenses expiring in 2009 and 2010 have been granted by the FCC. In order for our 24 GHz and 39 GHz licenses to qualify for renewal in the future, we must file renewal applications for each license prior to expiration and demonstrate that we have provided "substantial service" by the end of the term of each license (which is February 1, 2011 for 102 of the 103 24 GHz licenses) or by an FCC approved substantial service showing date (which is June 1, 2012 for a substantial majority of the 39 GHz licenses). The FCC's substantial service renewal standard for both the 24 GHz and 39 GHz licenses is intended to provide licensees with flexibility in demonstrating usage of their licenses. The FCC's "safe harbor" test provides licensees with a degree of certainty as to how to comply with the substantial service requirement. For example, for 39 GHz licensees offering point-to-point service, the FCC has said that the construction of four links per channel per million persons in the license area will meet the substantial service test. For 24 GHz point-to-point/multipoint licensees, the FCC has said that a showing of four links per million persons within a service area or service to an area that has very limited access to either wireless or wireline telecommunications services will meet the substantial service test. FCC precedent also exists in the millimeter wave bands for meeting buildout requirements by constructing a point-to-multipoint system whose signal reaches 20% or more of the population in the license area. While the safe harbors are intended to provide guidance, they are not the only way for licensees to demonstrate substantial service. Licensees may show that they have met the substantial service test in other ways, such as providing niche services or offering services to underserved consumers, however, there is little precedent in this area at this time. Accordingly, we believe that the level of service that will be considered "substantial" by the FCC at renewal may vary depending upon the type of product offering by the licensee. Further, the FCC may modify its interpretation of substantial service and, in the future, we may encounter more stringent substantial service requirements. License renewal is not guaranteed and the FCC holds significant discretion in making renewal decisions. The loss of some number of our licenses could limit the expansion of our business, cause us to take impairment charges to our FCC licenses intangible asset and harm our operating results.
We do not currently meet the substantial service safe harbor guidance provided by the FCC for the substantial majority of our 24 GHz and 39 GHz licenses, which require renewal applications or showings mostly in the 2011-2012 time period. We believe that our licenses will be renewed based on our significant network investment, spectrum offerings and expanding geographic coverage.
The point-to-point licenses that we possess also have a ten-year term and, as long as the point-to-point link remains operational, may be renewed by paying a minimal license renewal fee.
14
Spectrum Leasing. The FCC has also adopted regulations permitting certain classes of licensees, such as 24 GHz and 39 GHz licensees, to lease a portion, or all, of their spectrum to third parties. We refer to those regulations as the Secondary Market Ruling. The FCC's spectrum leasing rules are generally designed to promote a secondary market for spectrum and provide a number of options for leasing depending upon the degree of control that the lessee desires to be afforded. Since the ruling, we believe that the transaction costs associated with meeting FCC documentation requirements for any kind of spectrum leasing have decreased from over $20,000 per lease to a negligible amount. While generally beneficial to licensees, the FCC's leasing rules may introduce additional competition to the types of services and products that we offer. Moreover, the FCC spectrum leasing rules could be modified in a manner that is not favorable to our business.
Band Sharing. Licenses in the 39 GHz band are subject to an arrangement between the FCC and the Department of Industry of Canada regarding sharing between broadband wireless systems along the U.S.-Canada border. Additionally, this band is subject to satellite power flux density limits which might limit our ability to provide service in certain conditions if certain satellite systems receive the right to operate.
Auctions. Since 1994, the FCC has conducted auctions of licenses for spectrum. In July 2004, the FCC auctioned 80 MHz licenses for 24 GHz spectrum in 176 Basic Economic Areas (BEA, or BEAs) covering the entire United States. Licenses in seven BEAs were purchased covering 12.8 million pops, including one by us. As discussed below, the purchasers typically acquired spectrum in areas outside our 24 GHz spectrum holdings.
Our 24 GHz licenses are for geographic areas known as SMSAs (Standard Metropolitan Statistical Area) and were originally awarded to Teligent, a company from whom we acquired the licenses in 2005, as replacement spectrum due to rebanding in the 18 GHz band. Importantly, new licensees in the 24 GHz band, who may be authorized for service areas larger than the SMSAs, must protect operations conducted under our authorizations in order to not interfere with our business.
The availability of more spectrum in the 24 GHz or 39 GHz band could increase the number of entities with which we compete. In the future, the FCC could decide to hold another 24 GHz auction. The FCC still controls a substantial amount of 39 GHz spectrum. The FCC could auction this spectrum in the future, increasing the number of entities that hold this spectrum. Additionally, in a pending proceeding, the FCC is considering the allocation and licensing by auction of additional spectrum in the 37-38.6 GHz range. In the future, the FCC could make available additional spectrum between 10 and 40 GHz. For example, in May 2008, the Utilities Telecommunications Council (UTC), along with Winchestor Cator, L.L.C., petitioned the FCC for secondary access nationwide to the 14.0-14.5 GHz band to, among other applications, provide fixed broadband wireless access to utilities for critical infrastructure communications and management. When not utilized by utilities, Winchestor Cator proposes to manage and achieve access to the spectrum. The satellite industry and others filed in opposition to this proposal. FiberTower filed comments asking the FCC to determine a modern definition for those who provide broadband for critical infrastructure applications, arguing that the definition pre-dates September 11, 2001, and is therefore stale. Throughout 2009, UTC made additional filings on this matter with the FCC and other federal agencies. It is not clear at this point if, when or how the FCC may rule in this still pending 14 GHz proceeding.
SafeView's SafeScout Interference Issues. On September 5, 2006, we filed with the FCC a Petition for Reconsideration of the FCC's August 4, 2006 Order granting a waiver to SafeView, Inc. to permit the certification, marketing, and operation of SafeView's SafeScout unlicensed imaging device under Part 15 of the FCC's Rules. The SafeScout is a device that uses imaging technology to detect contraband or weapons carried by individuals, and would be particularly useful in airports. The FCC noted that, by operating as a Part 15 unlicensed device, the SafeScout must accept harmful interference and not cause interference to primary licensees like FiberTower. In addition, the FCC imposed certain
15
conditions on SafeView's operation of the SafeScout, including limiting installations to indoor areas and maintaining a database of installed devices. L-3 Communications later purchased SafeView renaming it L-3 Communications SafeView, Inc. On January 14, 2010, the FCC issued a ruling granting in part and denying in part the FiberTower Petition. In particular, unlicensed devices like the SafeView product must continue to abide by the Part 15 rules for unlicensed devices and shut down immediately if they cause interference to licensed users like FiberTower. In addition, L-3 Communications SafeView must continue to maintain and update a list of all installed devices that follows changes in device location and/or transfer of ownership to third parties subsequent to an initial sale.
Policies and Service Rules for the Broadcasting-Satellite Service. In June 2006, the FCC released a further Notice of Proposed Rulemaking specifically seeking to promote prompt commencement of the 17/24 GHz Broadcasting Satellite Service, or BSS, which is intended to introduce a new generation of broadband services to residential and business subscribers in the United States. The proposed BSS use includes ground-to-satellite uplinks in spectrum that overlaps with part of the 24 GHz spectrum for which we are licensed. In the proceeding, the FCC seeks comment on (1) whether the existing power limits for satellite earth stations in bands shared co-equally with terrestrial radio communications services are appropriate, and (2) whether the antenna pattern requirements applicable to BSS feeder-link stations should be modified to relieve the coordination burden on either BSS or 24 GHz or both services. We filed comments on October 16, 2006 and reply comments on November 15, 2006 concerning the technical requirements for inter-service operations and sharing in the 24 GHz band designed to assure that interference concerns are minimized or eliminated. On May 4, 2007, the FCC released a Report and Order and Further Notice of Proposed Rulemaking (R&O). In the R&O, the FCC stated that it does not intend to license 24 GHz BSS feeder links to operate in existing 24 GHz FS licensed areas. The FCC also designated an interference standard for BSS feeder link stations that may operate near the borders of 24 GHz license areas. We continue to examine that border interference standard in the context of the architecture of any future BSS feeder link stations that may become licensed and operational. At this time, no such feeder stations are known to be operating, or licensed for specific operation in the 24 GHz band or near our license areas. Prior to and during 2008, satellite companies filed applications to operate 17/24 GHz BSS systems. We are tracking these applications and expect to assess which ones may result in licensed and built systems. We also filed comments in 2009 in the FCC National Broadband Policy proceeding highlighting that any such potential operations in or near the FiberTower license areas should be coordinated by and conducted only through, where technically and economically feasible to FiberTower, a business relationship with FiberTower in order for FiberTower to manage its existing and growing operations in the 24 GHz band.
Unbundled Network Elements (UNEs) and Special Access Transport. As of March 11, 2006, incumbent local exchange carriers, or ILECs, are no longer required to lease certain parts of their network at favorable costs to their competitors. Instead, Competitive Local Exchange Carriers, or CLECs, and others that had been using these unbundled network elements from the ILECs must obtain them from other sources or negotiate new supply arrangements with ILECs. This ruling affected mass market local switching and, in many circumstances, DS-1 (1.5 megabits per second) and DS-3 (45 megabits per second) local access and transport. Nonetheless, in the FCC's approval of the AT&T/BellSouth merger, the FCC conditioned their approval upon the merged company continuing to provide certain unbundled network elements at current rates for a period of time to our competitors. It also required certain ILECs to offer similar prices in their territories to competitors in order to obtain those rates from AT&T. We expect that there may be some instances when competitive carriers will seek alternative (non-ILEC) services, and we hope to serve those carriers with broadband, fixed wireless transport solutions. At this time, the FCC continues to investigate whether UNEs and special access transport are being priced reasonably to carriers who do not possess facilities in the markets in which they need such UNEs or transport.
16
Private Carriage. Although there has been a narrowing of the differences in regulatory requirements applicable to common carriers and private transmission companies in recent years, the FCC regulations applicable to common carriers remains more extensive. Generally, the Communications Act regards firms that offer transmission services directly to the public for a fee as common carriers. We currently offer our fixed wireless services to particular customers with specific needs on an individual contract basis. We do not hold ourselves out to the public for the provision of our services. As such, we believe we operate as a private carrier and are not subject to the FCC's common carrier regulations. Nonetheless, the FCC could determine that we are operating as a common carrier, and as a result, determine that we are subject to its common carrier rules and regulations which would likely increase our costs of providing service and could have an adverse impact on our business operations, revenues, and profitability.
Building Access and RF Exposure Proceedings. On October 22, 2007, notice was published in the Federal Register that the FCC is collecting additional information for its record in multiple building access and radio- frequency exposure proceedings, most originally adopted in October 2000. Those proceedings, designed to foster competition in local communications markets by implementing measures to ensure that competing telecommunications providers, including fixed wireless providers, are able to provide services to customers in multiple tenant environments (MTEs). Specifically, the rules: (i) prohibited carriers from entering into contracts that restrict or effectively restrict a property owner's ability to permit entry by competing carriers; (ii) established procedures to facilitate moving the demarcation point to the minimum point of entry (MPOE) at the building owner's request, and requires incumbent local exchange carriers (ILECs) to timely disclose the location of existing demarcation points where they are not located at the MPOE; (iii) determined that utilities, including ILECs, must afford telecommunications carriers and cable service providers reasonable and non-discriminatory access to their conduits and rights-of-way located in customer buildings and campuses; and (iv) extended to fixed wireless antennas the existing prohibition of restrictions that impair the installation, maintenance or use of certain video antennas on property within the exclusive use or control of the antenna user, where the user has a direct or indirect ownership or leasehold interest in the property. The potential impact on FiberTower of these rulemakings is uncertain.
The FCC also stated that this information collection will also help ensure that customer-end antennas used for telecommunications service comply with the FCC's limits on radio frequency exposure and it will provide the Commission with information on the state of the market. At this time, the FCC has yet to make a ruling or suggest changes to existing rules related to these matters.
Pole Attachments. On February 6, 2008, an FCC Notice of Proposed Rulemaking was published in the Federal Register. The FCC sought comment on whether to amend its rules governing pole attachments, which are designed to ensure the attachment of facilities of telecommunications carriers and cable television systems to utility poles, ducts, conduits, or rights-of-way (collectively, "pole attachments") at just and reasonable rates, terms and conditions. The FCC noted that the current pole attachment rules may be inadequate in scope or no longer in accord with developing technology and business models. The FCC has found no clear indication that the rules could not accommodate wireless attachers' use of poles. The FCC sought comment on whether, when they are "telecommunications carriers," wireless providers are entitled to the telecommunications rate as a matter of law, or whether the Commission should adopt a rate specifically for wireless pole attachments. The Commission asked whether, if a wireless facility uses more than the presumptive one foot of space, the per-foot rate could simply be doubled, trebled, or otherwise multiplied as required. Comments were filed March 7, 2008 and Reply Comments were filed on April 7, 2008. FCC activity in this area in 2009 was limited to advocacy from various parties. We expect the FCC to renew work in this proceeding in 2010 as it continues to work on the National Broadband Policy. The potential impact on FiberTower of this proposed rulemaking is uncertain.
17
National Broadband Plan. The FCC must issue a National Broadband Plan to Congress by March 17, 2010. As preparation for that deadline, the FCC initiated over two dozen separate rulemakings, conducted public workshops, and held FCC Commissioner-chaired hearings and FCC Commission meetings. The FCC has already identified Middle Mile backhaul as a key element in the National Broadband Plan effort. FiberTower participated in several rulemakings directly or through its trade associations. FiberTower was invited to participate in two spectrum workshops in October 2009 and a hearing chaired by FCC Chairman Genachowski on Nov. 8, 2009. The National Broadband Plan will result in subsequent (i) Congressional hearings and (ii) multiple FCC rulemakings on numerous aspects of broadband policy that should occur in 2010 and likely extend well into 2011 and beyond. Substantial changes in the policy concerning government efforts to stimulate broadband growth may result in significant alterations to, among other items, spectrum policy, rules enforcement, government involvement in broadband deployment and financing, and mobile network siting, zoning and deployment issues.
Advice to NTIA. The FCC may receive funds from, or provide advice to, NTIA for national broadband mapping, national broadband policy development, and other matters.
Intellectual Property. On November 14, 2005, we applied to the U.S. Patent and Trademark Office (PTO) for a service mark for a shared infrastructure backhaul service that allows for collocating backhaul for first responder networks, municipal (school, hospital, local government, etc.) networks, commercial mobile networks and other systems. On October 28, 2008, the PTO granted us a registration for MuniFrame®. We used this mark in our Round 1 BTOP applications to further demonstrate that our services meet eligibility criteria for NTIA BTOP grants and other broadband-related programs funded in the ARRA. However, there is no assurance that even if this mark meets such eligibility criteria, that we will be able to avail ourselves of funding for such from the ARRA.
On December 9, 2008, the PTO granted trademark registration for FiberTower® for use in describing broadband communications services.
State Regulation
Our services are non-switched wireless transmission links that we offer on a private, rather than on a common carrier basis. However, if (i) FiberTower decides to become a common carrier to avail itself of benefits related to that status; or (ii) one or more states determine that FiberTower is providing intrastate, common carrier service, we would be subject to state regulation in those states. Regulations vary in each state, but if we are deemed to be providing intrastate service, we may be required to apply for and maintain Certificates of Public Convenience and Necessity in some or all of the states in which we have operations and may also then be required to make similar common carrier filings with the FCC. We also may be required to fulfill other state requirements, such as file tariffs, reports and contribute to state universal service funds, among other things.
Available Information
Our Internet address is www.fibertower.com. On the Investor Relations portion of this web site, we make available free of charge our Annual Report on Form 10-K, quarterly reports on Form 10-Q, current reports on Form 8-K, proxy statements and any amendments to those reports as soon as reasonably practicable after they are filed with or furnished to the SEC.
18
While the following are the risks and uncertainties we believe are most important for you to consider, they are not the only risks or uncertainties facing us or that may adversely affect our business. Additional risks and uncertainties not presently known to us or that we currently deem immaterial may also impair our business. If any of these risks and uncertainties actually occurs, our business, financial condition and results of operations would be harmed substantially.
Risks Related to our Business Operations
We expect to incur operating and net losses and negative cash flows for the next few years.
We have incurred net losses and negative cash flows from operating and investing activities since our inception, and we expect that we will continue to incur operating and net losses and negative cash flows for the next few years as we continue to invest to expand our network. As a result, we may not achieve or sustain profitability in the future. Our ability to achieve profitability will depend, in part, on our ability to:
- •
- acquire and retain customers;
- •
- react to changes, including technological changes, in the markets we target;
- •
- deploy our services in additional markets;
- •
- respond to competitive pressures;
- •
- manage costs;
- •
- attract and retain experienced and talented personnel; and
- •
- establish strategic and maintain existing business relationships.
Accordingly, our historical revenue may not be indicative of future revenue based on comparable traffic volumes. If the prices for our communications services decrease, and if we are unable to offer additional services from which we can derive additional revenue or otherwise reduce our operating expenses, our operating results will decline and our business and financial results will suffer.
We may require significant funds in the future, which may not be available to us to operate and expand our business.
As of December 31, 2009, we had unrestricted cash and cash equivalents of $50.7 million. However, our business is capital intensive, and we may require additional funds to fund capital expenditures and pay operating expenses in the future. We may be unable to secure additional financing when needed, on acceptable terms, or at all, for these purposes. Any such financing could be subject to onerous terms and could be very dilutive to our stockholders. If we are unable to secure capital when needed, our business plans could be adversely affected and our results of operations could suffer.
We may be unable to successfully execute any of our currently identified business opportunities or future business opportunities that we determine to pursue.
In order to pursue business opportunities, we will need to continue to build our infrastructure and operational capabilities. Our ability to do any of these successfully could be affected by one or more of the following factors:
- •
- whether our equipment, our equipment suppliers or our service providers perform as we expect;
- •
- our ability to achieve market acceptance of our services;
19
- •
- our ability to execute our business strategy, which could be affected by our limited experience in providing
high-speed transmission services;
- •
- our ability to effectively manage our third party relationships;
- •
- our ability to negotiate acceptable agreements to secure suitable locations for our radios and antennas;
- •
- our ability to manage the expansion of our operations, which could result in increased costs, high employee turnover or
damage to customer relationships;
- •
- our ability to attract and retain qualified personnel, which may be affected by the significant competition in our
industry for persons experienced in network operations and engineering;
- •
- equipment failure or interruption of service, which could adversely affect our reputation and our relations with our
customers;
- •
- our ability to respond to regulatory or policy changes in our industry;
- •
- our ability to accurately predict and respond to the rapid technological changes in our industry and the evolving demands
of the markets we serve; and
- •
- our ability to raise substantial additional capital to fund our growth.
Our failure to adequately address one or more of the above factors would have a significant impact on our ability to implement our business plan with respect to mobile backhaul and fiber network extensions and our ability to pursue other opportunities that arise, which might negatively affect our business.
We may experience difficulties in constructing, upgrading and maintaining our network, which could adversely affect customer satisfaction, increase carrier turnover and reduce revenues.
We may experience quality deficiencies, cost overruns and delays on construction, maintenance and upgrade projects, including the portions of those projects not within our control and be unable to build and source fiber on time and on budget. The construction of networks for backhaul services also requires the receipt of permits and approvals from numerous governmental bodies, including municipalities and zoning boards. Such bodies often limit the expansion of transmission towers and other necessary construction. Failure to receive approvals in a timely fashion can delay system rollouts and raise the cost of completing construction projects. In addition, we typically must obtain rights from land, building and tower owners to install our antennas and other equipment to provide our services. We may not be able to obtain, on terms acceptable to us, or at all, the rights necessary to construct our network and expand our services.
We also face challenges in managing and operating our network. These challenges include operating, maintaining and upgrading network and customer premises equipment to accommodate increased traffic or technological advances, and managing the sales, advertising, customer support, billing and collection functions of the business while providing reliable network service at expected speeds and levels of quality. The failure in any of these areas could adversely affect customer satisfaction, increase subscriber turnover, increase costs, decrease our revenues and otherwise have a material adverse effect on our business, prospects, financial condition and results of operations.
We are a relatively new entrant into a highly concentrated market with few potential customers.
There are only a limited number of national mobile wireless carriers in any given regional market and typically fewer than four to seven mobile wireless carriers in any given market who are potential customers for mobile wireless carrier backhaul services. Our business strategy will depend on maintaining and growing customer relationships with a small number of national mobile wireless
20
carriers and additional wireless carriers in each market. The competitors in this market, including large telephone companies, enjoy long-standing and established relationships with all of the mobile wireless carriers. If we are unable to secure and maintain a minimum number of ongoing and growing relationships with carrier customers in each market, our results of operations will be adversely affected.
Two customers accounted for 59% of our revenues in 2009.
AT&T Mobility accounted for 39% of our revenues in 2009, 40% of our revenues in 2008 and 57% of our revenues in 2007. Together with Sprint Nextel which accounted for 20% of our revenues in 2009, AT&T Mobility and Sprint Nextel accounted for 59% of our revenues in 2009. In addition, 15% of our 2009 revenues were from Clearwire Corporation and 15% of our 2009 revenues were from T-Mobile. If we were to lose AT&T Mobility, Sprint Nextel, Clearwire or T-Mobile as a customer, or if any of them reduced their usage of our services or became financially unable to pay our fees, our business, financial condition and operating results would be harmed. In addition, if any of these customers were to encounter financial difficulties, our business could be adversely affected.
The success of our business strategy relies on the continued growth of the mobile wireless services industry and high-bandwidth broadband mobile applications in the U.S.
The demand for backhaul services, including those we offer, depends on the continued growth of the mobile wireless services industry. The provision of mobile wireless services represents an evolving sector of the telecommunications industry, and is subject to a number of risks, including:
- •
- the continued development and use of high-bandwidth mobile applications;
- •
- historical perceptions regarding the burdens and unreliability of previous mobile wireless technologies;
- •
- high rates of consumer adoption of mobile applications;
- •
- increased levels of usage by subscribers;
- •
- increased or burdensome government presence through policy and regulatory changes;
- •
- increases in the number of overall subscribers; and
- •
- the continued development and market acceptance of mobile devices enabled for mobile applications.
If the mobile wireless carrier industry demand for backhaul services does not continue to grow through new subscriber additions and the adoption of high-bandwidth 3G applications, or for any other reason, our operations and financial performance will be adversely affected.
Our revenues depend on the sale of backhaul circuits for mobile wireless carriers.
We derive a substantial majority of our revenues from the sale of backhaul and related services to mobile wireless carriers. We expect that we will continue to derive a substantial majority of our revenues from these services in the future. Any competitor's substitute service with similar performance and coverage characteristics and a lower cost structure could create downward price pressure and adversely affect our sales efforts. In addition, competing technologies could be developed that make our services obsolete. Accordingly, any changes in demand for our services, whether due to pricing pressure, technological changes, or otherwise, could materially and adversely affect our business and results of operations.
21
We operate in a highly competitive environment and may not be able to compete successfully, which could materially and adversely affect our ability to attract customers and maintain and increase our sales.
Our competitors include or could include:
- •
- incumbent and competitive local exchange carriers who offer T-1, DS-3 and higher bandwidth
services or Ethernet-based backhaul services;
- •
- cable multiple system operators offering either T-1, DS-3 and higher bandwidth circuits or
Ethernet-based backhaul services;
- •
- mobile wireless carriers building proprietary backhaul networks;
- •
- fiber services providers with metro area network and distribution facilities;
- •
- satellite providers providing high capacity backhaul services;
- •
- other fixed-wireless service providers using unlicensed or licensed spectrum, suitable for high-bandwidth
transport services; and
- •
- electric utilities and other providers offering or planning to offer broadband access over power lines.
Moreover, we expect other existing and prospective competitors to adopt technologies or business plans similar to ours, or to seek other means to develop a product competitive with our services. Many competitors are well-established and have larger and better developed networks and systems, longer-standing relationships with customers and suppliers, greater name recognition and greater financial, technical and marketing resources than we have. These competitors can often subsidize competing services with revenues from other sources, such as consumer services, content or advertising, and thus may offer their services at lower prices. These or other competitors may also reduce the prices of their services significantly or may offer backhaul connectivity with other services, which could make their services more attractive to customers. Given the intense competition, we may be unable to compete effectively with these and other technologies and service providers and, consequently, we may be unable to attract customers and grow and maintain our sales, or we may experience difficulty in developing long-term opportunities.
An economic or wireless telecommunications industry slowdown may materially and adversely affect our business.
Slowdowns in the U.S. economy or in the telecommunications industry may impact consumer demand for wireless services, thereby reducing demand for our backhaul services, or negatively impact the debt and equity markets, thereby reducing demand for our services by causing wireless carriers to delay or abandon implementation of new systems and technologies, including 3G and other wireless broadband services. Further, the threat of terrorist attacks and the political and economic uncertainties resulting therefrom and other unforeseen events may impose additional risks upon and adversely affect the wireless telecommunications industry and our business.
Competitors or customers may acquire radio spectrum for the purpose of offering similar fixed wireless services, which could impact our growth and negatively affect our operating results.
The FCC and the U.S. Commerce Department each control a substantial amount of radio spectrum that may be procured through auction, application, or other licensing mechanisms and used for provision of fixed wireless services. Fixed wireless radio spectrum could be acquired by companies through sale or lease for the purpose of competing with us. Additionally, companies that we might serve with our wireless operations may elect to acquire spectrum or use spectrum they already control and develop their own fixed wireless networks. Moreover, certain unlicensed technologies may be used
22
to provide services that could be used to compete with our services. All of these could adversely affect our business.
We depend on third parties to help deploy and maintain our infrastructure and equipment to deliver our services.
We rely on third-party contractors to deploy and, in certain markets, to maintain the infrastructure and equipment needed to provide our services. None of these third parties are contractually obligated to continue providing these services to us for any specific period of time. There are inherent risks in relying on third parties to provide these services, including:
- •
- the third parties could determine not to continue providing these types of services in the future, which would require us
to obtain the services from other third-party contractors, or require us to develop the capability to perform these services internally;
- •
- reduced control over delivery schedules and quality of work; or
- •
- defects in third-party work may not be discovered until after services have been provided, which could lead to outages, decreased performance levels and customer dissatisfaction.
If these third-party contractors are unable to provide quality services to us at reasonable prices, or if these third-party providers cease providing these services, our business could be harmed.
In addition, we depend on certain single source suppliers that supply components used in our network to deliver our services. If we need alternative sources for key component parts for any reason, these component parts may not be immediately available to us. If alternative suppliers are not immediately available, we will have to identify and qualify alternative suppliers, and production or delivery of these components may be delayed. We may not be able to find an adequate alternative supplier in a reasonable time period, or on commercially acceptable terms, if at all.
Interruption or failure of information technology and communications systems could impair our ability to provide services, which could damage our reputation and harm our operating results.
We have experienced service interruptions in some markets in the past and may experience service interruptions or system failures in the future. If we experience frequent or persistent system or network failures, our reputation and brand could be permanently harmed. We may make significant capital expenditures to increase the reliability of our systems, but these capital expenditures may not achieve the expected results. In some of our markets, some of our network facilities do not have redundant components. Accordingly, if one of these components were to fail for any reason, our network may not be able to achieve satisfactory performance levels and may even suffer outages. Any service disruptions may have an immediate and significant impact on our ability to attract, retain, and grow customer revenues, which would harm our business and operating results.
We also depend on the continuing operation of our information technology and communications systems. Any damage to or failure of these systems could result in interruptions in service. Interruptions in service could reduce revenues and harm operating results, and our brand could be damaged if people believe the network is unreliable. These systems are also vulnerable to damage or interruption from earthquakes, terrorist attacks, riots, acts of war, floods, tornadoes, hurricanes, fires, power loss, telecommunications failures, computer viruses, computer denial of service attacks or other attempts to harm our systems, and similar events. Some systems are not fully redundant, and disaster recovery planning may not be adequate. The occurrence of a natural disaster or unanticipated problems at any network center could result in lengthy interruptions in service and adversely affect operating results.
23
If our data security measures are breached, our reputation and business may be harmed.
We rely on the security of our networks to deliver our services to customers. Because techniques used to obtain unauthorized access to or to sabotage networks change frequently and may not be recognized until launched against a target, we may be unable to anticipate or implement adequate preventive measures against unauthorized access or sabotage. Consequently, unauthorized parties may overcome these security systems and obtain access to data on the network. We may incur costs associated with the unauthorized use of our networks including administrative and capital costs associated with detecting, monitoring and reducing the incidence of fraud. In addition, because we operate and control the network and the customers' network connectivity, unauthorized access or sabotage of our network could result in damage to our network and to the computers or other devices used by customers or carriers. An actual or perceived breach of network security, regardless of whether the breach is our fault, could harm public perception of the effectiveness of our security measures, adversely affect our ability to attract and retain customers, expose us to significant liability and adversely affect our business prospects.
The industry in which we operate is continually evolving. Our services may become obsolete, and we may not be able to develop competitive products or services on a timely basis or at all.
The mobile wireless services industry is characterized by rapid technological change, competitive pricing, frequent new service introductions and evolving industry standards and regulatory requirements. The backhaul infrastructure that supports this dynamic industry must be similarly flexible and able to adapt to these changes. Our success depends on our ability to anticipate and adapt to these challenges and to offer competitive services on a timely basis. We face a number of difficulties and uncertainties associated with this reliance on technological development, such as:
- •
- competition from service providers using other means to deliver similar or alternative services;
- •
- competition from new service providers using more efficient, less expensive technologies, including products or services
not yet invented or developed;
- •
- customers self-provisioning their own backhaul services;
- •
- gaining and sustaining market acceptance of the technology underlying our services;
- •
- realizing economies of scale;
- •
- responding successfully to advances in competing technologies in a timely and cost-effective manner;
- •
- migration toward standards-based technology, requiring substantial capital expenditures; and
- •
- existing, proposed or undeveloped technologies that may render fixed wireless backhaul and other services less profitable or obsolete.
As the services offered by us and our competitors develop, wireless carriers may not accept our services as a commercially viable alternative to other means of delivering wireless backhaul and other services. Accordingly, our inability to keep pace with technological development could materially and adversely affect our business.
24
We depend on the continued availability of leases or licenses for our communications facilities.
We lease communications facilities from the owners of towers, rooftops, water towers, utility poles and other structures. We typically seek five year initial terms for our leases with three, five year renewal options. The renewal options are generally at our option with a window of 90 to 180 days before the expiration of each term in which to terminate the agreement. If these leases are terminated or if the owners of these structures are unwilling to continue to enter into leases or licenses with us in the future, we would have to seek alternative arrangements with other providers. If we are unable to continue to obtain or renew leases on satisfactory terms, our business would be harmed.
In some cases, some of our communications facilities or some of our equipment may not have been installed with valid lease agreements and/or proper permits in place. There can be no assurance that our efforts will be successful to remediate these lease agreements and/or permits. In such a case, if a facilities owner were to challenge our ability to operate on that site, the resolution of the matter may require the termination of service to the customer, or an increase in operating costs associated with the locations, which could adversely affect operating results.
We do business with an affiliated third party and may not have obtained the same terms as from an unaffiliated provider.
We lease communications facilities from subsidiaries of one of our stockholders, Crown Castle, which owned approximately 6% of our outstanding common stock as of December 31, 2009. Crown Castle owned approximately 17% of our common stock prior to the Exchange Offer and Mandatory Redemption. While we believe our terms are at market rate, we may not have obtained the same lease terms with this stockholder as we might have obtained from unaffiliated providers.
To be successful, we must attract, retain and motivate key employees, and the inability to do so could seriously harm us. The loss of key personnel could adversely affect our business because these individuals are important to our continued growth.
To be successful, we must attract, retain and motivate executives and other key employees and keep them focused on our strategies and goals. Competition for personnel throughout our industry is intense, and we may be unable to retain key employees or attract or retain other highly qualified employees in the future. If we are not successful in attracting new personnel or retaining and motivating our current personnel, our business and prospects could be adversely affected. Our future success depends to a significant extent on the skills, experience, performance and continued services of our senior management and other key personnel. We believe that our future success is highly dependent on our senior management to provide significant continuity in the execution of our growth plans. The loss of any members of our management team could harm our business.
We have little experience with customer renewal rates and it is difficult to predict the extent of customer renewals for our services.
We sell our services pursuant to service agreements that are generally for three or five years. Customers have no obligation to renew after the expiration of their initial subscription period and no assurance can be given that customers will renew at the same or higher levels of service, if at all. Moreover, under some circumstances, some of these customers have the right to cancel their service agreements prior to the expiration of the terms of their agreements. We have limited historical data with respect to rates of customer renewals, and we cannot accurately predict future customer renewal rates. Renewal rates may decline or fluctuate as a result of a number of factors, including our customers' satisfaction or dissatisfaction with the services, the prices of the services, the prices of the services offered by competitors or mergers and acquisitions affecting our customer base. If customers
25
do not renew their subscriptions for our services or if they renew on less favorable terms, revenues may decline and our business will suffer.
We have experienced growth in recent periods. If we fail to manage future growth effectively, we may be unable to execute our business plan, maintain high levels of service or address competitive challenges adequately.
We have substantially expanded our overall business, customer base, headcount and operations in recent periods. We increased our total number of full-time employees from 29 on December 31, 2003 to 144 on December 31, 2009. During the period from December 31, 2003 to December 31, 2009, we made substantial investments in network infrastructure, growing from 121 sites deployed and billing to 3,117 sites deployed and 2,788 deployed and billing sites as of December 31, 2009. We will need to continue to expand our business, including the number of billing sites. We anticipate that this expansion will require substantial management effort and significant additional investment in infrastructure. However, if market conditions warrant, we are able to slow the amount of capital expenditures to a level consistent with the business needs at that time. Our historic expansion has placed, and our expected future growth will continue to place, a significant strain on managerial, administrative, operational, financial and other resources. If we are unable to manage growth successfully, our business will be harmed.
Acquisitions could result in operating difficulties, dilution and distractions from our core business.
We may evaluate potential strategic transactions in the future, including acquisitions. The process of acquiring and integrating a company, business or technology is risky, may require a disproportionate amount of management or financial resources and may create unforeseen operating difficulties or expenditures. Future acquisitions could result in potentially dilutive issuances of our equity securities, the incurrence of debt, contingent liabilities or amortization expenses, or write-offs of goodwill or intangible assets, any of which could harm our financial condition. Future acquisitions may require additional equity or debt financing, which may not be available on favorable terms, or at all.
We are subject to comprehensive and continually evolving regulation that could increase our costs and adversely affect our ability to successfully implement our business plan.
We and some of our communications services and installations are regulated by the FCC, state agencies, local zoning authorities, and other governmental entities. Our failure to comply with these requirements may have an adverse effect on our licenses or operations and could result in sanctions, fines or other penalties. These regulators regularly conduct new rulemaking proceedings and also issue interpretations of existing rules. For example, the FCC has a number of proceedings still pending to interpret or implement the Telecommunications Act of 1996, and these regulatory proceedings could impose additional obligations on us, give rights to competitors, increase our costs, and otherwise adversely affect our ability to implement our business plan. Congress could also enact new legislation that could restrict the manner in which we conduct our business, impose additional obligations on us, assist our competitors in competing against us or otherwise harm our business.
Risks Related to an Investment in FiberTower
We have never paid dividends on our common stock and do not anticipate paying dividends in the foreseeable future.
We have never paid cash dividends on our common stock and do not anticipate that any cash dividends will be declared or paid in the foreseeable future. As a result, holders of our common stock may not receive a return, if any, on their investment unless they sell their shares of our common stock.
26
Our quarterly results of operations have fluctuated in the past and may fluctuate in the future. As a result, we may fail to meet or exceed the expectations of securities analysts or investors, which could cause the trading price of our common stock to decline.
Our quarterly results of operations have fluctuated in the past and may fluctuate in the future as a result of a variety of factors, many of which are outside of our control. If quarterly results of operations fall below the expectations of securities analysts or investors, the trading price of our common stock could decline substantially. Fluctuations in quarterly results of operations may be due to a number of factors, including, but not limited to, those listed below:
- •
- our ability to increase sales to existing customers and attract new customers;
- •
- the addition or loss of significant customers;
- •
- the amount and timing of operating costs and capital expenditures related to the maintenance and expansion of our
business, operations and infrastructure;
- •
- failure of our key suppliers, including equipment and fiber service providers;
- •
- the timing and success of new product and service introductions by us or competitors;
- •
- changes in our pricing policies or those of competitors;
- •
- changes in consumer demand for mobile services;
- •
- service outages or security breaches;
- •
- the extent to which any of our significant customers do not renew their service agreements;
- •
- limitations of the capacity of our network and systems;
- •
- the timing of costs related to the development or acquisition of technologies, services or businesses;
- •
- general economic, industry and market conditions and those conditions specific to the telecommunications industry;
and
- •
- geopolitical events such as war, threat of war or terrorist actions.
We believe that, as a result of the above listed factors, our quarterly revenues and results of operations may vary significantly in the future and that period-to-period comparisons of operating results may not be meaningful. You should not rely on historical results as an indication of future performance.
Failure to maintain effective internal control over financial reporting could have a material adverse effect on our business, operating results and stock price.
Section 404 of the Sarbanes-Oxley Act of 2002 requires us to include in our Annual Reports on Form 10-K, a report by our management on our internal control over financial reporting containing an assessment by management as to the effectiveness of our internal control over financial reporting, as well as an opinion by our Independent Registered Public Accounting Firm on the effectiveness of our internal controls over financial reporting. Our efforts to comply with Section 404 have resulted in, and are likely to continue to result in, significant costs and take up a significant amount of management's time and operational resources. If we are unable to assert in future years that our internal control over financial reporting is effective, that could cause our stock price to decline and could have an adverse effect on our business and operating results.
27
Future sales of our common stock in the public market or the issuance of securities senior to our common stock could adversely affect the trading price of our common stock and our ability to raise funds in the future.
Future sales of substantial amounts of our common stock or equity-related securities in the public market, or the perception that such sales could occur, could adversely affect prevailing trading prices of our common stock and could impair our ability to raise capital through future offerings of equity or equity-related securities. No prediction can be made as to the effect, if any, that future sales of shares of common stock or the availability of shares of common stock for future sale will have on the trading price of our common stock.
Changes in the composition of our stockholders, including those resulting from the issuance of common stock in the Mandatory Redemption, are likely to limit our ability to use our net operating losses.
We have substantial tax loss carryforwards for U.S. federal income tax purposes. As a result of prior changes in the stock ownership of FiberTower, our ability to use a substantial part of such carryforwards to offset future income or tax liability is limited under section 382 of the Internal Revenue Code of 1986, as amended. As a result of the issuance of shares of common stock in the Mandatory Redemption, it is likely that our ability to use these loss carryforwards will be restricted as a result of the ownership change.
Provisions in our charter documents and Delaware law may delay or prevent an acquisition of FiberTower.
Our certificate of incorporation and bylaws contain provisions that could make it harder for a third party to acquire us without the consent of our Board of Directors. For example, our certificate of incorporation provides that the Board of Directors can issue preferred stock at our discretion with respect to voting, conversion, distribution, and other rights given to stockholders, which may be used in a way to significantly dilute the ownership of a hostile acquirer. In addition, if a potential acquirer were to make a hostile bid for us, the acquirer would not be able to cumulate votes at a meeting, which would require the acquirer to hold more shares to gain representation on the Board of Directors than if cumulative voting were permitted. In addition, the members of our Board of Directors are elected on a staggered or classified basis, which could prevent or deter takeovers or changes in control by increasing the time it takes for a hostile acquirer to replace board members.
Section 203 of the Delaware General Corporation Law limits mergers and other business combination transactions involving 15% or greater stockholders of Delaware corporations unless certain board or stockholder approval requirements are satisfied. These provisions and other similar provisions make it more difficult for a third party to acquire us without negotiation. These provisions may apply even if the offer may be considered beneficial by some stockholders.
Our Board of Directors could choose not to negotiate with an acquirer that it did not believe was in our strategic interests. If an acquirer is discouraged from offering to acquire us or prevented from successfully completing a hostile acquisition by these or other measures, stockholders could lose the opportunity to sell their shares at a favorable price.
Additional Risks Related to our FCC licenses
If we do not retain, obtain or maintain rights to use licensed spectrum in one or more markets, we may be unable to operate in these markets, which could harm our business and our ability to execute our business strategy.
Since we plan to provide services using licensed spectrum, we will be dependent on our ability to retain, acquire and maintain sufficient rights to use licensed spectrum by retaining our own licenses and acquiring additional microwave radio spectrum licenses, or long-term spectrum leases, in each of the markets in which we operate. Obtaining additional licensed spectrum can be a long and difficult
28
process that can be costly and require a disproportionate amount of management resources. We may not be able to acquire, lease or maintain the spectrum necessary to execute our business strategy.
The FCC may cancel or revoke our licenses for past or future violations of the FCC's rules, which could limit our operations and growth.
As an FCC licensee, we are subject to extensive regulatory oversight. For example, the FCC imposes requirements on the construction and technical aspects of the operation of our licenses and wireless communication systems and on the nature of the services that we can provide within a particular frequency band. The FCC's regulations also require various regulatory filings and fees. The FCC may find that our filings made and fees paid are insufficient. The FCC also may find that the operation of our licenses or wireless communication systems violates the FCC's rules or policies. Findings of violations by the FCC may result in fines and/or sanctions. Moreover, under some circumstances, our licenses may be canceled or conditioned, and in extreme cases, our licenses may be revoked. In addition, the FCC could change its regulations of our operations and licenses, which could impact our business. The FCC also could change its regulation of our wireless customers that are using our backhaul services, thereby impacting our operations and growth.
The value of our FCC licenses could decline, which could materially affect our ability to raise capital, and could have a material adverse effect on our business and results of operations.
The carrying value of our wide-area fixed wireless FCC spectrum licenses comprises a significant portion of our assets. A decline in the value of our FCC licenses could negatively impact our ability to raise capital both privately and in the public markets and could significantly reduce the value and the attractiveness of our stock to investors. The value of any or all of our FCC licenses could decrease as a result of many factors, including:
- •
- increases in the supply of licensed or leased spectrum that provides similar functionality;
- •
- new radio technology in unlicensed bands that provides the same capability as our network;
- •
- a decrease in the demand for services offered with any of our FCC licenses;
- •
- lower values placed on similar licenses in future FCC auctions;
- •
- regulatory limitations on the use, transfer or assignment of any of our FCC licenses; or
- •
- bankruptcy or liquidation of any comparable companies.
Many of these factors depend on circumstances beyond our control. The occurrence of any of these events could have a material adverse effect on our ability to generate revenues and on our business, prospects, results of operations and financial condition.
Also, if the value declines, impairment charges might be necessary which would negatively impact operating results and might lead to a conclusion that the FCC spectrum assets are no longer indefinite lived intangible assets in which case they would then have to be amortized over their remaining useful lives which would negatively impact results of operations.
As a result of the impairment evaluation in the fourth quarter of 2008 of the carrying value of our FCC licenses, which was conducted in connection with the preparation of our 2008 consolidated financial statements included in this Form 10-K, it was determined that the fair value of our FCC licenses was less than their carrying value. Consequently, the carrying value of our FCC licenses was reduced by $54.5 million to $287.5 million at December 31, 2008. The impairment evaluation in the fourth quarter of 2009 of the carrying value of our FCC licenses resulted in the determination that the fair value of our FCC licenses was greater than their carrying value. Therefore, no additional reduction to their carrying value was required in 2009. Future impairment evaluations of our FCC licenses could
29
lead to additional material impairment charges. Any operating losses resulting from impairment charges to FCC licenses or other long-lived assets would have an adverse effect on our future financial results and could have an adverse effect on our stock price. See Note 6, Impairment of FCC Licenses, in the Notes to Consolidated Financial Statements for additional information.
We may be required to make certain FCC filings in the future and may be subject to fines and or sanctions for failure to file in the past.
Prior to the merger with Old FiberTower, First Avenue had taken the position that it was not obligated to submit certain revenue reporting forms required by the FCC's rules to be filed by certain providers of telecommunications services. These forms are the basis of payments assessed by the FCC in support of universal service, numbering administration, telecommunications relay services for the deaf, and local number portability. The FCC could determine that such revenue reporting filings should have been made and that FiberTower should be assessed a fine and/or be required to make any and all payments such filings might necessitate. While Old FiberTower filed such revenue reporting forms prior to the First Avenue/FiberTower merger, those revenues did not meet the FCC's threshold for Old FiberTower to make payments to the FCC's programs described above. There can be no assurance that the FCC would accept a decision by FiberTower to suspend such filings in the future.
Our FCC licenses may not be renewed upon expiration in the future, which could limit the expansion of our business and our ability to serve our customers and could harm our operating results
Our spectrum licenses in the 24 GHz and 39 GHz bands are granted for ten-year terms with renewal dates ranging from 2010 to 2020. On October 1, 2008, renewal applications for 39 GHz licenses that were scheduled to expire in 2007 received either i) ten-year renewals for licenses deemed constructed or ii) ten year renewals contingent upon meeting construction requirements which the FCC extended until June 1, 2012. Recent applications to renew or extend construction deadlines for 39 GHz licenses expiring in 2009 and 2010 have been granted by the FCC. In order for our 24 GHz and 39 GHz licenses to qualify for renewal in the future, we must file renewal applications for each license prior to expiration and demonstrate that we have provided "substantial service" by the end of the term of each license (which is February 1, 2011 for 102 of the 103 24 GHz licenses) or by an FCC approved substantial service showing date (which is June 1, 2012 for a substantial majority of the 39 GHz licenses). The FCC's substantial service renewal standard for both the 24 GHz and 39 GHz licenses is intended to provide licensees with flexibility in demonstrating usage of their licenses. The FCC's "safe harbor" test provides licensees with a degree of certainty as to how to comply with the substantial service requirement. For example, for 39 GHz licensees offering point-to-point service, the FCC has said that the construction of four links per channel per million persons in the license area will meet the substantial service test. For 24 GHz point-to-point/multipoint licensees, the FCC has said that a showing of four links per million persons within a service area or service to an area that has very limited access to either wireless or wireline telecommunications services will meet the substantial service test. FCC precedent also exists in the millimeter wave bands for meeting buildout requirements by constructing a point-to-multipoint system whose signal reaches 20% or more of the population in the license area. While the safe harbors are intended to provide guidance, they are not the only way for licensees to demonstrate substantial service. Licensees may show that they have met the substantial service test in other ways, such as providing niche services or offering services to underserved consumers, however, there is little precedent in this area at this time. Accordingly, we believe that the level of service that will be considered "substantial" by the FCC at renewal may vary depending upon the type of product offering by the licensee. Further, the FCC may modify its perception of substantial service and, in the future, we may encounter more stringent substantial service requirements. License renewal is not guaranteed and the FCC holds significant discretion in making renewal decisions. The loss of some number of our licenses could limit the expansion of our business, cause us to take impairment charges to our FCC licenses intangible asset and harm our operating results.
30
We are required, or expect to be required, to demonstrate substantial service by June 1, 2012 for the majority of our 39 GHz licenses. We are required to demonstrate substantial service for all of our 24 GHz licenses by February 1, 2011, except for one, which requires such a showing in 2014. We do not currently meet the substantial service safe harbor guidance provided by the FCC for the substantial majority of our 24 GHz and 39 GHz licenses, which require renewal applications or showings mostly in the 2011-2012 time period. We believe that our licenses will be renewed based on our significant network investment, spectrum offerings and expanding geographic coverage. However, since we are required to demonstrate substantial service at the time licenses are renewed, the FCC has little precedent in the 24 GHz and 39 GHz bands, and determination of substantial service is subject to FCC discretion, the FCC could choose to not renew licenses that do not meet the substantial service safe harbor.
Our reliance upon spectrum licensed by the FCC includes additional risks.
Our use of FCC-licensed spectrum imposes additional risks on our business, including:
- •
- increases in spectrum acquisition costs;
- •
- adverse changes to regulations governing spectrum/licensee rights;
- •
- the risk that spectrum will not be commercially usable or free of harmful interference from licensed or unlicensed
operators in our or adjacent bands;
- •
- the risk that the government or other license holders introduce an oversupply of substantially similar spectrum into the
market;
- •
- with respect to spectrum in the U.S., contractual disputes with or the bankruptcy or other reorganization of the license
holders, which could adversely affect control over the spectrum subject to such license;
- •
- the risk that competitors, customers or other users may over utilize point-to-point licensed
spectrum and thus alter the FCC availability or allocation of such microwave radio spectrum in markets or geographic areas where we require it;
- •
- change in the FCC rules regarding the licensing of microwave radio spectrum; and
- •
- invalidation of any authorization to use all or a significant portion of the spectrum, resulting in, among other things, impairment charges related to assets recorded for such spectrum.
The FCC or state regulatory bodies may determine that we are subject to common carrier regulation, which could increase our costs and result in a decline in our operations, revenues and profitability.
We currently offer our services as a private carrier and do not consider our services to be telecommunications services subject to common carrier or telecommunications carrier obligations. The FCC has broad powers to require providers of communications facilities and services to operate as common carriers, and there is significant FCC and Federal court case law in regard to this issue. Should the FCC conclude that we are a common carrier, or should we decide to offer common carrier services, we would become subject to a number of additional regulatory obligations. The precise nature of those obligations will vary depending upon the particular services offered, but we could be required by the FCC to offer services according to published rates, terms and conditions deemed to be just, reasonable, and non-discriminatory. We could also be required to make certain additional reports to the FCC, pay additional regulatory fees, and adhere to other requirements imposed on common carriers. Adherence to these obligations could materially affect our costs of providing services and therefore have an adverse impact on our business operations, revenues, and profitability.
31
In addition, if one or more states determine that we are providing intrastate, common carrier service, we may be required to obtain regulatory authorizations in those states and/or be subject to fines or sanctions for failure to obtain regulatory authorizations in those states. As a result, we may be required to apply for and maintain Certificates of Public Convenience and Necessity in those states. We also may be required to fulfill other state requirements, such as filing tariffs and reports and contributing to state universal service funds, among other things. Such additional regulation would increase our costs.
FCC Regulation of radio frequency emissions and radio frequency environments may increase our costs and/or limit our operations.
The FCC regulates the health and safety effects of radio frequency emissions for us and other wireless communications providers. Any FCC licensee whose emissions in an area exceed five percent (5%) of the total permissible emissions limit is responsible for ensuring that the site meets applicable health and safety requirements. The fixed wireless equipment we use is designed to operate at RF emission levels well below the FCC's standard. However, if we operate in an area where other higher RF emitters are operating, we could nonetheless be required to cooperate with, and contribute financially to, efforts intended to bring the site within applicable health and safety limits.
FCC, Congressional or State action that requires Incumbent Local Exchange Carriers (ILECs) to artificially lower and cap their special access transport pricing could result in pricing pressure on FiberTower.
The FCC, Congress and the States possess the ability to require ILECs to artificially lower and cap their special access transport pricing. If the ILECs were required to significantly drop their backhaul pricing in our markets, our customers might then find our pricing unattractive.
Additional Risks Related to our Indebtedness
To service our indebtedness, we will require a significant amount of cash. Our ability to generate cash depends on many factors beyond our control.
Our business does not currently generate sufficient cash flow from operations to service the interest on the Notes due 2012 and Notes due 2016. Following the Mandatory Redemption, our annual cash interest payments (including cash interest on untendered Notes due 2012) are approximately $6.0 million. In connection with the Mandatory Redemption, we deposited into an escrow account approximately $11.0 million, which will be sufficient, along with earnings thereon, to pay the cash portion of the first six semi-annual interest payments on the Notes due 2016. Two-thirds of the interest payable on the Notes due 2016 will be paid by issuing new Notes due 2016.
If no default has occurred and is continuing, then on either or both of May 15, 2010 and November 15, 2010, we may elect to make payments of interest on any Notes due 2012 in additional Notes due 2012 in a principal amount equal to such interest amount, provided that the interest rate applicable to such notes for the period to which such interest payment relates will be 2.0% higher than the interest rate otherwise applicable to such notes. Thereafter, interest on any Notes due 2012 will only be payable in cash. We currently expect the payment of the May 2010 interest payment to be made in additional Notes due 2012.
Our ability to pay our expenses and make payments due on the Notes due 2016 and the Notes due 2012 depends on our future performance, which will be affected by financial, business, economic, legislative and other factors, many of which are beyond our control. Our business may not generate sufficient cash flow from operations in the future, which could result in our being unable to pay interest or repay indebtedness, including the Notes due 2012 or the Notes due 2016, or to fund other liquidity needs. If we do not have sufficient funds, we may be required to sell assets or incur additional debt, or we may need to refinance all or a portion of our indebtedness at or before maturity. We
32
cannot assure you that we will be able to accomplish any of these alternatives on terms acceptable to us, or at all. In addition, the terms of existing or future debt agreements may restrict us from adopting any of these alternatives. The failure to generate sufficient cash flow or to achieve any of these alternatives could materially adversely affect our ability to meet our obligations.
Our substantial level of indebtedness could materially adversely affect our financial condition and prevent us from fulfilling our obligations under the Notes due 2016 and the Notes due 2012 and any other indebtedness.
As of December 31, 2009, we had $154.5 million of total indebtedness. The indentures governing the Notes due 2016 and Notes due 2012 allow us to enter into a senior secured credit facility and incur certain other additional indebtedness, including pari passu senior secured indebtedness in certain circumstances. Our substantial indebtedness could have significant effects on our business, including the following:
- •
- it may make it difficult for us to satisfy our obligations under the Notes due 2016 and the Notes due 2012, and our other
indebtedness and contractual and commercial commitments and, if we fail to comply with these requirements, an event of default could result;
- •
- we will be required to use a substantial portion of our cash flow from operations to pay interest on the Notes due 2016
and the Notes due 2012, and any other indebtedness, which will reduce the funds available to us for other purposes;
- •
- our ability to obtain additional debt financing in the future for working capital, capital expenditures, acquisitions or
general corporate purposes may be limited;
- •
- our flexibility in reacting to changes in our industry may be limited and we could be more vulnerable to adverse changes
in our business or economic conditions in general; and
- •
- we may be at a competitive disadvantage compared to our competitors that are not as highly leveraged.
The occurrence of any one of these events could have a material adverse effect on our business, financial condition, results of operations, prospects and ability to satisfy our obligations under our indebtedness.
We are a holding company, and therefore our ability to make any required payments on our indebtedness depends upon the ability of our subsidiaries to pay dividends or to advance funds.
We have no direct operations and no significant assets other than the stock of our subsidiaries. Because we conduct our operations through our operating subsidiaries, we depend on those entities for dividends and other payments to generate the funds necessary to meet our financial obligations, including our required obligations under the Notes due 2016 and the Notes due 2012. However, each of our subsidiaries is a legally distinct entity, and the ability of our subsidiaries to pay dividends and make distributions to us will be subject to, among other things, the terms of any debt instruments of our subsidiaries then in effect and applicable law. If distributions from our subsidiaries to us were eliminated, delayed, reduced or otherwise impaired, our ability to make payments on our indebtedness would be substantially impaired and an event of default could result.
33
Despite our substantial level of indebtedness, we may still incur significantly more debt, which could exacerbate any or all of the risks described above.
We may be able to incur substantial additional indebtedness in the future. Although the indentures governing the Notes due 2016 and the Notes due 2012 limit our ability and the ability of our subsidiaries to incur additional indebtedness, these restrictions are subject to a number of qualifications and exceptions and, under certain circumstances, debt incurred in compliance with these restrictions could be substantial. In addition, the indentures governing the Notes due 2016 and the Notes due 2012 do not prevent us from incurring obligations that do not constitute indebtedness. To the extent that we incur additional indebtedness or such other obligations, the risks associated with our substantial leverage described above, including our possible inability to service our debt, would increase.
The Notes due 2016 contain restrictive covenants that limit our operational flexibility.
The Notes due 2016 contain covenants that, among other things, restrict our ability to take specific actions, even if we believe them to be in our best interest. These covenants include restrictions on our ability to:
- •
- incur or guarantee additional indebtedness or issue certain preferred stock;
- •
- pay dividends or make other distributions;
- •
- issue capital stock of our restricted subsidiaries;
- •
- transfer or sell assets, including the capital stock of our restricted subsidiaries;
- •
- make certain investments or acquisitions;
- •
- grant liens on our assets;
- •
- incur dividend or other payment restrictions affecting our restricted subsidiaries;
- •
- enter into certain transactions with affiliates; and
- •
- merge, consolidate or transfer all or substantially all of our assets.
Our failure to comply with these restrictions could lead to a default under the Notes due 2016.
The repurchase rights in the Notes due 2016 triggered by a fundamental change could discourage a transaction that could be beneficial to the holders of our common stock.
The repurchase rights in the Notes due 2016 triggered by a "fundamental change" (as defined in the indenture governing the Notes due 2016) could discourage a potential acquiror from engaging in a transaction that may be beneficial to the holders of our common stock.
ITEM 1B. UNRESOLVED STAFF COMMENTS
There were no unresolved written comments received from the staff of the Securities and Exchange Commission relating to our periodic reports filed under the Securities Exchange Act of 1934, as amended.
Our executive offices are located in San Francisco, California, where we lease approximately 15,600 square feet of space. The lease continues through November 2014 and does not include a renewal option. We do not own any real property.
34
The following table shows significant leased properties and their approximate square footage:
City/State
|
Approximate Square Footage |
|||
|---|---|---|---|---|
San Francisco, California (Headquarters and Administrative) |
15,600 | |||
Iselin, New Jersey (Office Space)(1) |
8,400 | |||
Plano, Texas (South Regional Field Office) |
5,400 | |||
Sterling, Virginia (North Regional Field Office) |
4,600 | |||
- (1)
- Former sales and administrative office of First Avenue Networks, Inc., a company which merged with FiberTower, which has been subleased to a third party.
We lease additional field operations office and warehouse space in Alpharetta, GA; Broadview Heights, OH; Centennial, CO; Plymouth, MI; Fort Worth, TX; Billerica, MA; Houston, TX; Secaucus, NJ; Tampa, FL; San Antonio, TX; Washington, D.C.; Charlotte, NC; Freedom, PA; and Woodbridge, IL.
Our facilities are considered adequate for our current level of operations but may need to be expanded as FiberTower expands.
As of December 31, 2009, we also lease nominal space at over 3,300 buildings, towers or other structures for network equipment installations.
We are not currently a party to any material legal proceedings. From time to time, we could become involved in various legal proceedings arising from the normal course of business activities. Depending on the amount and timing, an unfavorable resolution of a matter could materially affect our future results of operations, cash flows or financial position in a particular period.
35
ITEM 5. MARKET FOR REGISTRANT'S COMMON EQUITY, RELATED STOCKHOLDER MATTERS AND ISSUER PURCHASES OF EQUITY SECURITIES
Our common stock is traded on the Nasdaq Global Market under the symbol FTWR. For a period of 20 trading days following the December 18, 2009 1-for-10 reverse stock split, our common stock traded on Nasdaq under the symbol FTWR with the letter "D" added to the end of the trading symbol to indicate that the reverse stock split occurred. The market price range for the common stock for the last two fiscal years, adjusted to give effect to the reverse stock split, was as follows:
| |
PRICE RANGE | |||||||
|---|---|---|---|---|---|---|---|---|
| |
High | Low | ||||||
Fiscal year ended December 31, 2009 |
||||||||
First Quarter |
$ | 2.70 | $ | 0.70 | ||||
Second Quarter |
$ | 8.80 | $ | 1.90 | ||||
Third Quarter |
$ | 13.50 | $ | 3.20 | ||||
Fourth Quarter |
$ | 18.20 | $ | 3.97 | ||||
Fiscal year ended December 31, 2008 |
||||||||
First Quarter |
$ | 24.50 | $ | 13.50 | ||||
Second Quarter |
$ | 21.00 | $ | 12.70 | ||||
Third Quarter |
$ | 16.50 | $ | 9.90 | ||||
Fourth Quarter |
$ | 13.90 | $ | 1.40 | ||||
On February 26, 2010, the closing price of our common stock as reported by the Nasdaq Global Market was $4.12 per share. There were 897 holders of record of our common stock on February 26, 2010.
On December 7, 2009, we issued an aggregate of $266.8 million in principal amount of the Interim Notes in exchange for $266.8 million in principal amount of the Notes due 2012. The issuance of the Interim Notes was exempt from registration pursuant to Section 3(a)(9) of the Securities Act of 1933. The Interim Notes were convertible into shares of our common stock at an initial conversion rate equal to 16.0772 shares of common stock per $1,000 principal amount of Interim Notes (representing an initial conversion price of approximately $62.20 per share), in each case subject to adjustment, at any time until the close of business on the business day immediately preceding the final maturity date. Holders of Interim Notes who converted prior to November 15, 2010 in connection with certain designated events were entitled to a make-whole premium.
On December 22, 2009, we issued an aggregate of 30,578,567 shares of our common stock (on a post 1-for-10 reverse stock split basis), with a fair value upon issuance of $156.6 million as partial consideration for the redemption of the Interim Notes. The issuance of the common stock was exempt from registration pursuant to Section 3(a)(9) of the Securities Act of 1933. See Note 1, Organization and Business and Note 8, Long-term Debt, in the Notes to Consolidated Financial Statements for additional information.
We have not paid any cash dividends in the past and do not anticipate paying any cash dividends in the foreseeable future. We intend to retain earnings, if any, to finance the expansion of our business and fund ongoing operations for the foreseeable future. Our Notes due 2016 restrict the payment of any dividends.
36
The following table provides information about the repurchase of our common stock during the three months ended December 31, 2009:
Period
|
Total number of shares purchased(1) | Average price paid per share | Total number of shares purchased as part of publicly announced program(2) |
Maximum value of shares that may yet be purchased under the program(2) |
|||||||||
|---|---|---|---|---|---|---|---|---|---|---|---|---|---|
October 1 to October 31, 2009 |
— | — | — | — | |||||||||
November 1 to November 30, 2009 |
— | — | — | — | |||||||||
December 1 to December 31, 2009 |
1,550 | $ | 4.80 | — | — | ||||||||
Total |
1,550 | $ | 4.80 | — | — | ||||||||
- (1)
- Shares
shown in this column were withheld by us to satisfy tax obligations arising upon the vesting of restricted stock. In April 2007, our Board of
Directors authorized the repurchase of shares of common stock at current market prices, limited to amounts necessary to fund the minimum income tax withholding obligations of employees with respect to
such vesting.
- (2)
- We do not have a securities repurchase program.
Stock Performance Graph
The following graph compares total stockholder return on our common stock since August 29, 2006 (date of the First Avenue/FiberTower merger), with the Nasdaq Composite Index and the Nasdaq Telecommunications Index. The graph assumes that $100 was invested in our stock at the closing price of $77.40, on a post 1-for-10 reverse stock split basis, on August 29, 2006, and that the same amount was invested in the Nasdaq Composite Index and the Nasdaq Telecommunications Index. Our closing price on December 31, 2009, the last trading day of our 2009 fiscal year, was $4.18. The following graph is not deemed to be "filed" with the SEC or deemed to be incorporated by reference into any of our filings under the Securities Act of 1933 or the Securities Exchange Act of 1934, except to the extent that we specifically incorporate it by reference into such a filing.
37
Comparison of Cumulative Total Return on Investment
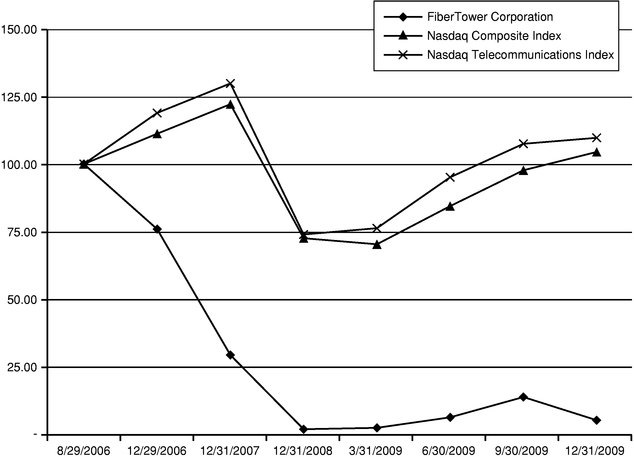
| |
Period Ended | ||||||||||||||||||||||||
|---|---|---|---|---|---|---|---|---|---|---|---|---|---|---|---|---|---|---|---|---|---|---|---|---|---|
| |
8/29/2006 | 12/29/2006 | 12/31/2007 | 12/31/2008 | 3/31/2009 | 6/30/2009 | 9/30/2009 | 12/31/2009 | |||||||||||||||||
FiberTower Corporation |
100.00 | 75.97 | 29.46 | 2.07 | 2.58 | 6.46 | 13.95 | 5.40 | |||||||||||||||||
Nasdaq Composite Index |
100.00 | 111.19 | 122.10 | 72.60 | 70.37 | 84.47 | 97.70 | 104.46 | |||||||||||||||||
Nasdaq Telecommunications Index |
100.00 | 118.87 | 129.77 | 73.99 | 76.31 | 95.12 | 107.47 | 109.68 | |||||||||||||||||
ITEM 6. SELECTED FINANCIAL DATA
The following selected historical consolidated statements of operations data for the years ended December 31, 2009, 2008 and 2007 and the consolidated balance sheet data at December 31, 2009 and 2008 are derived from FiberTower's audited consolidated financial statements included elsewhere in this Annual Report on Form 10-K. The selected historical consolidated statement of operations data for the year ended December 31, 2006 and the consolidated balance sheet data at December 31, 2007 and 2006 are derived from FiberTower's audited consolidated financial statements not included in this Annual Report on Form 10-K. The selected historical financial data for Old FiberTower for the year ended December 31, 2005 is derived from Old FiberTower's audited financial statements not included in this Annual Report on Form 10-K.
38
As described in Note 1, Organization and Business, in the Notes to Consolidated Financial Statements, on December 18, 2009, we effected a 1-for-10 reverse stock split of our common stock. Accordingly, the following selected financial data has been retroactively restated to reflect the effect of the reverse stock split.
On August 29, 2006, First Avenue completed the First Avenue/FiberTower merger with Old FiberTower. The First Avenue/FiberTower merger was accounted for as a reverse acquisition under the purchase method of accounting. Under this accounting treatment, Old FiberTower was considered the acquiring entity and First Avenue was considered the acquired entity. First Avenue, as the surviving entity of the First Avenue/FiberTower merger, changed its name to FiberTower Corporation. The selected financial data before the First Avenue/FiberTower merger reflects the financial results of Old FiberTower on a historical basis after applying the exchange ratio to historical share-related data, and includes the results of operations of First Avenue from the effective date of the First Avenue/FiberTower merger. Accordingly, First Avenue's financial statements included in our reports filed with the SEC prior to the First Avenue/FiberTower merger are not comparable to the historical financial statements included in the following selected financial data.
| |
Year Ended December 31, | ||||||||||||||||
|---|---|---|---|---|---|---|---|---|---|---|---|---|---|---|---|---|---|
| |
2009 | 2008 | 2007 | 2006 | 2005 | ||||||||||||
| |
(in thousands, except per share data) |
||||||||||||||||
Consolidated Statement of Operations Data: |
|||||||||||||||||
Service revenues |
$ | 63,244 | $ | 49,227 | $ | 27,144 | $ | 13,763 | $ | 6,224 | |||||||
Operating expenses: |
|||||||||||||||||
Cost of service revenues (excluding depreciation and amortization) |
58,220 | 79,808 | 72,075 | 36,746 | 19,289 | ||||||||||||
Sales and marketing |
3,262 | 5,456 | 7,906 | 6,479 | 3,822 | ||||||||||||
General and administrative |
27,834 | 20,237 | 27,026 | 18,038 | 4,444 | ||||||||||||
Depreciation and amortization |
27,840 | 24,897 | 18,459 | 9,077 | 3,096 | ||||||||||||
Restructuring charges |
372 | 6,087 | — | — | — | ||||||||||||
Impairment of FCC licenses |
— | 54,505 | — | — | — | ||||||||||||
Impairment of goodwill |
— | 86,093 | 147,893 | — | — | ||||||||||||
Total operating expenses |
117,528 | 277,083 | 273,359 | 70,340 | 30,651 | ||||||||||||
Loss from operations |
(54,284 | ) | (227,856 | ) | (246,215 | ) | (56,577 | ) | (24,427 | ) | |||||||
Other income (expense): |
|||||||||||||||||
Interest income |
295 | 5,316 | 18,159 | 6,326 | 2,683 | ||||||||||||
Interest expense |
(47,605 | ) | (47,742 | ) | (44,560 | ) | (7,475 | ) | (158 | ) | |||||||
Gain on early extinguishment of debt, net |
98,248 | — | — | — | — | ||||||||||||
Miscellaneous income (expense), net |
(39 | ) | 264 | 469 | 448 | (7 | ) | ||||||||||
Other income (expense), net |
50,899 | (42,162 | ) | (25,932 | ) | (701 | ) | 2,518 | |||||||||
Loss before income taxes |
(3,385 | ) | (270,018 | ) | (272,147 | ) | (57,278 | ) | (21,909 | ) | |||||||
Income tax benefit |
1,247 | 20,189 | — | — | — | ||||||||||||
Net loss |
$ | (2,138 | ) | $ | (249,829 | ) | $ | (272,147 | ) | $ | (57,278 | ) | $ | (21,909 | ) | ||
Basic and diluted net loss per share attributable to common stockholders |
$ | (0.13 | ) | $ | (16.65 | ) | $ | (18.66 | ) | $ | (10.85 | ) | $ | (49.15 | ) | ||
Shares used in computing net loss per share |
15,481 | 14,462 | 14,305 | 5,154 | 446 | ||||||||||||
39
| |
As of December 31, | |||||||||||||||
|---|---|---|---|---|---|---|---|---|---|---|---|---|---|---|---|---|
| |
2009 | 2008 | 2007 | 2006 | 2005 | |||||||||||
| |
(In thousands, except other operating data) |
|||||||||||||||
Balance Sheet Data: |
||||||||||||||||
Cash and cash equivalents |
$ | 50,669 | $ | 154,357 | $ | 228,030 | $ | 350,174 | $ | 112,936 | ||||||
Short-term investments |
— | — | — | 15,253 | — | |||||||||||
Restricted cash and investments |
11,600 | 477 | 36,979 | 70,522 | 3,480 | |||||||||||
Working capital |
55,461 | 150,022 | 244,386 | 375,425 | 94,522 | |||||||||||
Property and equipment, net |
221,417 | 236,585 | 240,799 | 171,612 | 77,199 | |||||||||||
FCC licenses |
287,495 | 287,495 | 342,000 | 342,000 | — | |||||||||||
Goodwill |
— | — | 86,093 | 243,388 | — | |||||||||||
Total assets |
584,426 | 701,469 | 955,555 | 1,216,478 | 195,849 | |||||||||||
Long-term debt |
154,528 | 430,317 | 415,778 | 403,759 | — | |||||||||||
Other long term obligations |
17,596 | 14,078 | 8,021 | 4,787 | 1,520 | |||||||||||
Convertible preferred stock |
— | — | — | — | 220,675 | |||||||||||
Stockholders' equity (deficit) |
332,349 | 169,870 | 412,970 | 673,822 | (48,539 | ) | ||||||||||
Other Operating and Non-GAAP Financial Data: |
||||||||||||||||
Number of sites deployed(1) |
3,117 | 3,120 | 2,813 | 1,996 | 743 | |||||||||||
Number of billing customer locations(1) |
6,317 | 6,096 | 3,851 | 1,804 | 699 | |||||||||||
Number of billing sites(1) |
2,788 | 2,763 | 2,148 | 1,329 | 529 | |||||||||||
Adjusted EBITDA(2) |
$ | (13,310 | ) | $ | (33,561 | ) | $ | (53,152 | ) | $ | (40,509 | ) | $ | (20,991 | ) | |
- (1)
- As
a result of the First Avenue/FiberTower merger, First Avenue's network of 79 deployed sites (all sold and billing) and 497 billing T-1s were
added during 2006.
- (2)
- Adjusted EBITDA is not a substitute for operating income, net income (loss), or cash flow used in operating activities as determined in accordance with Generally Accepted Accounting Principles, or GAAP, as a measure of performance or liquidity. See "Non-GAAP Financial Measures" in this Form 10-K for our reasons for including Adjusted EBITDA, for material limitations with respect to the usefulness of this measurement and for a reconciliation of total Adjusted EBITDA to net income (loss).
40
ITEM 7. MANAGEMENT'S DISCUSSION AND ANALYSIS OF FINANCIAL CONDITION AND RESULT OF OPERATIONS ("MD&A")
Our MD&A is provided in addition to the accompanying consolidated financial statements and notes to assist readers in understanding our results of operations, financial condition, and cash flows. Some of the statements in this MD&A are forward-looking statements. Forward looking statements relate to expectations, beliefs, projections, future plans and strategies, anticipated events or trends and similar expressions concerning matters that are not historical facts. Such statements are based on our current estimates and projections about our business and operations and could be affected by the uncertainties and risk factors described throughout this Form 10-K, including those described in the section titled "Risk Factors" in Item 1A of this Form 10-K. Our actual results may differ materially from these estimates and projections.
References in the MD&A to note numbers and note titles refer to those Notes to Consolidated Financial Statements included in Item 8, Financial Statements and Supplementary Data of this Form 10-K.
Overview
We are a leading alternative provider of facilities-based backhaul services to wireless carriers. Facilities-based providers own or lease a substantial portion of the property and equipment necessary to provide backhaul services. Backhaul is the transport of voice, video and data traffic from a wireless carrier's mobile base station, or cell site, to its mobile switching center or other exchange point where the traffic is then switched onto a wireline telecommunications network. We provide backhaul services nationally by utilizing our wireless spectrum assets and fiber relationships to construct and operate high-coverage, high-capacity hybrid microwave and fiber networks. Our services provide wireless carriers a long-term solution for their increasing demand for backhaul capacity while giving them increased availability and reliability.
We compete with a range of diversified telecommunications services providers. Our competitors include i) Incumbent and Competitive Local Exchange Carriers, or ILECs, including AT&T, Verizon, Embarq and Qwest; ii) Cable Multiple Systems Operators, including Cox, Time Warner Cable, Bright House and Comcast; iii) wireless carriers; iv) Fiber Service Providers, including Level 3 Communications, Time Warner Telecom, Zayo Broadband, DukeNet and FPL FiberNet; and v) other fixed wireless backhaul providers, including Tower Cloud and Telecom Transport Management Inc.
As of December 31, 2009, we had 144 employees, of whom 98 were in Engineering, Market/Field Operations, and Network Operations, the payroll-related costs of which are classified as Cost of Service Revenues; 12 were in Sales and Marketing; and 34 were in General and Administrative. In May 2008, management announced staffing reductions throughout FiberTower as part of its cost reduction efforts. See Note 4, Restructuring Charges for further information.
As of December 31, 2009:
- •
- We provide services to 6,317 billing customer locations at 2,788 billing sites in 13 markets throughout the U.S;
- •
- We have master service agreements with nine U.S. wireless carriers;
- •
- We have extensive relationships with fiber service providers giving us access to over 1,000 MSCs and 125,000 fiber-based
aggregation points;
- •
- We own a national spectrum portfolio of 24 GHz and 39 GHz wide-area spectrum licenses, including over 740 MHz in the top 20 U.S. metropolitan areas and, in the aggregate, approximately 1.55 billion channel pops calculated as the number of channels in a given area multiplied by the population, as measured in the 2000 census, covered by these channels. We
41
- •
- We hold separate service agreements with Verizon Business and Qwest Communications, as their fixed wireless partner on the General Services Administration Networx contract to provide fixed wireless government-grade primary transport and physically diverse network transport services. The service agreement with Verizon Business also allows us to provide government-grade services for other Verizon Business-managed contracts.
believe our spectrum portfolio represents one of the largest and most comprehensive collections of millimeter wave spectrum in the U.S. Our licenses extend over substantially all of the continental U.S., covering areas with a total population of approximately 300 million; and
As an important part of our business strategy, we seek to:
- •
- expand within existing markets or add new markets based on identified demand;
- •
- leverage our existing network and customer relationships by increasing utilization of existing assets;
- •
- continue to develop additional revenue sources through new solutions that meet the needs of our customers;
and
- •
- allocate capital efficiently by balancing new site and market growth.
The growth of our business depends substantially on the condition of the wireless communications industry. The willingness of customers to purchase our services is affected by numerous factors, including:
- •
- market demand for wireless services;
- •
- availability of alternative services at better prices;
- •
- predictability of our deployment schedules; and
- •
- quality of our services.
In order to provide backhaul services to our customers, we have constructed networks in 13 markets throughout the U.S. As we continue to expand our markets, we incur significant upfront costs for pre-development site evaluation, site leases, cost of new capital equipment and construction costs. These expenses are incurred well in advance of receiving revenues from customers.
During 2009, we achieved the following significant financial and operational milestones:
- •
- Service revenues grew 28% to $63.2 million in 2009 from $49.2 million in 2008;
- •
- Average monthly revenue per billing site grew 17% to $1,888 in 2009 from $1,614 in 2008;
- •
- Adjusted EBITDA improved to a loss of $13.3 million in 2009 from $33.6 million in 2008. See Results of
Operations—Non-GAAP Financial Measures below for a reconciliation of Adjusted EBITDA to net loss;
- •
- On December 22, 2009, we redeemed $266.8 million of Mandatorily Redeemable Convertible Senior Secured Notes due 2012 ("Interim Notes") for 30,578,567 shares of our common stock (on a post-1-for-10 reverse stock split basis) with a fair value upon issuance of $156.6 million, approximately $12.7 million in cash and approximately $113.5 million in principal amount of Senior Secured Notes due 2016 ("Notes due 2016"). As a result, the total carrying value of our outstanding debt was reduced by $171.7 million, the maturity of a substantial portion of our debt was extended from 2012 to 2016 and our annual cash interest payments were reduced by more
42
- •
- During the first and second quarters of 2009, we repurchased a total of $142.2 million par value of our Convertible Senior Secured Notes due 2012 ("Notes due 2012") in the open market. These repurchases, at a weighted average price of approximately $37 per $100 of par value, were for $52.2 million in cash plus accrued but unpaid interest. See Liquidity and Capital Resources below and Note 8, Long-term Debt for additional information.
than $20.0 million to approximately $6.0 million. See Liquidity and Capital Resources below and Note 1, Organization and Business and Note 8, Long-term Debt for additional information; and
As of December 31, 2009, we had deployed 3,117 sites, of which 2,788 had billing customers. A deployed site may not yet be billing for reasons including that we have not yet sold any service at that site, but the site is located in a market in which wireless carriers who are our customers operate, but with whom we may not have yet secured a commitment for this specific market.
Our business plan depends on our expectation that most, if not all, sites will generate revenue within the useful life of the site sufficient to fully recover our investment in property and equipment. If we are unable to generate sufficient revenues from these sites in the future, our business, financial condition and results of operations would be adversely affected. Since our inception, our operating expenses have exceeded our revenues. We have incurred net losses and negative cash flows from operating and investing activities since our inception and we expect that we will continue to incur operating and net losses and negative cash flows for the next few years. See Liquidity and Capital Resources below for additional information.
Service Revenues
We generate revenue by charging a monthly recurring charge based on the amount of bandwidth traffic carried across our network. Increasing revenues on a per-billing site basis is one of our most important objectives. Revenue per billing site, shown later in the Performance Measures section of the MD&A, is a key operating metric reflecting our ability to scale and leverage our existing network. The duration of our customer contracts are generally for three or five years.
Traffic grows as we construct new sites for customers, sell to new customers at existing sites, or sell incremental bandwidth to existing customers. The average monthly revenue generated per billing site increased from to $1,888 in 2009 from $1,614 in 2008. We intend to continue our focus on site-level margins, project return on investment, and cost reductions.
For the years ended December 31, 2009, 2008 and 2007, the following customers accounted for a significant portion of our revenues:
| |
Year Ended December 31, | |||||||||
|---|---|---|---|---|---|---|---|---|---|---|
| |
2009 | 2008 | 2007 | |||||||
AT&T Mobility |
39 | % | 40% | 57 | % | |||||
Sprint Nextel |
20 | % | 33% | (1) | 19 | % | ||||
Clearwire |
15 | % | — | (1) | — | |||||
T-Mobile |
15 | % | 15% | 13 | % | |||||
- (1)
- In December 2008, Clearwire Corporation completed a transaction with Sprint Nextel and an investor group to launch a new WiMAX-based wireless services provider. As a result of this transaction, a portion of the circuits previously billed to Sprint Nextel have been transferred to Clearwire. If this transaction had occurred on January 1, 2008, approximately 14% of our 2008 revenues would have been attributed to Clearwire and approximately 19% would have been attributed to Sprint Nextel.
43
Accounts receivable from these customers comprised the following percentages of our total accounts receivable balances at December 31, 2009 and 2008:
| |
December 31, | ||||||
|---|---|---|---|---|---|---|---|
| |
2009 | 2008 | |||||
AT&T Mobility |
37 | % | 27 | % | |||
Sprint Nextel |
17 | % | 52 | % | |||
Clearwire |
17 | % | — | ||||
T-Mobile |
16 | % | 12 | % | |||
Costs and Expenses
The major components of our cost of service revenues are:
- •
- Leasing. We incur charges for site lease expense for space
leased at our sites. When lease arrangements have uneven payment schedules, we account for lease expense on a straight-line basis over the lease term.
- •
- Fiber Service Providers. We pay charges to our fiber
service providers for the purchase and lease of fiber.
- •
- Field Technicians. We incur costs for engineering and
maintenance personnel expenses including stock-based compensation.
- •
- Other. We incur costs for site evaluation and design, site maintenance, power, program and project management, costs related to unsuccessful site acquisitions that are incurred during deployment and personnel costs to monitor the network.
We expect cost of service revenues to increase in future periods as we execute our business plan to grow our network operations.
Construction of our network is a complex process involving the interaction and assembly of multiple components that result in internal labor, third party and equipment costs. We regularly assess the recoverability of costs accumulated in construction-in-progress as we execute our network build-out plans. We recorded impairment charges of $0.3 million in 2009, $16.4 million in 2008 and $13.0 million in 2007 related to this process which is included in cost of service revenues. See Note 5, Impairment of Long-Lived Assets and Other Charges for additional information on impairment charges included in cost of service revenues.
Sales and marketing expenses are comprised primarily of compensation and related benefits, including stock-based compensation and travel expenses.
General and administrative expenses primarily consist of compensation and related benefits including stock-based compensation, recruiting fees, travel expenses, professional fees and insurance. The increased general and administrative expense in 2009 compared to 2008 was primarily the result of i) additional consulting fees, including approximately $4.5 million related to the Exchange Offer and redemption of debt described at Note 1, Organization and Business, ii) approximately $2.0 million of additional stock-based compensation expense from the acceleration of restricted stock and stock option vesting resulting from the change in control of FiberTower as a result of the Exchange Offer and redemption of debt and iii) the reclassification of seven employees from sales and marketing and cost of service revenues to general and administrative at the end of the fourth quarter of 2008 as their responsibilities changed.
Depreciation and amortization expenses primarily consist of depreciation related to deployed network sites and the amortization of certain intangible assets. We expect depreciation expense to increase in future periods as a result of deploying and commencing depreciation on additional sites.
44
During 2008, we recorded restructuring charges of $6.1 million as a result of management's decision to restructure our operations to reflect changes in our strategic plan designed to reduce costs. The resultant restructuring charges reflected i) management's decision to cease market development activities in the Carolinas market resulting in an exit plan for our site operating leases, ii) termination benefits under a workforce reduction of 59 employees consistent with revisions to our network deployment plan and iii) the consequent termination or renegotiation of excess office space including the former headquarters in New Jersey. See Note 4, Restructuring Charges for additional information.
As a result of the impairment evaluation in the fourth quarter of 2008 of the carrying value of our FCC licenses, it was determined that the fair value of our FCC licenses was less than their carrying value. Consequently, the carrying value of our FCC licenses was reduced by $54.5 million in the fourth quarter of 2008 to $287.5 million at December 31, 2008. Based on the results of the impairment evaluation of our FCC licenses in the fourth quarter of 2009, it was determined that the fair value of our FCC licenses was greater than their carrying value. Therefore, no additional reduction to their carrying value was required in 2009. Future impairment evaluations of our FCC licenses could lead to additional material impairment charges. See Note 6, Impairment of FCC Licenses and Note 12, Income Taxes for additional information.
As a result of a decline in our market capitalization below the carrying value of our equity during the quarter ended March 31, 2008, we believed an indicator of impairment of goodwill existed and, accordingly, performed an interim review of the value of our goodwill. In the quarter ended March 31, 2008, we concluded that the carrying value of goodwill was fully impaired and recorded an impairment charge of $86.1 million, reducing the carrying value of goodwill to its fair value of zero at March 31, 2008. The carrying value of goodwill was reduced by impairment charges of $147.9 million in 2007. See Note 7, Impairment of Goodwill for additional information.
Interest income and interest expense are primarily the result of interest earned on investment of cash proceeds and interest cost incurred on the outstanding balance of our indebtedness. See Note 8, Long-term Debt for additional information.
As a result of the gain on early extinguishment of debt realized on our repurchases of Notes due 2012 during the first six months of 2009 as described in Note 8, Long-term Debt, we recorded a state income tax provision of $0.2 million during the second quarter of 2009. Also in 2009, we recorded a $1.5 million income tax benefit and a corresponding decrease to the deferred tax liability. See Note 12, Income Taxes for additional information.
Challenges Facing Our Business
In addition to the Risk Factors, there are various challenges facing our business. These include acquiring new customers on new and existing sites, deploying new sites in a predictable manner, scaling our business and managing growth, the concentrated nature of our customers, the emerging nature of our market, the weakened state of the U.S. economy and variability in our stock price.
Acquiring customers on new and existing sites in a timely fashion is critical to our ability to grow revenue and generate an appropriate return on the capital that we invest. Our business, financial condition and results of operations will be negatively affected if we do not obtain sufficient revenues by selling incremental bandwidth to existing customers, selling new customers at existing sites and constructing new sites for customers.
Deploying new sites in a predictable manner can be challenging given the difficulties in dealing with numerous landlords in order to lease space on sites, complying with the various zoning and permitting laws of different cities or districts, and managing the contractors involved with construction, program and project management. We have taken steps to reduce deployment unpredictability by engaging with large, well-established, turnkey vendors that are experienced in these activities.
45
Additionally, we concentrate on selecting sites owned by major tower operators with whom we already have agreements, which we believe will help minimize the risk of failing to negotiate a definitive lease for a site.
We are a growing company, and hiring qualified personnel and developing processes and systems rapidly are necessary in order to grow successfully. If we cannot hire qualified employees, manage our growth and develop these systems and processes successfully, our business could be adversely affected.
We are a relatively new entrant into a highly concentrated market with a limited number of potential customers in any particular market. Maintaining and growing our existing relationships with the leading wireless carriers and developing new relationships with other carriers are critical to our success.
We operate in an emerging market. Our future success depends on an increased demand for wireless services for voice and other mobile broadband services such as transmissions of photos or videos and internet communication.
We have built flexibility into our spending by reducing capital expenditures, general and administrative and sales and marketing expenses. However, our ability to pay our expenses and make payments due on our indebtedness depends on our future performance, which will be affected by financial, business, economic, legislative and other factors, many of which are beyond our control. The overall weakness in the U.S. economy may inhibit our ability to grow at the level needed to fully service our indebtedness as scheduled.
Results of Operations
Presented below are selected statements of operations data for the years ended December 31, 2009, 2008 and 2007 that have been derived from our audited consolidated financial statements. You should read this information together with the consolidated financial statements and related notes that are included elsewhere in this Form 10-K. Our historical results are not necessarily indicative of the results that can be expected in future periods.
Statements of Operations Data:
(In thousands)
| |
Year Ended December 31, | |||||||||
|---|---|---|---|---|---|---|---|---|---|---|
| |
2009 | 2008 | 2007 | |||||||
Service revenues |
$ | 63,244 | $ | 49,227 | $ | 27,144 | ||||
Cost of service revenues (excluding depreciation and amortization) |
(58,220 | ) | (79,808 | ) | (72,075 | ) | ||||
Sales and marketing |
(3,262 | ) | (5,456 | ) | (7,906 | ) | ||||
General and administrative |
(27,834 | ) | (20,237 | ) | (27,026 | ) | ||||
Depreciation and amortization |
(27,840 | ) | (24,897 | ) | (18,459 | ) | ||||
Restructuring charges |
(372 | ) | (6,087 | ) | — | |||||
Impairment of FCC licenses |
— | (54,505 | ) | — | ||||||
Impairment of goodwill |
— | (86,093 | ) | (147,893 | ) | |||||
Interest income |
295 | 5,316 | 18,159 | |||||||
Interest expense |
(47,605 | ) | (47,742 | ) | (44,560 | ) | ||||
Gain on early extinguishment of debt, net |
98,248 | — | — | |||||||
Miscellaneous income (expense), net |
(39 | ) | 264 | 469 | ||||||
Income tax benefit |
1,247 | 20,189 | — | |||||||
Net loss |
$ | (2,138 | ) | $ | (249,829 | ) | $ | (272,147 | ) | |
46
The following table presents selected statements of operations data as a percentage of our service revenues for each of the periods indicated.
| |
Year Ended December 31, | |||||||||
|---|---|---|---|---|---|---|---|---|---|---|
| |
2009 | 2008 | 2007 | |||||||
Service revenues |
100 | % | 100 | % | 100 | % | ||||
Cost of service revenues (excluding depreciation and amortization) |
(91 | )% | (162 | )% | (266 | )% | ||||
Sales and marketing |
(5 | )% | (11 | )% | (29 | )% | ||||
General and administrative |
(44 | )% | (41 | )% | (100 | )% | ||||
Depreciation and amortization |
(44 | )% | (51 | )% | (68 | )% | ||||
Restructuring charges |
(1 | )% | (12 | )% | — | |||||
Impairment of FCC licenses |
— | (111 | )% | — | ||||||
Impairment of goodwill |
— | (175 | )% | (545 | )% | |||||
Interest income |
0 | % | 11 | % | 67 | % | ||||
Interest expense |
(75 | )% | (97 | )% | (164 | )% | ||||
Gain on early extinguishment of debt, net |
155 | % | — | — | ||||||
Miscellaneous income (expense), net |
(0 | )% | 1 | % | 2 | % | ||||
Income tax benefit |
2 | % | 41 | % | — | |||||
Net loss |
(3 | )% | (507 | )% | (1,003 | )% | ||||
Non-GAAP Financial Measures
We use the total Adjusted EBITDA, which is a non-GAAP (Generally Accepted Accounting Principles) financial measure, to monitor the financial performance of our operations. This measurement, together with GAAP measures such as revenue and loss from operations, assists management in its decision-making processes relating to the operation of our business. Adjusted EBITDA is defined as net income (loss) from operations before interest, taxes, depreciation and amortization, impairment and restructuring charges, stock-based compensation, gain on early extinguishment of debt, debt exchange expenses and other income (expense). Adjusted EBITDA is not a substitute for operating income, net income (loss), or cash flow used in operating activities as determined in accordance with GAAP, as a measure of performance or liquidity. In addition, our presentation of Adjusted EBITDA may not be comparable to similarly titled measures reported by other companies. This non-GAAP financial measure should be viewed in addition to, and not as an alternative for, our reported financial results as determined in accordance with GAAP.
We believe Adjusted EBITDA provides an additional way to view our operations, and when viewed with both our GAAP results and the reconciliation to net income (loss), we believe it provides a more complete understanding of our business than could otherwise be obtained absent this disclosure. Adjusted EBITDA is an especially important measurement in a capital-intensive industry such as telecommunications. We use Adjusted EBITDA internally as a metric to evaluate and compensate our personnel and management for their performance, and as a benchmark to evaluate our operating performance in comparison to our competitors. Management also uses Adjusted EBITDA to measure, from period-to-period, its ability to fund capital expenditures, fund growth, service debt and determine bonuses. We have provided this information to enable analysts, investors and other interested parties to perform meaningful comparisons of past and current operating performance and as a means to evaluate the results of our ongoing operations.
47
Adjusted EBITDA has significant limitations as an analytical tool, and you should not consider it in isolation or as a substitute for analysis of our results as reported under GAAP. Some of these limitations are:
- •
- Adjusted EBITDA does not reflect our cash expenditures, or future requirements, for capital investments or contractual
commitments;
- •
- Adjusted EBITDA does not include depreciation and amortization expense. Depreciation and amortization are necessary
elements of our costs and our ability to generate profits; and the assets being depreciated and amortized will often have to be replaced in the future. Adjusted EBITDA does not reflect any cash
requirements for such replacements;
- •
- Adjusted EBITDA excludes the effect of all non-cash equity based compensation. We have excluded these
financial measures, because we believe non-cash equity based compensation is not an indicator of the performance of our core operations;
- •
- Adjusted EBITDA does not include impairment of long-lived assets and other charges. We excluded the effect of
impairment losses because we believe that including them in Adjusted EBITDA is not consistent with reflecting the ongoing performance of our remaining assets;
- •
- Adjusted EBITDA does not include restructuring charges. The restructuring charges relate to a restructuring plan we
implemented during the second quarter of 2008 as a result of management's decision to restructure our operations to reflect changes in our strategic plans designed to reduce costs. We excluded the
effect of this non-recurring and material item from GAAP net income (loss) as it is not an indicator of our continuing operations;
- •
- Adjusted EBITDA does not include the charges associated with the Exchange Offer and Mandatory Redemption which occurred in
the fourth quarter of 2009. We excluded the effect of these one-time charges because we believe that including them in Adjusted EBITDA is not consistent with reflecting the performance of
our continuing operations;
- •
- Adjusted EBITDA excludes impairment of goodwill. As a result of a decline in our market capitalization below the carrying
value of our equity during the quarter ended March 31, 2008, we concluded that the carrying value of goodwill was fully impaired and recorded an impairment charge of $86.1 million,
reducing the carrying value of goodwill to its fair value of zero at March 31, 2008. The carrying value of goodwill was reduced by impairment charges of $147.9 million in 2007. We
excluded the effect of this non-recurring and material item from GAAP net income (loss) as it is not an indicator of our continuing operations;
- •
- Adjusted EBITDA does not include interest expense. Because we have borrowed money in order to finance our operations,
interest expense is a necessary element of our costs and ability to generate profits and cash flows. We excluded interest expense from this measure so that investors may evaluate our operating results
without regard to our financing methods;
- •
- Adjusted EBITDA does not reflect interest income or the cash benefits derived. We excluded interest income because it is
not an indicator of our continuing operations;
- •
- Adjusted EBITDA does not include the gain on early extinguishment of debt. We excluded the effect of gains recorded on the
early extinguishment of debt because we believe that including them in Adjusted EBITDA is not consistent with reflecting the performance of our continuing operations; and
- •
- Adjusted EBITDA does not reflect income tax provision or benefit or the cash requirements necessary to pay for income tax obligations.
48
We compensate for these limitations by using non-GAAP financial measures as only one of several comparative tools, together with GAAP measurements, to assist in the evaluation of our profitability and operating results.
The following table shows the calculation of our total Adjusted EBITDA reconciled to net loss (in thousands):
| |
Year Ended December 31, | ||||||||||
|---|---|---|---|---|---|---|---|---|---|---|---|
| |
2009 | 2008 | 2007 | ||||||||
Net loss |
$ | (2,138 | ) | $ | (249,829 | ) | $ | (272,147 | ) | ||
Adjustments: |
|||||||||||
Depreciation and amortization |
27,840 | 24,897 | 18,459 | ||||||||
Stock-based compensation |
8,016 | 6,274 | 9,150 | ||||||||
Impairment of long-lived assets and other charges |
270 | 16,439 | 17,561 | ||||||||
Restructuring charges |
372 | 6,087 | — | ||||||||
Exchange Offer and redemption of debt expenses |
4,476 | — | — | ||||||||
Impairment of FCC licenses |
— | 54,505 | — | ||||||||
Impairment of goodwill |
— | 86,093 | 147,893 | ||||||||
Interest income |
(295 | ) | (5,316 | ) | (18,159 | ) | |||||
Interest expense |
47,605 | 47,742 | 44,560 | ||||||||
Gain on early extinguishment of debt, net |
(98,248 | ) | — | — | |||||||
Miscellaneous (income) expense, net |
39 | (264 | ) | (469 | ) | ||||||
Income tax benefit |
(1,247 | ) | (20,189 | ) | — | ||||||
Adjusted EBITDA |
$ | (13,310 | ) | $ | (33,561 | ) | $ | (53,152 | ) | ||
We expect to achieve Adjusted EBITDA positive in 2010.
Year ended December 31, 2009 compared to year ended December 31, 2008
Service revenues in 2009 increased 28% to $63.2 million compared to $49.2 million for 2008. This increase was primarily due to receiving the benefit of a full year of revenue in 2009 from new customers added in 2008, plus adding 221 billing locations and selling incremental bandwidth to customers at existing sites. The average monthly revenue generated per billing site increased to $1,888 in 2009 compared to $1,614 for 2008.
Cost of service revenues (excluding depreciation and amortization) decreased 27% to $58.2 million in 2009, compared to $79.8 million for 2008. This decrease was primarily due to i) lower impairment of long-lived assets and other charges in 2009 as described below, ii) the effects of the workforce reduction in the second quarter of 2008 discussed at Note 4, Restructuring Charges, iii) lower fiber service provider expenses including a $0.6 million savings from circuit terminations and iv) lower site maintenance expenses which included a $0.4 million insurance reimbursement relating to hurricane damage in late 2008. This decrease was partially offset by i) lower capitalized labor costs reflecting a reduction in site expansion and ii) approximately $0.9 million of additional stock-based compensation expense from the acceleration of restricted stock and stock option vesting resulting from the change in control of FiberTower as a result of the Exchange Offer and redemption of debt described at Note 1, Organization and Business.
Cost of service revenues also included $0.3 million related to the impairment of long-lived assets and other charges in 2009 compared to $16.4 million for 2008. These impairments related to our assessment of the recoverability of certain costs accumulated in construction-in-progress. See Note 5, Impairment of Long-Lived Assets and Other Charges for additional information.
49
Service revenues tend to lag behind cost of service revenues initially for new sites, especially in new markets, because there are certain upfront costs that are generally incurred for a period of time before a site generates revenue. These costs include site evaluation expenses, lease payments that are incurred before the site generates revenues, payments to fiber service providers in order to ensure sufficient capacity is available to carry new traffic, as well as costs related to unsuccessful site acquisitions that are incurred during deployment.
Sales and marketing expenses decreased 40% to $3.3 million in 2009 compared to $5.5 million for 2008. This decrease reflects the reclassification of six employees from sales and marketing to general and administrative at the end of the fourth quarter of 2008 as their responsibilities changed. Also contributing to this decrease was a lower commission accrual in 2009 compared to 2008 due to changes in our 2009 commission plan. Partially offsetting this decrease was approximately $0.3 million of additional stock-based compensation expense from the acceleration of restricted stock and stock option vesting resulting from the change in control of FiberTower as a result of the Exchange Offer and redemption of debt.
General and administrative expenses increased 38% to $27.8 million in 2009 compared to $20.2 million for 2008. This increase reflects i) additional consulting fees, including approximately $4.5 million related to the Exchange Offer and redemption of debt described at Note 1, Organization and Business, ii) approximately $2.0 million of additional stock-based compensation expense from the acceleration of restricted stock and stock option vesting resulting from the change in control of FiberTower as a result of the Exchange Offer and redemption of debt and iii) the reclassification of six employees from sales and marketing and one employee from cost of service revenues to general and administrative at the end of the fourth quarter of 2008 as their responsibilities changed.
Depreciation and amortization expense increased 12% to $27.8 million in 2009 compared to $24.9 million for 2008. This increase reflects $8.6 million in capital additions during 2009 (excluding $4.2 million acquired under a capital lease entered at the end of 2009), $36.8 million in capital additions during 2008 and upgrades to existing sites during 2009.
During 2008, we recorded restructuring charges of $6.1 million as a result of management's decision to restructure our operations to reflect changes in our strategic plan designed to reduce costs. The resultant restructuring charges reflected i) management's decision to cease market development activities in the Carolinas market resulting in an exit plan for our site operating leases, ii) termination benefits under a workforce reduction of 59 employees consistent with revisions to our network deployment plan and iii) the consequent termination or renegotiation of excess office space including the former headquarters in New Jersey. See Note 4, Restructuring Charges for additional information.
As a result of the impairment evaluation to the carrying value of our FCC licenses in the fourth quarter of 2008, it was determined that the fair value of our FCC licenses was less than their carrying value. Consequently, the carrying value of our FCC licenses was reduced by $54.5 million to $287.5 million at December 31, 2008. Based on the results of the impairment evaluation of our FCC licenses in the fourth quarter of 2009, it was determined that the fair value of our FCC licenses was greater than their carrying value. Therefore, no additional reduction to their carrying value was required in 2009. Future impairment evaluations of our FCC licenses could lead to additional material impairment charges. See Note 6, Impairment of FCC Licenses for additional information.
As a result of the impairment evaluation of the fair value of the carrying amount of goodwill in the first quarter of 2008, we recorded a goodwill impairment charge of $86.1 million reducing the carrying value of goodwill to its fair value of zero at March 31, 2008. See Note 7, Impairment of Goodwill for additional information.
50
Interest income and interest expense are primarily the result of interest earned on investment of cash proceeds and interest cost incurred on the outstanding balance of our indebtedness. See Note 8, Long-term Debt for additional information.
Interest income decreased 94% to $0.3 million in 2009 from $5.3 million for 2008. The reduction was due to lower cash balances available for investment and lower interest rates as we shifted our holdings of cash balances to only be in bank deposits and money market mutual funds which invest in U.S. Government securities.
Interest expense was $47.6 million in 2009 compared to from $47.7 million for 2008. While there was only a small year-over-year net change, there were several items which increased and decreased interest expense during the year. Increases to interest expense resulted from i) an accrual for the increase from 9% to 11% interest rate on the interest payments made in additional Notes due 2012 issued in May and November 2009; ii) an accrual for the additional accretion related to the principal premium for the additional Notes due 2012 issued in May and November 2009; and iii) a reduction in the amount of interest expense which was capitalized. Offsetting these increases was a reduction in interest expense resulting from the repurchases of $142.2 million par value of our Notes due 2012 in the open market during the first six months of 2009. As a result of the repurchases of Notes due 2012 and the Exchange Offer and redemption of debt described at Note 1, Organization and Business and Note 8, Long-term Debt, our annual cash interest payments on indebtedness were reduced to approximately $6.0 million.
The repurchases of the Notes due 2012 in 2009 resulted in the recognition of a gain on early extinguishment of debt of $98.2 million. See Note 8, Long-term Debt for additional information regarding this gain.
We recorded a net income tax benefit of $1.3 million in 2009 and an income tax benefit of $20.2 million in 2008. As a result of the gain on early extinguishment of debt, we recorded a state income tax provision of $0.2 million. Also in 2009, we recorded a $1.5 million income tax benefit and a corresponding decrease to the deferred tax liability resulting from our update to state apportionment percentages. In the fourth quarter of 2008, we recorded a $20.2 million income tax benefit as the result of reducing the deferred income tax liability associated with the FCC licenses for the tax impact of the $54.5 million impairment charge on the FCC licenses. See Note 12, Income Taxes and Note 6, Impairment of FCC Licenses for additional information.
Year ended December 31, 2008 compared to year ended December 31, 2007
Service revenues increased 81% to $49.2 million in 2008 compared to $27.1 million for 2007. This increase was primarily driven by the addition of 307 new deployed sites and greater penetration in existing markets. The average monthly revenue generated per billing site increased to $1,614 in 2008 compared to $1,259 for 2007.
Cost of service revenues (excluding depreciation and amortization) increased 11% to $79.8 million in 2008 compared to $72.1 million for 2007. This increase was primarily due to higher site lease expense and fiber service provider charges incurred to support the 615 billing sites that were added to the network during 2008. Partially offsetting this increase were the effects of the workforce reduction in the second quarter of 2008.
51
Cost of service revenues also included $16.4 million in 2008 and $17.6 million in 2007 related to the impairment of long-lived assets and other charges. See Note 5, Impairment of Long-Lived Assets and Other Charges for additional information on the following charges:
- •
- We recorded impairment charges of $16.4 million in 2008 and $13.0 million in 2007 related to our assessment
of the recoverability of certain costs accumulated in construction-in-progress.
- •
- During the third quarter of 2007, we suspended development activities in the Carolinas market where we had not yet generated billing customers. Third party project management fees and construction costs related to these development activities, capitalized as construction-in-progress, had an aggregate net carrying value of $4.4 million at September 30, 2007 and had no alternative use or salvage value. The resultant long-lived asset impairment charge of $4.4 million was included in cost of service revenues for 2007. In connection with the suspension of development activities in this market, we paid contract termination costs and one-time termination benefits totaling $0.2 million.
Sales and marketing expenses decreased 31% to $5.5 million in 2008 compared to $7.9 million for 2007. This decrease reflected the effects of the workforce reduction and a lower commission accrual in 2008 as compared to 2007 due to changes in our 2008 commission plan.
General and administrative expenses decreased 25% to $20.2 million in 2008 compared to $27.0 million for 2007. This decrease, both at the field and corporate level, was primarily due to the effects of the workforce reduction, lower professional and consulting fees relating to public company-related costs and lower facilities-related expenses reflecting the termination or renegotiation of excess office space.
Depreciation and amortization expense increased 35% to $24.9 million in 2008 compared to $18.5 million for 2007. This increase reflected $36.8 million in capital additions during 2008 driven by the addition of 307 new deployed sites during the year.
During 2008, we recorded restructuring charges of $6.1 million as a result of management's decision to restructure our operations to reflect changes in our strategic plan designed to reduce costs. See description above and Note 4, Restructuring Charges for additional information.
As a result of the impairment evaluation to the carrying value of our FCC licenses in the fourth quarter of 2008, it was determined that the fair value of our FCC licenses was less than its carrying value. Consequently, the carrying value of our FCC licenses was reduced by $54.5 million to $287.5 million at December 31, 2008. See Note 6, Impairment of FCC Licenses for additional information.
As a result of the impairment evaluation of the fair value of the carrying amount of goodwill in the first quarter of 2008, we recorded a goodwill impairment charge of $86.1 million reducing the carrying value of goodwill to its fair value of zero at March 31, 2008. The carrying value of goodwill was reduced by impairment charges of $147.9 million in 2007. See Note 7, Impairment of Goodwill for additional information.
Interest income decreased 71% to $5.3 million in 2008 compared to $18.2 million for 2007. The reduction was due to lower cash balances available for investment and lower interest rates.
Interest expense increased 7% to $47.7 million in 2008 compared to $44.6 million for 2007. The increase was primarily due to a reduction in the amount of interest expense capitalized in 2008.
Miscellaneous income for 2007 included $0.6 million for the decrease in the fair value of the embedded derivative associated with the Notes due 2012.
In the fourth quarter of 2008, we recorded a $20.2 million income tax benefit. This income tax benefit was the result of reducing the deferred income tax liability associated with the FCC licenses for
52
the tax impact of the $54.5 million impairment charge on the FCC licenses. See Note 6, Impairment of FCC Licenses and Note 12, Income Taxes for additional information.
Performance Measures
In managing our business and assessing our financial performance, we supplement the information provided by financial statement measures with several customer- focused performance metrics to assess the growth and evaluate the performance of our operations. In addition to traditional financial evaluations, including performance against budget, we also consider non-financial measurements, the most important of which are revenue per billing site, the number of sites deployed, number of sites billing and the number of customer locations billing. The number of sites deployed represents sites from which we could deliver our services in a particular market. The number of sites billing represents the number of installed sites from which we provide revenue-producing services to customers. Customer locations billing are carrier locations, at which we currently provide revenue- producing services. A billing site could have multiple customer (carrier) locations.
Revenue per billing site is a key operating metric reflecting our ability to scale and leverage our existing network. The number of sites constructed is a key factor in determining the amount of additional capital expenditures required to grow the network and the number of field personnel required to support our operations and sales growth. Billing sites and the number of customer locations billing are indicators of the productivity of the network.
The following table shows annual key operating metric information.
| |
Year Ended December 31, | ||||||||||
|---|---|---|---|---|---|---|---|---|---|---|---|
| |
2009 | 2008 | 2007 | ||||||||
Billing Sites: |
|||||||||||
Billing sites added |
25 | 615 | 819 | ||||||||
Ending billing sites |
2,788 | 2,763 | 2,148 | ||||||||
Billing sites/sites deployed |
89 | % | 89 | % | 76 | % | |||||
Average monthly revenue per site |
$ | 1,888 | $ | 1,614 | $ | 1,259 | |||||
Billing Customer Locations: |
|||||||||||
Billing customer locations added |
221 | 2,245 | 2,047 | ||||||||
Ending billing customer locations |
6,317 | 6,096 | 3,851 | ||||||||
Co-location rate |
2.27 | 2.21 | 1.79 | ||||||||
Sites Deployed: |
|||||||||||
FiberTower sites constructed |
(3 | ) | 307 | 817 | |||||||
Ending sites deployed |
3,117 | 3,120 | 2,813 | ||||||||
Billing Sites are installed sites from which we provide revenue-producing service(s) to customer(s).
Average Monthly Revenue per Site is the average monthly revenue per billing site.
Billing Customer Locations are carrier locations at which we currently provide revenue-producing service(s). Our sites could have multiple customer locations.
Co-location rate is the number of customer locations per billing site.
Sites Deployed represents installed sites, net of any decommissioned sites, which are ready for the provision of services. Our sites can be located on cell towers, rooftops, or other points of bandwidth aggregation.
53
The following table shows quarterly key operating metric information.
| |
Three Months Ended | |||||||||||||||||||||||||
|---|---|---|---|---|---|---|---|---|---|---|---|---|---|---|---|---|---|---|---|---|---|---|---|---|---|---|
| |
Dec. 31, 2009 |
Sept. 30, 2009 |
June 30, 2009 |
Mar. 31, 2009 |
Dec. 31, 2008 |
Sept. 30, 2008 |
June 30, 2008 |
Mar. 31, 2008 |
||||||||||||||||||
Billing Sites: |
||||||||||||||||||||||||||
Billing sites added |
(15 | ) | 8 | 5 | 27 | 33 | 146 | 237 | 199 | |||||||||||||||||
Ending billing sites |
2,788 | 2,803 | 2,795 | 2,790 | 2,763 | 2,730 | 2,584 | 2,347 | ||||||||||||||||||
Billing sites/sites deployed |
89 | % | 90 | % | 90 | % | 89 | % | 89 | % | 88 | % | 86 | % | 81 | % | ||||||||||
Average monthly revenue per site |
$ | 1,995 | $ | 1,931 | $ | 1,860 | $ | 1,767 | $ | 1,732 | $ | 1,679 | $ | 1,605 | $ | 1,440 | ||||||||||
Billing Customer Locations: |
||||||||||||||||||||||||||
Billing customer locations added |
(116 | ) | 101 | 65 | 171 | 264 | 553 | 779 | 649 | |||||||||||||||||
Ending billing customer locations |
6,317 | 6,433 | 6,332 | 6,267 | 6,096 | 5,832 | 5,279 | 4,500 | ||||||||||||||||||
Co-location rate |
2.27 | 2.30 | 2.27 | 2.25 | 2.21 | 2.14 | 2.04 | 1.92 | ||||||||||||||||||
Sites Deployed: |
||||||||||||||||||||||||||
FiberTower sites constructed |
(1 | ) | — | (3 | ) | 1 | 24 | 87 | 98 | 98 | ||||||||||||||||
Ending sites deployed |
3,117 | 3,118 | 3,118 | 3,121 | 3,120 | 3,096 | 3,009 | 2,911 | ||||||||||||||||||
Amounts may be negative in a period in which sites decommissioned or closed are greater than sites added. In 2009, certain periods were negative due to our emphasis on selling into existing networks.
Liquidity and Capital Resources
We had unrestricted cash and cash equivalents of $50.7 million at December 31, 2009. Our business does not currently generate sufficient cash flow from operations to fund our short-term or long-term liquidity needs. We have relied on the proceeds from equity and debt financings to provide cash for our operations.
As described at Note 1, Organization and Business and Note 8, Long-term Debt, during the fourth quarter of 2009 we offered to exchange, which we refer to as the "Exchange Offer", any and all of our existing Notes due 2012 for Interim Notes. Upon the expiration of the Exchange Offer on December 1, 2009, we had received tenders of $266.8 million principal amount of the Notes due 2012, representing approximately 90.8% of the outstanding Notes due 2012. The Interim Notes were redeemed by us on December 22, 2009 whereby $266.8 million of the Interim Notes were exchanged for:
- •
- approximately 30.6 million shares of common stock (on a post-reverse stock split basis), with a fair
value upon issuance of $156.6 million, representing approximately 67% of our outstanding shares on a fully diluted basis;
- •
- approximately $12.7 million in cash; and
- •
- approximately $113.5 million in principal amount of Notes due 2016.
The purpose of the Exchange Offer and redemption of debt was to reduce our outstanding debt and cash interest requirements and extend the maturity of our outstanding debt. As a result of the Exchange Offer and redemption of debt, the total carrying value of our outstanding debt was reduced by $171.7 million, the maturity of a substantial portion of our debt was extended from 2012 to 2016 and our annual cash interest payments were reduced by more than $20.0 million to approximately $6.0 million.
54
In the first and second quarters of 2009, we repurchased a total of $142.2 million par value of our Notes due 2012 in the open market. These repurchases, at a weighted average price of approximately $37 per $100 of par value, were for a total of $52.2 million in cash plus accrued but unpaid interest. These repurchases, together with the exchange of the Notes due 2012 as described above, reduced the carrying value of the outstanding Notes due 2012 to $30.1 million at December 31, 2009. See Note 8, Long-term Debt for additional information on the Notes due 2012 including their guarantees and conversion features.
Based upon our current plans, we believe that our existing cash and cash equivalents of $50.7 million will be sufficient to cover our estimated liquidity needs for at least the next twelve months.
Our primary liquidity needs arise from capital requirements necessary to expand our network and fund operating losses. We anticipate that we will continue to invest significantly in deploying our network over the next several years. The size of our capital requirements will depend on numerous factors, including our ability to grow revenues, control costs, and deploy our network on a timely basis according to plan and customer requirements. We will require significant cash expenditures related to capital construction costs and operating losses. We anticipate that we will use between $25 million and $30 million of cash for capital expenditures during 2010 to expand our network. However, if market conditions warrant, we expect to be able to slow the amount of capital expenditures to a level consistent with the business needs at that time.
Our long-term economic model is designed to allow replicable, scalable individual market builds so that we can increase or decrease our market deployment schedule based on available cash. As a result, the amount and timing of our long-term capital needs will depend on the extent of our network deployment. As our business is in its early stages, we regularly evaluate our plans and strategy, and these evaluations often result in changes, some of which may be material and significantly modify our cash requirements.
We have built flexibility into our spending by reducing capital expenditures, recurring general and administrative and sales and marketing expenses. However, our ability to pay our expenses and make payments due on our Notes due 2016 and Notes due 2012 depends on our future performance, which will be affected by financial, business, economic, legislative and other factors, many of which are beyond our control. Our business may not generate sufficient cash flow from operations in the future, which could result in our being unable to pay interest on or repay indebtedness or to fund other liquidity needs. The overall weakness in the U.S. economy may inhibit our ability to grow at the level needed to fully service our Notes due 2016 and Notes due 2012 as scheduled. If we do not have sufficient funds to service such debt, we may need to reduce our operations or delay our expansion. In addition, we may be required to sell assets, issue additional equity securities or incur additional debt, or we may need to refinance or restructure all or a portion of our indebtedness at or before maturity.
Under the terms of our Notes due 2016, if certain specified events occur prior to maturity, holders may require us to repurchase all or part of the Notes due 2016 for cash at a repurchase price equal to 101% of their aggregate accreted principal amount, plus accrued and unpaid interest. We may not have sufficient funds at such time to repurchase any or all of the Notes due 2016.
The Notes due 2016 bear interest at 9% accruing from December 22, 2009, payable semi-annually. On each interest payment date, one-third of the interest will be payable in cash and two-thirds of the interest will be payable in additional Notes due 2016 in a principal amount equal to such portion of the interest amount. We have placed into escrow approximately $11.0 million, which, together with the earnings thereon, is an amount sufficient to pay the cash portion of the first six interest payments.
55
We elected to pay the May and November 2009 interest payments on the Notes due 2012 entirely by the issuance of additional Notes due 2012, as permitted under the indenture governing the Notes due 2012. This resulted in the issuance of an additional $33.5 million in principal amount of Notes due 2012. We have the option of making either or both of the next two interest payments due in May and November 2010 with additional Notes due 2012 in lieu of cash. The interest rate applicable to any such interest payments made in additional Notes due 2012 is 11%. Thereafter, the interest on the Notes due 2012 would be payable only in cash. We currently expect the payment of the May 2010 interest payment to be made in additional Notes due 2012.
We may not be able to generate cash flow from operations sufficient to meet our liquidity needs in the future, which would require us to continue to raise funds through external sources. In the future, we plan to obtain financing through the issuance of additional equity or debt securities, or both. There can be no assurance that this additional financing will be available on terms acceptable to us or at all. If we do not have sufficient funds, we may need to reduce our operations or delay our expansion. In addition, we may be required to sell assets, issue additional equity securities or incur additional debt, or we may need to refinance or restructure all or a portion of our indebtedness at or before maturity. We may not be able to accomplish any of these alternatives on terms acceptable to us, or at all. In addition, the terms of our debt agreements may restrict us from adopting any of these alternatives.
Our business is in its early stages, and as such we have invested heavily in capital requirements to build and expand our network. As a result, we have incurred net losses and negative cash flows from operating and investing activities since our inception, and we expect that we will continue to incur operating and net losses and negative cash flows for the next few years as we continue to expand our network. We hope that by reducing our cash interest payments and extending the maturity of our debt, as described above, that we will be able to increase our financial and operational flexibility to grow our cash flow from operating activities to a level sufficient to service our debt.
Cash Flow Analysis
Our principal liquidity requirements are for working capital purposes and the expansion of our network through our investment in network equipment and site acquisition and construction costs.
Operating Activities
In 2009, net cash used in operating activities decreased by $56.4 million to $18.6 million compared to cash used in operating activities of $75.0 million for 2008. The negative cash flow from operations in 2009 is principally comprised of our net loss of $2.1 million, net non-cash credits of $11.8 million and a reduction of accrued interest payable of $4.2 million.
In 2008, net cash used in operating activities increased by $6.1 million to $75.0 million compared to $68.9 million for 2007. The negative cash flow from operations in 2008 reflects net loss of $249.8 million and a reduction of accounts payable of $9.8 million due to the payment of vendors, partially offset by non-cash charges of $188.5 million and an increase of $3.0 million in accounts receivable.
56
The following table shows non-cash (credits) charges included in net cash used in operating activities (in thousands):
| |
Year Ended December 31, | ||||||||||
|---|---|---|---|---|---|---|---|---|---|---|---|
| |
2009 | 2008 | 2007 | ||||||||
Non-cash (credits) charges: |
|||||||||||
Depreciation and amortization |
$ | 27,840 | $ | 24,897 | $ | 18,459 | |||||
Gain on early extinguishment of debt, net |
(98,248 | ) | — | — | |||||||
Payment-in-kind of interest |
33,529 | — | — | ||||||||
Accretion of convertible notes |
15,572 | 14,539 | 12,653 | ||||||||
Amortization of debt issuance costs |
1,365 | 2,256 | 2,154 | ||||||||
Stock-based compensation |
8,016 | 6,274 | 9,150 | ||||||||
Impairment charges on long-lived assets and other charges |
270 | 16,439 | 17,561 | ||||||||
Restructuring charges |
372 | 4,046 | — | ||||||||
Impairment of FCC licenses |
— | 54,505 | — | ||||||||
Impairment of goodwill |
— | 86,093 | 147,893 | ||||||||
Income tax benefit |
(1,247 | ) | (20,189 | ) | — | ||||||
Other, net |
755 | (409 | ) | (1,352 | ) | ||||||
Total non-cash (credits) charges |
$ | (11,776 | ) | $ | 188,451 | $ | 206,518 | ||||
Investing Activities
Net cash used in investing activities consisted primarily of our investment in network equipment and site construction costs as well as the back-office systems to support the network. As of December 31, 2009, we provided services to 2,788 billing sites in 13 markets throughout the U.S., an increase of 25 billing sites during 2009.
Net cash provided (used) in investing activities were as follows (in thousands):
Period ended
|
Amount | ||||
|---|---|---|---|---|---|
Year ended December 31: |
|||||
2009 |
$ | (20,255 | ) | ||
2008 |
5,624 | ||||
2007 |
(54,689 | ) | |||
There were capital additions of $12.8 million in 2009 (of which $4.2 million was acquired under a capital lease), $36.8 million in 2008 and $105.3 million in 2007. In the fourth quarter of 2009, we made a $0.5 million deposit under the capital lease. In 2009 our new sites deployed were flat as compared to 2008. In 2008 we deployed 307 new sites and in 2007 we deployed 817 new sites. In 2009 and 2008, additional capital spending went into adding incremental customers at existing sites relative to 2007. In addition, we incurred capital expenditures to support site builds beyond 2009. We anticipate that we will use between $25 million and $30 million of cash for capital expenditures during 2010 to expand our network. However, if market conditions warrant, we expect to be able to slow the amount of capital expenditures to a level consistent with the business needs at that time.
In December 2009, we placed into escrow approximately $11.0 million invested in cash and bonds issued by U.S. Government agencies, which, together with the earnings thereon, is an amount sufficient to pay the cash portion of the first six interest payments for the Notes due 2016. During 2008, our restricted cash and investments were reduced by $36.5 million and in 2007 by $33.5 million, reflecting our semi-annual interest payments in May and November 2008 and 2007 on the Notes due 2012, not all
57
of which was paid out of restricted cash Also during 2008, $1.1 million of restricted cash related to a supplier service agreement, was released. During 2008, there were $5.0 million in maturities of certificates of deposit used in current operations. During 2007, there were net maturities of short-term investments of $15.6 million used in current operations, which reduced our short-term investments balance to zero.
Financing Activities
In the first six months of 2009, we repurchased $142.2 million par value of our Notes due 2012 in the open market. These repurchases, at a weighted average price of approximately $37 per $100 of par value, were for $52.2 million in cash plus accrued but unpaid interest. See Note 8, Long-term Debt for additional information regarding our indebtedness.
In the fourth quarter of 2009, we paid approximately $12.7 million upon the redemption of the Interim Notes. See Note 1, Organization and Business for further information on the Exchange Offer and redemption of Interim Notes.
No cash was provided by the exercise of stock options in 2009. There was $0.4 million cash provided by the exercise of stock options in 2008 and $1.8 million in 2007.
Restricted Cash and Investments
At December 31, 2009, we had unrestricted cash and cash equivalents of $50.7 million that were held in bank deposits and money market mutual funds.
We had total restricted cash and investments of $11.6 million at December 31, 2009 and $0.5 million at December 31, 2008. The balance at December 31, 2009 consists of i) approximately $11.0 million invested in cash and bonds issued by U.S. Government agencies, which, together with the earnings thereon, is an amount sufficient to pay the cash portion of the first six interest payments for the Notes due 2016 and ii) $0.6 million of certificates of deposit which collateralize letters of credit, the final expiration date of which is November 2010. Restricted cash and investments at December 31, 2008 consisted only of certificates of deposit which collateralized letters of credit.
Off-Balance Sheet Arrangements
We have no off-balance sheet arrangements.
58
Contractual Obligations and Commitments
The following table summarizes our contractual obligations and other commercial commitments as of December 31, 2009 (in thousands):
| |
|
Payments Due by Period | ||||||||||||||
|---|---|---|---|---|---|---|---|---|---|---|---|---|---|---|---|---|
| |
Total | Fiscal 2010 | Fiscal 2011-2012 | Fiscal 2013-2014 | Beyond Fiscal 2014 |
|||||||||||
Contractual Obligations: |
||||||||||||||||
Operating lease obligations |
$ | 185,639 | $ | 35,262 | $ | 63,141 | $ | 49,174 | $ | 38,062 | ||||||
Capital lease obligations |
5,469 | 270 | 1,913 | 3,286 | — | |||||||||||
Asset retirement obligations |
4,550 | — | — | — | 4,550 | |||||||||||
Senior secured notes due 2016 |
186,354 | (1) | 1,788 | 7,347 | 8,270 | 168,949 | ||||||||||
Convertible senior secured notes due 2012 |
42,331 | (2) | 1,282 | 41,049 | — | — | ||||||||||
Other Commercial Commitments: |
||||||||||||||||
Letters of credit |
624 | 324 | — | — | 300 | |||||||||||
Total |
$ | 424,967 | $ | 38,926 | $ | 113,450 | $ | 60,730 | $ | 211,861 | ||||||
- (1)
- These
amounts represent total anticipated cash payments, including expected interest payments that are not recorded on the consolidated balance sheets.
Interest is payable semi-annually in January and July, one-third in cash and two-thirds by issuing additional Notes due 2016. On December 22, 2009, we placed
into escrow approximately $11.0 million, which, together with the earnings thereon, is an amount sufficient to pay the cash portion on the first six interest payments.
- (2)
- These amounts represent total anticipated cash payments, including expected interest payments that are not recorded on the consolidated balance sheets. As permitted under the indenture governing these notes, we elected to pay the May and November 2009 interest payments entirely by the issuance of additional notes in lieu of cash. We have the option of making either or both of the next two semi-annual interest payments due in May and November 2010 with additional notes in lieu of cash. The interest rate applicable to any such interest payments made in additional notes is 11%. Thereafter, the interest would be payable only in cash. We currently expect the payment of the May 2010 interest payment to be made in additional notes.
Critical Accounting Policies and Estimates
Our discussion and analysis of our financial condition and results of operations is based upon our consolidated financial statements, which have been prepared in accordance with U.S. Generally Accepted Accounting Principles. For additional information regarding our critical accounting policies and estimates, see Note 2, Basis of Presentation and Accounting Polices. The application of these policies requires us to make estimates and assumptions that affect the amounts reported in the financial statements and notes. We base our accounting estimates on historical experience and other factors which we believe to be reasonable under the circumstances. However, actual results may differ materially from those estimates under different assumptions or conditions. Management has discussed the development and selection of critical accounting policies and estimates with our Audit Committee.
We believe that the following critical accounting policies represent the more significant judgments and estimates made in the preparation of our consolidated financial statements.
Revenue and Expense Recognition—We recognize revenues when: (i) persuasive evidence of an arrangement exists, (ii) the services have been provided to the customer, (iii) the sales price is fixed or
59
determinable and (iv) the collection of the sales price is reasonably assured. Amounts billed in advance of providing service are recorded as deferred revenues. Incremental direct costs of service activation are charged to expense as incurred. We purchase electricity and lease co-location site space from certain of our customers. We receive an identifiable benefit in exchange for the amounts paid to our customers and we can reasonably estimate the fair value of the purchased electricity and leased tower site space. Therefore, we charge such amounts to cost of service revenues as incurred. Other consideration provided to customers, such as customer incentives, is recorded as a reduction of service revenues.
Useful Life Assignments and Impairment Evaluations Associated with Long-Lived Assets, including Intangible Assets—Property and equipment, which consists principally of network equipment and capitalized site development costs, are stated at cost less accumulated depreciation and amortization. Depreciation and amortization are calculated using the straight-line method over the estimated useful lives ranging from three to ten years. Our indefeasible right of use of dark fiber, acquired in the fourth quarter of 2009, is depreciated over its estimated useful life of 20 years. Depreciation begins when the assets are placed in service. Leasehold improvements are amortized over the shorter of the lease term or their estimated useful lives. The economic lives are estimated at the time assets are placed in service and are based on historical experience and anticipated technological or other changes. If technological changes were to occur more rapidly than anticipated or in a different form than anticipated, the useful lives assigned to these assets may need to be shortened, resulting in the recognition of increased depreciation expense in future periods.
Property and equipment are evaluated for impairment whenever events or changes in circumstances indicate that the carrying value may not be recoverable. An impairment loss is recognized whenever (i) the estimated undiscounted future cash flows expected to result from the use of the asset plus net proceeds expected from disposition of the asset, if any, are less than the carrying value of the asset and (ii) the fair value of the asset is less than its carrying value. When an impairment loss is identified, the carrying value of the asset is reduced to its fair value. These assessments require us to make assumptions regarding future cash flows, discount rates, and other factors resulting in estimates of fair value to determine the amount of any impairment. Such impairment losses were identified in 2009, 2008 and 2007. See Note 5, Impairment of Long-Lived Assets and Other Charges for additional information.
Assessment of FCC Licenses and Goodwill for Impairment—As described more fully below, we evaluate our intangible assets with indefinite lives for impairment annually, and between annual evaluations if events or changes in circumstances indicate that the carrying amount of such assets may not be fully recoverable. In cases where required, an impairment provision is recognized in an amount by which the carrying value exceeds the estimated fair value of such assets. Such impairment losses were identified in the fourth quarter of 2008 related to the carrying value of our FCC licenses. See Note 6, Impairment of FCC Licenses for additional information. Such impairment losses were identified in 2008 and 2007 related to the carrying value of our goodwill. See Note 7, Impairment of Goodwill for additional information.
FCC licenses—We operate fixed wireless broadband networks using licenses granted by the FCC for a particular geographic area on spectrum allocated by the FCC for fixed wireless broadband services. Our licenses are integral to our business. Recoverability of the carrying value of our FCC licenses is dependent on numerous factors, including successful deployment of networks and radio links or sales of such assets to a third party. Although our licenses in the 24 GHz and 39 GHz bands are issued with a stated term of ten years, the renewal of these licenses is generally a routine matter without substantial cost and we have determined that no legal, regulatory, contractual, competitive, economic, or other factors currently exist that limit the useful life of our FCC licenses. We consider the FCC licenses to have an indefinite useful life.
60
Under FCC rules, wide-area licenses in the 24 GHz and 39 GHz bands are renewed if the licensee files a renewal application at license expiration wherein the licensee demonstrates its engagement in supplying services or related activities to satisfy the FCC's "substantial service" criteria. We will continue to lease spectrum, utilizing this non-capital intensive method to put more of our FCC licenses to work. We may also introduce new product offerings utilizing our spectrum. Under our current business plan, we believe that we will meet the FCC's substantial service requirements necessary for renewal at the appropriate deadlines and we will continue to engage the FCC on this subject. If at any time we determine that we will most likely not meet these requirements, we will first test the FCC licenses for impairment and then we will modify the life of the particular FCC licenses and begin amortizing the cost over the remaining license period. See Note 15, Guarantees and Other Contingencies for additional information on the FCC license renewal requirements and discussion of license renewals and extensions which we received.
We test our FCC licenses for impairment annually or more frequently if events or changes in circumstances indicate that the carrying value of our indefinite-lived intangible assets might be impaired. We perform our annual impairment test as of each November 1. The impairment test consists of a comparison of the estimated fair value with the carrying value.
We use a direct method of valuation for our indefinite-lived intangible assets. Specifically, we use an income-based approach, the Greenfield Methodology (a form of discounted cash flow model), using a hypothetical start-up operation. This methodology is based on the cash flow generation potential of a hypothetical start-up operation and assumes that the only assets upon formation are the underlying FCC licenses, and that the business enterprise does not have any other assets including goodwill or going concern value at the date of inception. The start-up assumptions include utilization of the asset in the best possible use and incorporate marketplace participant assumptions for key factors such as unit prices, market density and operating expenses.
Cash flow projections and assumptions, although subject to a degree of uncertainty, are based on a combination of our historical performance and trends, our business plans and management's estimates of future performance, giving consideration to existing and anticipated competitive and economic conditions. Our key operating assumptions include unit prices, services offered, market size, operating expenses, income taxes, capital expenditures and working capital requirements. We believe that our estimates are consistent with assumptions that marketplace participants would use to estimate fair value. Any impairment loss would be recorded as a reduction in the carrying value of the FCC licenses and charged to results of operations. If actual results are not consistent with our assumptions and estimates, we may be required to record an impairment charge associated with indefinite-lived intangible assets. Although we currently do not expect our estimates or assumptions to change significantly in the future, the use of different estimates or assumptions within our discounted cash flow model when determining the fair value of our FCC licenses or using a methodology other than a discounted cash flow model could result in different values for our FCC licenses and may affect conclusions about impairment.
The most significant assumptions within our discounted cash flow model are the discount rate, our projected growth rate, costs to build and operate the network and management's future business plans. During our FCC license impairment test, we considered our facts and circumstances, the marketplace in which we compete as well as activity in the broader macroeconomic environment. These considerations led us to increase the amount of initial bandwidth sold per customer to reflect the growing trend in our industry of greater backhaul needs to support next generation wireless networks but lowered the initial price. This had the impact of providing us lower revenue in the early years of the plan, but increased revenue in the later years to reflect carriers buying at lower marginal prices in the future but utilizing greater capacity. Additionally, we raised our discount rate which was derived by analyzing the change in risk premiums in the wireless communications industry affecting a marketplace
61
participant's cost of debt and cost of equity. A tenth of a percent (0.1%) increase in discount rate would result in a decrease of approximately 11% percent in the estimated fair value of the FCC licenses which would cause an impairment.
Changes in management's future business plans or disposition of one or more FCC licenses could result in the requirement to test the FCC licenses for impairment. If any legal, regulatory, contractual, competitive, economic or other factors were to limit the useful lives of our indefinite-lived FCC licenses, we would be required to test these intangible assets for impairment.
For the FCC license impairment test performed as of November 1, 2008, it was determined that the fair value of the FCC licenses was less than its carrying value. Consequently, the carrying value of our FCC licenses was reduced by $54.5 million to $287.5 million at December 31, 2008. For the FCC license impairment test performed as of November 1, 2009, it was determined that the fair value of our FCC licenses was greater than its carrying value. Future impairment evaluations of our FCC licenses could lead to additional material impairment charges. See Note 6, Impairment of FCC Licenses for additional information.
Goodwill—Goodwill is recorded when the price paid for an acquisition exceeds the estimated fair value of the net identified tangible and intangible assets acquired. All of our goodwill related to the merger of First Avenue and Old FiberTower. Goodwill is not amortized but is reviewed for impairment annually or more frequently if impairment indicators arise. In the third and fourth quarters of 2007 and the first quarter of 2008, we identified an indicator of impairment and thereby tested the fair value of our goodwill. This testing resulted in impairment charges totaling $147.9 million in 2007 and $86.1 million in 2008 against the recorded goodwill, reducing the fair value of goodwill to zero. See Note 7, Impairment of Goodwill for additional information.
We estimated the fair value of the reporting unit using both observed market equity values based on our publicly-traded stock price and the income approach, which requires estimates of future operating results and cash flows discounted using an appropriate discount rate.
Asset Retirement Obligations—We recognize liabilities for asset retirement obligations relating to the estimated costs of removing network equipment from our leased co-location sites, as stipulated in the related lease agreements. The asset retirement obligations are recognized in the period in which they are incurred if a reasonable estimate of their fair value can be made. The associated asset retirement costs are capitalized as part of the carrying amount of the related long-lived assets and depreciated on a straight-line basis over their estimated useful life of ten years. We calculate the net present value of the retirement obligation assuming a credit-adjusted, risk-free interest rate of 12%. We also assume the settlement date for removing the network equipment from our leased co-location sites to be ten years from the date the asset is placed into service, which is the expected term of the related leases. We monitor the estimates and assumptions used in determining our asset retirement obligations and adjust them accordingly if deemed necessary.
62
Deferred Taxes—Income taxes are accounted for under an asset and liability approach that requires the recognition of deferred tax assets and liabilities for the expected future tax consequences of events that have been recognized in our consolidated financial statements or tax returns. In estimating future tax consequences, we generally take into account all expected future events then known to us, other than changes in the tax law or rates, which are not permitted to be considered. We record a valuation allowance to reduce net deferred tax assets to the amount that is more likely than not to be realized. The amount of valuation allowance is based on our best estimate of the recoverability of the net deferred tax assets. While future taxable income and ongoing prudent and feasible tax planning are considered in determining the amount of the valuation allowance, the necessity for, and amount of, the allowance is subject to adjustment in the future. Specifically, in the event we were to determine that we would not be able to realize the net deferred tax assets in the future in excess of their net recorded amounts, an adjustment to the net deferred tax assets would decrease income in the period such determination was made. The valuation allowance does not alter our ability to utilize the underlying tax net operating loss carryforwards in the future, the utilization of which is limited to achieving future taxable income. At December 31, 2009, we have a full valuation allowance against our net deferred tax assets.
Leases—Most of our operating lease arrangements represent agreements made with landlords for space leased at our co-location sites. The term of these agreements is typically for five years and we have the unilateral ability and intent to extend the term of these site lease agreements such that the minimum lease periods equal or slightly exceed the estimated ten-year useful lives of the network equipment located at such leased sites. We do not believe there are any explicit or implicit penalties for failure to renew any site leases at the end of the respective assumed lease terms of approximately ten years that would extend the lease term past the assumed lease terms. When lease arrangements have uneven payment schedules, we account for the lease expense on a straight-line basis over the lease term.
Stock-Based Compensation—We recognize stock-based compensation expense on a straight-line basis over the service period of the award, which is generally four years. We use the Black-Scholes-Merton option pricing model to determine the estimated fair value of stock options on the date of grant. The determination of the estimated fair value is affected by our stock price as well as assumptions regarding a number of complex and subjective variables. These variables include our expected stock price volatility over the expected term of the option, actual and expected employee stock option exercise behaviors, risk-free interest rates, estimated forfeitures and expected dividends.
We estimate our expected stock price volatility based on the historical volatility of our stock price. Prior to 2009, such estimate also included consideration of the historical volatilities of similar public companies in the telecommunications industry. We do not have sufficient historical exercise data to provide a reasonable basis upon which to estimate the expected term of the option. Therefore, as permitted by the SEC, we estimate the expected term of the option as the midpoint between the vesting date and the end of the contractual term of the option. The risk-free interest rate for periods within the contractual life of the options is based on the U.S. Treasury yield curve in effect at the time of the grant. We have not and do not anticipate paying any cash dividends on our common stock in the foreseeable future. Our debt covenants also restrict our ability to pay dividends. Consequently, we use an expected dividend yield of zero in the option pricing model.
We are required to estimate forfeitures at the time of award and revise those estimates in subsequent periods if actual forfeitures differ from those estimates. We use historical data to estimate pre-vesting award forfeitures and record stock-based compensation expense only for those awards that are expected to vest.
If we use different assumptions for estimated stock-based compensation expense in future periods or if actual forfeitures differ materially from our estimated forfeitures, the change in our stock-based
63
compensation expense could materially affect our operating expenses, net income (loss) and net income (loss) per share.
See Note 11, Stockholders' Equity and Stock-Based Compensation for additional information regarding option and restricted stock award disclosures.
Recent Accounting Pronouncements—For a description of recent accounting pronouncements, including the expected dates of adoption and estimated effects, if any, on our consolidated financial statements, see Note 2, Basis of Presentation and Accounting Policies.
Related Party Transactions
See Note 14, Related Party Transactions for a description of certain transactions with members of our Board of Directors.
ITEM 7A. QUANTITATIVE AND QUALITATIVE DISCLOSURES ABOUT MARKET RISKS
At December 31, 2009, we had unrestricted cash and cash equivalents of $50.7 million. We believe we have limited exposure to financial market risk, including changes in interest rates because our portfolio is invested in bank deposits and money market mutual funds which invest in U.S. Government securities and have a maturity of less than three months. We believe the fair value of the portfolio or related income will not be significantly impacted by changes in interest rates due mainly to the short-term nature of the portfolio, although future interest income would be impacted by changes in interest rates as well as the amount of funds available to be invested in such securities.
We are adverse to principal loss and intend to ensure the safety and preservation of our invested funds by limiting default and market risk. We intend to continue to invest our cash and cash equivalents in high quality money market funds which invest in securities with original maturities of less than three months.
Our Notes due 2016, with a maturity of January 2016, bear a fixed coupon rate of 9.00%. Our Notes due 2012, with a maturity of November 2012, bear a fixed coupon rate of 9.00% and a total interest yield of 12% per annum. The fair value of the Notes due 2016 and Notes due 2012 is dependent upon a number of factors including future interest rates and the market value of our common stock. These notes are traded in a very thinly traded resale market. We do not hedge our debt obligations or engage in any derivative investments to offset the impact of future changes in the market value of the notes. Future increases in interest rates would decrease the fair value of the notes while decreases in rates would likely have the opposite effect. At December 31, 2009, the estimated fair value of our Notes due 2016 was approximately $94 million and their carrying value was $124.4 million. At December 31, 2009, the estimated fair value of our Notes due 2012 was approximately $24 million and their carrying value was $30.1 million. As there was not sufficient liquidity to establish an active market in the Notes due 2016 and Notes due 2012 at December 31, 2009, the estimate of fair value was determined using a discounted cash flow approach as well as based on bids from market makers.
We have not held derivative financial or commodity instruments in the past and have no current plans to do so in the future. We have not conducted business in foreign currencies in the past and have no current plans to do so in the future.
64
ITEM 8. FINANCIAL STATEMENTS AND SUPPLEMENTARY DATA
Index to Consolidated Financial Statements
| |
Page | ||
|---|---|---|---|
Report of Independent Registered Public Accounting Firm |
66 | ||
Consolidated Financial Statements as of December 31, 2009 and 2008 and for each of the three years in the period ended December 31, 2009: |
|||
Consolidated Balance Sheets |
67 | ||
Consolidated Statements of Operations |
68 | ||
Consolidated Statements of Stockholders' Equity |
69 | ||
Consolidated Statements of Cash Flows |
70 | ||
Notes to Consolidated Financial Statements |
71 | ||
65
Report of Independent Registered Public Accounting Firm
The
Board of Directors and Stockholders
FiberTower Corporation
We have audited the accompanying consolidated balance sheets of FiberTower Corporation as of December 31, 2009 and 2008, and the related consolidated statements of operations, stockholders' equity, and cash flows for each of the three years in the period ended December 31, 2009. These financial statements are the responsibility of the Company's management. Our responsibility is to express an opinion on these financial statements based on our audits.
We conducted our audits in accordance with the standards of the Public Company Accounting Oversight Board (United States). Those standards require that we plan and perform the audit to obtain reasonable assurance about whether the financial statements are free of material misstatement. An audit includes examining, on a test basis, evidence supporting the amounts and disclosures in the financial statements. An audit also includes assessing the accounting principles used and significant estimates made by management, as well as evaluating the overall financial statement presentation. We believe that our audits provide a reasonable basis for our opinion.
In our opinion, the financial statements referred to above present fairly, in all material respects, the consolidated financial position of FiberTower Corporation at December 31, 2009 and 2008, and the consolidated results of its operations and its cash flows for each of the three years in the period ended December 31, 2009, in conformity with U.S. generally accepted accounting principles.
As discussed in Note 13 to the consolidated financial statements, the Company retrospectively changed its method of calculating net income (loss) per share. As discussed in Note 2, the Company changed its method of accounting for uncertain tax position as of January 1, 2007.
We also have audited, in accordance with the standards of the Public Company Accounting Oversight Board (United States), FiberTower Corporation's internal control over financial reporting as of December 31, 2009, based on criteria established in Internal Control—Integrated Framework issued by the Committee of Sponsoring Organizations of the Treadway Commission and our report dated March 12, 2010 expressed an unqualified opinion thereon.
| /s/ ERNST & YOUNG LLP |
San
Francisco, California
March 12, 2010
66
FIBERTOWER CORPORATION
Consolidated Balance Sheets
(In thousands, except par value)
| |
December 31, 2009 | December 31, 2008 | |||||||
|---|---|---|---|---|---|---|---|---|---|
Assets: |
|||||||||
Current assets: |
|||||||||
Cash and cash equivalents |
$ | 50,669 | $ | 154,357 | |||||
Restricted cash and investments, current portion |
3,898 | 343 | |||||||
Accounts receivable, net of allowances of $50 and $37 at December 31, 2009 and 2008, respectively |
6,824 | 6,652 | |||||||
Prepaid expenses and other current assets |
2,119 | 2,502 | |||||||
Total current assets |
63,510 | 163,854 | |||||||
Restricted cash and investments |
7,702 | 134 | |||||||
Property and equipment, net |
221,417 | 236,585 | |||||||
FCC licenses |
287,495 | 287,495 | |||||||
Debt issuance costs, net |
466 | 9,599 | |||||||
Intangible and other long-term assets, net |
3,836 | 3,802 | |||||||
Total assets |
$ | 584,426 | $ | 701,469 | |||||
Liabilities and Stockholders' Equity: |
|||||||||
Current liabilities: |
|||||||||
Accounts payable |
$ | 3,209 | $ | 3,826 | |||||
Accrued compensation and related benefits |
1,769 | 2,052 | |||||||
Accrued interest payable |
465 | 4,628 | |||||||
Other accrued liabilities |
1,138 | 1,984 | |||||||
Current portion of accrued restructuring costs |
1,215 | 1,342 | |||||||
Current portion of obligations under capital lease |
253 | — | |||||||
Total current liabilities |
8,049 | 13,832 | |||||||
Other liabilities |
809 | 1,419 | |||||||
Deferred rent |
7,206 | 6,175 | |||||||
Asset retirement obligations |
4,550 | 4,048 | |||||||
Accrued restructuring costs, net of current portion |
1,560 | 2,436 | |||||||
Obligations under capital lease, net of current portion |
3,471 | — | |||||||
Long-term debt |
154,528 | 430,317 | |||||||
Deferred tax liability |
71,904 | 73,372 | |||||||
Total liabilities |
252,077 | 531,599 | |||||||
Commitments and contingencies |
— | — | |||||||
Stockholders' equity: |
|||||||||
Common stock, $0.001 par value; 400,000 shares authorized, 45,701 and 15,052 shares issued and outstanding at December 31, 2009 and 2008, respectively |
46 | 15 | |||||||
Additional paid-in capital |
958,817 | 794,231 | |||||||
Accumulated deficit |
(626,514 | ) | (624,376 | ) | |||||
Total stockholders' equity |
332,349 | 169,870 | |||||||
Total liabilities and stockholders' equity |
$ | 584,426 | $ | 701,469 | |||||
See accompanying notes.
67
FIBERTOWER CORPORATION
Consolidated Statements of Operations
(In thousands, except per share data)
| |
Year Ended December 31, | |||||||||||
|---|---|---|---|---|---|---|---|---|---|---|---|---|
| |
2009 | 2008 | 2007 | |||||||||
Service revenues |
$ | 63,244 | $ | 49,227 | $ | 27,144 | ||||||
Operating expenses: |
||||||||||||
Cost of service revenues (excluding depreciation |
58,220 | 79,808 | 72,075 | |||||||||
Sales and marketing |
3,262 | 5,456 | 7,906 | |||||||||
General and administrative |
27,834 | 20,237 | 27,026 | |||||||||
Depreciation and amortization |
27,840 | 24,897 | 18,459 | |||||||||
Restructuring charges |
372 | 6,087 | — | |||||||||
Impairment of FCC licenses |
— | 54,505 | — | |||||||||
Impairment of goodwill |
— | 86,093 | 147,893 | |||||||||
Total operating expenses |
117,528 | 277,083 | 273,359 | |||||||||
Loss from operations |
(54,284 | ) | (227,856 | ) | (246,215 | ) | ||||||
Other income (expense): |
||||||||||||
Interest income |
295 | 5,316 | 18,159 | |||||||||
Interest expense |
(47,605 | ) | (47,742 | ) | (44,560 | ) | ||||||
Gain on early extinguishment of debt, net |
98,248 | — | — | |||||||||
Miscellaneous income (expense), net |
(39 | ) | 264 | 469 | ||||||||
Total other income (expense), net |
50,899 | (42,162 | ) | (25,932 | ) | |||||||
Loss before income taxes |
(3,385 | ) | (270,018 | ) | (272,147 | ) | ||||||
Income tax benefit |
1,247 | 20,189 | — | |||||||||
Net loss |
$ | (2,138 | ) | $ | (249,829 | ) | $ | (272,147 | ) | |||
Basic and diluted net loss per share attributable to |
$ | (0.13 | ) | $ | (16.65 | ) | $ | (18.66 | ) | |||
Shares used in computing net loss per share |
15,481 | 14,462 | 14,305 | |||||||||
See accompanying notes.
68
FIBERTOWER CORPORATION
Consolidated Statements of Stockholders' Equity
(In thousands)
| |
Common Stock | |
|
|
|||||||||||||
|---|---|---|---|---|---|---|---|---|---|---|---|---|---|---|---|---|---|
| |
Additional Paid-in Capital |
Accumulated Deficit |
Total Stockholders' Equity |
||||||||||||||
| |
Shares | Amount | |||||||||||||||
Balance at December 31, 2006 |
14,497 | $ | 14 | $ | 776,208 | $ | (102,400 | ) | $ | 673,822 | |||||||
Issuance of common stock upon exercise of stock options |
129 | — | 1,769 | — | 1,769 | ||||||||||||
Awards of restricted shares of common stock, net of cancellations |
(1 | ) | — | — | — | — | |||||||||||
Repurchases of common stock |
(1 | ) | — | — | — | — | |||||||||||
Employee stock-based compensation expense |
— | — | 9,526 | — | 9,526 | ||||||||||||
Net loss |
— | — | — | (272,147 | ) | (272,147 | ) | ||||||||||
Balance at December 31, 2007 |
14,624 | 14 | 787,503 | (374,547 | ) | 412,970 | |||||||||||
Issuance of common stock upon exercise of stock options |
58 | — | 360 | — | 360 | ||||||||||||
Awards of restricted shares of common stock, net of cancellations |
370 | 1 | (1 | ) | — | — | |||||||||||
Employee stock-based compensation expense |
— | — | 6,369 | — | 6,369 | ||||||||||||
Net loss |
— | — | — | (249,829 | ) | (249,829 | ) | ||||||||||
Balance at December 31, 2008 |
15,052 | 15 | 794,231 | (624,376 | ) | 169,870 | |||||||||||
Issuance of common stock upon redemption of Interim Notes |
30,579 | 31 | 156,531 | — | 156,562 | ||||||||||||
Awards of restricted shares of common stock, net of cancellations |
72 | — | — | — | — | ||||||||||||
Repurchases of common stock |
(2 | ) | — | — | — | — | |||||||||||
Employee stock-based compensation expense |
— | — | 8,055 | — | 8,055 | ||||||||||||
Net loss |
— | — | — | (2,138 | ) | (2,138 | ) | ||||||||||
Balance at December 31, 2009 |
45,701 | $ | 46 | $ | 958,817 | $ | (626,514 | ) | $ | 332,349 | |||||||
See accompanying notes.
69
FIBERTOWER CORPORATION
Consolidated Statements of Cash Flows
(In thousands)
| |
Year Ended December 31, | ||||||||||||
|---|---|---|---|---|---|---|---|---|---|---|---|---|---|
| |
2009 | 2008 | 2007 | ||||||||||
Operating activities |
|||||||||||||
Net loss |
$ | (2,138 | ) | $ | (249,829 | ) | $ | (272,147 | ) | ||||
Adjustments to reconcile net loss to net cash used in operating activities: |
|||||||||||||
Depreciation and amortization |
27,840 | 24,897 | 18,459 | ||||||||||
Gain on early extinguishment of debt, net |
(98,248 | ) | — | — | |||||||||
Non-cash payment-in-kind of interest |
33,529 | — | — | ||||||||||
Decline in value of embedded derivative |
— | — | (634 | ) | |||||||||
Accretion of convertible notes |
15,572 | 14,539 | 12,653 | ||||||||||
Accretion of investments in debt securities |
— | (917 | ) | (1,791 | ) | ||||||||
Accretion of asset retirement obligations |
501 | 440 | 327 | ||||||||||
Amortization of debt issuance costs |
1,365 | 2,256 | 2,154 | ||||||||||
Stock-based compensation |
8,016 | 6,274 | 9,150 | ||||||||||
Loss on disposal of equipment |
254 | 68 | 746 | ||||||||||
Impairment of long-lived assets and other charges |
270 | 16,439 | 17,561 | ||||||||||
Restructuring charges |
372 | 4,046 | — | ||||||||||
Impairment of FCC licenses |
— | 54,505 | — | ||||||||||
Impairment of goodwill |
— | 86,093 | 147,893 | ||||||||||
Income tax benefit |
(1,247 | ) | (20,189 | ) | — | ||||||||
Net changes in operating assets and liabilities: |
|||||||||||||
Accounts receivable, net |
(172 | ) | (2,968 | ) | (780 | ) | |||||||
Prepaid expenses and other current assets |
383 | (662 | ) | 784 | |||||||||
Other long-term assets |
(333 | ) | (127 | ) | (284 | ) | |||||||
Accounts payable |
(617 | ) | (9,846 | ) | (4,367 | ) | |||||||
Accrued compensation and related benefits |
(283 | ) | (1,317 | ) | (877 | ) | |||||||
Accrued interest payable |
(4,163 | ) | (1 | ) | (704 | ) | |||||||
Other accrued liabilities |
559 | 1,342 | 2,933 | ||||||||||
Net cash (used) in operating activities |
(18,540 | ) | (74,957 | ) | (68,924 | ) | |||||||
Investing activities |
|||||||||||||
Purchases of short-term investments |
— | — | (75,603 | ) | |||||||||
Maturities of short-term investments |
— | — | 91,191 | ||||||||||
Maturities of certificates of deposit |
— | 5,000 | — | ||||||||||
Maturities of restricted cash and investments |
— | 37,419 | 35,000 | ||||||||||
Increase in restricted cash and investments |
(11,123 | ) | — | — | |||||||||
Deposit under capital lease obligation |
(500 | ) | — | — | |||||||||
Purchase of property and equipment |
(8,632 | ) | (36,795 | ) | (105,277 | ) | |||||||
Net cash (used) provided in investing activities |
(20,255 | ) | 5,624 | (54,689 | ) | ||||||||
Financing activities |
|||||||||||||
Cash paid for repurchases of Notes due 2012 |
(52,180 | ) | — | — | |||||||||
Cash paid upon redemption of Interim Notes |
(12,713 | ) | — | — | |||||||||
Proceeds from exercise of stock options |
— | 360 | 1,769 | ||||||||||
Cash (used) provided in financing activities |
(64,893 | ) | 360 | 1,769 | |||||||||
Net decrease in cash and cash equivalents |
(103,688 | ) | (68,973 | ) | (121,844 | ) | |||||||
Cash and cash equivalents at beginning of year |
154,357 | 223,330 | 345,174 | ||||||||||
Cash and cash equivalents at end of year |
$ | 50,669 | $ | 154,357 | $ | 223,330 | |||||||
Supplemental Disclosures |
|||||||||||||
Cash paid for interest |
$ | 1,974 | $ | 36,241 | $ | 36,872 | |||||||
Non-cash financing activities: |
|||||||||||||
Acquisition of property and equipment by capital lease |
$ | 3,724 | $ | — | $ | — | |||||||
Exchange Offer and redemption of debt: |
|||||||||||||
Common stock issued to holders of Interim Notes |
$ | 156,562 | $ | — | $ | — | |||||||
Debt issuance costs written off |
$ | 4,616 | $ | — | $ | — | |||||||
Accrued interest payable on Interim Notes |
$ | (2,468 | ) | $ | — | $ | — | ||||||
See accompanying notes.
70
FIBERTOWER CORPORATION
Notes to Consolidated Financial Statements
Note 1—Organization and Business
Organization and operations—FiberTower Corporation (referred to as FiberTower in these financial statements) was incorporated in 1993 in the State of Delaware to build and operate a shared high-coverage, high-capacity backhaul network for wireless operators and service providers in the United States.
We are a leading alternative provider of facilities-based backhaul services to wireless carriers. Facilities-based providers own or lease a substantial portion of the property and equipment necessary to provide backhaul services. Backhaul is the transport of voice, video and data traffic from a wireless carrier's mobile base station, or cell site, to its mobile switching center or other exchange point where the traffic is then switched onto a wireline telecommunications network. We provide backhaul services nationally by utilizing our wireless spectrum assets and fiber relationships to construct and operate high-coverage, high-capacity hybrid microwave and fiber networks. Our services provide wireless carriers a long-term solution for their increasing demand for backhaul capacity while giving them increased availability and reliability.
We have incurred net losses and negative cash flows from operating and investing activities since our inception, and we had an accumulated deficit of $626.5 million at December 31, 2009. Through December 31, 2009, we have relied primarily on equity and debt financings to fund our operating and investing activities. Failure to generate sufficient revenue could have a material adverse effect on our results of operations, financial condition and cash flows. The recoverability of assets is highly dependent on the ability of management to execute its business plan which is subject to a number of risks including, but not limited to, dependence on key employees, dependence on key customers and suppliers, potential competition from larger, more established companies, the ability to develop and bring new services or products to market (including expansion of our network), the ability to attract and retain additional qualified personnel and the ability to obtain adequate financing to support our planned growth.
Exchange Offer and Redemption of Debt—On October 26, 2009, we initiated an offer to exchange, which we refer to as the "Exchange Offer," any and all of our existing 9.00% Convertible Senior Secured Notes Due 2012 ("Notes due 2012") for 9.00% Mandatorily Redeemable Convertible Senior Secured Notes Due 2012 (the "Interim Notes"). The Interim Notes were mandatorily redeemable by us at a redemption price per $1,000 principal amount of Interim Notes equal to:
- •
- 114.616 shares of our common stock (on a post-reverse stock split basis—see Note 2, Basis
of Presentation and Accounting Policies);
- •
- $47.65 in cash; and
- •
- $425.46 in principal amount of our 9.00% Senior Secured Notes Due 2016 ("Notes due 2016").
We refer to the mandatory redemption of the Interim Notes as the "Mandatory Redemption."
Upon the expiration of the Exchange Offer on December 1, 2009, we had received tenders of $266.8 million principal amount of the Notes due 2012, representing approximately 90.8% of the outstanding Notes due 2012. In connection with the consummation of the Exchange Offer on December 7, 2009, we accepted such tendered Notes due 2012 and issued $266.8 million in principal amount of the Interim Notes.
71
FIBERTOWER CORPORATION
Notes to Consolidated Financial Statements (Continued)
Note 1—Organization and Business (Continued)
On December 15, 2009, our stockholders approved the issuance of shares of common stock to be issued in the Mandatory Redemption. In order to provide a sufficient number of authorized shares of common stock for the issuance of shares in the Mandatory Redemption, on December 18, 2009, we effected a 1-for-10 reverse stock split of our common stock, the authority of which was previously granted to our Board of Directors by our stockholders.
On December 22, 2009, we completed the Mandatory Redemption, whereby $266.8 million of the Interim Notes were exchanged in consideration for the following:
- •
- 30,578,567 shares of common stock (on a post-reverse stock split basis), representing approximately 67% of our
outstanding shares on a fully diluted basis, with a fair value upon issuance of $156.6 million;
- •
- approximately $12.7 million in cash; and
- •
- approximately $113.5 million in principal amount of Notes due 2016.
The purpose of the Exchange Offer and Mandatory Redemption transactions was to reduce our outstanding debt and cash interest requirements and extend the maturity of our outstanding debt. As a result of the Exchange Offer and Mandatory Redemption, the total carrying value of our outstanding debt was reduced by $171.7 million, the maturity of a substantial portion of our debt was extended from 2012 to 2016 and our annual cash interest payments were reduced by more than $20.0 million to approximately $6.0 million.
See Note 8, Long-term Debt, for additional information on the Exchange Offer and Mandatory Redemption and the accounting for such.
First Avenue/FiberTower merger transaction—On August 29, 2006, FiberTower Network Services Corp. (formerly known as FiberTower Corporation and referred to in these financial statements as Old FiberTower) and First Avenue completed a merger. Immediately following the completion of the merger, the stockholders and option holders of Old FiberTower owned approximately 51%, on a fully diluted basis, of the outstanding shares of First Avenue. The merger of First Avenue and Old FiberTower was accounted for as a reverse acquisition of First Avenue by Old FiberTower under the purchase method of accounting because Old FiberTower's stockholders owned a majority of the shares, on a fully diluted basis, of the combined company following the merger.
Note 2—Basis of Presentation and Accounting Policies
Principles of consolidation and basis of presentation—These consolidated financial statements include all of the assets, liabilities and results of operations of FiberTower and our subsidiaries, all of which are wholly owned. All intercompany transactions and balances have been eliminated.
Reverse stock split—As described in Note 1 above, on December 18, 2009, we effected a 1-for-10 reverse stock split of our common stock. Accordingly, the accompanying consolidated financial statements for all periods presented have been retroactively restated to reflect the effect of the reverse stock split.
Use of estimates—The preparation of financial statements in conformity with U.S. Generally Accepted Accounting Principles requires management to make estimates and assumptions that affect the amounts reported in the financial statements and notes. Actual results could differ materially from
72
FIBERTOWER CORPORATION
Notes to Consolidated Financial Statements (Continued)
Note 2—Basis of Presentation and Accounting Policies (Continued)
those estimates. Our critical accounting estimates include (i) useful life assignments and impairment evaluations associated with long-lived assets, including intangible assets, (ii) revenue recognition, (iii) asset retirement obligations, (iv) valuation of stock-based awards, and (v) establishment of valuation allowances associated with deferred tax assets.
Cash equivalents—We consider short-term, highly liquid investments with original maturities of three months or less to be cash equivalents. We classify all cash equivalents as available-for-sale at the time of purchase, and re-evaluate such designation at each balance sheet date. Cash equivalents are stated at their cost adjusted for accretion of discounts and amortization of premiums when applicable. Such adjusted cost approximates the fair market values of our cash equivalents at December 31, 2009 and 2008. Unrealized gains and losses on available-for-sale securities were insignificant at December 31, 2009 and 2008. Our cash equivalents consisted of money market mutual funds which invest in U.S. Government securities of $42.5 million at December 31, 2009 and $147.2 million at December 31, 2008.
Restricted cash and investments—We had total restricted cash and investments of $11.6 million at December 31, 2009 and $0.5 million at December 31, 2008. The balance at December 31, 2009 consists of i) $11.0 million invested in cash and bonds issued by U.S. Government agencies to be used for the payment of the first six semi-annual cash interest payments for the Notes due 2016 and ii) $0.6 million of certificates of deposit which collateralize letters of credit, the final expiration date of which is November 2010. Restricted investments with maturity dates in 2010 of $3.6 million at December 31, 2009 are classified as current assets and relate to interest payments to be made in 2010 on the Notes due 2016. The bonds issued by U.S. Government agencies are classified as held-to-maturity and are reported at amortized cost. Accretion of discounts and amortization of premiums on restricted investments are included in interest income. Gross unrealized losses on these bonds issued by U.S. Government agencies, which relate to changes in market interest rates, were $0.1 million at December 31, 2009. Restricted cash and investments at December 31, 2008 consisted only of certificates of deposit which collateralized letters of credit.
During 2008, our restricted cash and investments were reduced by $36.5 million, reflecting our semi-annual interest payments in May and November 2008 on the Notes due 2012. See Note 8, Long-term Debt, for additional information. Also during 2008, $1.1 million of restricted cash related to a supplier service agreement, was released.
Fair value measurements of financial and non-financial assets and liabilities —The estimated fair values of our financial instruments, consisting of cash and cash equivalents, restricted cash and investments, accounts receivable and accounts payable approximated their respective carrying values as of December 31, 2009 and 2008. See Note 9, Fair Value Disclosures, for information and related disclosures regarding our fair value measurements of cash and cash equivalents, Notes due 2016 and Notes due 2012 at December 31, 2009 and December 31, 2008.
Revenue and expense recognition—We recognize revenues when (i) persuasive evidence of an arrangement exists, (ii) the services have been provided to the customer, (iii) the sales price is fixed or determinable and (iv) the collection of the sales price is reasonably assured. Amounts billed in advance of providing service are recorded as deferred revenues. There were $0.1 million of deferred revenues at December 31, 2009 and $0.2 million at December 31, 2008.
73
FIBERTOWER CORPORATION
Notes to Consolidated Financial Statements (Continued)
Note 2—Basis of Presentation and Accounting Policies (Continued)
Incremental direct costs of service activation are charged to expense as incurred. We purchase electricity and lease co-location site space from certain of our customers. We receive an identifiable benefit in exchange for the amounts paid to our customers and we can reasonably estimate the fair value of the purchased electricity and leased tower site space. Therefore, we record the fair value of the consideration paid as cost of service revenues as incurred and any excess of consideration paid over the fair value, such as customer incentives, as a reduction of service revenues.
Concentrations of credit risk, significant customers and key suppliers—Financial instruments that potentially subject us to concentrations of credit risk consist primarily of cash and cash equivalents, restricted cash and investments and accounts receivable. Cash and cash equivalents and restricted cash and investments consist principally of demand deposits and money market mutual funds which invest in U.S. Government securities and restricted investments which consist of bonds issued by U.S. Government agencies. These are held primarily by two domestic financial institutions with a high credit standing.
For the years ended December 31, 2009, 2008 and 2007, the following customers accounted for a significant portion of our revenues, as follows:
| |
Year Ended December 31, | |||||||||
|---|---|---|---|---|---|---|---|---|---|---|
| |
2009 | 2008 | 2007 | |||||||
AT&T Mobility |
39 | % | 40 | % | 57 | % | ||||
Sprint Nextel |
20 | % | 33 | %(1) | 19 | % | ||||
Clearwire |
15 | % | — | (1) | — | |||||
T-Mobile |
15 | % | 15 | % | 13 | % | ||||
- (1)
- In December 2008, Clearwire Corporation completed a transaction with Sprint Nextel and an investor group to launch a new WiMAX-based wireless services provider. As a result of this transaction, a portion of the circuits previously billed to Sprint Nextel have been transferred to Clearwire. If this transaction had occurred on January 1, 2008, approximately 14% of our 2008 revenues would have been attributed to Clearwire and approximately 19% would have been attributed to Sprint Nextel.
Accounts receivable from these customers comprised the following percentages of our total accounts receivable balances at December 31, 2009 and 2008:
| |
December 31, | ||||||
|---|---|---|---|---|---|---|---|
| |
2009 | 2008 | |||||
AT&T Mobility |
37 | % | 27 | % | |||
Sprint Nextel |
17 | % | 52 | % | |||
Clearwire |
17 | % | — | ||||
T-Mobile |
16 | % | 12 | % | |||
We are dependent on a limited number of suppliers for certain equipment used to provide our services. We have generally been able to obtain an adequate supply of such equipment. However, an extended interruption in the supply of equipment currently obtained from our suppliers could adversely affect our business and results of operations.
74
FIBERTOWER CORPORATION
Notes to Consolidated Financial Statements (Continued)
Note 2—Basis of Presentation and Accounting Policies (Continued)
Property and equipment—Property and equipment are stated at cost less accumulated depreciation and amortization. Depreciation and amortization are calculated using the straight-line method. Leasehold improvements are amortized over the shorter of the lease term or their estimated useful lives. Estimated useful lives are as follows:
• Indefeasible right of use of fiber |
20 years | |
• Network equipment |
10 years |
|
• Computer software |
5 years |
|
• Office equipment and other |
3 - 7 years |
We capitalize costs incurred in bringing our network equipment to an operational state. Costs directly associated with the acquisition, construction and installation of network equipment are capitalized as a cost of that equipment. Construction and installation costs that relate to several sites are capitalized and allocated to the respective network equipment to which the costs relate. Network equipment and construction-in-progress included capitalized internal labor costs of $0.5 million in 2009, $1.2 million in 2008 and $5.7 million in 2007.
Interest is capitalized on network equipment and construction-in-progress based on the effective interest rate on our borrowings and the average amount of accumulated expenditures for assets under construction during the period. Network equipment and construction-in-progress included capitalized interest of $3.3 million in 2009, $5.3 million in 2008 and $6.4 million in 2007.
We capitalize certain costs related to software developed or obtained. Capitalized software development costs totaled $0.4 million in 2009, $2.0 million in 2008 and $0.2 million in 2007.
Property and equipment are evaluated for impairment whenever events or changes in circumstances indicate that the carrying value may not be recoverable. An impairment loss is recognized whenever (i) the estimated undiscounted future cash flows expected to result from the use of the asset plus net proceeds expected from disposition of the asset, if any, are less than the carrying value of the asset and (ii) the fair value of the asset is less than its carrying value. When an impairment loss is identified, the carrying value of the asset is reduced to its fair value. Such impairment losses were identified in 2009, 2008 and 2007. See Note 5, Impairment of Long-Lived Assets and Other Charges for additional information.
Leases—Most of our operating lease arrangements represent agreements made with landlords for space leased at our co-location sites. The term of these agreements is typically for five years and we have the unilateral ability and intent to extend the term of these site lease agreements such that the minimum lease periods equal or slightly exceed the estimated ten-year useful lives of the network equipment located at such leased sites. We do not believe there are any explicit or implicit penalties for failure to renew any site leases at the end of the respective assumed lease terms of approximately ten years that would extend the lease term past the assumed lease terms. When lease arrangements have uneven payment schedules, we account for the lease expense on a straight-line basis over the lease term.
Asset retirement obligations—We recognize liabilities for asset retirement obligations relating to the estimated costs of removing network equipment from our leased co-location sites, as stipulated in the
75
FIBERTOWER CORPORATION
Notes to Consolidated Financial Statements (Continued)
Note 2—Basis of Presentation and Accounting Policies (Continued)
related lease agreements. The asset retirement obligations are recognized in the period in which they are incurred if a reasonable estimate of the fair value of the estimated costs to retire the asset can be made. Estimated liabilities are increased over time to reflect changes in present value. The associated asset retirement costs are capitalized as part of the carrying amount of the related long-lived assets and depreciated on a straight-line basis over their estimated useful life of ten years.
A summary of the asset retirement obligations activity is as follows (in thousands):
| |
Year Ended December 31, | ||||||
|---|---|---|---|---|---|---|---|
| |
2009 | 2008 | |||||
Asset retirement obligations at beginning of year |
$ | 4,048 | $ | 3,311 | |||
Liabilities incurred in the current year |
10 | 297 | |||||
Liabilities settled in the current year |
(9 | ) | — | ||||
Accretion expense |
501 | 440 | |||||
Asset retirement obligations at end of year |
$ | 4,550 | $ | 4,048 | |||
Intangible assets—Our intangible assets with indefinite lives consist of Federal Communications Commission ("FCC") licenses, which are not amortized but are tested annually for impairment (or more frequently for impairment if indicators of impairment arise). Our intangible assets that have finite lives, which consist of customer relationships, are amortized using the straight-line method over their estimated useful life of 10 years.
As described more fully below, we evaluate our intangible assets with indefinite lives for impairment annually, and between annual evaluations if events or changes in circumstances indicate that the carrying amount of such assets may not be fully recoverable. In cases where required, an impairment provision is recognized in an amount by which the carrying value exceeds the estimated fair value of such assets.
FCC licenses—Recoverability of the carrying value of our FCC licenses is dependent on numerous factors, including successful deployment of networks and radio links or sales of such assets to a third party. We consider the FCC licenses to have an indefinite useful life based on the following factors:
- •
- FCC spectrum is a non-depleting asset;
- •
- The licenses are integral to the business and we expect them to contribute to cash flows indefinitely;
- •
- License renewal applications are generally authorized by the FCC subject to certain conditions, without substantial cost
under a stable regulatory, legislative and legal environment. See Note 15, Guarantees and Other Contingencies for additional information on the FCC license renewal requirements and discussion
of license renewals and extensions received;
- •
- Maintenance expenditures required to obtain future cash flows are not significant; and
- •
- We intend to use these assets for the foreseeable future.
76
FIBERTOWER CORPORATION
Notes to Consolidated Financial Statements (Continued)
Note 2—Basis of Presentation and Accounting Policies (Continued)
We use a direct method of valuation for our indefinite-lived intangible assets. Specifically, we use an income-based approach, the Greenfield Methodology (a form of discounted cash flow model), using a hypothetical start-up operation. This methodology is based on the cash flow generation potential of a hypothetical start-up operation and assumes that the only assets upon formation are the underlying FCC licenses, and that the business enterprise does not have any other assets including goodwill or going concern value at the date of inception. The start-up assumptions include utilization of the asset in the best possible use and incorporate marketplace participant assumptions for key factors such as unit prices, market density and operating expenses.
Cash flow projections and assumptions, although subject to a degree of uncertainty, are based on a combination of our historical performance and trends, our business plans and management's estimates of future performance, giving consideration to existing and anticipated competitive and economic conditions. Our key operating assumptions include unit prices, services offered, market size, operating expenses, income taxes, capital expenditures and working capital requirements. We believe that our estimates are consistent with assumptions that marketplace participants would use to estimate fair value. Any impairment loss would be recorded as a reduction in the carrying value of the FCC licenses and charged to results of operations. If actual results are not consistent with our assumptions and estimates, we may be required to record an impairment charge associated with indefinite-lived intangible assets. Although we currently do not expect our estimates or assumptions to change significantly in the future, the use of different estimates or assumptions within our discounted cash flow model when determining the fair value of our FCC licenses or using a methodology other than a discounted cash flow model could result in different values for our FCC licenses and may affect conclusions about impairment.
The most significant assumptions within our discounted cash flow model are the discount rate, our projected growth rate, costs to build and operate the network and management's future business plans. During our FCC license impairment test, we considered our facts and circumstances, the marketplace in which we compete as well as activity in the broader macroeconomic environment. These considerations led us to increase the amount of initial bandwidth sold per customer to reflect the growing trend in our industry of greater backhaul needs to support next generation wireless networks but lowered the initial price. This had the impact of providing us lower revenue in the early years of the plan, but increased revenue in the later years to reflect carriers buying at lower marginal prices in the future but utilizing greater capacity. Additionally, we raised our discount rate which was derived by analyzing the change in risk premiums in the wireless communications industry affecting a marketplace participant's cost of debt and cost of equity. A tenth of a percent (0.1%) increase in discount rate would result in a decrease of approximately 11% percent in the estimated fair value of the FCC licenses which would cause an impairment.
Changes in management's future business plans or disposition of one or more FCC licenses could result in the requirement to test the FCC licenses for impairment. If any legal, regulatory, contractual, competitive, economic or other factors were to limit the useful lives of our indefinite-lived FCC licenses, we would be required to test these intangible assets for impairment.
See Note 6, Impairment of FCC Licenses for additional information including discussion of the $54.5 million impairment charge recorded in 2008.
Goodwill—Goodwill is recorded when the price paid for an acquisition exceeds the estimated fair value of the net identified tangible and intangible assets acquired. All of our goodwill related to the merger of First Avenue and Old FiberTower. We recorded goodwill impairment charges of
77
FIBERTOWER CORPORATION
Notes to Consolidated Financial Statements (Continued)
Note 2—Basis of Presentation and Accounting Policies (Continued)
$86.1 million in 2008 and $147.9 million in 2007 that reduced the carrying value to zero. In performing our impairment evaluations, we compared the fair value of our single reporting unit to its carrying value. We estimated the fair value of the reporting unit using both observed market equity values based on our publicly-traded stock price and the income approach, which requires estimates of future operating results and cash flows discounted using an appropriate discount rate. See Note 7, Impairment of Goodwill for additional information.
Customer relationship intangible asset—The recoverability of the carrying value of our customer relationship intangible asset, which is related to the merger of First Avenue and Old FiberTower, is dependent on numerous factors including continued generation of revenues from First Avenue's customers. We periodically evaluate whether the value of our customer relationship intangible asset has been impaired and have determined there to be no impairments during the three years ended December 31, 2009. Amortization totaled $0.3 million in each of 2009, 2008 and 2007.
Debt issuance costs—Debt issuance costs consist of investment banking fees, legal and accounting fees and printing costs incurred in connection with the sale of our Notes due 2012 in November 2006. They are being amortized as additional interest expense over the six-year term of the Notes due 2012 using the effective interest method. The fees and expenses related to the Exchange Offer and Mandatory Redemption were expensed as incurred. See Note 8, Long-term Debt for additional information.
Stock-based compensation—We recognize stock-based compensation expense on a straight-line basis over the service period of the award, which is generally four years. We use the Black-Scholes-Merton option pricing model to determine the estimated fair value of stock options on the date of grant. The determination of the estimated fair value is affected by our stock price as well as assumptions regarding a number of complex and subjective variables. These variables include our expected stock price volatility over the expected term of the option, actual and expected employee stock option exercise behaviors, risk-free interest rates, estimated forfeitures and expected dividends.
We estimate our expected stock price volatility based on the historical volatility of our stock price. Prior to 2009, such estimate also included consideration of the historical volatilities of similar public companies in the telecommunications industry. We do not have sufficient historical exercise data to provide a reasonable basis upon which to estimate the expected term of the option. Therefore, as permitted by the SEC, we estimate the expected term of the option as the midpoint between the vesting date and the end of the contractual term of the option. The risk-free interest rate for periods within the contractual life of the options is based on the U.S. Treasury yield curve in effect at the time of the grant. We have not and do not anticipate paying any cash dividends on our common stock in the foreseeable future. Our debt covenants also restrict our ability to pay dividends. Consequently, we use an expected dividend yield of zero in the option pricing model. See Note 11, Stockholders' Equity and Stock-Based Compensation for a summary of the assumptions used to estimate the fair value of options granted.
We are required to estimate forfeitures at the time of award and revise those estimates in subsequent periods if actual forfeitures differ from those estimates. We use historical data to estimate pre-vesting award forfeitures and record stock-based compensation expense only for those awards that are expected to vest.
Income taxes—We use the liability method to account for income taxes. Under this method, deferred tax assets and liabilities are determined based on differences between the financial reporting
78
FIBERTOWER CORPORATION
Notes to Consolidated Financial Statements (Continued)
Note 2—Basis of Presentation and Accounting Policies (Continued)
and tax bases of assets and liabilities. Deferred tax assets and liabilities are measured using enacted tax rates and laws that will be in effect when the differences are expected to reverse. Valuation allowances are established when necessary to reduce deferred tax assets to the amounts expected to be realized. See Note 12, Income Taxes for additional information.
We adopted the provisions of ASC 740-10, Accounting for Uncertainty in Income Taxes, on January 1, 2007.
Segment reporting—We operate in one business segment.
Recent accounting pronouncements—In June 2009, the FASB issued Accounting Standards Update No. 2009-01, Generally Accepted Accounting Principles (ASC 105), which establishes the Accounting Standards Codification (the Codification or ASC) as the single source of authoritative non-governmental U.S. GAAP. The Codification supersedes existing FASB, American Institute of Certified Public Accountants (AICPA), Emerging Issues Task Force (EITF), and related literature. The Codification establishes one level of authoritative GAAP. All other literature is considered non-authoritative. The Codification was effective for interim and annual reporting periods ending after September 15, 2009 and has therefore been adopted by us in the third quarter of 2009. The adoption of this standard did not have an impact on our consolidated financial statements.
On January 1, 2009, we adopted ASC 260-10-45 to 65, Determining Whether Instruments Granted in Share-Based Payment Transactions Are Participating Securities, which states that unvested share-based payment awards that contain non-forfeitable rights to dividends or dividend equivalents are considered participating securities and are to be included in the computation of net income (loss) per share pursuant to the two-class method described in ASC 260-10, Earnings Per Share. Our unvested restricted shares outstanding are such a participating security. Therefore, as required by this guidance, prior period net loss per share data has been adjusted retrospectively. The effect of the adoption of this guidance was not material to our net loss per share.
In March 2008, the FASB issued ASC 815-10-65-1, Disclosures about Derivative Instruments and Hedging Activities, which requires enhanced disclosures about (a) how and why an entity uses derivative instruments, (b) how derivative instruments and related hedged items are accounted for under ASC 815-10, Accounting for Derivative Instruments and Hedging Activities, and its related interpretations, and (c) how derivative instruments and related hedged items affect an entity's financial position, financial performance and cash flows. The Standard was effective for us beginning in the first quarter of 2009 and did not have an impact on our consolidated financial statements. See Note 8, Long-term Debt for information on the derivative associated with our Notes due 2012 and Note 9, Fair Value Disclosures, for its fair value.
In June 2008, the FASB reached a consensus on ASC 815-40, Determining Whether an Instrument (or Embedded Feature) is Indexed to an Entity's Own Stock, which provided guidance for determining whether an equity-linked financial instrument, or embedded feature, is indexed to an entity's own stock. This determination is necessary for evaluating whether the instrument or feature is considered a derivative financial instrument. The consensus was effective for us beginning in the first quarter of 2009 and did not have an impact on our consolidated financial statements.
In September 2006, the FASB issued ASC 820-10, Fair Value Measurements, which established specific criteria for the fair value measurements of financial and non-financial assets and liabilities. The fair value criteria were primarily applied prospectively upon adoption of the Standard, which was effective for us beginning in the first quarter of 2008. In February 2008, the FASB approved a one-year
79
FIBERTOWER CORPORATION
Notes to Consolidated Financial Statements (Continued)
Note 2—Basis of Presentation and Accounting Policies (Continued)
delay in applying the Standard to certain fair value measurements, primarily related to non-financial assets and liabilities such as those resulting from business combinations, acquired goodwill and intangibles, long-lived assets held for disposal and liabilities related to exit or disposal activities. There was no impact on our consolidated financial statements of applying the Standard to the assets and liabilities to which the one-year delay in implementation was applied.
In April 2009, the FASB issued three related FASB Staff Positions: (a) ASC 320-10-65-1, Recognition and Presentation of Other-Than-Temporary Impairments, which amend the other-than-temporary impairment guidance for debt securities to modify the requirement for recognizing other-than-temporary impairments, (b) ASC 825-10-65-1, Interim Disclosures about Fair Value of Financial Instruments, which modify the presentation and frequency of related disclosures and (c) ASC 820-10-65-4, Determining the Fair Value When the Volume and Level of Activity for the Asset or Liability Have Significantly Decreased and Identifying Transactions That Are Not Orderly which change the existing impairment model. These Staff Positions also require disclosures about fair value of financial instruments for interim reporting periods as well as in annual financial statements and provides additional guidance for estimating fair value. These Staff Positions were effective for us beginning in the second quarter of 2009. The only impact on our consolidated financial statements was to require the disclosure of the fair value of our debt at interim reporting dates.
In August 2009, the FASB issued ASC Update No. 2009-05, "Measuring Liabilities at Fair Value" (ASC 820), which clarifies that in circumstances in which a quoted price in an active market for the identical liability is not available, we are required to use the quoted price of the identical liability when traded as an asset, quoted prices for similar liabilities, or quoted prices for similar liabilities when traded as assets. If these quoted prices are not available, we are required to use another valuation technique, such as an income approach or a market approach. These amended standards were effective for us beginning in the fourth quarter of 2009 and did not have an impact on our consolidated financial statements.
Note 3—Property and Equipment
Property and equipment consisted of the following (in thousands):
| |
December 31, | ||||||
|---|---|---|---|---|---|---|---|
| |
2009 | 2008 | |||||
Network equipment |
$ | 259,692 | $ | 249,238 | |||
Network equipment under capital lease |
4,224 | — | |||||
Computer software |
5,167 | 4,767 | |||||
Office equipment and other |
2,791 | 2,907 | |||||
|
271,874 | 256,912 | |||||
Less: accumulated depreciation and amortization |
83,195 | 56,203 | |||||
Property and equipment in-service, net |
188,679 | 200,709 | |||||
Construction-in-progress |
32,738 | 35,876 | |||||
Property and equipment, net |
$ | 221,417 | $ | 236,585 | |||
See discussion in Note 10, Leasing Arrangements regarding the network equipment under capital lease.
80
FIBERTOWER CORPORATION
Notes to Consolidated Financial Statements (Continued)
Note 3—Property and Equipment (Continued)
Assets classified as construction-in-progress are not being depreciated as they have not yet been placed in service. Depreciation expense was $27.5 million in 2009, $24.6 million in 2008 and $18.2 million in 2007.
See discussion in Note 5, Impairment of Long-Lived Assets and Other Charges regarding impairment charges recorded in 2009, 2008 and 2007 related to property and equipment.
Note 4—Restructuring Charges
During 2009, we recorded restructuring charges of $0.4 million representing accretion of the liability for operating leases established in 2008. During 2008, we recorded restructuring charges of $6.1 million. The restructuring charges are a result of our decision during the second quarter of 2008 to restructure our operations to reflect changes in our strategic plans designed to reduce costs. The resultant restructuring charges reflected i) our decision to cease market development activities in the Carolinas market resulting in an exit plan for our site operating leases, ii) termination benefits under a workforce reduction of 59 employees consistent with revisions to our network deployment plan and iii) the consequent termination or renegotiation of excess office space including the former headquarters in New Jersey.
The accounting for our exit plan for operating leases requires that a liability for costs associated with an exit or disposal activity be recognized when the liability is incurred. The restructuring charges are included in operating expenses in the Consolidated Statements of Operations and are summarized as follows (in thousands):
| |
Operating Leases |
Workforce Reduction |
Total | |||||||
|---|---|---|---|---|---|---|---|---|---|---|
Balance at December 31, 2007 |
$ | — | $ | — | $ | — | ||||
Restructuring charges |
4,462 | 1,625 | 6,087 | |||||||
Cash payments |
(790 | ) | (1,519 | ) | (2,309 | ) | ||||
Balance at December 31, 2008 |
3,672 | 106 | 3,778 | |||||||
Restructuring charges |
372 | — | 372 | |||||||
Cash payments |
(1,269 | ) | (106 | ) | (1,375 | ) | ||||
Balance at December 31, 2009 |
$ | 2,775 | $ | — | $ | 2,775 | ||||
The accrued restructuring costs associated with the contract terminations of the operating leases are expected to be paid over the remaining lease term, which generally approximates three years, or shorter period as payoff arrangements are concluded.
Note 5—Impairment of Long-Lived Assets and Other Charges
Construction of our network is a complex process involving the interaction and assembly of multiple components that result in internal labor, third party and equipment costs. We regularly assess the recoverability of costs accumulated in construction-in-progress as we execute our network build-out plans. In 2009, we recorded impairment charges of $0.3 million and in 2008 we recorded impairment charges of $16.4 million related to this process. In 2007, we conducted a re-design and implementation of enhanced internal controls associated with property and equipment that was completed in the fourth quarter of 2007. As a result of this effort and our normal process to assess asset recoverability, we recorded impairment charges of $13.0 million in 2007 to reduce network equipment and construction-in-progress to net realizable value. These impairment charges are included in cost of service revenues.
81
FIBERTOWER CORPORATION
Notes to Consolidated Financial Statements (Continued)
Note 5—Impairment of Long-Lived Assets and Other Charges (Continued)
Also, during 2007, we suspended development activities in the Carolinas market where we had not yet generated billing customers. Third-party project management fees and construction costs, capitalized as construction-in-progress, had an aggregate net carrying value of $4.4 million and had no alternative use or salvage value. Therefore, we considered these long-lived assets to be impaired. In connection with the suspension of development activities in this market, we paid contract termination costs and one-time termination benefits totaling $0.2 million. The resultant long-lived asset impairment charges of $4.6 million are included in cost of service revenues for 2007.
The impairment of long-lived assets and other charges are included in cost of service revenues in the Consolidated Statements of Operations.
Note 6—Impairment of FCC Licenses
At December 31, 2007 and through September 30, 2008, the Company's FCC Licenses had a carrying value of $342.0 million which was based on a valuation of First Avenue's assets that was prepared in connection with the First Avenue/FiberTower merger. As discussed in Note 2, Summary of Significant Accounting Policies, we consider the FCC licenses to have an indefinite useful life. Note 2 also includes a discussion of our valuation methodology for our FCC licenses.
For the FCC license impairment test performed as of November 1, 2008, it was determined that the fair value of the FCC licenses was less than their carrying value. Consequently, the carrying value of our FCC licenses was reduced by $54.5 million in the fourth quarter of 2008 to $287.5 million at December 31, 2008. For the FCC license impairment test performed as of November 1, 2009, it was determined that the fair value of the FCC licenses was greater than their carrying value.
As a result of the impairment of FCC licenses, the deferred tax liability associated with the FCC licenses was reduced by $20.2 million in 2008 for the tax impact of the impairment charge with a corresponding recognition of an income tax benefit of $20.2 million. See Note 12, Income Taxes for additional information.
Note 7—Impairment of Goodwill
At December 31, 2006, the carrying value of our goodwill totaled $243.4 million. As a result of a decline in our market capitalization below the carrying value of our equity during the quarter ended September 30, 2007, we believed an indicator of impairment existed and, accordingly, performed an interim review of the value of our goodwill. In the quarter ended September 30, 2007, we concluded that the carrying value of goodwill was impaired and recorded an impairment charge of $61.4 million. In the fourth quarter of 2007, we decreased the amount allocated to goodwill in connection with the merger with First Avenue by $9.4 million which required a corresponding decrease to the deferred tax liability.
Also, during the fourth quarter of 2007, we performed our annual impairment test of the value of our goodwill. We concluded that the carrying value of goodwill was further impaired and recorded an additional impairment charge of $86.5 million, reducing the carrying value of goodwill to its fair value of $86.1 million at December 31, 2007.
As a result of a further decline in our market equity value during the quarter ended March 31, 2008, we believed an indicator of further impairment existed and, accordingly, performed an interim review of the value of our goodwill. In the quarter ended March 31, 2008, we concluded that the carrying value of goodwill was fully impaired and recorded an impairment charge of $86.1 million, reducing the carrying value of goodwill to its fair value of zero.
82
FIBERTOWER CORPORATION
Notes to Consolidated Financial Statements (Continued)
Note 7—Impairment of Goodwill (Continued)
The goodwill impairment charges of $86.1 million in 2008 and $147.9 million in 2007 are included in operating expenses in the Consolidated Statements of Operations.
Note 8—Long-term Debt
See Note 1, Organization and Business for a summary description of the Exchange Offer and Mandatory Redemption which occurred during the fourth quarter of 2009.
The carrying value of our indebtedness is comprised of the following (in thousands):
| |
December 31, 2009 | ||||||
|---|---|---|---|---|---|---|---|
| |
2009 | 2008 | |||||
9.00% Senior secured notes due 2016 ("Notes due 2016") |
$ | 124,405 | $ | — | |||
9.00% Convertible senior secured notes due 2012 |
25,888 | 401,383 | |||||
Accretion of Notes due 2012 |
4,235 | 28,934 | |||||
|
$ | 154,528 | $ | 430,317 | |||
9.00% Senior Secured Notes Due 2016 ("Notes due 2016")
We issued the Notes due 2016 on December 22, 2009, as part of the redemption of the Interim Notes that had been issued on December 7, 2009 as part of our Exchange Offer. The redemption of the Interim Notes for the Notes due 2016 has been accounted for as a Troubled Debt Restructuring. In order for the redemption of the Interim Notes to be accounted for as a Troubled Debt Restructuring as opposed to as an exchange of debt, we needed to determine whether FiberTower was experiencing financial difficulty and whether our creditors had granted us a concession. Both conditions must be present in order to account for the transaction as a Troubled Debt Restructuring. We determined that there was a reasonable probability that FiberTower could be considered to be experiencing financial difficulty. Creditors are considered to have granted a concession if the debtor's effective borrowing rate on the restructured debt is less than the effective borrowing rate on the old debt immediately before the restructuring and does not represent an effective interest rate the debtor could otherwise obtain in the marketplace.
The accounting for a Troubled Debt Restructuring requires us to adjust the carrying value of the Interim Notes by the fair value of the cash and common stock consideration to calculate the initial carrying value of the Notes due 2016. Since the new cash flows under the Notes due 2016 exceeded the carrying value of the Interim Notes, no gain on restructuring was recognized, and a new effective interest rate was calculated. Gain or loss recognition on the redemption of the Interim Notes is only applicable when the remaining carrying value, after reductions for the fair value of the cash and common stock consideration transferred to the creditors, exceeds the total future cash payments specified by the terms of the debt remaining unsettled after the restructuring. As the remaining carrying value transferred to the creditors exceeded the carrying value of the Interim Notes, no gain or loss on the redemption of the Interim Notes was recognized. The principal amount of the Notes due 2016 at December 31, 2009 was $113.5 million.
83
FIBERTOWER CORPORATION
Notes to Consolidated Financial Statements (Continued)
Note 8—Long-term Debt (Continued)
The carrying value of our Notes due 2016 at December 31, 2009 is comprised of the following (in thousands):
Carrying value of Interim Notes at December 22, 2009 |
$ | 295,686 | ||
Accrued interest payable on Interim Notes |
2,468 | |||
Debt issuance costs written off |
(4,616 | ) | ||
Cash paid to holders of Interim Notes |
(12,713 | ) | ||
Common stock issued to holders of Interim Notes |
(156,562 | ) | ||
Carrying value of Notes due 2016 at December 22, 2009 |
124,263 | |||
Accretion of principal premium related to Notes due 2016 |
142 | |||
Carrying value of Notes due 2016 at December 31, 2009 |
$ | 124,405 | ||
The common stock issued to holders of Interim Notes was determined as follows:
Shares of common stock issued to holders of Interim Notes |
30,579 | |||
Average common stock price on December 22, 2009 redemption date |
$ | 5.12 | ||
Common stock issued to holders of Interim Notes (in thousands) |
$ | 156,562 | ||
We are recognizing interest expense on the Notes due 2016 at the interest rate (7.31%) necessary to equate future principal and interest payments to an initial present value of $124.4 million. The Notes due 2016 will mature in January 2016. Interest is payable 9.00% per annum on the principal amount accruing from December 22, 2009, payable semi-annually. On each interest payment date, one-third of the interest will be payable in cash and two-thirds of the interest will be payable in additional Notes due 2016 in a principal amount equal to such portion of the interest amount. We have placed into escrow approximately $11.0 million, which, together with the earnings thereon, is an amount sufficient to pay the cash portion of the first six interest payments.
The Notes due 2016 are fully and unconditionally guaranteed, jointly and severally, on a senior secured basis by each of our existing and future domestic restricted subsidiaries. All of our current subsidiaries are restricted subsidiaries governed by the terms of our indentures. The Notes due 2016 and the related guarantees are our senior secured obligations and rank pari passu in right of payment with all of our and the guarantors' existing and future senior indebtedness, including our Notes due 2012. Because the liens on the collateral securing the Notes due 2016 rank ahead of the liens securing the Notes due 2012, the Notes due 2016 rank effectively senior in right of payment to the Notes due 2012 to the extent of the value of the collateral securing the Notes due 2016. The Notes due 2016 and the related guarantees are secured, to the extent permitted by law, by a first priority pledge (subject to permitted liens) of substantially all of our and our existing and future restricted subsidiaries' assets (it being understood that the Communications Act of 1934 currently prohibits the grant of a security interest in an FCC license), other than certain excluded assets, and by a first priority pledge (subject to permitted liens) of the equity interests of each of our existing and future domestic restricted subsidiaries and the equity interests of any unrestricted subsidiaries or foreign subsidiaries owned by any such domestic restricted subsidiaries, in each case subject to certain limitations and exceptions. The maximum potential amount of future undiscounted payments the guarantors could be required to make under the guarantees of the Notes due 2016 is $186.4 million. This amount represents total anticipated cash payments, including expected interest payments that are not recorded on the Consolidated Balance Sheets.
84
FIBERTOWER CORPORATION
Notes to Consolidated Financial Statements (Continued)
Note 8—Long-term Debt (Continued)
The indenture governing the Notes due 2016 contains covenants that restrict i) our ability to incur or guarantee additional indebtedness or issue certain preferred stock, ii) pay dividends or make other distributions, iii) issue capital stock of our restricted subsidiaries, iv) transfer or sell assets, including the capital stock of our restricted subsidiaries, v) make certain investments or acquisitions, vi) grant liens on our assets, vii) incur dividend or other payment restrictions affecting our restricted subsidiaries, viii) enter into certain transactions with affiliates, and ix) merge, consolidate or transfer all or substantially all of our assets. As of December 31, 2009, we are in compliance with all of the covenants.
We may redeem the Notes due 2016 prior to January 2012 at 100% of the aggregate principal amount of the notes to be redeemed plus a make-whole premium and accrued and unpaid interest to the date of redemption. We may redeem the Notes due 2016 beginning in January 2012 at 104.5% of the aggregate principal amount of the notes to be redeemed plus accrued and unpaid interest to the date of redemption. The redemption price decreases to 102.25% in January 2014 and to 100% in January 2015. If a fundamental change, which generally includes events relating to certain changes in control of FiberTower, occurs prior to maturity, holders may require us to repurchase all or part of the Notes due 2016 for cash at a repurchase price equal to 101% of their aggregate principal amount, plus accrued and unpaid interest, up to the repurchase date. We evaluated these provisions and determined they do not represent derivatives that are required to be bifurcated from the Notes due 2016.
In the event of default on the Notes due 2016 has occurred and is continuing, the aggregate principal amount, plus any accrued and unpaid interest, may be declared immediately due and payable. These amounts may become due and payable upon certain events of default.
The Notes due 2016 will be treated, for U.S. federal income tax purposes, as issued with original issue discount because the interest payable will not constitute "qualified stated interest" under applicable rules and because the principal amount may exceed their issue price. Consequently, the Notes due 2016 will be treated as issued at a discount.
See Note 9, Fair Value Disclosures for disclosure of the fair value of our Notes due 2016.
9.00% Mandatorily Redeemable Convertible Senior Secured Notes Due 2012 ("Interim Notes")
The carrying value of our Interim Notes is comprised of the following (in thousands):
Exchange of Notes due 2012 for Interim Notes on December 7, 2009 |
$ | 266,791 | ||
Accretion of principal premium related to Notes due 2012 |
29,284 | |||
Accretion of Derivative related to Notes due 2012 |
(389 | ) | ||
Carrying value of Interim Notes at December 22, 2009 |
295,686 | |||
Redemption of Interim Notes on December 22, 2009 |
(295,686 | ) | ||
Carrying value of Interim Notes at December 31, 2009 |
$ | — | ||
On December 7, 2009, under the terms of our Exchange Offer, 90.8% of our Notes due 2012, with a face amount of $266.8 million, were exchanged for the Interim Notes. The Exchange Offer has been accounted for as an exchange of debt (as opposed to a Troubled Debt Restructuring) as the creditors did not grant us a concession on the exchange. The Interim Notes were identical with respect to cash flow and substantially similar to the Notes due 2012, with the following differences. The Interim Notes:
- •
- held a priority lien position relative to the Notes due 2012;
85
FIBERTOWER CORPORATION
Notes to Consolidated Financial Statements (Continued)
Note 8—Long-term Debt (Continued)
- •
- contained a mandatory redemption provision upon the satisfaction of a) at least 90% participation in the Exchange
Offer, b) approval of the transaction from the FCC, and c) stockholder approval;
- •
- held a senior claim on equity of a newly created FCC license subsidiary; and
- •
- contained no conversion price reset based on the occurrence or lack of an equity offering at or above the $62.20 conversion price.
We concluded that the mandatory redemption provision was not a derivative as it did not meet the net settlement criteria.
The Interim Notes were recorded at an initial amount of $295.7 million representing the carrying amount of the exchanged portion of the Notes due 2012.
The conditions for the Mandatory Redemption provision were satisfied and the Interim Notes were redeemed, in whole, for a combination of cash, shares of our common stock and Notes due 2016 on December 22, 2009.
We incurred fees and expenses of approximately $4.5 million in connection with the Exchange Offer and Mandatory Redemption that have been included in general and administrative expenses.
9.00% Convertible Senior Secured Notes Due 2012 ("Notes due 2012")
The change in Notes due 2012 during the year ended December 31, 2009 is summarized as follows (in thousands):
Balance at December 31, 2008 |
$ | 430,317 | ||
Accretion of principal premium |
12,039 | |||
Accretion of Derivative |
112 | |||
Repurchases at par value |
(142,233 | ) | ||
Reversal of accretion of principal premium related to repurchases |
(11,611 | ) | ||
Reversal of accretion of Derivative related to repurchases |
265 | |||
Additional Notes due 2012 issued May 15, 2009 |
18,213 | |||
Additional Notes due 2012 issued November 16, 2009 |
15,316 | |||
Accretion of principal premium for the additional Notes due 2012 issued in May and November 2009 |
3,391 | |||
Exchange of Notes due 2012 for Interim Notes on December 7, 2009 |
(266,791 | ) | ||
Reversal of accretion of principal premium related to redemption of Interim Notes |
(29,284 | ) | ||
Reversal of accretion of Derivative related to redemption of Interim Notes |
389 | |||
Balance at December 31, 2009 |
$ | 30,123 | ||
On November 9, 2006, we completed the sale of $402.5 million of the Notes due 2012 that mature on November 15, 2012. The notes are fully guaranteed, jointly and severally, by each of our subsidiaries and bear interest at a rate of 9.00% per annum, payable semi-annually in arrears in cash on May 15 and November 15 of each year.
86
FIBERTOWER CORPORATION
Notes to Consolidated Financial Statements (Continued)
Note 8—Long-term Debt (Continued)
We elected to pay the May 15, 2009 and November 15, 2009 interest payments entirely by the issuance of additional Notes due 2012, as permitted under its indenture. This resulted in the issuance of an additional $33.5 million in principal amount. These additional notes are identical to the original Notes due 2012, except that interest on such additional notes began to accrue from the date they were issued. Subject to certain conditions, we also have the option of making either or both of the next two semi-annual interest payments due in May and November 2010 with additional Notes due 2012 in lieu of cash. The interest rate applicable to any such interest payments made in additional Notes due 2012 is 11%. Thereafter, the interest would be payable only in cash. We currently expect the payment of the May 2010 interest payment to be made in additional Notes due 2012.
In the first and second quarters of 2009, we repurchased $142.2 million par value of our Notes due 2012 in the open market. These repurchases, at a weighted average price of approximately $37 per $100 of par value, were for a total of $52.2 million in cash plus accrued but unpaid interest of $2.0 million. The repurchases resulted in the recognition of a gain on early extinguishment of debt of $98.2 million.
The gain on early extinguishment of debt is comprised of the following (in thousands):
| |
Year Ended December 31, 2009 |
|||
|---|---|---|---|---|
Repurchases at par value |
$ | 142,233 | ||
Reversal of accretion of principal premium related to repurchases |
11,611 | |||
Cash paid for par value |
(52,180 | ) | ||
Reversal of unamortized debt issuance costs related to repurchases |
(3,151 | ) | ||
Reversal of accretion of Derivative related to repurchases |
(265 | ) | ||
|
$ | 98,248 | ||
We will be required to repay any Notes due 2012 that are not redeemed or converted prior to maturity for 125.411% of their principal amount, or $33.9 million. We are accreting the principal premium ratably over the six-year period from inception until the Notes due 2012 mature and are recognizing such accretion as additional interest expense. The effect of this accretion is to increase the effective yield to the holders to 12% per annum based on the par value of the Notes due 2012. The effect of the accretion related to the interest payments made by the issuance of additional notes, is to increase the effective yield to the holders from 12% to approximately 12.5% per annum.
The Notes due 2012 and related guarantees are secured, to the extent permitted by law, by a second priority pledge of substantially all of our assets (other than certain excluded assets) and by a second priority pledge of the stock of all of our subsidiaries The Notes due 2012 rank pari passu in right of payment to all of our existing and future senior indebtedness and senior to all of our existing and future subordinated indebtedness. Because the liens on the collateral securing the Notes due 2016 rank ahead of the liens securing the Notes due 2012, the Notes due 2016 rank effectively senior in right of payment to the Notes due 2012 to the extent of the value of the collateral securing the Notes due 2016. The maximum potential amount of future undiscounted payments the guarantors could be required to make under the guarantees of the Notes due 2012 is $42.3 million. This amount represents total anticipated cash payments, including expected interest payments that are not recorded on the Consolidated Balance Sheets.
87
FIBERTOWER CORPORATION
Notes to Consolidated Financial Statements (Continued)
Note 8—Long-term Debt (Continued)
The Notes due 2012 are not redeemable by us before November 15, 2010. If our common stock has traded at or above 150% of the $62.20 per share conversion price discussed below, for 20 of any 30 consecutive trading days and the daily trading volume for each such trading day which, when multiplied by the closing sale price for such trading day, equals at least $8.0 million, we may redeem any of the Notes due 2012, in whole or in part at any time on or after November 15, 2010, at 100% of the aggregate accreted principal amount, together with accrued and unpaid interest.
The Notes due 2012 may be converted into shares of our common stock. The conversion price was originally $82.90 per share subject to adjustment under certain circumstances. The conversion price was reduced on November 9, 2008 as described below. Holders who convert their Notes due 2012 in connection with certain designated events related to consolidations and mergers that occur on or prior to November 15, 2010 will receive a make-whole premium on the notes such holders convert.
The Notes due 2012 contain certain anti-dilution provisions that caused the conversion price to be reduced because we had not issued or sold common stock for aggregate proceeds of at least $50.0 million by November 9, 2008. The anti-dilution provisions were triggered on November 9, 2008. The number of common shares that could be issued upon conversion of the Notes due 2012 was increased as a result of the anti-dilution provisions being triggered, which increase was capped at a 33% increase in the total number of shares. Therefore, the triggering of the anti-dilution provisions resulted in a reduction to the conversion price to $62.20 per share. This resulted in 2.0 million additional shares which could be potentially issuable upon conversion of all Notes due 2012 outstanding at December 31, 2008 and any additional notes that could be issued as payment for interest on the Notes due 2012. In 2009, the amount of shares which could be potentially issuable if all outstanding Notes due 2012 at December 31, 2009 were converted and upon conversion of additional notes that could be issued as payment for interest on the notes were reduced by i) 2.8 million resulting from the repurchases of Notes due 2012 during the first six months of 2009 and ii) 4.8 million resulting from the exchange of Notes due 2012 for the Interim Notes.
In connection with the Exchange Offer, the indenture governing the Notes due 2012 was amended to eliminate or amend substantially all of the restrictive covenants contained in such indenture. In addition, the holder put option upon the occurrence of certain designated events was eliminated as part of the Mandatory Redemption.
We concluded that the embedded feature of the Notes due 2012 related to the make-whole premium, designated event make-whole premium and holder put option, qualified as derivatives and should be bundled as a compound embedded derivative ("Derivative"). The carrying value of the Derivative at December 31, 2009 and December 31, 2008 was zero.
See Note 9, Fair Value Disclosures for disclosure of the fair value of our Notes due 2012 and Derivative.
Debt issuance costs incurred in connection with the sale of the Notes due 2012 totaled $14.3 million. Accumulated amortization totaled $13.8 million at December 31, 2009. This included a reduction of $3.2 million in unamortized debt issuance costs associated with the repurchases of Notes due 2012 in 2009 and $4.6 million debt issuance costs written off in connection with the redemption of the Interim Notes. Accumulated amortization totaled $4.7 million at December 31, 2008.
88
FIBERTOWER CORPORATION
Notes to Consolidated Financial Statements (Continued)
Note 8—Long-term Debt (Continued)
Aggregate future maturities of long-term debt (excluding obligations under capital lease) were as follows at December 31, 2009 (in thousands):
Years ending December 31, |
|||||
2010 |
$ | — | |||
2011 |
— | ||||
2012 |
35,921 | ||||
2013 |
— | ||||
2014 |
— | ||||
Thereafter |
162,072 | ||||
|
$ | 197,993 | |||
Note 9—Fair Value Disclosures
The following table presents information about our assets measured at fair value on a recurring basis as of December 31, 2009 and December 31, 2008, and indicates the fair value hierarchy of the valuation techniques we utilized to determine such fair value (in thousands):
| |
Quoted Prices in Active Markets for Identical Assets or Liabilities |
Significant Other Observable Inputs |
Significant Unobservable Inputs |
|
|||||||||
|---|---|---|---|---|---|---|---|---|---|---|---|---|---|
| |
Level 1 | Level 2 | Level 3 | Total | |||||||||
Cash and cash equivalents at December 31, 2009 |
$ | 50,669 | (1) | $ | — | $ | — | $ | 50,669 | ||||
Cash and cash equivalents at December 31, 2008 |
$ | 154,357 | (2) | $ | — | $ | — | $ | 154,357 | ||||
- (1)
- Includes
$42.5 million of money market mutual funds which invest in U.S. Government securities.
- (2)
- Includes $147.2 million of money market mutual funds which invest in U.S. Government securities.
The estimated fair value of our Notes due 2016 was approximately $94 million at December 31, 2009, compared to their carrying value at such date of $124.4 million. The estimated fair value of our Notes due 2012 was approximately $24 million at December 31, 2009, compared to their carrying value at such date of $30.1 million. As there was not sufficient liquidity to establish an active market in the Notes due 2016 and Notes due 2012 at December 31, 2009, the estimate of fair value was determined using a discounted cash flow approach as well as based on bids from market makers. The estimated fair value of our Notes due 2012, determined based on quoted prices, was approximately $86.5 million at December 31, 2008, compared to their carrying value at such date of $430.3 million.
The fair value of the Derivative as of December 31, 2009 and December 31, 2008 was zero based on our internal models. We monitor the fair value of the Derivative each reporting period and record changes in fair value through charges or credits to miscellaneous income, net with an offsetting adjustment to the carrying value of the Notes due 2012 on the balance sheet. The value of the Derivative can fluctuate based on changes in several factors including the trading price of our common stock, passage of time and other events described in the Notes due 2012.
The bonds issued by U.S. Government agencies included in restricted cash and investments on the Consolidated Balance Sheets are classified as held-to-maturity and are reported at amortized cost which approximates fair value.
89
FIBERTOWER CORPORATION
Notes to Consolidated Financial Statements (Continued)
Note 10—Leasing Arrangements
Future minimum lease payments under our operating leases with non-cancelable terms in excess of one year and our capital lease were as follows at December 31, 2009 (in thousands):
| |
Operating leases |
Capital lease | ||||||
|---|---|---|---|---|---|---|---|---|
Years ending December 31, |
||||||||
2010 |
$ | 35,262 | $ | 270 | ||||
2011 |
33,621 | 270 | ||||||
2012 |
29,520 | 1,643 | ||||||
2013 |
25,253 | 1,643 | ||||||
2014 |
23,921 | 1,643 | ||||||
Thereafter |
38,062 | — | ||||||
Total minimum lease payments |
$ | 185,639 | 5,469 | |||||
Less: amount representing interest |
1,745 | |||||||
Present value of minimum lease payments |
3,724 | |||||||
Less: current portion of obligations under capital lease |
253 | |||||||
Obligations under capital lease, net of current portion |
$ | 3,471 | ||||||
In the fourth quarter of 2009, we acquired an indefeasible right of use of dark fiber under a 5-year lease which has been accounted for as a capital lease. The carrying amount of the asset is the present value of the minimum lease payments determined using our incremental borrowing rate. The carrying value of the network equipment under capital lease at December 31, 2009 was $4.2 million as shown in Note 3, Property and Equipment.
Rent expense under all operating leases, including one-time setup charges from fiber service providers, was $36.5 million in 2009, $37.5 million in 2008 and $29.2 million in 2007. Payments under our operating leases that escalate over the term of the lease are recognized as rent expense on a straight-line basis.
Note 11—Stockholders' Equity and Stock-Based Compensation
As described in Note 1, Organization and Business, on December 18, 2009, we effected a 1-for-10 reverse stock split of our common stock. Accordingly, all share, option, warrant and per share information for all periods presented have been retroactively restated to reflect the effect of the reverse stock split.
Old FiberTower Stock Plan—In May 2001, Old FiberTower adopted a stock option plan (the "Old FiberTower Stock Plan") pursuant to which the Board of Directors was authorized to grant options to purchase common stock, or issue shares of common stock, to employees, officers, directors, advisors or consultants of Old FiberTower. Incentive stock options ("ISOs") and nonqualified stock options ("NSOs") were granted with an exercise price equal to the estimated fair value of the common stock at the date of grant. All options issued under the Old FiberTower Stock Plan have a ten-year term, become fully exercisable upon vesting, and generally vested over one to four years.
As a result of the merger discussed in Note 1, all outstanding options under this plan were legally assumed by First Avenue and this plan was discontinued effective August 29, 2006. All existing
90
FIBERTOWER CORPORATION
Notes to Consolidated Financial Statements (Continued)
Note 11—Stockholders' Equity and Stock-Based Compensation (Continued)
outstanding options continued under the same terms of the original grant agreements (including the ten-year contractual life of options) as adjusted for the merger exchange ratio with respect to the number of shares and per share price.
FiberTower Corporation Stock Incentive Plan (formerly First Avenue Stock Incentive Plan) —As a result of the merger discussed in Note 1, Old FiberTower, as the acquirer of First Avenue, assumed options for the purchase of 0.4 million shares of common stock that had been granted by First Avenue under its Stock Incentive Plan (the "Stock Incentive Plan") prior to the merger.
First Avenue amended the Stock Incentive Plan, effective August 29, 2006 to: (1) provide for the issuance of restricted shares as well as ISOs and NSOs; (2) increase the number of shares reserved for issuance under the plan from 0.8 million shares to 2.3 million shares; (3) provide for annual awards of restricted shares with an aggregate value of $85,000 to each non-employee director and (4) allow for an annual increase in the aggregate authorized shares to 1.5% of the then outstanding common shares. Options granted under the Stock Incentive Plan have a maximum term of up to five years.
Pursuant to the terms of the Stock Incentive Plan, additional shares of approximately 0.2 million on each of August 29, 2009, August 29, 2008 and August 29, 2007 became available for issuance, for a total number of shares reserved for issuance under the Stock Incentive Plan of 3.0 million shares. In November 2008, the Stock Incentive Plan was amended to limit the number of restricted shares granted to non-employee directors pursuant to the automatic annual awards described above to no more than 0.7% of the number of fully diluted outstanding shares of our common stock as of the date of such grant.
A summary of our stock option activity in 2009 and 2008 is as follows:
| |
Number of Options (000s) |
Weighted Average Exercise Price Per Share |
Weighted Average Remaining Contractual Term (years) |
Aggregate Intrinsic Value ($000s) |
||||||||||
|---|---|---|---|---|---|---|---|---|---|---|---|---|---|---|
Balance at December 31, 2007 |
724 | $ | 60.20 | 4.2 | $ | 1,947 | ||||||||
Granted |
118 | $ | 14.30 | |||||||||||
Cancelled |
(397 | ) | $ | 69.60 | ||||||||||
Exercised |
(58 | ) | $ | 6.20 | $ | 520 | ||||||||
Balance at December 31, 2008 |
388 | $ | 44.60 | 4.0 | $ | — | ||||||||
Granted |
365 | $ | 1.59 | |||||||||||
Cancelled |
(94 | ) | $ | 47.03 | ||||||||||
Exercised |
— | $ | — | $ | — | |||||||||
Balance at December 31, 2009 |
659 | $ | 20.45 | 3.7 | $ | 891 | ||||||||
Exercisable at December 31, 2009 |
516 | $ | 22.44 | 3.7 | $ | 734 | ||||||||
91
FIBERTOWER CORPORATION
Notes to Consolidated Financial Statements (Continued)
Note 11—Stockholders' Equity and Stock-Based Compensation (Continued)
Options outstanding at December 31, 2009 that are vested or are expected to vest are as follows:
| |
Number of Options (000s) |
Weighted Average Exercise Price Per Share |
Weighted Average Remaining Contractual Term (Years) |
Aggregate Intrinsic Value ($000s) |
|||||||||
|---|---|---|---|---|---|---|---|---|---|---|---|---|---|
Vested |
516 | $ | 22.44 | 3.7 | $ | 734 | |||||||
Options expected to vest |
133 | $ | 14.12 | 3.5 | 133 | ||||||||
Total |
649 | $ | 20.73 | 3.7 | $ | 867 | |||||||
The aggregate intrinsic values above include only in-the-money options based on our closing stock price of $4.18 per share at December 31, 2009.
The fair value of the options granted was determined using the Black-Scholes-Merton option pricing model and the assumptions set forth below:
| |
Year Ended December 31, | ||||||
|---|---|---|---|---|---|---|---|
| |
2009 | 2008 | |||||
Expected life of options |
3.58 years | 3.58 years | |||||
Volatility |
141% – 149% | 67% – 70% | |||||
Risk-free interest rate |
1.55% – 2.13% | 2.27% – 2.98% | |||||
Expected dividend yield |
0.00% | 0.00% | |||||
The weighted-average grant-date fair value per share of stock options granted was $1.36 during 2009 and $7.30 during 2008.
At December 31, 2009, there was approximately $0.9 million of unrecognized compensation cost related to stock options. This compensation cost is expected to be recognized over a weighted-average period of approximately 1.7 years.
The aggregate fair value of options that vested was $2.4 million in 2009, $1.6 million in 2008 and $3.6 million in 2007.
Certain of our key employees' stock option and restricted stock agreements provide that, upon a change in control of FiberTower, 100% of the stock options and restricted shares granted to such employees will become fully vested. The other employees' stock option and restricted stock agreements provide that, upon a change in control of FiberTower, the vesting of stock options and restricted shares granted to such employees will accelerate by one year.
The Exchange Offer and redemption of debt described at Note 1, Organization and Business, resulted in a change in control of FiberTower which triggered acceleration of vesting of stock options
92
FIBERTOWER CORPORATION
Notes to Consolidated Financial Statements (Continued)
Note 11—Stockholders' Equity and Stock-Based Compensation (Continued)
and restricted stock. Following are the shares and related stock-based compensation expense resulting from the acceleration of vesting recorded in the fourth quarter of 2009 (in thousands):
| |
Stock Options | Restricted Stock | Total | ||||||||||||||||
|---|---|---|---|---|---|---|---|---|---|---|---|---|---|---|---|---|---|---|---|
| |
Shares | $ | Shares | $ | Shares | $ | |||||||||||||
Cost of service revenues |
52 | $ | 129 | 47 | $ | 792 | 99 | $ | 921 | ||||||||||
Sales and marketing |
51 | 96 | 12 | 170 | 63 | 266 | |||||||||||||
General and administrative |
180 | 336 | 129 | 1,716 | 309 | 2,052 | |||||||||||||
|
283 | (1) | $ | 561 | 188 | (1) | $ | 2,678 | 471 | (1) | $ | 3,239 | |||||||
- (1)
- Three of our officers, the compensation-related costs for whom are classified as general and administrative, waived the acceleration of vesting of certain of their stock option and restricted stock awards. Absent these waivers, an additional 77,000 stock options would have accelerated for a related stock-based compensation expense of $0.8 million and 73,000 restricted shares would have accelerated for a related stock-based compensation expense of $1.1 million.
Unless otherwise stipulated by the Board of Directors, restricted stock awards to employees under the Stock Incentive Plan vest over a four-year period from the grant date. During 2009, 2008 and 2007 restricted stock awards to certain directors vested immediately, including the annual awards to each non-employee director, while other restricted stock awards vested over periods of less than four years, as stipulated in the respective award agreements. Prior to vesting, the restricted stock awards have voting rights and are entitled to dividends. Therefore, such shares are considered outstanding for financial reporting purposes, but are included in the net loss per share computations only to the extent vested. We determine the fair value of each restricted stock award based on our common stock price at the date of the award.
A summary of our restricted stock award activity in 2009 and 2008 is as follows:
| |
Number of Shares (000s) |
Weighted Average Grant Date Per Share Fair Value |
||||||
|---|---|---|---|---|---|---|---|---|
Balance at December 31, 2007 |
235 | $ | 72.70 | |||||
Granted |
590 | $ | 15.40 | |||||
Vested |
(145 | ) | $ | 33.20 | ||||
Cancelled |
(220 | ) | $ | 45.40 | ||||
Balance at December 31, 2008 |
460 | $ | 24.70 | |||||
Granted |
111 | $ | 1.66 | |||||
Vested |
(413 | ) | $ | 19.96 | ||||
Cancelled |
(39 | ) | $ | 36.71 | ||||
Balance at December 31, 2009 |
119 | $ | 15.57 | |||||
At December 31, 2009, there was approximately $1.6 million of unrecognized compensation cost related to the restricted stock awards. This compensation cost is expected to be recognized over a weighted-average period of approximately 1.6 years. The aggregate intrinsic value of the restricted stock outstanding at December 31, 2009 was $0.5 million.
93
FIBERTOWER CORPORATION
Notes to Consolidated Financial Statements (Continued)
Note 11—Stockholders' Equity and Stock-Based Compensation (Continued)
Employee and non-employee stock-based compensation expense was recorded in the Consolidated Statements of Operations as follows (in thousands):
| |
Years Ended December 31, | |||||||||
|---|---|---|---|---|---|---|---|---|---|---|
| |
2009 | 2008 | 2007 | |||||||
Cost of service revenues |
$ | 2,234 | $ | 2,090 | $ | 1,674 | ||||
Sales and marketing |
425 | 1,045 | 1,593 | |||||||
General and administrative |
5,357 | 3,139 | 5,883 | |||||||
Total |
$ | 8,016 | $ | 6,274 | $ | 9,150 | ||||
In 2008, we reversed $0.9 million of previously recognized compensation cost related to the cancellation of unvested restricted stock and stock options for employees who were part of the workforce reduction discussed at Note 4, Restructuring Charges.
We capitalized a negligible amount in 2009, $0.1 million in 2008 and $0.4 million in 2007 of stock-based compensation expense in connection with co-location site acquisition and network construction activities.
Warrants—We assumed warrants in connection with our merger with First Avenue. During the first quarter of 2009, 31,000 warrants at an exercise price of $18.40 per share expired unexercised. The following table summarizes information about the warrants at December 31, 2009:
| Warrants Outstanding | Warrants Exercisable | |||||||||||||||
|---|---|---|---|---|---|---|---|---|---|---|---|---|---|---|---|---|
| Exercise Price Per Share |
Warrants Outstanding (000s) |
Expiration Date | Weighted Average Remaining Contractual Life (Years) |
Number Exercisable (000s) |
Weighted Average Exercise Price Per Share |
|||||||||||
| $ | 72.50 | 257 | December 2014 | 5.0 | 257 | $ | 72.50 | |||||||||
Common Stock Reserved for Future Issuance
Shares of common stock reserved for future issuance at December 31, 2009 were as follows (in thousands):
Convertible Senior Secured Notes Due 2012 ("Notes due 2012") |
483 | (1) | ||
Warrants |
257 | |||
Stock options and restricted shares |
2,261 | |||
Total shares reserved |
3,001 | |||
- (1)
- Shares of common stock reserved for future issuance were reduced by i) 2.8 million during the first six months of 2009 as a result of the repurchases of Notes due 2012 described in Note 8, Long-term Debt and ii) 4.8 million as a result of the Exchange Offer and redemption of debt.
94
FIBERTOWER CORPORATION
Notes to Consolidated Financial Statements (Continued)
Note 12—Income Taxes
A reconciliation of FiberTower's effective income tax rate as a percentage of net loss before income taxes and the federal statutory tax rate for the years ended December 31, 2009, 2008 and 2007 is as follows:
| |
2009 | 2008 | 2007 | |||||||
|---|---|---|---|---|---|---|---|---|---|---|
Federal income tax at statutory tax rate |
(35.0 | )% | (35.0 | )% | (35.0 | )% | ||||
State income taxes net of federal benefit |
183.2 | % | (6.2 | )% | 3.9 | % | ||||
Nondeductible interest expense |
386.6 | % | 0.8 | % | 0.8 | % | ||||
Stock-based compensation |
91.0 | % | (0.1 | )% | 0.1 | % | ||||
Impairment of FCC licenses |
— | (7.1 | )% | — | ||||||
Nondeductible items and other |
26.3 | % | 12.4 | % | 18.1 | % | ||||
Impact of valuation allowance |
(688.9 | )% | 27.7 | % | 12.1 | % | ||||
Effective tax rate |
(36.8 | )% | (7.5 | )% | 0.0 | % | ||||
As a result of the gain on early extinguishment of debt realized on the repurchases of our Notes due 2012 during the first six months of 2009 as described in Note 8, Long-term Debt, we recorded a state income tax provision of $0.2 million. However, for federal tax purposes, the American Recovery and Reinvestment Tax Act of 2009, Section 108(i), allows a taxpayer to elect to defer the recognition of cancellation of indebtedness income ("CODI") from debt reacquisitions in 2009 and 2010 until 2014, and include the deferred CODI in income ratably over five years beginning in 2014. We intend to make this election for federal tax purposes for 2009 for some, if not all of our CODI, and accordingly, we have not recorded a current tax provision for the federal taxes incurred on CODI realized for the year ended December 31, 2009.
Deferred taxes must be calculated for the cumulative temporary difference between the book and tax basis of assets and liabilities using the effective income tax rates that are expected to be in effect when the temporary difference is expected to reverse. We have a net deferred tax liability on the balance sheet attributable to the basis differential recorded for the FCC licenses.
In the year ended December 31, 2008, we recorded an income tax benefit of $20.2 million, with a corresponding decrease to the deferred tax liability as a result of the impairment of FCC licenses. See Note 6, Impairment of FCC Licenses for additional information. The deferred tax liability for FCC licenses effects tax expense for increases or decreases as the FCC licenses are indefinite-lived assets for book purposes. Accordingly, the associated deferred tax liability cannot be utilized in the determination of the valuation allowance required for deferred tax assets due to uncertainty regarding realization.
In the first quarter of 2009 and in connection with the preparation of the 2008 tax filings, management reviewed its current multi-state operations as they relate to the state apportionment percentages. As a result of this review, we updated our overall blended state tax rate computation. The impact of such update was a reduction in the overall state blended tax rate and, in turn, the carrying value of the above-mentioned deferred tax liability. Accordingly, we recorded a discrete, non-cash state income tax benefit of $1.5 million in the first quarter of 2009, with a corresponding decrease to the deferred tax liability.
95
FIBERTOWER CORPORATION
Notes to Consolidated Financial Statements (Continued)
Note 12—Income Taxes (Continued)
The provision (benefit) for income taxes consists of the following (in thousands):
| |
2009 | 2008 | ||||||
|---|---|---|---|---|---|---|---|---|
Federal: |
||||||||
Current |
$ | — | $ | — | ||||
Deferred |
— | (19,077 | ) | |||||
|
— | (19,077 | ) | |||||
State: |
||||||||
Current |
221 | — | ||||||
Deferred |
(1,468 | ) | (1,112 | ) | ||||
|
(1,247 | ) | (1,112 | ) | ||||
Total |
$ | (1,247 | ) | $ | (20,189 | ) | ||
Other than the provisions and benefits for income taxes described above, no other provision or benefit for income taxes has been recorded due to (i) our net operating losses since inception and (ii) our present inability to recognize the potential benefits of our net operating loss carryforwards, as described below. In 2007, we recorded no income tax provision or benefit.
Deferred tax assets and liabilities at December 31, 2009 and 2008 are as follows (in thousands):
| |
2009 | 2008 | ||||||
|---|---|---|---|---|---|---|---|---|
Deferred tax assets: |
||||||||
Net operating loss carryforwards |
$ | 231,622 | $ | 238,528 | ||||
Interest accretion on notes |
8,993 | 12,159 | ||||||
Property and equipment |
4,983 | 4,918 | ||||||
Other |
9,915 | 10,006 | ||||||
Total deferred tax assets |
255,513 | 265,611 | ||||||
Deferred tax liabilities: |
||||||||
Deferred gain on extinguishment of debt |
(14,571 | ) | — | |||||
Federal impact—state taxes |
(11,270 | ) | (12,677 | ) | ||||
Deferred tax assets |
229,672 | 252,934 | ||||||
Valuation allowance |
(229,672 | ) | (252,934 | ) | ||||
Net deferred tax assets |
$ | — | $ | — | ||||
Deferred tax liability—intangible assets |
$ | (71,904 | ) | $ | (73,372 | ) | ||
Income taxes are accounted for under an asset and liability approach that requires the recognition of deferred tax assets and liabilities for the expected future tax consequences of events that have been recognized in our consolidated financial statements or tax returns. In estimating future tax consequences, we generally take into account all expected future events then known to us, other than changes in the tax law or rates, which are not permitted to be considered. We record a valuation allowance to reduce net deferred tax assets to the amount that is more likely than not to be realized. The amount of valuation allowance is based on management's best estimate of the recoverability of the net deferred tax assets.
96
FIBERTOWER CORPORATION
Notes to Consolidated Financial Statements (Continued)
Note 12—Income Taxes (Continued)
Due to our net operating loss for the most recent three-year period, we have recorded a full valuation allowance against the net deferred tax assets at December 31, 2009 and 2008.
During the year ended December 31, 2009, we decreased the valuation allowance by $23.3 million primarily due a reduction in the state tax rate used to compute state deferred tax assets and the establishment of additional deferred tax liabilities. During the year ended December 31, 2008, we increased the valuation allowance by $75.5 million primarily due to the net operating loss of the business in 2008. A majority of the valuation allowance relates to tax benefits associated with the merger with First Avenue and the change in balances of the reserve accounts.
At December 31, 2009, we had net operating loss carryforwards of approximately $1,710 million for federal income tax purposes. These net operating loss carryforwards begin to expire in 2016 and fully expire in 2028. During 2007, the Company completed an analysis pursuant to Section 382. The analysis indicated that there will be approximately $1,137.5 million of net operating losses that will expire unused due to the Section 382 limitation. Utilization of the net operating loss carryforwards may be subject to a further substantial annual limitation due to historical or future ownership change rules provided by Section 382.
We will recognize the tax benefit of a tax position that we take or expect to take in a tax return, when it is more likely than not, based on the technical merits, that the position will be sustained upon examination. For these positions, we will recognize an amount of tax benefit that is greater than 50 percent likely of being realized upon ultimate settlement with the tax authority. Tax benefits for tax positions that are not more likely than not of being sustained upon examination will be recognized, generally, when the tax position is resolved through examination or upon the expiration of the statute of limitations.
Our balance of unrecognized income tax benefits for uncertain tax positions at December 31, 2009 and December 31, 2008 was zero. Additionally, there were no changes, either increases or decreases, in the balance during 2009 or 2008. As such, we have not accrued any interest or penalties on such positions. Furthermore, at such time an unrecognized tax benefit is recorded, we will classify interest and penalties as part of income tax expense.
The statute of limitations for federal tax purposes is generally three years and for state tax purposes, generally four years. However, we continue to carryover tax attributes prior to these periods for federal and state purposes, which would still be open for examination by the respective tax authorities. All years since our inception are open to tax examinations.
Note 13—Net Loss Per Share
As described in Note 1, Organization and Business, on December 18, 2009, we effected a 1-for-10 reverse stock split of our common stock. Accordingly, all share, option, warrant and per share information for all periods presented have been retroactively restated to reflect the effect of the reverse stock split.
As discussed at Recent Accounting Pronouncements in Note 2, Basis of Presentation and Accounting Policies, we adopted guidance which resulted in the retrospective adjustment to prior period net loss per share. The effect of the adoption of this guidance was not material to our net loss per share.
97
FIBERTOWER CORPORATION
Notes to Consolidated Financial Statements (Continued)
Note 13—Net Loss Per Share (Continued)
Basic and diluted net loss per share is computed by dividing net loss, excluding net loss attributable to participating securities, by the weighted average number of shares outstanding less the weighted average unvested restricted shares outstanding, and excludes any dilutive effects of stock options, restricted stock, convertible notes and warrants. These potentially issuable shares would further dilute investors when the stock options and warrants are exercised, the restricted stock awards vest and the Notes due 2012 are converted to common shares. Diluted net loss per share was the same as basic net loss per share in each period presented because we had net losses in each of these periods and inclusion of potentially issuable shares would be anti-dilutive.
The following table sets forth the computation of basic and diluted net loss per share (in thousands, except per share data):
| |
Years ended December 31, | |||||||||||
|---|---|---|---|---|---|---|---|---|---|---|---|---|
| |
2009 | 2008 | 2007 | |||||||||
Numerator for basic and diluted net loss per share: |
||||||||||||
Net loss |
$ | (2,138 | ) | $ | (249,829 | ) | $ | (272,147 | ) | |||
Less: Net loss allocated to participating securities |
55 | 9,011 | 5,251 | |||||||||
Net loss attributable to common stockholders |
$ | (2,083 | ) | $ | (240,818 | ) | $ | (266,896 | ) | |||
Denominator for basic and diluted net loss per share: |
||||||||||||
Weighted average shares outstanding |
15,888 | 15,003 | 14,586 | |||||||||
Weighted average unvested restricted shares outstanding |
(407 | ) | (541 | ) | (281 | ) | ||||||
Denominator for basic and diluted net loss per share |
15,481 | 14,462 | 14,305 | |||||||||
Basic and diluted net loss per share attributable to common stockholders |
$ | (0.13 | ) | $ | (16.65 | ) | $ | (18.66 | ) | |||
For 2009, 0.6 million stock options were excluded from the calculation of diluted net loss per share because their inclusion would have been anti-dilutive. Such amounts were 0.5 million stock options in 2008 and 0.8 million stock options in 2007.
At December 31, 2009, 0.5 million shares were potentially issuable if all currently outstanding Notes due 2012 were converted and upon conversion of additional notes that could be issued as payment for interest on these notes. See Note 8, Long-term Debt for additional information.
There were also warrants outstanding at December 31, 2009, to acquire 0.3 million common shares.
Note 14—Related Party Transactions
During the years ended December 31, 2009 and 2008, we leased co-location space and received services pertaining to our network operations center from a stockholder that (i) owns approximately 6% of our outstanding common stock at December 31, 2009 and (ii) has two of its affiliates who serve on our Board of Directors. This stockholder owned approximately 17% of our common stock prior to the Exchange Offer and redemption of debt. During the fourth quarter of 2009, we extended our master lease agreement with that stockholder for another five years, some portions of which became effective upon the occurrence of the redemption of debt described at Note 1, Organization and
98
FIBERTOWER CORPORATION
Notes to Consolidated Financial Statements (Continued)
Note 14—Related Party Transactions (Continued)
Business. The aggregate operating expenses included in the Consolidated Statements of Operations pertaining to these lease and service arrangements, were approximately $3.6 million in 2009, $3.0 million in 2008 and $2.1 million in 2007.
A company controlled by a former member of our Board of Directors periodically serves as a consultant to a holder of approximately 3% of our common stock at December 31, 2009 regarding its investments, including its holdings in FiberTower. This holder owned approximately 8% of our common stock prior to the Exchange Offer and redemption of debt. Upon the redemption of debt, on December 22, 2009, this person resigned from our Board of Directors.
The former Chairman of our Board of Directors serves as a director of Tessco Technologies Incorporated. Tessco supplies us with various materials which are used in our business operations. We incurred expenses of approximately $0.1 million in 2009, $0.2 million in 2008 and $0.8 million in 2007 for such materials from Tessco. Upon the redemption of debt, on December 22, 2009, this person resigned from our Board of Directors.
Note 15—Guarantees and Other Contingencies
Regulatory Matters—We are subject to significant Federal Communications Commission, or FCC, regulation, some of which is in a state of flux due to challenges to existing rules and proposals to create new rules, including a new national broadband policy. Such regulation is subject to different interpretations and inconsistent application and has historically given rise to disputes with other carriers and municipalities regarding the classification of traffic, rates, rights-of-way and zoning matters. Management believes that resolution of any such disputes will not have a material adverse impact on our consolidated financial position.
License Renewal—Like most other FCC licenses, the 24 GHz and 38.6-40.0 GHz (39 GHz) wide-area licenses which we hold were granted for an initial ten-year term. All those licenses now possess renewal dates ranging from 2010 to 2020. We hold two types of 39 GHz licenses which cover either rectangular service areas ("RSAs"), or economic areas ("EAs"). On October 1, 2008, the FCC released an order governing FiberTower-held 39 GHz licenses. Our RSA 39 GHz licenses with 2007 expiration dates received either i) ten-year renewals for licenses deemed constructed or ii) ten-year renewals contingent upon meeting construction requirements which the FCC extended until June 1, 2012. All of our 2007-expiring RSA licenses located in our top 50 markets met the FCC's construction standard and, consequently, were renewed for ten years along with some licenses in smaller markets that were protected due to spectrum lease or other construction activity. Our remaining 183 RSA licenses, which were scheduled to expire at various times through 2009 - 2010 and all of our EA licenses which expire in 2010, subject to this precedent and subject to renewal and extension filings, follow the precedent to receive an extension until June 1, 2012 to demonstrate "substantial service" as defined by the FCC. Recent applications to renew or extend construction deadlines for 39 GHz licenses expiring in 2009 and 2010 have been granted by the FCC. The licenses subject to the renewals or extensions or both, represent over 1.15 billion spectrum Points of Presence, or PoPs, in total.
To obtain renewal of a license, the licensee must demonstrate that, at the time of renewal, it either met a "safe harbor" build-out requirement or that it has provided "substantial service" as determined by the FCC. What level of service is considered "substantial" will vary depending upon the type of product offering by the licensee. The FCC has provided specific safe harbor guidance only for
99
FIBERTOWER CORPORATION
Notes to Consolidated Financial Statements (Continued)
Note 15—Guarantees and Other Contingencies (Continued)
point-to-point offerings, where it has indicated the licensee should have constructed four links per channel per million persons in the license area. Licensees may show that they have met the substantial service test in other ways, such as providing niche services or offering service to underserved consumers.
Licensees are required, prior to the expiration date of their licenses, to file renewal applications with an exhibit demonstrating compliance with the substantial service criteria. If an entity is deemed not to have provided substantial service through meeting the safe harbor build-out requirement or through other means with respect to a license for which renewal is sought, the renewal will not be granted and the license will expire. We are required, or expect to be required, to demonstrate substantial service by June 1, 2012 for the majority of our 39 GHz licenses. We are required to demonstrate substantial service for all of our 24 GHz licenses by February 1, 2011, except for one, which requires such a showing in 2014. We do not currently meet the substantial service safe harbor guidance provided by the FCC for the substantial majority of our 24 GHz and 39 GHz licenses, which require renewal applications or showings mostly in the 2011 – 2012 time period. We believe that our licenses will be renewed based on our significant network investment, spectrum offerings and expanding geographic coverage. However, since we are required to demonstrate substantial service at the time licenses are renewed, the FCC has little precedent in the 24 GHz and 39 GHz bands, and determination of substantial service is subject to FCC discretion, the FCC could choose to not renew licenses that do not meet the substantial service safe harbor.
We continue to meet regularly with the FCC and are committed to present data on our significant network investment and expanding geographic coverage to make the spectrum bands viable and able to provide substantial service at renewal and in the long term. We continue to believe that we will meet the substantial service requirements necessary for renewal at the appropriate deadlines and will continue to engage the FCC on this subject.
Other guarantees—From time to time, we enter into certain types of contracts that contingently require us to indemnify various parties against claims from third parties. These contracts primarily relate to: (i) certain real estate leases, under which we may be required to indemnify property owners for environmental and other liabilities and for other claims arising from our use of the applicable premises; (ii) certain agreements with our officers, directors and employees, under which we may be required to indemnify such persons for liabilities arising out of the performance of their duties; (iii) contracts under which we may be required to indemnify customers against third-party claims that a FiberTower product or service infringes a patent, copyright or other intellectual property right; and (iv) procurement or license agreements under which we may be required to indemnify licensors or vendors for certain claims that may be brought against them arising from our acts or omissions with respect to the supplied products or technology.
Generally, a maximum obligation under these contracts is not explicitly stated. Because the obligated amounts associated with these types of agreements are not explicitly stated, the overall maximum amount of the obligation cannot be reasonably estimated. Historically, we have not been required to make payments under these obligations, and no liabilities have been recorded for these obligations in our Consolidated Balance Sheets.
100
FIBERTOWER CORPORATION
Notes to Consolidated Financial Statements (Continued)
Note 15—Guarantees and Other Contingencies (Continued)
Legal proceedings—We are subject to certain legal proceedings and claims in the ordinary course of business. In the opinion of management, the ultimate outcome of these matters will not have a material impact on our financial position or results of operations.
Note 16—Selected Quarterly Financial Information (Unaudited)
FiberTower's 2009 and 2008 unaudited selected consolidated quarterly financial information is as follows (in thousands except per share amounts):
| |
Quarters Ended | ||||||||||||
|---|---|---|---|---|---|---|---|---|---|---|---|---|---|
| |
March 31 | June 30 | September 30 | December 31 | |||||||||
2009 |
|||||||||||||
Service revenues |
$ | 14,719 | $ | 15,579 | $ | 16,213 | $ | 16,733 | |||||
Cost of service revenues |
$ | 14,141 | $ | 14,158 | $ | 14,672 | $ | 15,249 | |||||
Loss from operations |
$ | (13,581 | ) | $ | (11,255 | ) | $ | (11,810 | ) | $ | (17,638 | ) | |
Net income (loss) |
$ | 26,712 | $ | 20,791 | $ | (21,843 | ) | $ | (27,798 | ) | |||
Basic net income (loss) per share attributable to common stockholders |
$ | 1.76 | $ | 1.37 | $ | (1.44 | ) | $ | (1.53 | ) | |||
Diluted net income (loss) per share attributable to common stockholders |
$ | 1.76 | $ | 1.36 | $ | (1.44 | ) | $ | (1.53 | ) | |||
2008 |
|||||||||||||
Service revenues |
$ | 9,706 | $ | 11,868 | $ | 13,383 | $ | 14,270 | |||||
Cost of service revenues |
$ | 21,037 | $ | 24,797 | $ | 16,704 | $ | 17,270 | |||||
Loss from operations |
$ | (110,741 | ) | $ | (31,498 | ) | $ | (15,399 | ) | $ | (70,218 | ) | |
Net loss |
$ | (120,000 | ) | $ | (41,464 | ) | $ | (25,675 | ) | $ | (62,690 | ) | |
Basic and diluted net loss per share attributable to common stockholders |
$ | (8.08 | ) | $ | (2.74 | ) | $ | (1.70 | ) | $ | (4.16 | ) | |
Loss from operations and net income (loss) included the following charges and benefits (in thousands except per share amounts):
| |
Quarters Ended | ||||||||||||
|---|---|---|---|---|---|---|---|---|---|---|---|---|---|
| |
March 31 | June 30 | September 30 | December 31 | |||||||||
2009 |
|||||||||||||
Gain on early extinguishment of debt, net |
$ | 53,671 | $ | 44,577 | $ | — | $ | — | |||||
2008 |
|||||||||||||
Impairment of long-lived assets and other charges |
$ | (4,816 | ) | $ | (8,617 | ) | $ | (885 | ) | $ | (2,121 | ) | |
Restructuring charges |
$ | — | $ | (5,524 | ) | $ | (438 | ) | $ | (125 | ) | ||
Impairment of FCC Licenses |
$ | — | $ | — | $ | — | $ | (54,505 | ) | ||||
Impairment of goodwill |
$ | (86,093 | ) | $ | — | $ | — | $ | — | ||||
Income tax benefit |
$ | — | $ | — | $ | — | $ | 20,189 | |||||
101
ITEM 9. CHANGES IN AND DISAGREEMENTS WITH ACCOUNTANTS ON ACCOUNTING AND FINANCIAL DISCLOSURE
We do not have any disagreements with our accountants on accounting and financial disclosure matters.
ITEM 9A. CONTROLS AND PROCEDURES
(a) Evaluation of disclosure controls and procedures
As of December 31, 2009, our management carried out an evaluation under the supervision and with the participation of our Chief Executive Officer ("CEO") and Chief Financial Officer ("CFO"), of the effectiveness of the design and operation of our disclosure controls and procedures pursuant to Rules 13a-15(e) and 15d-15(e) under the Securities Exchange Act of 1934 ("Exchange Act"). Based on this evaluation, our CEO and CFO have concluded that our disclosure controls and procedures are effective at the reasonable assurance level to ensure that information required to be disclosed in our reports filed under the Exchange Act, such as this Form 10-K, (i) is recorded, processed, summarized and reported, within the time periods specified in the SEC's rules and forms, and (ii) is accumulated and communicated to FiberTower's management, including its principal executive and principal financial officers, or persons performing similar functions, as appropriate to allow timely decisions regarding required disclosure. Our disclosure controls and procedures are designed to provide reasonable assurance that such information is accumulated and communicated to our management.
(b) Management's Report on Internal Control over Financial Reporting
Our management is responsible for establishing and maintaining effective internal control over financial reporting (as defined in Rule 13a-15(f) under the Securities Exchange Act of 1934, as amended). Our management assessed the effectiveness of our internal control over financial reporting as of December 31, 2009. In making this assessment, our management used the criteria set forth by the Committee of Sponsoring Organizations of the Treadway Commission ("COSO") in Internal Control—Integrated Framework. Our management has concluded that, as of December 31, 2009, our internal control over financial reporting is effective to provide reasonable assurance regarding the reliability of financial reporting and the preparation of financial statements for external purposes in accordance with generally accepted accounting principles. Our independent registered public accounting firm, Ernst & Young, LLP, has issued an audit report on our internal control over financial reporting, which is included at Item 9A(d) below.
Our management, including our Chief Executive Officer and Chief Financial Officer, does not expect that our disclosure controls and procedures or our internal control over financial reporting will necessarily prevent all errors and all fraud. A control system, no matter how well conceived and operated, can provide only reasonable, not absolute, assurance that the objectives of the control system are met. Further, the design of a control system must reflect the fact that there are resource constraints, and the benefits of controls must be considered relative to their costs. Because of the inherent limitations in all control systems, no evaluation of controls can provide absolute assurance that all control issues and instances of fraud, if any, within FiberTower have been detected.
(c) Changes in Internal Control over Financial Reporting
During the quarter ended December 31, 2009, there were no changes in our internal control over financial reporting that have materially affected, or are reasonably likely to materially affect, our internal control over financial reporting.
102
(d) Report of Independent Registered Public Accounting Firm on Internal Control Over Financial Reporting
The
Board of Directors and Stockholders
FiberTower Corporation
We have audited FiberTower Corporation's internal control over financial reporting as of December 31, 2009, based on criteria established in Internal Control—Integrated Framework issued by the Committee of Sponsoring Organizations of the Treadway Commission (the COSO criteria). FiberTower Corporation's management is responsible for maintaining effective internal control over financial reporting and for its assessment of the effectiveness of internal control over financial reporting included in the accompanying Management's Report on Internal Control over Financial Reporting. Our responsibility is to express an opinion on the Company's internal control over financial reporting based on our audit.
We conducted our audit in accordance with the standards of the Public Company Accounting Oversight Board (United States). Those standards require that we plan and perform the audit to obtain reasonable assurance about whether effective internal control over financial reporting was maintained in all material respects. Our audit included obtaining an understanding of internal control over financial reporting, assessing the risk that a material weakness exists, testing and evaluating the design and operating effectiveness of internal control based on the assessed risk, and performing such other procedures as we considered necessary in the circumstances. We believe that our audit provides a reasonable basis for our opinion.
A company's internal control over financial reporting is a process designed to provide reasonable assurance regarding the reliability of financial reporting and the preparation of financial statements for external purposes in accordance with generally accepted accounting principles. A company's internal control over financial reporting includes those policies and procedures that (1) pertain to the maintenance of records that, in reasonable detail, accurately and fairly reflect the transactions and dispositions of the assets of the company; (2) provide reasonable assurance that transactions are recorded as necessary to permit preparation of financial statements in accordance with generally accepted accounting principles, and that receipts and expenditures of the company are being made only in accordance with authorizations of management and directors of the company; and (3) provide reasonable assurance regarding prevention or timely detection of unauthorized acquisition, use, or disposition of the company's assets that could have a material effect on the financial statements.
Because of its inherent limitations, internal control over financial reporting may not prevent or detect misstatements. Also, projections of any evaluation of the effectiveness to future periods are subject to the risk that controls may become inadequate because of changes in conditions, or that the degree of compliance with the policies or procedures may deteriorate.
In our opinion, FiberTower Corporation maintained, in all material respects, effective internal control over financial reporting as of December 31, 2009, based on the COSO criteria.
We have also audited, in accordance with the standards of the Public Company Accounting Oversight Board (United States), the consolidated balance sheets of FiberTower Corporation as of December 31, 2009 and 2008, and the related consolidated statements of operations, stockholders' equity, and cash flows for each of the three years in the period ended December 31, 2009 of FiberTower Corporation and our report dated March 12, 2010 expressed an unqualified opinion thereon.
| /s/ Ernst & Young LLP |
San
Francisco, California
March 12, 2010
103
The shares of common stock described below have not been adjusted for the 1-for-10 reverse stock split which occurred December 18, 2009.
We held a Special Meeting of Stockholders on December 15, 2009 (the "Special Meeting"), to approve the issuance, on a pre-1-for-10 reverse stock split basis, of up to 336,738,828 shares of common stock (subject to adjustment as described in the Proxy Statement for the Special Meeting) upon the Mandatory Redemption of the Interim Notes and to approve the adjournment of the Special Meeting, if necessary or appropriate, in order to allow for the solicitation of additional proxies.
The Board of Directors solicited proxies for the Special Meeting pursuant to Regulation 14 under the Securities Act.
Stockholders approved the issuance of up to 336,738,828 shares of common stock (subject to adjustment as described in the Proxy Statement for the Special Meeting) upon the Mandatory Redemption of the Interim Notes based on the following vote tabulation:
| For | Against | Abstentions | ||||||
|---|---|---|---|---|---|---|---|---|
| 76,854,170 | 17,245,911 | 68,679 | ||||||
Stockholders approved the adjournment of the Special Meeting, if necessary or appropriate, in order to allow for the solicitation of additional proxies based on the following vote tabulation:
| For | Against | Abstentions | ||||||
|---|---|---|---|---|---|---|---|---|
| 83,308,672 | 10,737,339 | 122,749 | ||||||
ITEM 10. DIRECTORS, EXECUTIVE OFFICERS AND CORPORATE GOVERNANCE
The information regarding Directors, Executive Officers and Corporate Governance required by Item 10 is incorporated by reference to our proxy statement for our 2010 Annual Meeting of Stockholders, which we refer to as our 2010 Proxy Statement.
ITEM 11. EXECUTIVE COMPENSATION
The information regarding Executive Compensation required by Item 11 is incorporated by reference to our 2010 Proxy Statement.
ITEM 12. SECURITY OWNERSHIP OF CERTAIN BENEFICIAL OWNERS AND MANAGEMENT AND RELATED STOCKHOLDER MATTERS
The information regarding Security Ownership of Certain Beneficial Owners and Management and Related Stockholder Matters required by Item 12 is incorporated by reference to our 2010 Proxy Statement.
ITEM 13. CERTAIN RELATIONSHIPS AND RELATED TRANSACTIONS, AND DIRECTOR INDEPENDENCE
The information regarding Certain Relationships and Related Transactions and Director Independence required by Item 13 is incorporated by reference to our 2010 Proxy Statement.
104
ITEM 14. PRINCIPAL ACCOUNTANT FEES AND SERVICES
The information regarding Principal Accountant Fees and Services required by Item 14 is incorporated by reference to our 2010 Proxy Statement.
ITEM 15. EXHIBITS AND FINANCIAL STATEMENT SCHEDULES
- 1.
- Financial
Statements: See "Index to Consolidated Financial Statements" in Part II, Item 8 of this Form 10-K.
- 2.
- Financial
Statement Schedules: All schedules are omitted because the required information is inapplicable, immaterial, or the information is presented in the
consolidated financial statements and notes thereto in Item 8 of this Form 10-K.
- 3.
- Exhibits: The exhibits listed in the accompanying exhibit index are filed, furnished or incorporated by reference as part of this Form 10-K.
105
Pursuant to the requirements of Section 13 or 15(d) of the Securities Exchange Act of 1934, the registrant has duly caused this report to be signed on its behalf by the undersigned, thereunto duly authorized.
| FIBERTOWER CORPORATION | ||||
Date: March 12, 2010 |
By: |
/s/ THOMAS A. SCOTT Thomas A. Scott Chief Financial Officer |
||
Pursuant to the requirements of the Securities Exchange Act of 1934, this report has been signed below by the following persons on behalf of the registrant and in the capacities and on the dates indicated.
| |
|
|
||
|---|---|---|---|---|
/s/ KURT J. VAN WAGENEN |
President, Chief Executive Officer and Director (Principal Executive Officer) |
March 12, 2010 | ||
/s/ THOMAS A. SCOTT |
Senior Vice President and Chief Financial Officer (Principal Financial and Accounting Officer) |
March 12, 2010 |
||
/s/ JOHN P. KELLY |
Chairman and Director |
March 12, 2010 |
||
/s/ JOHN K. BRANIFF |
Director |
March 12, 2010 |
||
/s/ RANDALL A. HACK |
Director |
March 12, 2010 |
||
/s/ MARK E. HOLLIDAY |
Director |
March 12, 2010 |
||
/s/ PHILIP M. KELLEY |
Director |
March 12, 2010 |
||
/s/ STEVEN D. SCHEIWE |
Director |
March 12, 2010 |
106
| Exhibit No. | Exhibit | ||
|---|---|---|---|
| 2.1 | Agreement and Plan of Merger, dated May 14, 2006, among First Avenue Networks, Inc., FiberTower Corporation and Marlin Acquisition Corporation (incorporated by reference to Registrant's current report on Form 8-K filed on May 18, 2006). | ||
3.1 |
Restated Certificate of Incorporation of the Registrant dated August 29, 2006 (incorporated by reference to Annex C to the Registrant's definitive information statement on Schedule 14C filed on July 25, 2006). |
||
3.2 |
Bylaws of the Registrant (incorporated by reference to Exhibit 3.1 to the Registrant's current report on Form 8-K filed on August 3, 2007). |
||
3.3 |
Amendment to Bylaws (incorporated by reference to Exhibit 3.1 to the Registrant's current report on Form 8-K filed on January 22, 2008). |
||
4.1 |
Specimen of Common Stock Certificate (incorporated by reference to the Registrant's registration statement on Form S-8 (Reg. No. 333-137040) filed on August 31, 2006). |
||
4.2 |
Indenture, dated as of November 9, 2006, among FiberTower Corporation, as issuer, the guarantors named therein, and Wells Fargo Bank, National Association, as trustee (incorporated by reference to Exhibit 4.1 to the Registrant's current report on Form 8-K filed on November 15, 2006). |
||
4.3 |
First Supplemental Indenture, dated as of December 7, 2009, to Indenture, dated as of November 9, 2006, among FiberTower Corporation, as issuer, the guarantors named therein, and Wells Fargo Bank, National Association, as trustee (incorporated by reference to Exhibit 4.4 to the Registrant's current report on Form 8-K filed on December 11, 2009). |
||
†4.4 |
Second Supplemental Indenture, dated as of December 16, 2009, to Indenture, dated as of November 9, 2006, among FiberTower Corporation, as issuer, the guarantors named therein, and Wells Fargo Bank, National Association, as trustee. |
||
4.5 |
Form of 9.00% Convertible Senior Secured Notes due 2012, including the form of Guarantee (incorporated by reference to Exhibits A and E to Exhibit 4.1 to the Registrant's current report on Form 8-K filed on November 15, 2006). |
||
4.6 |
Pledge and Security Agreement, dated as of November 9, 2006, among FiberTower Corporation, the subsidiary grantors named therein, and Wells Fargo Bank, National Association, as collateral agent (incorporated by reference Exhibit 10.4 to the Registrant's current report on Form 8-K filed on November 15, 2006). |
||
†4.7 |
First Amendment to Pledge and Security Agreement, dated as of December 7, 2009, among FiberTower Corporation, the subsidiary grantors named therein, and Wells Fargo Bank, National Association (as collateral agent). |
||
4.8 |
Indenture, dated as of December 7, 2009, among FiberTower Corporation, as issuer, the guarantors named therein, and Wells Fargo Bank, National Association, as trustee (incorporated by reference to Exhibit 4.1 to the Registrant's current report on Form 8-K filed on December 11, 2009). |
||
†4.9 |
First Supplemental Indenture, dated as of December 16, 2009, to Indenture, dated as of December 7, 2009, among FiberTower Corporation, as issuer, the guarantors named therein, and Wells Fargo Bank, National Association, as trustee. |
||
107
| Exhibit No. | Exhibit | ||
|---|---|---|---|
| 4.10 | Form of 9.00% Mandatorily Redeemable Convertible Senior Secured Note due 2012, including the form of Guarantee (incorporated by reference to Exhibits A and E to Exhibit 4.1 to the Registrant's current report on Form 8-K filed on December 11, 2009). | ||
†4.11 |
Collateral Agreement, dated as of December 7, 2009, among FiberTower Corporation, the subsidiaries of FiberTower Corporation from time to time party thereto, and Wells Fargo Bank, National Association, as collateral agent. |
||
†4.12 |
Omnibus Intercreditor Agreement, dated as of December 7, 2009, among Wells Fargo Bank, National Association, in the capacities described therein, FiberTower Corporation, and the subsidiaries of FiberTower Corporation party thereto. |
||
†4.13 |
Amended and Restated Intercreditor Agreement, dated as of December 7, 2009, among Wells Fargo Bank, National Association, in the capacities described therein, FiberTower Corporation, and the subsidiaries of FiberTower Corporation party thereto. |
||
4.14 |
Indenture, dated as of December 22, 2009, among FiberTower Corporation, as issuer, the guarantors named therein, and Wells Fargo Bank, National Association, as trustee (incorporated by reference to Exhibit 4.1 to the Registrant's current report on Form 8-K filed on December 29, 2009). |
||
4.15 |
Form of 9.00% Senior Secured Note due 2016, including the form of Guarantee (incorporated by reference to Exhibits A and D to Exhibit 4.1 to the Registrant's current report on Form 8-K filed on December 29, 2009). |
||
†4.16 |
Collateral Agreement, dated as of December 22, 2009, among FiberTower Corporation, the subsidiaries of FiberTower Corporation from time to time party thereto, and Wells Fargo Bank, National Association, as collateral agent. |
||
†4.17 |
Amended and Restated Intercreditor Agreement, dated as of December 22, 2009, among Wells Fargo Bank, National Association, in the capacities described therein, FiberTower Corporation, and the subsidiaries of FiberTower Corporation party thereto. |
||
4.18 |
Registration Rights Agreement, dated as of December 22, 2009, among FiberTower Corporation, the subsidiaries of FiberTower Corporation party thereto, and the noteholders party thereto (incorporated by reference to Exhibit 10.1 to the Registrant's current report on Form 8-K filed on December 29, 2009). |
||
10.1 |
Form of Common Stock Purchase Warrant issued to Tejas Securities Group, Inc. (incorporated by reference to Exhibit 10.5 to the Registrant's annual report on Form 10-K for the year ended December 31, 2004). |
||
*10.2 |
Form of Stock Option Agreement under First Avenue Networks, Inc. Stock Incentive Plan (incorporated by reference to Exhibit 4.11 to the Registrant's registration statement on Form S-8 (Reg. No. 333-137040) filed on August 31, 2006). |
||
*10.3 |
Form of Restricted Stock Agreement under First Avenue Networks, Inc. Stock Incentive Plan (incorporated by reference to Exhibit 10.11 to the Registrant's annual report on Form 10-K for the year ended December 31, 2006). |
||
*10.4 |
FiberTower Corporation Amended and Restated Stock Option Plan (incorporated by reference to Exhibit 4.9 to the Registrant's registration statement on Form S-8 (Reg. No. 333-137040) filed on August 31, 2006). |
||
108
| Exhibit No. | Exhibit | ||
|---|---|---|---|
| *10.5 | Form of Stock Option Agreement under FiberTower Corporation Amended and Restated Stock Option Plan (incorporated by reference to Exhibit 4.10 to the Registrant's registration statement on Form S-8 (Reg. No. 333-137040) filed on August 31, 2006). | ||
*10.6 |
Amended and Restated FiberTower Corporation Stock Incentive Plan as amended as of November 12, 2008. |
||
*10.7 |
Letter Agreement, dated February 11, 2008, by and between the Company and Thomas A. Scott (incorporated by reference to Exhibit 10.1 to the Registrant's current report on Form 8-K filed on February 13, 2008). |
||
*10.8 |
Waiver of Acceleration of Benefits Upon Change of Control, dated December 16, 2009, by and between FiberTower Corporation and Thomas A. Scott (incorporated by reference to Exhibit 10.2 to the Registrant's current report on Form 8-K filed on December 21, 2009). |
||
*10.9 |
Letter Agreement, dated February 11, 2008, by and between the Company and Ravi Potharlanka (incorporated by reference to Exhibit 10.2 to the Registrant's current report on Form 8-K filed on February 13, 2008). |
||
*10.10 |
Waiver of Acceleration of Benefits Upon Change of Control, dated December 16, 2009, by and between FiberTower Corporation and Ravi Potharlanka (incorporated by reference to Exhibit 10.3 to the Registrant's current report on Form 8-K filed on December 21, 2009). |
||
*10.11 |
Executive Employment Agreement, dated April 9, 2008, between Kurt J. Van Wagenen and FiberTower Corporation (incorporated by reference to Exhibit 10.1 to the Registrant's current report on Form 8-K filed on April 14, 2008). |
||
*10.12 |
Letter Agreement, dated April 9, 2008, between Kurt J. Van Wagenen and FiberTower Corporation (incorporated by reference to Exhibit 10.2 to the Registrant's current report on Form 8-K filed on April 14, 2008). |
||
*10.13 |
Waiver of Acceleration of Benefits Upon Change of Control, dated December 16, 2009, by and between FiberTower Corporation and Kurt J. Van Wagenen (incorporated by reference to Exhibit 10.1 to the Registrant's current report on Form 8-K filed on December 21, 2009). |
||
*10.14 |
Separation Agreement and General Release, dated August 28, 2008, between Michael Finlayson and FiberTower Corporation. |
||
10.15 |
Form of Indemnification Agreement with Directors |
||
†21.1 |
List of subsidiaries |
||
†23.1 |
Consent of Independent Registered Public Accounting Firm |
||
†31.1 |
Certification of Chief Executive Officer Pursuant to Rule 13a-14(a) of the Securities Exchange Act of 1934, as amended |
||
†31.2 |
Certification of Chief Financial Officer Pursuant to Rule 13a-14(a) of the Securities Exchange Act of 1934, as amended |
||
†32.1 |
Certification of the Chief Executive Officer Pursuant to Rule 13a-14(b) of the Exchange Act and 18 U.S.C. Section 1350, as Adopted Pursuant to Section 906 of the Sarbanes-Oxley Act of 2002 |
||
109
| Exhibit No. | Exhibit | ||
|---|---|---|---|
| †32.2 | Certification of the Chief Financial Officer Pursuant to Rule 13a-14(b) of the Exchange Act and 18 U.S.C. Section 1350, as Adopted Pursuant to Section 906 of the Sarbanes-Oxley Act of 2002 | ||
- †
- Filed
herewith
- *
- Management contracts or compensation plans or arrangements in which directors or executive officers are eligible to participate.
110