Attached files
| file | filename |
|---|---|
| 8-K - 8-K - FEDERAL HOME LOAN MORTGAGE CORP | f71549e8vk.htm |
| EX-99.2 - EXHIBIT 99.2 - FEDERAL HOME LOAN MORTGAGE CORP | f71549exv99w2.htm |
| EX-99.3 - EXHIBIT 99.3 - FEDERAL HOME LOAN MORTGAGE CORP | f71549exv99w3.htm |
Exhibit 99.1

|
News Release |
FOR
IMMEDIATE RELEASE
May 4, 2011
MEDIA CONTACT: Michael Cosgrove
703-903-2123
INVESTOR CONTACT: Linda Eddy
571-382-4732
May 4, 2011
MEDIA CONTACT: Michael Cosgrove
703-903-2123
INVESTOR CONTACT: Linda Eddy
571-382-4732
FREDDIE
MAC REPORTS FIRST QUARTER 2011 FINANCIAL RESULTS
No
Additional Funding from Treasury Required for the First
Quarter
Pays U.S.
Treasury $1.6 Billion in Quarterly Dividends
Helps to
Finance Housing for over 510,000 American Families
| • | Net income of $676 million, mainly reflecting: |
| • | Net interest income of $4.5 billion; partially offset by | |
| • | Provision for credit losses of $2.0 billion; | |
| • | Net security impairments of $1.2 billion; and | |
| • | Derivative losses of $0.4 billion. |
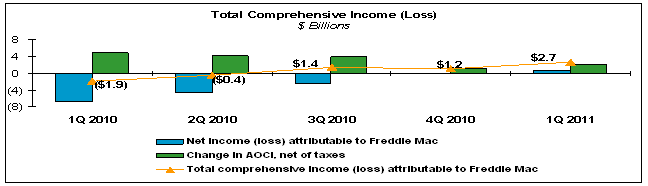
| • | Total comprehensive income of $2.7 billion, consisting of: |
| • | Net income of $676 million; and | |
| • | Improvement in accumulated other comprehensive income (loss) of $2.1 billion. |
| • | The company had positive net worth of $1.2 billion at March 31, 2011; as a result, no additional funding from Treasury was required for the first quarter of 2011. | |
| • | New single-family business acquired in 2009, 2010 and 2011 continues to demonstrate strong credit quality based on borrower credit scores and loan-to-value ratios at origination. | |
| • | Single-family serious delinquency rate of 3.63 percent at March 31, 2011, compared to 3.84 percent at December 31, 2010, remains below industry benchmarks. | |
| • | Foreclosure prevention efforts helped more than 62,000 borrowers avoid foreclosure in the first quarter of 2011. REO dispositions reached record levels in the first quarter with approximately 30,000 homes sold — two-thirds of which were sold to owner-occupants. |
McLean, VA — Freddie Mac (OTC:FMCC) today
reported net income of $676 million for the quarter ended
March 31, 2011, compared to a net loss of $113 million
for the quarter ended December 31, 2010. The company also
reported total comprehensive income of $2.7 billion in the
first quarter of 2011, compared to total comprehensive income of
$1.2 billion in the fourth quarter of 2010.
Beginning in the first quarter of 2011, Freddie Mac began
disclosing total comprehensive income on the face of its
Consolidated Statements of Income and Comprehensive Income. The
components of
Freddie Mac First Quarter 2011 Financial Results
May 4, 2011
Page 2
May 4, 2011
Page 2
total comprehensive income help show the drivers of Freddie
Mac’s net worth (deficit) and the company’s potential
need for additional draws under the Senior Preferred Stock
Purchase Agreement (Purchase Agreement), including the relative
contribution of financial results and dividend payments to
Freddie Mac’s net worth (deficit). Total comprehensive
income (loss) is equal to net income (loss) plus the change in
accumulated other comprehensive income (loss), net of taxes
(AOCI), which is the section of the balance sheet where the
company records a portion of its mark-to-market changes on its
available-for-sale (AFS) securities. The AOCI component of
comprehensive income can vary significantly from period to
period primarily due to changes in interest rates and mortgage
spreads on the company’s AFS securities and other factors.
In the first quarter of 2011, total comprehensive income was
$2.7 billion, reflecting quarterly net income of
$676 million and an increase in AOCI of $2.1 billion.
|
Freddie Mac’s positive net worth of $1.2 billion at
March 31, 2011 reflects total comprehensive income of
$2.7 billion for the first quarter of 2011 and the
$500 million received from Treasury to eliminate the net
worth deficit for the fourth quarter of 2010, which were
partially offset by a quarterly dividend payment to Treasury of
$1.6 billion on the company’s senior preferred stock.
As a result of the positive net worth, no additional funding
from Treasury was required for the first quarter under the terms
of the Purchase Agreement. The table below shows Freddie
Mac’s requested draws from Treasury and dividend payments
to Treasury since entering conservatorship.
|
Cumulative |
||||||||||||||||||||
| ($ in billions) | FY 2008 | FY 2009 | FY 2010 | 1Q11 | Total | |||||||||||||||
|
Treasury draw
request(1)
|
$ | 45.6 | (2) | $ | 6.1 | $ | 13.0 | $ | 0 | $ | 64.7 | |||||||||
|
Dividend
payment(3)
|
$ | 0.2 | $ | 4.1 | $ | 5.7 | $ | 1.6 | $ | 11.6 | ||||||||||
| (1) | Represents the total draws requested based on Freddie Mac’s quarterly net worth deficits for the periods presented. Draw requests are funded in the quarter after they are requested. |
| (2) | Includes requested Treasury draws for 2008 and the initial liquidation preference of Freddie Mac’s senior preferred stock of $1.0 billion. |
| (3) | Represents total quarterly cash dividends paid by Freddie Mac for the periods presented. Treasury is entitled to receive cumulative quarterly cash dividends at the annual rate of 10% per year on the liquidation preference of the senior preferred stock. |
Freddie Mac First Quarter 2011 Financial Results
May 4, 2011
Page 3
May 4, 2011
Page 3
“During the first quarter, Freddie Mac continued to work
with our conservator to strengthen our company, focusing on
initiatives that we expect will deliver long-term benefits to
the housing finance system and preserve the taxpayers’
investment,” said Freddie Mac Chief Executive Officer
Charles E. Haldeman, Jr. “We made further progress on
our company-wide efficiency initiatives this quarter, continuing
the solid trend of cost savings that began early last year. At
the same time, our support of the U.S. housing market
remained steadfast during this critical period, funding one out
of every four home loans originated and helping more than 62,000
struggling borrowers avoid foreclosure.
“Our outlook remains cautious. Continued improvements on
the employment front and in early-stage delinquencies were
positive signs during the quarter, but we believe large
inventories of unsold homes and a high number of distressed
sales will continue to put downward pressure on home prices in
many neighborhoods.”
Financial
Results
The company’s financial results for the first quarter of
2011 continued to be impacted by weakness in the
U.S. mortgage and credit markets. During the first quarter
of 2011, home prices decreased by an estimated 2.8 percent
nationwide, based on the company’s own index of its
single-family credit guarantee portfolio. In addition, long-term
interest rates increased by approximately 17 basis points.
Selected
Financial Data
| Three Months Ended | ||||||||||||||
| ($ in millions) | March 31, 2011 | December 31, 2010 | March 31, 2010 | |||||||||||
|
Net Income and Comprehensive Income
|
||||||||||||||
|
1
|
Net income (loss)
|
$ | 676 | $ | (113 | ) | $ | (6,688 | ) | |||||
|
2
|
Changes in AOCI, net of taxes
|
2,064 | 1,269 | 4,808 | ||||||||||
|
3
|
Total comprehensive income (loss) attributable to Freddie
Mac(1)
|
2,740 | 1,156 | (1,880 | ) | |||||||||
|
|
||||||||||||||
|
Credit Quality (at period end, except for
Net charge-offs) |
||||||||||||||
|
4
|
Net charge-offs
|
$ | 2,981 | $ | 2,897 | $ | 2,769 | |||||||
|
5
|
as a % of average total mortgage
portfolio(2)
(annualized)
|
0.62 | % | 0.61 | % | 0.56 | % | |||||||
|
6
|
Non-performing
assets(3)
|
$ | 124,438 | $ | 125,405 | $ | 117,270 | |||||||
|
7
|
as a % of total mortgage
portfolio(2)
|
6.4 | % | 6.4 | % | 5.9 | % | |||||||
|
8
|
Loan loss reserves
|
$ | 39,305 | $ | 39,926 | $ | 36,811 | |||||||
|
9
|
as a % of total mortgage
portfolio(2)
|
2.02 | % | 2.03 | % | 1.85 | % | |||||||
|
10
|
Single-family serious delinquency rate
|
3.63 | % | 3.84 | % | 4.13 | % | |||||||
|
11
|
Multifamily delinquency rate
|
0.36 | % | 0.26 | % | 0.22 | % | |||||||
| (1) | Equals the total of Net income (loss) (line 1) and Changes in AOCI, net of taxes (line 2). |
| (2) | Excludes non-Freddie Mac securities. |
| (3) | Consists of the unpaid principal balance (UPB) of single-family and multifamily loans that have undergone a troubled debt restructuring, single-family seriously delinquent loans, multifamily loans that are three or more payments past due or in the process of foreclosure, and real estate owned (REO) assets, net. Non-performing assets also include multifamily loans that are deemed impaired based on management judgment. |
Freddie Mac First Quarter 2011 Financial Results
May 4, 2011
Page 4
May 4, 2011
Page 4
Net interest income was $4.5 billion for the first
quarter of 2011, compared to $4.3 billion for the fourth
quarter of 2010. Net interest income principally consists of the
net spread between the company’s mortgage-related
investments portfolio and the unsecured debt which funds those
investments. Net interest yield, which represents net interest
income expressed as an annualized percentage of average
interest-earning assets, was 79 basis points for the first
quarter of 2011, compared to 75 basis points for the fourth
quarter of 2010. The increases in net interest income and net
interest yield were primarily due to decreased amortization
expense on mortgage loans held by consolidated trusts due to
slowing prepayments in the first quarter of 2011 and lower
funding costs driven by the replacement of long-term debt at
lower rates. These positive impacts were partially offset by
lower asset yields due to ongoing liquidations and purchases of
unsecuritized mortgage loans.
|
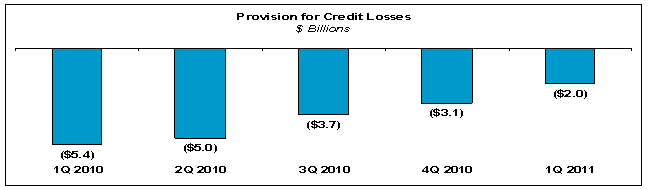
Provision for credit losses was $2.0 billion for the
first quarter of 2011, compared to $3.1 billion for the
fourth quarter of 2010, marking several consecutive quarterly
declines. The company’s loan loss reserve balance (which
represents its estimate of probable incurred losses on loans
within its single-family credit guarantee portfolio and
multifamily mortgage portfolio) is increased by the provision
for credit losses and reduced by charge-offs. The decrease in
the first quarter 2011 provision was mostly driven by a decrease
in delinquent loan inflows and a decline in the rate at which
delinquent loans ultimately transition to a loss event.
|
Freddie Mac First Quarter 2011 Financial Results
May 4, 2011
Page 5
May 4, 2011
Page 5
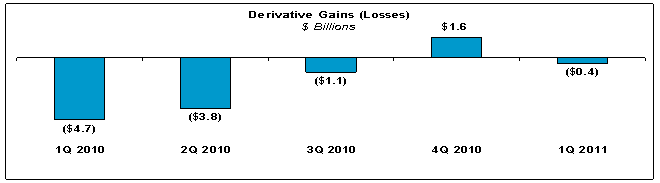
Derivative gains (losses) for the first quarter of 2011
was a loss of $0.4 billion, compared to a gain of
$1.6 billion for the fourth quarter of 2010. Derivatives
are used to reduce Freddie Mac’s exposure to interest-rate
risk but they generally increase the volatility of earnings
because fair value changes on the company’s derivative
portfolio are included in earnings while fair value changes
associated with several of the types of assets and liabilities
being hedged are not. The change in derivative gains (losses)
reflects lower gains on the net pay-fixed swap portfolio,
partially offset by decreased losses on the net call swaption
portfolio, as long-term interest rates increased less during the
first quarter of 2011 than during the fourth quarter of 2010.
|
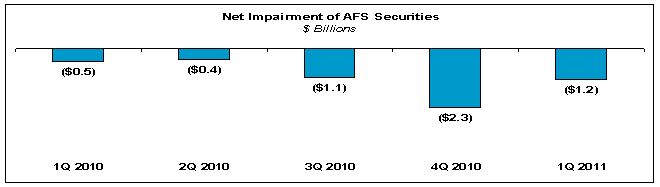
Net impairment of AFS securities recognized in earnings
for the first quarter of 2011 was $1.2 billion,
compared to $2.3 billion for the fourth quarter of 2010.
When Freddie Mac determines a decrease in the fair value of an
AFS security is other-than-temporary, the credit-related portion
of the impairment is recognized in earnings, while the
non-credit-related portion of the impairment is recorded in
AOCI. The decrease in net impairments for the first quarter of
2011 was primarily due to a smaller negative impact from
declining home prices and increasing interest rates in the first
quarter of 2011 as compared to the fourth quarter of 2010.
|
REO operations expense for the first quarter of 2011 was
$257 million, compared to $217 million for the fourth
quarter of 2010. REO operations expense primarily consists of
expenses incurred to
Freddie Mac First Quarter 2011 Financial Results
May 4, 2011
Page 6
May 4, 2011
Page 6
maintain foreclosed properties, valuation adjustments on
properties, disposition gains or losses, and recoveries.
Change in AOCI, net of taxes was an improvement of
$2.1 billion for the first quarter of 2011, compared to an
improvement of $1.3 billion for the fourth quarter of 2010.
The larger improvement in the first quarter of 2011 reflects a
smaller unfavorable interest-rate impact on AFS securities as
long-term rates increased less in the first quarter of 2011 as
compared to the fourth quarter of 2010.
Supporting
the Nation’s Housing Market
Freddie Mac continues to support the nation’s housing
market by providing America’s families with access to
affordable homeownership and rental housing and helping
struggling borrowers avoid foreclosure.
Providing Liquidity - Freddie Mac remains a major and
consistent source of affordable mortgage funding —
purchasing or guaranteeing one out of every four home loans. In
the first quarter, the company provided approximately
$105 billion in liquidity to the mortgage market, helping
to finance over 430,000 conforming single-family loans and
nearly 83,000 units of rental housing.
Responsible Lending - Freddie Mac continues to advance
responsible lending practices, creating sustainable
homeownership opportunities for America’s families and
lowering losses for the company and taxpayers. This effort
includes strengthening single-family underwriting standards,
eliminating purchases of many higher-risk, non-traditional
mortgages, educating borrowers about the new lending environment
and improving quality and consistency in the mortgage process.
Foreclosure Prevention - Through its own workout programs
and the Home Affordable Modification Program, Freddie Mac
continued its foreclosure prevention efforts, helping more than
62,000 struggling borrowers avoid foreclosure in the first
quarter of 2011. Importantly, 83 percent of these borrowers
were able to retain their homes.
| For The Quarter Ended | ||||||||
| Single-Family Loan Workouts | 3/31/2011 | 12/31/2010 | ||||||
|
Loan
Modifications(1)
|
35,158 | 37,203 | ||||||
|
Repayment Plans
|
9,099 | 7,964 | ||||||
|
Forbearance Agreements
|
7,678 | 5,945 | ||||||
|
Short Sales &
Deed-in-lieu
Transactions
|
10,706 | 12,097 | ||||||
|
Total
|
62,641 | 63,209 | ||||||
| (1) | Includes completed loan modifications under HAMP. |
Freddie Mac First Quarter 2011 Financial Results
May 4, 2011
Page 7
May 4, 2011
Page 7
Credit
Quality
The company’s single-family credit guarantee portfolio
continues to experience significant credit losses, due in part
to the ongoing weakness in the U.S. economy. Since the
beginning of 2008, on an aggregate basis, the company has
recorded a provision for credit losses of $64.3 billion
associated with single-family loans and recorded an additional
$4.6 billion in losses on loans purchased from the
company’s PCs, net of recoveries. The majority of these
losses are associated with loans originated in 2005 through 2008.
New Single-Family Books of Business - Freddie Mac
believes that the credit quality of the single-family loans the
company acquired in 2009, 2010 and 2011 (excluding those
associated with the company’s relief refinance initiative)
is strong, as measured by original loan-to-value (LTV) ratios,
FICO scores, and income documentation standards.
At March 31, 2011, more than 40 percent of the
company’s single-family credit guarantee portfolio
consisted of mortgage loans originated in 2009, 2010 and 2011.
The company currently expects that, over time, the replacement
of older vintages should positively impact the serious
delinquency rates and credit-related expenses (equal to the
provision for credit losses and REO operations expense) on its
single-family credit guarantee portfolio. However, the rate at
which this replacement occurs has slowed in recent quarterly
periods, due to a decline in the volume of home purchase
mortgage originations and an increase in the proportion of
relief refinance mortgage activity. The table below provides
certain credit quality data by year of origination for the
company’s single-family credit guarantee portfolio.
Single-Family
Credit Guarantee Portfolio Data by Year of Origination
| As of March 31, 2011 | ||||||||||||||||||||
|
Average |
Serious |
|||||||||||||||||||
|
% of |
Credit |
Original |
Current |
Delinquency |
||||||||||||||||
| Portfolio | Score(1) | LTV Ratio | LTV Ratio(2) | Rate | ||||||||||||||||
|
Year of Origination
|
||||||||||||||||||||
|
2011
|
2 | % | 752 | 70 | % | 68 | % | — | % | |||||||||||
|
2010
|
20 | 755 | 70 | 70 | 0.07 | |||||||||||||||
|
2009
|
21 | 755 | 68 | 71 | 0.31 | |||||||||||||||
|
2008
|
8 | 727 | 74 | 88 | 4.91 | |||||||||||||||
|
2007
|
11 | 707 | 77 | 107 | 11.26 | |||||||||||||||
|
2006
|
8 | 711 | 75 | 106 | 10.34 | |||||||||||||||
|
2005
|
9 | 718 | 73 | 92 | 6.05 | |||||||||||||||
|
2004 and prior
|
21 | 721 | 71 | 59 | 2.47 | |||||||||||||||
|
Total
|
100 | % | 734 | 71 | 78 | 3.63 | ||||||||||||||
| (1) | Based on FICO score of the borrower as of the loan origination date and may not be indicative of the borrower’s creditworthiness at March 31, 2011. FICO scores can range between approximately 300 to 850 points. |
| (2) | Current market values are estimated by adjusting the value of the property at origination based on changes in the market value of homes since origination. |
Freddie Mac First Quarter 2011 Financial Results
May 4, 2011
Page 8
May 4, 2011
Page 8
Single-family serious delinquency rate for Freddie Mac
was 3.63 percent at March 31, 2011, compared to
3.84 percent at December 31, 2010. The total number of
single-family seriously delinquent loans declined during the
first quarter of 2011, but has remained high due to continued
weakness in home prices, persistently high unemployment,
extended foreclosure timelines, foreclosure suspensions in many
states, and challenges faced by servicers processing large
volumes of problem loans. By way of comparison, according to the
National Delinquency Survey compiled by the Mortgage Bankers
Association, the serious delinquency rate on first-lien
single-family loans in the U.S. mortgage market was
8.6 percent at December 31, 2010, which is the most
current data available.
Multifamily delinquency rate was 0.36 percent at
March 31, 2011, compared to 0.26 percent at
December 31, 2010. The largest percentage of the
company’s multifamily delinquent loans, based on UPB, are
located in Georgia and Texas.
Net charge-offs were $3.0 billion in the first
quarter of 2011, or 0.62 percent (annualized), of the
average total mortgage portfolio, excluding non-Freddie Mac
securities, compared to $2.9 billion, or 0.61 percent
(annualized), in the fourth quarter of 2010. This slight
increase was primarily due to higher single-family REO
acquisitions during the first quarter of 2011. Freddie Mac
believes the level of its charge-offs will remain high in 2011
due to the large number of single-family non-performing loans
that will likely be resolved during the year.
Non-performing assets were $124.4 billion, or
6.4 percent of the total mortgage portfolio, excluding
non-Freddie Mac securities, at March 31, 2011, compared to
$125.4 billion, or 6.4 percent, at December 31,
2010. The amount of non-performing assets declined slightly
during the first quarter of 2011 primarily due to a decline in
the rate at which loans transitioned into serious delinquency.
Net Worth
and Treasury Draws
Net Worth and Current Quarter Draw - Freddie Mac’s
positive net worth of $1.2 billion at March 31, 2011
reflects total comprehensive income of $2.7 billion for the
first quarter of 2011 and the $500 million received from
Treasury to eliminate the net worth deficit for the fourth
quarter of 2010. This was partially offset by the
$1.6 billion quarterly dividend payment to Treasury on the
company’s senior preferred stock.
Liquidation Preference and Dividends - The initial
aggregate liquidation preference of Freddie Mac’s senior
preferred stock was $1.0 billion, representing a portion of
the initial commitment fee to compensate Treasury for its
funding commitment. Based on cumulative draws of
$63.7 billion, the aggregate liquidation preference was
$64.7 billion as of March 31, 2011. Under the Purchase
Freddie Mac First Quarter 2011 Financial Results
May 4, 2011
Page 9
May 4, 2011
Page 9
Agreement, the company’s ability to repay the liquidation
preference of the senior preferred stock is limited.
Treasury is entitled to receive cumulative quarterly cash
dividends at the annual rate of 10% per year on the liquidation
preference of the senior preferred stock. As of March 31,
2011, the company’s annual cash dividends payable to
Treasury are $6.5 billion, which exceeds the company’s
annual historical earnings in all but one period. To date, the
company has paid approximately $11.6 billion in cash
dividends to Treasury.
Commitment Fee — The Purchase Agreement
requires the company to pay a quarterly commitment fee to
Treasury to compensate Treasury for the support provided by its
ongoing funding commitment. Under the Purchase Agreement,
Treasury may waive the quarterly commitment fee for up to one
year at a time in its sole discretion, based on adverse
conditions in the U.S. mortgage market. Treasury has waived
the quarterly commitment fee for the first and second quarters
of 2011 and will reevaluate whether the fee should be set in the
third quarter of 2011. The amount of the fee has not yet been
established and could be substantial. Absent Treasury waiving
the commitment fee for the third quarter of 2011, the quarterly
commitment fee will begin accruing on July 1, 2011 and must
be paid each quarter for as long as the Purchase Agreement is in
effect. Treasury has indicated that it remains committed to
protecting taxpayers and ensuring that future positive earnings
of the company are returned to taxpayers as compensation for
their investment.
Future Draws — Freddie Mac expects to request
additional draws under the Purchase Agreement in future periods.
The size and timing of such draws will be determined by a
variety of factors that could adversely affect the
company’s net worth, such as changes in home prices,
interest rates, mortgage security prices, spreads and other
factors. Over the long term, it is unlikely that the company
will regularly generate net income or comprehensive income in
excess of annual dividends payable to Treasury. As a result,
over time the company’s dividend obligation to Treasury
will increasingly drive future draws. In addition, other factors
such as the quarterly commitment fees payable to Treasury could
also contribute to additional draws if the fees are not waived
by Treasury in future periods. See “LIQUIDITY AND CAPITAL
RESOURCES — Capital Resources” in the
company’s Quarterly Report on
Form 10-Q
for the quarter ended March 31, 2011 for further discussion
of factors that could affect future draws.
Portfolio
Balances
Single-family credit guarantee portfolio (measured based
on UPB) was $1.82 trillion at March 31, 2011, compared to
$1.81 trillion at December 31, 2010.
Freddie Mac First Quarter 2011 Financial Results
May 4, 2011
Page 10
May 4, 2011
Page 10
Mortgage-related investments portfolio (measured based on
UPB) was $692.0 billion at March 31, 2011, down from
$696.9 billion at December 31, 2010. The Federal
Housing Finance Agency (FHFA), as Conservator, has stated its
expectation that Freddie Mac will not be a substantial buyer or
seller of mortgage assets for its mortgage-related investments
portfolio, except for purchases of delinquent mortgages out of
PC trusts.
Multifamily mortgage portfolio (measured based on UPB)
was $109.8 billion at March 31, 2011, compared to
$108.7 billion at December 31, 2010.
Segment
Earnings and Comprehensive Income
Freddie Mac’s operations consist of three reportable
segments, which are based on the type of business activities
each performs — Investments, Single-family Guarantee
and Multifamily.
The company evaluates segment performance and allocates
resources based on a Segment Earnings approach, subject to the
conduct of its business under the direction of the Conservator.
The accounting principles applied to present certain line items
in Segment Earnings for the company’s reportable segments,
in particular Segment Earnings net interest income and
management and guarantee income, differ significantly from those
applied in preparing the comparable line items in its
consolidated financial statements in accordance with Generally
Accepted Accounting Principles (GAAP). Accordingly, Segment
Earnings line items and results differ significantly from, and
should not be used as a substitute for, the comparable line
items and results determined in accordance with GAAP.
Investments Segment Earnings was $2.1 billion for
the first quarter of 2011, compared to $2.7 billion for the
fourth quarter of 2010. The decrease in segment earnings was
primarily driven by lower derivative gains on the company’s
net pay-fixed swap portfolio, partially offset by lower
impairments on non-agency AFS securities. Total comprehensive
income was $3.3 billion for the first quarter of 2011,
compared to $2.9 billion for the fourth quarter of 2010.
This increase was primarily driven by the improvement in AOCI
which more than offset lower earnings during the first quarter
of 2011.
Single-family Guarantee Segment Earnings (loss) was a
loss of $1.8 billion for the first quarter of 2011,
compared to a loss of $3.0 billion for the fourth quarter
of 2010. The decrease in segment loss was primarily driven by a
decrease in the provision for credit losses during the first
quarter of 2011. Total comprehensive income (loss) for the
Single-family Guarantee segment approximated Segment Earnings
(loss) for both the first quarter of 2011 and fourth quarter of
2010.
Freddie Mac First Quarter 2011 Financial Results
May 4, 2011
Page 11
May 4, 2011
Page 11
Multifamily Segment Earnings was $359 million for
the first quarter of 2011, compared to $213 million for the
fourth quarter of 2010. The increase in segment earnings was
primarily due to fair value gains on the company’s
held-for-sale mortgage loans and trading securities due to
spread tightening, partially offset by higher impairments
recognized on commercial mortgage-backed securities. Total
comprehensive income was $1.3 billion for the first quarter
of 2011, unchanged from the fourth quarter of 2010.
For additional information on Segment Earnings, including the
method the company uses to present Segment Earnings, see
“CONSOLIDATED RESULTS OF OPERATIONS — Segment
Earnings” and “NOTE 15: SEGMENT REPORTING”
in the company’s Quarterly Report on
Form 10-Q
for the quarter ended March 31, 2011.
Additional
Information
For more information, including that related to Freddie
Mac’s conservatorship and related actions, see the
company’s Quarterly Report on
Form 10-Q
for the quarter ended March 31, 2011, and the
company’s Consolidated Financial Statements, Core Tables
and financial results supplement. These documents are available
on the Investor Relations page of the company’s Web site at
www.FreddieMac.com/investors.
Additional information about Freddie Mac and its business is
also set forth in the company’s filings with the SEC, which
are available on the Investor Relations page of the
company’s Web site at www.FreddieMac.com/investors and the
SEC’s Web site at www.sec.gov. Freddie Mac encourages all
investors and interested members of the public to review these
materials for a more complete understanding of the
company’s financial results and related disclosures.
* * * *
This press release contains forward-looking statements, which
may include statements pertaining to the conservatorship, the
company’s current expectations and objectives for its
efforts under the Making Home Affordable program and other
initiatives to assist the U.S. residential mortgage market,
future business plans, liquidity, capital management, economic
and market conditions and trends, market share, the effect of
legislative and regulatory developments, implementation of new
accounting guidance, credit losses, internal control remediation
efforts, and results of operations and financial condition on a
GAAP, Segment Earnings and fair value basis. Management’s
expectations for the company’s future necessarily involve a
number of assumptions, judgments and estimates, and various
factors, including changes in market conditions, liquidity,
mortgage-to-debt option-adjusted spread, credit outlook, actions
by FHFA, Treasury, the Federal Reserve, the Obama
Administration, and Congress, and the impacts of legislation or
regulations and new or amended accounting guidance,
Freddie Mac First Quarter 2011 Financial Results
May 4, 2011
Page 12
May 4, 2011
Page 12
could cause actual results to differ materially from these
expectations. These assumptions, judgments, estimates and
factors are discussed in the company’s Annual Report on
Form 10-K
for the year ended December 31, 2010, Quarterly Report on
Form 10-Q
for the quarter ended March 31, 2011, and Current Reports
on
Form 8-K,
which are available on the Investor Relations page of the
company’s Web site at www.FreddieMac.com/investors and the
SEC’s Web site at www.sec.gov. The company undertakes no
obligation to update forward-looking statements it makes to
reflect events or circumstances after the date of this press
release or to reflect the occurrence of unanticipated events.
Freddie Mac was established by Congress in 1970 to provide
liquidity, stability and affordability to the nation’s
residential mortgage markets. Freddie Mac supports communities
across the nation by providing mortgage capital to lenders. Over
the years, Freddie Mac has made home possible for one in six
homebuyers and more than five million renters. For more
information, visit www.FreddieMac.com.
# # #