Attached files
| file | filename |
|---|---|
| 8-K - 8-K - MAINSOURCE FINANCIAL GROUP | a11-11186_18k.htm |
Exhibit 99.1
|
|
MainSource FINANCIAL GROUP Meeting the financial needs of our customers...for life! |
|
|
Welcome 2011 Annual Meeting of Shareholders Robert E. Hoptry, Chairman |
|
|
Introduction of Director Nominees Philip A. Frantz |
|
|
Director Nominees William G. Barron Brian J. Crall Philip A. Frantz Rick S. Hartman D.J. Hines William J. McGraw, III Thomas M. O’Brien Lawrence R. Rueff, DVM John G. Seale, CPA Archie M. Brown, Jr. MainSource Financial Group |
|
|
Board Consolidation MainSource Financial Group • Following the Annual Meeting, all members of the Corporate Board will be elected to serve on Bank Board of Directors. • Recognition of retiring MainSource Bank Board Members. • Future Board plans/composition. |
|
|
Advisory Vote on Executive Compensation Policies and Procedures |
|
|
Advisory Vote on Executive Compensation • Also known as the “Say on Pay” proposal • Vote is advisory in nature – not binding • MSFG Compensation Committee believes its practices are conservative, but will take shareholder vote into consideration in its compensation programs. |
|
|
Ratification of Crowe Horwath LLP |
|
|
Introductions |
|
|
MainSource Financial Group Executive Officers • Archie Brown: President and Chief Executive Officer • Jamie Anderson: Chief Financial Officer • Daryl Tressler: Chief Banking Officer • Bill Goodwin: Chief Credit Officer |
|
|
Results of Shareholder Vote |
|
|
Official Business Meeting Concluded |
|
|
2010 Financial Performance Jamie Anderson Chief Financial Officer |
|
|
We will achieve our vision by: Disclosure Regarding Forward Looking Statements This presentation may include forward-looking statements regarding, among other things, MainSource’s business strategy, financial position and prospects, dividend policy, business results, strategic initiatives, credit quality including reserve levels, capital expenditures, and various other matters. These statements can be identified by the use of forward-looking terminology such as “believes,” “estimates,” “expects,” “intends,” “may,” “will,” “should,” “could” or “anticipates”, or the negative or other variation of these similar words, or by discussions of strategy or risks and uncertainties. These statements are based on current expectations of future events. Actual results could differ materially from those indicated by these statements because the realization of those results is subject to many risks and uncertainties, and because the assumptions underlying these statements could prove inaccurate. Factors that could cause actual results to differ materially from such forward-looking statements include, without limitation, general economic conditions, legislative and regulatory initiatives, changes in the quality of MainSource’s loan portfolios, and other risks set forth in MainSource’s Annual Report on Form 10-K for the fiscal year ending December 31, 2010, on file with the SEC. MainSource does not undertake to update any forward looking statements as a result of new information or future events or developments. |
|
|
2010 Balance Sheet |
|
|
Total Assets (As of Year End) $2,900 $2,907 (As of Year End) Millions $3,000 $2,900 $2,800 $2,700 - $2,600 $2,500 $2,430 $2,400 $2,300 $2,200 $2,100 $2,536 $2,769 2006 2007 2008 2009 2010 |
|
|
Largest Indiana Bank Holding Companies By Asset Size As of 12.31.10 Millions $8,000 $7,000 $6,000 $5,000 $4,000 $3,000 $2,000 $1,000 $0 $7,264 $2,451 $2,627 $2,682 $4,170 $4,445 $2,769 1st Source Old National First Merchants As of 12.31.10
First Financial Integra Lakeland Financial MainSource Financial Group |
|
|
Total Loans (As of Year End) Millions $2,500 $2,000 $1,885 $1,574 $1,996 $1,694 $1,500 $1,000 $500 $0 $1,681 2006 2007 2008 2009 2010 |
|
|
Mortgage Loans Serviced (As of Year End) Millions $522 $900 $800 $700 $600 $500 $400 $300 $200 $100 $0 $726 $533 $782 $560 2006 2007 2008 2009 2010 |
|
|
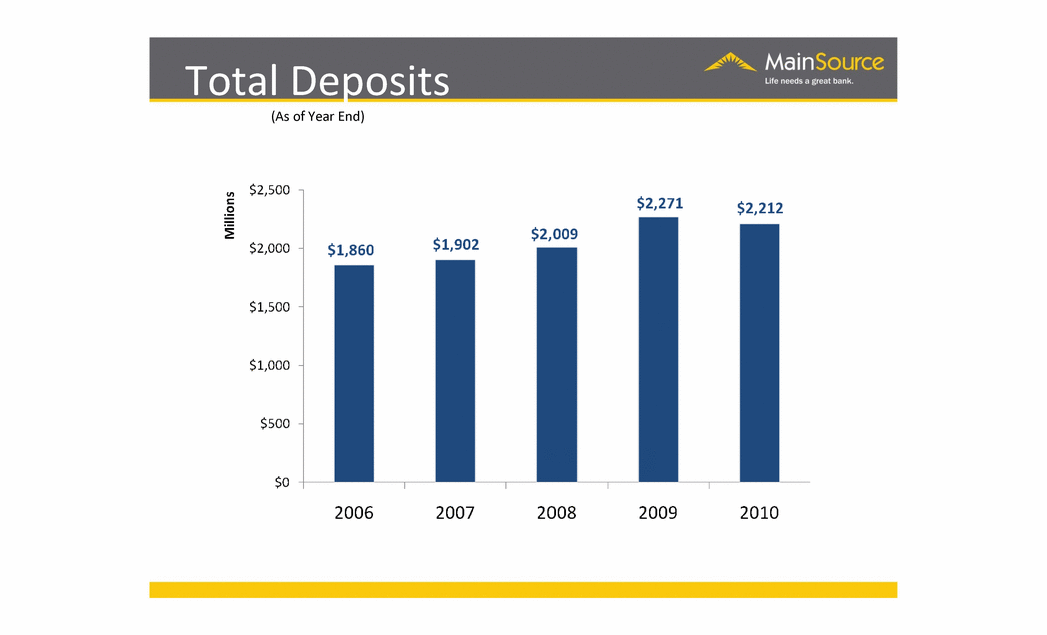
Total Deposits (As of Year End) Millions $2,500 $2,000 $1,500 $1,000 $500 $0 $1,860 $1,902 $2,271 $2,009 $2,212 2006 2007 2008 2009 2010 |
|
|
Total Deposits (As of Year End) Millions $1,902 $2,271 $2,009 $2,500 $2,000 $1,860 $1,500 $1,000 $500 1 $0 $2,212 CORE TIME 2006 2007 2008 2009 2010 |
|
|
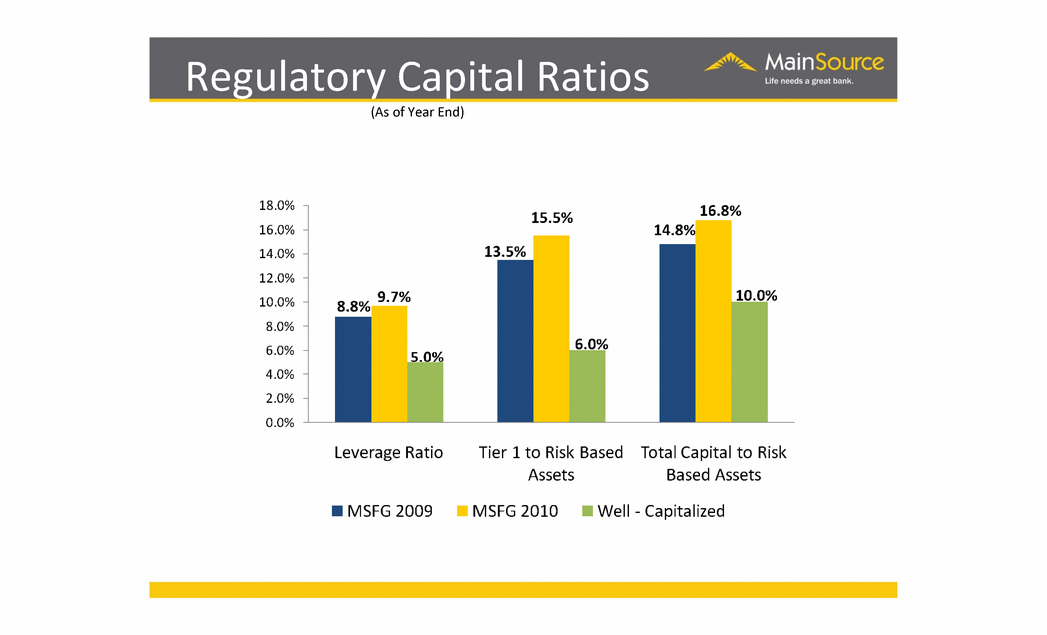
Regulatory Capital Ratios (As of Year End) Leverage Ratio Tier 1 to Risk Based Assets Total Capital to Risk Based Assets 15.5% 18.0% 16.0% 14.0% - 12.0% 10.0% - 8.0% - 6.0% 4.0% 2.0% 0.0% 16,8% 979, 8.8% 14.8% 13.5% 5M% 10.0% 6.0% |
|
|
2010 Operating Results |
|
|
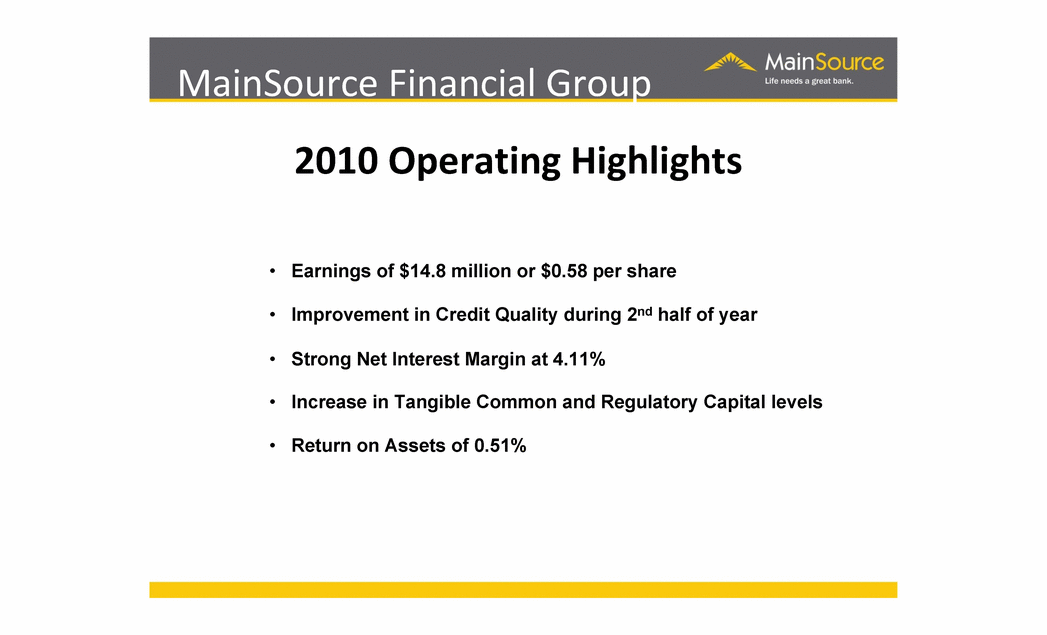
MainSource Financial Group • Earnings of $14.8 million or $0.58 per share • Improvement in Credit Quality during 2nd half of year • Strong Net Interest Margin at 4.11% • Increase in Tangible Common and Regulatory Capital levels • Return on Assets of 0.51% 2010 Operating Highlights |
|
|
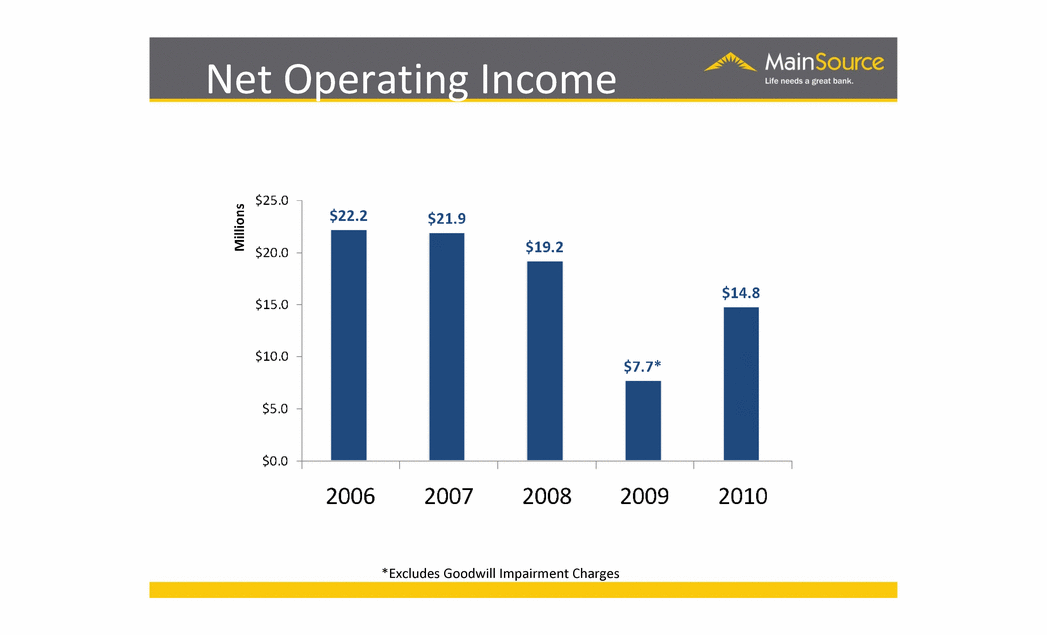
Net Operating Income Millions $25.0 $15.0 $10.0 $22.2 $21.9 $19.2 $0.0 $14.8 $5.0 $0.0 $77* 2006 2007 2008 2009 2010 *Excludes Goodwill Impairment Charges |
|
|
Operating Earnings Per Share $1.00 $1.40 - $129 $1.20 $1.00 -i $0.80 $0.60 $0.40 $0.20 $0.00 $0.58 *Excludes Goodwill Impairment Charges |
|
|
Non-Performing Loans (As of Year End and Excludes Accruing Troubled Debt Restructurings) Millions $90.0 $80.0 $70.0 $59.3 $60.0 $50.0 $40.0 $30.0 $20.5 $20.0 $10.0 $0.0 2006 $80.4 $69.3 2008 2007 2009 2010 |
|
|
New Non-Accruals By Quarter Millions $35.0 $30.0 $25.0 $23.8 $29.7 $20.0 $21.7 $15.0- $10.0 $5.0 $14.3 $0.0 $8.0 Q42009 Q12010 Q22010 Q32010 Q4 2010 |
|
|
Loan Loss Provision Expense Millions $50.0 $45.0 $40.0 $35.0 $30.0 - $25.0 $20.0 $10.0 $5.0 $0.0 $35.3 $20.9 $5.7 $1.8 2006 2007 2008 2009 2010 |
|
|
Loan Loss Provision Expense Millions $14.0 $12.0 $10.0 $8.0 $6.0 $4.0 $2.0 $0.0 $11.0 $9.5 $12.8 $7.0 $6.0 4Q2009 1Q2010 2Q2010 3Q2010 4Q2010 |
|
|
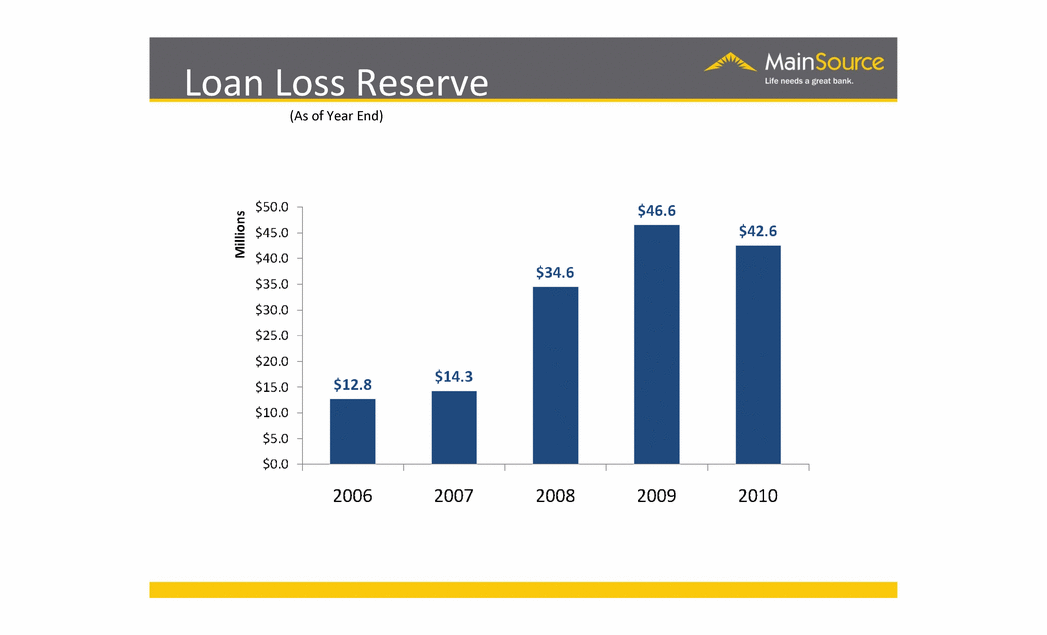
Loan Loss Reserve (As of Year End) Millions $50.0 $46.6 $45.0 $42.6 $40.0 $34.6 $35O $30.0 $25.0 $20.0 $12.8 $15.0 $10.0 $5.0 $.0.0 2006 2007 2008 2009 2010 |
|
|
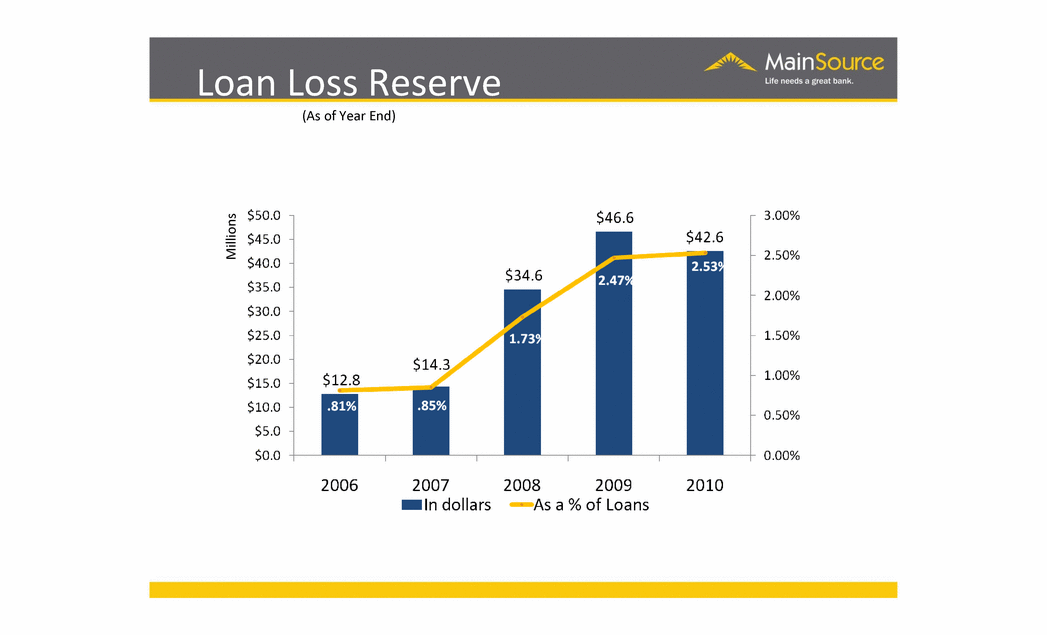
Loan Loss Reserve (As of Year End) Millions $50.0 $45.0 $40.0 $35.0 $30.0 $25.0 $20.0 $15.0 $10.0 $5.0 $0.0 2006 2007 In dollars $34.6 2008 2009 Asa % of Loans 2010 $46.6 $42.6 .85% $12.8 .81% 3.00% 2.50% 2.00% 1.50% 1.00% 0.50% 0.00% |
|
|
Net Revenue (Net Interest Income plus Non-Interest Income) Millions $160 $140 2 $120 $100 $80 $60 - $40 $20 $117 $91 $138 $103 $143 2006 2007 2008 2009 2010 |
|
|
Net Interest Margin Millions $160 $140 2 $120 $100 $80 $60 - $40 $20 $117 $91 $138 $103 $143 2006 2007 2008 2009 2010 |
|
|
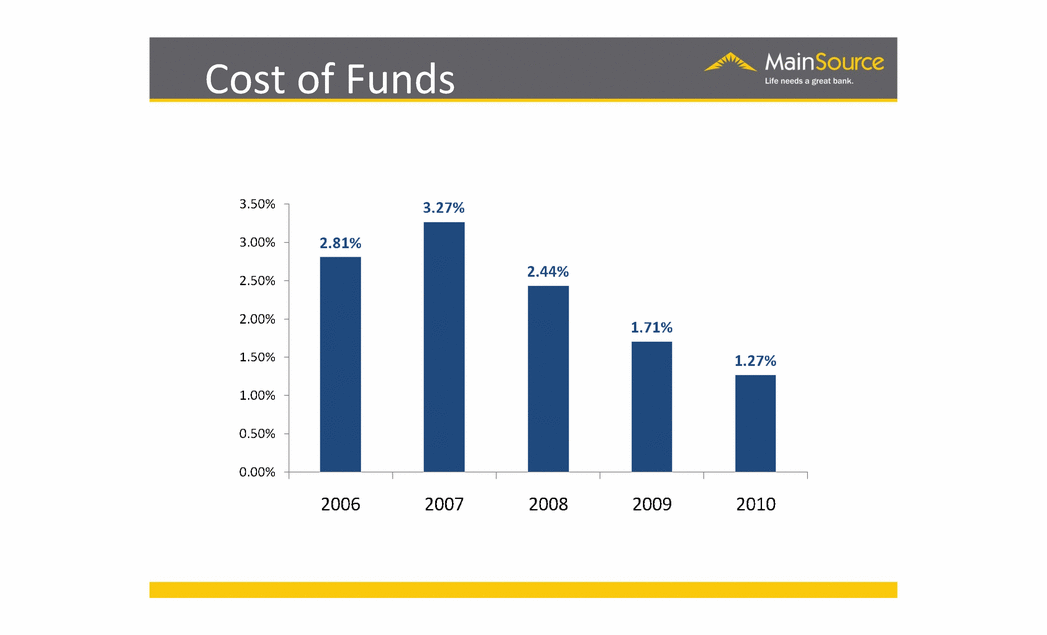
Cost of Funds 3.50% 3.00% 2.50% 2.00% 1.50% 0.50% 0.00% 2009 3.27% 2.81% 2.44% 1.71% 1,27% 2006 2007 2008 2010 |
|
|
Non-Interest Income Millions $45.0 $40.0 $35.0 $30.0 $25.0 $23.0 $20.0 $15.0 $10.0 $5.0 $0.0 - $28.1 $29.7 $40.1 $41.3 2006 2007 2008 2009 2010 |
|
|
Efficiency Ratio * Excludes Goodwill Impairment Charges 66.0% 64.0% 62.0% 60.0% 58.0% 56.0% 54.0% - 52.0% 50.0% 63.2% 64.3% 60.7% 61.6%* 62.0% 2007 2006 2008 2009 2010 |
|
|
Earnings Before LLP & Taxes * Excludes Goodwill Impairment Charges $60.0 $50.8* $44.5 $31.7 $34.5 $40.0 $30.0 $2.0.0 $1.0.0 $50.3 $.0.0 2006 2007 2008 2009 2010 |
|
|
MainSource Financial Group NASDAQ Stock Symbol MSFG |
|
|
Stock Performance – 5 Year MSFG vs. NASDAQ Bank Index $150 $100 $50 $ MainSource
2005 2006 2007 2008 2009 2010 MainSource Financial Group NASDAQ. Bank Stocks Index |
|
|
2010 Stock Performance |
|
|
Stock Price - 2010 (12 Months) 118% Increase $12.00 $10.00 $8.00 $6.00 $4.00 $2.00 $0.00 $4.78 $10.41 2010 12/31 1/31/10 2/28/10 3/31/10 4/30/10 5/31/10 6/30/10 7/31/10 8/31/10 9/30/10 10/31/10 11/30/10 12/31/10 |
|
|
Stock Price - 2010 (12 Months) 118% Increase $12.00 $10.00 $8.00 $6.00 $4.00 $2.00 $0.00 $4.78 $10.41 2010 12/31 1/31/10 2/28/10 3/31/10 4/30/10 5/31/10 6/30/10 7/31/10 8/31/10 9/30/10 10/31/10 11/30/10 12/31/10 MSFG was the third best performing stock among Midwest banks with assets between $ 1-10 billion. |
|
|
Factors Affecting Stock Price |
|
|
Non-Performing Loans (End of Period and Excludes Accruing Troubled Debt Restructurings) $100 $90 $80 $80.4 $70 $85.8 $80.3 04 2009 012010 022010 Q32010 Q4 2010 |
|
|
Tangible Common Equity Ratio 6.80% 6.60% 6.40% 6.20% 6.00% 5.80% 5.60% 5.40% 5.8% 6.6% 6.3% 6.5% 6.0% 4Q. 2009 IQ.2010 2Q.2010 3Q.2010 4Q.2010 |
|
|
MainSource Financial Group • Earnings of $4.5 million or $0.19 per share • Improvement in Credit Quality • Strong Net Interest Margin at 4.30% • Return on Assets of 0.67% • Increase in Tangible Common Equity to 6.8% First Quarter 2011 Operating Highlights |
|
|
2011 Outlook Archie M. Brown, Jr. |
|
|
Credit Quality |
|
|
Indiana Unemployment Rate (End of Period) U. S. Bureau of Labor Statistics 8.1% 4.6% 9.7% 9.2% 4.7% 8.5% 2006 2007 2008 2009 2010 Mar-11 $90 $80 $70 $60 $50 $40 $30 |
|
|
Non-Performing Loans (End of Period and Excludes Accruing Troubled Debt Restructurings) $80.4 $59.3 $20.5 $69.3 $59.8 $17.5 $20 $10 $0 2006 2007 2008 2009 2010 Q12011 $100 $90 $80 |
|
|
Non-Performing Loans (End of Period and Excludes Accruing Troubled Debt Restructurings) Millions $100 $90 $80.4 $80 $85.8 $80.3 $70 $60 $50 $40 $30 $20 $693 $598 Q4 2009 Q12010 Q22010 032010 042010 012011 |
|
|
New Non-Accruals By Quarter Millions $35.0 $30.0 $29.7 $21.7 $25.0 $23.8 $20.0 $15.0 $10.0 $5.0 - $0.0 $14.3 $8.0 $9.0 Q4 2009 012010 022010 032010 042010 01 2011 |
|
|
Loan Portfolio (As of 3.31.11) Total Loans Non-Performing Loans 3% 1% All .0ther CRE Residential RE I HELOC/Jr. Lien Commercial/Industrial 1-4 Family Consumer 3% Construction & Development Hotels |
|
|
Adversely Classified Assets (End of Period) Millions Substandard and Non-Performing Loans plus OREO $157 $154 58% $146 $170.0 $160.0 $150.0 $140.0 $130.0 $120.0 $1100 $100,0 $90.0 $80.0 53% 149 141 700% 600% 50.0% 40.0% 30.0% 20.0% 10.0% 0.0% Substandard and Non-Performing Loans plus OREO |
|
|
Loan Loss Provision Expense $50.0 $46.3 $45.0 $40.0 $35.0 $3.0.0 $2s.0 $20.9 $20.0 $15.0 $1.0.0 $5.0 $1.8 $.0.0 I $35.3 $5.6 2006 2007 2008 2009 2010 Q1201 |
|
|
Loan Loss Provision Expense $12.0 $10.0 - $9.5 $8.0 $70 $6.0 $4.0 $2.0 $0.0 $6.0 $5.6 4Q2009 1Q2010 2Q2010 3Q2010 4Q2010 1Q2011 |
|
|
Net Charge Offs (In Dollars) $19.3 $25.0 $20.0 $13.1 $14.3 $15.0 - $10.0 $s..0 $5.9 $5.0 4Q2009 1Q2010 2Q2010 3Q2010 4Q2010 1Q2011 |
|
|
Loan Loss Reserve to Total Loans (End of Period) 2.47% 2.53% 3.00% 2.50% 2.00% 1.50% 1.00% - .81% 0.50% J 0.00% 2.63% 1,73% .85%
2006 2007 2008 2009 2010 Q12011 |
|
|
Credit Outlook |
|
|
Dividend & Capital Outlook |
|
|
NPAs / Assets vs. Peers (As of 12.31.10) 6.0% 50% 2.6 % 3.7% 0.0 MSFG Peer Group TCE Ratio vs. Peers |
|
|
TCE Ratio vs. Peers (As of 12.31.10) 7.5% 7.0% 6.5% 6.0% 5.5% 5.0% 4,5% 4.0% 3,5% 3.0% 6.5% 7.2% MSFG Peer Group |
|
|
U.S. Treasury TARP Program (As of 4.14.11) The majority of smaller, community focused institutions remain participants in the TARP program, while most larger participants have exited TARP through raising capital. Number of TARP Participants TARP $ Outstanding/Redeemed 14% 14% 72% Converted Redeemed Outstanding |
|
|
Challenges Facing the Banking Industry |
|
|
Industry Challenges • Lack of loan demand • Slow recovering economy • Regulatory burden/changes |
|
|
Dodd – Frank (Estimates of Rulemaking By Agency) Agency All Rulemaking* One-Time Reports/ Studies New Periodic Reports Bureau 24 4 5 CFTC 61 6 2 Council 56 8 4 FDIC 31 3 1 Federal Reserve 54 3 3 FTC 2 0 0 GAO 0 23 2 OCC 17 2 2 OFR 4 1 2 SEC 95 17 5 Treasury 9 1 1 Total** 243 67 22 * This estimate only includes references to explicit rulemakings in the Act, and thus likely represents a significant underestimate. ** The Total count eliminates double counting for joint rulemakings. Source: Davis Polk & Wardwell LLP |
|
|
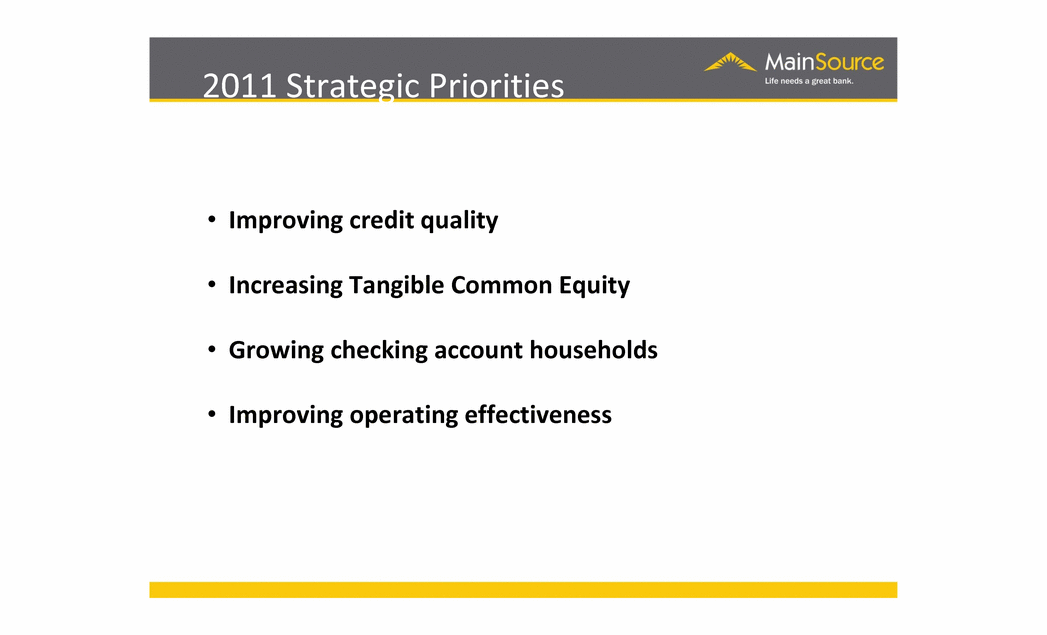
2011 Strategic Priorities • Improving credit quality • Increasing Tangible Common Equity • Growing checking account households • Improving operating effectiveness |
|
|
2011 Strategic Priorities Checking Household Growth |
|
|
2011 Strategic Priorities New Checking Accounts Opened CAGR = 25% 14,807 14,000 12,000 10,000 8,000 6,000 4,000 2,000 13,676 CAGR = 25% 9,448 •2008 2009 |
|
|
2011 Strategic Priorities Checking Household Growth CAGR = 5% 85,000 80,000 75,000 70,000 65,000 60,000 55,000 50,000 72,663 CAGR =5% 80,076 76,196 2009 2010 2008 |
|
|
2011 Strategic Priorities Improving Operating Effectiveness |
|
|
2011 Strategic Priorities Improving Operating Effectiveness • Restructure Commercial Banking to increase sales focus • Implement Gallup Employee/Customer engagement initiative • Retain third party support to improve efficiency |
|
|
Board Leadership Structure |
|
|
Board Structure • Archie M. Brown – Chairman and CEO • Brian Crall – Lead Director |
|
|
Questions |
|
|
Non-GAAP Measures This presentation contains certain financial information determined by methods other than in accordance with accepted accounting principles generally accepted in the United States (GAAP). Such non-GAAP financial measures include the following: operating net income (excluding goodwill impairment charges), operating earnings per share (excluding goodwill impairment charges), and earnings (excluding loan loss provision, taxes and goodwill impairment charges). Non-GAAP financial information should be considered supplemental to, and not as a substitute for, or superior to, financial measures calculated in accordance with GAAP. However, we believe that non-GAAP reporting provides meaningful information and therefore we use it to supplement our GAAP information. We have chosen to provide this supplemental information to investors, analysts and other interested parties to enable them to perform additional analyses of operating results, to illustrate the results of operations giving effect to the non-GAAP adjustments and to provide an additional measure of performance. We believe this information is helpful in understanding the results of operations separate and apart from items that may, or could, have a disproportional positive or negative impact in any given period. For a reconciliation of the differences between the non-GAAP financial measures the most comparable GAAP measures, please refer to the following reconciliation tables. |
|
|
Non-GAAP Reconciliation (in millions, except EPS) Operating Net Income Reconciliation: 2006 2007 2008 2009 2010 Operating Net Income $22.2 $21.9 $19.2 $7.7 $14.8 Goodwill Impairment Charge -- -- -- (71.8) -- Net Income/(Loss)(GAAP) $22.2 $21.9 $19.2 $(64.1) $14.8 Operating Earnings Per Share Reconciliation: 2006 2007 2008 2009 2010 Operating Earnings Per Share $1.29 $1.17 $1.00 $0.24 $0.58 Goodwill Impairment Charge _ -- -- -- (3.57) -- Net Income/(Loss)(GAAP) $1.29 $1.17 $1.00 $(3.33) $0.58 Earnings Before LLP & Taxes Reconciliation: 2006 2007 2008 2009 2010 Earnings before LLP, Taxes and Goodwill $31.7 $34.5 $44.5 $50.8 $50.3 Loan Loss Provision 1.8 5.7 20.9 46.3 35.3 Tax Expense (Benefit) 7.6 6.9 4.4 (11.7) 0.2 Goodwill Impairment Charge _ -- -- -- (80.3) -- Earnings (GAAP) $22.3 $21.9 $19.2 $(64.1) $14.8 |
|
|
[LOGO] |


