Attached files
| file | filename |
|---|---|
| 8-K - FORM 8-K - UNITED COMMUNITY FINANCIAL CORP | c16208e8vk.htm |
Exhibit 99

| Annual Meeting Presentation April 28, 2011 |

| 2 Forward-Looking Statement Disclosure To the extent that this presentation or the presenters discuss expectations about future financial results or market conditions or otherwise make statements about the future, such statements are forward-looking and are based on the Company's current beliefs, expectations, forecasts or projections. Actual results may differ materially from our statements due to a number of risks and uncertainties, including those described in the Company's Form 10-K for the year ended December 31, 2010 and subsequent filings. Please refer to these SEC documents for a complete list of risk factors. |

| 3 Review of Financial Performance UCFC Earnings Analysis (1) 2006 2007 2008 2009 2010 1Q 2011 MSR -25.3 -49.1 -62.4 -2.2 Securities charge Goodwill -33.6 Provision expense -4.3 -28.8 HSL income prior to tax, provision and extraordinary items 39.7 31.4 17.1 26.2 25.1 5.2 Tax -12.4 -0.9 1.9 1.2 Earnings prior to tax, loan loss provision and other items Provision expense Goodwill charge Key ($MM): $24.1 $4.1 $(35.3) $(16.8) $(37.3) $3.0 2006 2007 2008 $ Income tax Note: 1. The table above contains certain financial information determined to be a presentation not in accordance with GAAP. We have provided information about significant events that occurred during the period because we believe this information is useful to both investors and management and aids in the overall understanding of their impact on the Company's overall performance. Users should consider this financial information a supplementary tool for analysis purposes and not substitute it for GAAP net income. Net Income 2009 UCFC's ability to generate pre- tax, pre-provision earnings has helped to offset the effect of loan loss provision expense over the course of this credit cycle Provision expense totaled $169.9 million for the five year period ended 12/31/2010 Pre-tax, pre-provision earnings for this period totaled $139.5 million Butler Wick 2010 1Q 2011 |

| 4 Cleaning Up the Balance Sheet 12/31/09 ALLL Net Charge-offs Provision Expense 12/31/10 ALLL East 42.3 -53.8 62.4 50.8 Provisions, Chargeoffs and Changes to the Allowance ($MM) UCFC began 2010 with a loan loss reserve of $42.3 million UCFC charged off $55.1 million in 2010, but experienced provision expense of $62.4 million As a result, the loan loss reserve grew by $7.3 million during the year, to $50.8 million |

| 5 Loan Detail 2009 vs. 2010 UCFC's loan portfolio contracted by $207.9MM in 2010 Reflects strategic intent to preserve capital and pull back from higher-risk lending areas Mortgages CRE Constr Consumer Comml Loans 757.4 492.3 123.7 279.5 46.3 Mortgage CRE Constr Deposits 773.8 571.9 191.8 309.2 60.2 Total Loans as of December 31, 2009 Total Loans as of December 31, 2010 Consumer $309.2 Comm'l RE $571.9 1-4 Family $773.8 Commercial $60.2 Construction $191.8 1-4 Family $757.4 Comm'l RE $492.3 Construction $123.7 Consumer $279.5 Commercial $46.3 Total: $1.9 Bn Total: $1.6 Bn |

| 6 "De-Risking" the Balance Sheet Loan Concentrations 1Q '09 2Q '09 3Q '09 4Q '09 1Q '10 2Q '10 3Q '10 4Q '10 1Q '11 Residential 3.17 3.03 2.98 3.08 3.02 2.8 2.76 2.77 2.6 Total Commercial Real Estate Loans % of Total Risk-Based Capital UCFC has steadily reduced its concentrations in both Construction, Land Development and Land loans and Non-Owner Occupied CRE loans over the last eight quarters "Concentrations": Institutions with significant CRE concentrations are described in regulatory guidance as those institutions reporting loans for construction, land development, and other land representing 100 percent or more of total capital; or institutions reporting total CRE loans representing 300 percent or more of total capital where the outstanding balance of CRE has increased by 50 percent or more during the prior 36 months 1Q '09 2Q '09 3Q '09 4Q '09 1Q '10 2Q '10 3Q '10 4Q '10 1Q '11 Construction 1.2 1.04 0.96 0.98 0.93 0.78 0.78 0.75 0.64 Construction, Land Development and Land Loans % of Total Risk-Based Capital Concentration Level Concentration Level |

| 7 "De-Risking" the Balance Sheet (cont.) Balance Sheet Ratios 1Q '09 2Q '09 3Q '09 4Q '09 1Q '10 2Q '10 3Q '10 4Q '10 1Q '11 Residential 1.152 1.112 1.094 1.055 1.055 1.053 1.025 0.976 0.946 Loan to Deposit Ratio % Securities, 99.9% of which are government-backed mortgage- backed securities and agency securities, have become an increasingly large portion of total assets The loan to deposit ratio was under 100% at both December 31, 2010 and March 31, 2011 1Q '09 2Q '09 3Q '09 4Q '09 1Q '10 2Q '10 3Q '10 4Q '10 1Q '11 Construction 0.097 0.103 0.12 0.12 0.119 0.133 0.169 0.165 0.137 Securities to Total Assets Ratio % |

| 8 "De-Risking" the Balance Sheet (cont.) Liability Trends since 2009 UCFC has steadily reduced its reliance on time deposits and increasingly funds its operations with core deposits Notes: 1. Includes term and overnight FHLB borrowings and term repos 2. Includes all time deposits. As of December 31, 2009, UCFC had $15.0 million in brokered CDs; as of December 31, 2010, UCFC had no brokered CDs 3. Includes all non-time deposits Core CD's Borrowings Deposits 779.3 910.5 300.6 Core CD's Borrowings Deposits 729.5 1040 318.2 Deposits & Borrowings 12/31/09 Deposits & Borrowings 12/31/10 15% 15% 50% 35% 39% 46% Borrowings (1) Borrowings (1) CDs (2) CDs (2) Core Deposits (3) Core Deposits (3) |

| 9 "Money to Lend" Maintaining Ample Liquidity 1Q '09 2Q '09 3Q '09 4Q '09 1Q '10 2Q '10 3Q '10 4Q '10 1Q '11 Liquidity 452 487.6 488.3 529.3 440.5 436.7 498.9 479.4 487.2 Total On-Hand Liquidity (1) UCFC has consistently maintained $400-500 million of available liquidity over the past nine quarters ($MM) Note: 1. Total on-hand liquidity is defined as the sum of the remaining borrowing capacity with the FHLB and the Federal Reserve, unencumbered securities available for sale and cash and cash equivalents. |

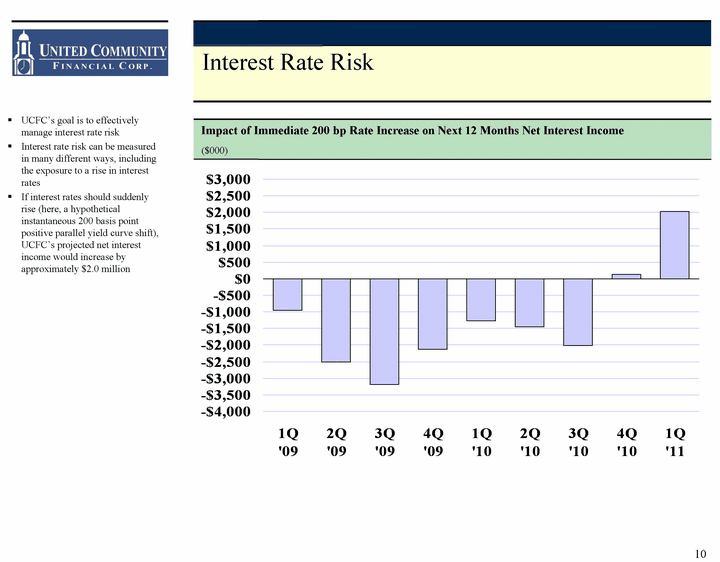
| 10 Interest Rate Risk 1Q '09 2Q '09 3Q '09 4Q '09 1Q '10 2Q '10 3Q '10 4Q '10 1Q '11 Residential 1.27 1.3 1.35 1.42 1.42 1.39 1.33 1.34 Impact of Immediate 200 bp Rate Increase on Next 12 Months Net Interest Income ($000) UCFC's goal is to effectively manage interest rate risk Interest rate risk can be measured in many different ways, including the exposure to a rise in interest rates If interest rates should suddenly rise (here, a hypothetical instantaneous 200 basis point positive parallel yield curve shift), UCFC's projected net interest income would increase by approximately $2.0 million |

| 11 Asset Quality Trends Since 2009 1Q '09 2Q '09 3Q '09 4Q '09 1Q '10 2Q '10 3Q '10 4Q '10 1Q '11 Delinq 151.7 135.5 140.5 157.1 195.2 187.9 193.1 165.6 158.3 NPL 104.9 102 113.7 115.9 138.9 155.1 142.7 139.5 145.9 Delinquencies and Nonperforming Loans ($MM) Asset quality trends are measured in several different ways, including: Delinquencies Nonperforming Loans Key Nonperforming loans(2) Notes: 1. Delinquencies includes all loans 30 or more days past due 2. Nonperforming loans includes all loans that are past due 90 days plus loans that are less than 90 days past due but are on nonaccrual status Delinquencies(1) |

| 12 Classified Loan Trends 2009 vs. 2010 Core CD's Borrowings Deposits 779.3 910.5 300.6 Total Classified Loans UCFC ended 2010 with classified asset levels lower than at year-end 2009 ($MM) 221.4 233.9 |

| 13 Working Through the Problems Classified Loans 2nd Half 2009 1st Half 2010 2nd Half 2010 1st Qtr 2011 Inflows 69.5 36.1 34.1 6.3 Outflows -28.4 -31.8 -30.6 -11.8 Classified Loan Inflows/Outflows Outflows(1) Key Inflows ($MM) Classified loan inflows have slowed from the high levels experienced in the second half of 2009 Note: 1. Outflows are the result of charge-off, upgrades in classification, sales or payoffs |

| 14 Working Through the Problems REO Management 12/31/09 Balance Outflows Inflows 12/31/10 Balance East 30.3 -18.3 27.9 39.9 REO Inflows/Outflows in 2010 ($MM) 134 Properties 225 Properties 325 Properties 234 Properties UCFC's Real Estate Owned (REO) portfolio grew from 234 properties worth $30.3MM at the beginning of the year to 325 properties worth $39.9MM at the end of 2010 In 2010, the Company sold 134 properties worth $18.3MM, but took in 225 properties worth $27.9MM |

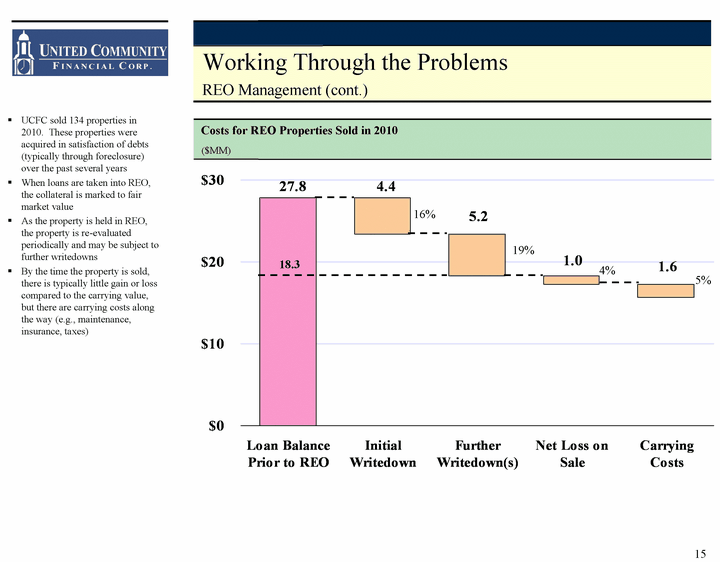
| 15 Working Through the Problems REO Management (cont.) Loan Balance Prior to REO Initial Writedown Further Writedown(s) Net Loss on Sale Carrying Costs East 27.8 23.4 18.3 17.3 15.7 4.4 5.1 1 1.6 Costs for REO Properties Sold in 2010 ($MM) 16% 19% 4% 5% UCFC sold 134 properties in 2010. These properties were acquired in satisfaction of debts (typically through foreclosure) over the past several years When loans are taken into REO, the collateral is marked to fair market value As the property is held in REO, the property is re-evaluated periodically and may be subject to further writedowns By the time the property is sold, there is typically little gain or loss compared to the carrying value, but there are carrying costs along the way (e.g., maintenance, insurance, taxes) 18.3 |

| 16 Review of Financial Performance (cont.) Capital Adequacy at Home Savings 1Q '09 2Q '09 3Q '09 4Q '09 1Q '10 2Q '10 3Q '10 4Q '10 1Q '11 Construction 0.097 0.103 0.12 0.12 0.119 0.133 0.169 0.165 0.137 C & D Minimum 12.0% "Well- Capitalized"(1) 10.0% Minimum 8.0% Total Risk-Based Capital to Risk-Weighted Assets Home Savings Notes: 1. Home Savings has been deemed "adequately capitalized" for regulatory purposes 2. The C&D was issued in August 2008, and its capital requirements went into effect as of 12/31/08 Home Savings has been able to meet and maintain a Total Risk Based Capital ratio in excess of the higher capital standards imposed under the terms of the Cease and Desist Order since the order went into effect C&D(2) |

| 17 Review of Financial Performance (cont.) Capital Adequacy at Home Savings 1Q '08 2Q '08 3Q '08 4Q '08 1Q '09 2Q '09 3Q '09 4Q '09 1Q '10 2Q '10 3Q '10 4Q '10 1Q '11 East 0.0767 0.0777 0.0749 0.082 0.0833 0.085 0.0868 0.0822 0.0847 0.0871 0.0823 0.0784 0.0844 C & D Minimum 8.0% "Well- Capitalized"(1) 5.0% Minimum 4.0% Tier 1 Leverage Ratio (Core Capital / Average Assets) Home Savings Home Savings' Tier 1 leverage ratio was in excess of the 8.0% minimum imposed under the terms of the Cease and Desist Order until the fourth quarter of 2010 Under the terms of the C&D, if the capital ratio falls below the level set forth in the C&D, Home Savings has 90 days in which to bring the capital ratio back above those levels Because Home Savings' Tier 1 leverage ratio was 8.44% as of March 31, 2011, Home Savings was not in violation of its C&D Notes: 1. Home Savings has been deemed "adequately capitalized" for regulatory purposes 2. The C&D was issued in August 2008, and its capital requirements went into effect as of 12/31/08 C&D(2) |

| Annual Meeting Presentation April 28, 2011 |
