Attached files
| file | filename |
|---|---|
| EX-99.1 - EX-99.1 - Black Knight InfoServ, LLC | g27011exv99w1.htm |
| 8-K - FORM 8-K - Black Knight InfoServ, LLC | g27011e8vk.htm |
Exhibit 99.2

| Supplemental Materials Lender Processing Services First Quarter 2011 |
| This presentation contains forward-looking statements that involve a number of risks and uncertainties. Those forward-looking statements include all statements that are not historical facts, including statements about our beliefs and expectations. Forward-looking statements are based on management's beliefs, as well as assumptions made by and information currently available to management. Because such statements are based on expectations as to future economic performance and are not statements of historical fact, actual results may differ materially from those projected. We undertake no obligation to update any forward-looking statements, whether as a result of new information, future events or otherwise. The risks and uncertainties to which forward-looking statements are subject include, but are not limited to: our ability to adapt our services to changes in technology or the marketplace; the impact of adverse changes in the level of real estate activity (including among others, loan originations and foreclosures) on demand for certain of our services; our ability to maintain and grow our relationships with our customers; the effects of our substantial leverage on our ability to make acquisitions and invest in our business; the level of scrutiny being placed on participants in the foreclosure process; risks associated with federal and state inquiries and examinations currently underway or that may be commenced in the future with respect to our default management operations, and with civil litigation related to these matters; changes to the laws, rules and regulations that regulate our businesses as a result of the current economic and financial environment; changes in general economic, business and political conditions, including changes in the financial markets; the impact of any potential defects, development delays, installation difficulties or system failures on our business and reputation; risks associated with protecting information security and privacy; and other risks and uncertainties detailed in the "Statement Regarding Forward-Looking Information," "Risk Factors" and other sections of the Company's Form 10-K, the Company's subsequent reports on Form 10- Q and other filings with the Securities and Exchange Commission. Forward-Looking Statements |
| Generally Accepted Accounting Principles (GAAP) is the term used to refer to the standard framework of guidelines for financial accounting. GAAP includes the standards, conventions, and rules accountants follow in recording and summarizing transactions, and in the preparation of financial statements. In addition to reporting financial results in accordance with GAAP, LPS reports several non-GAAP measures, including "EBIT, as adjusted" (GAAP operating income adjusted for the impact of certain non-recurring adjustments, if applicable), "adjusted net earnings" (GAAP net earnings adjusted for the impact of certain non-recurring adjustments, if applicable, plus the after-tax purchase price amortization of intangible assets added through acquisitions), "adjusted net earnings per diluted share" (adjusted net earnings divided by diluted weighted average shares), and "adjusted free cash flow" (net cash provided by operating activities less additions to property, equipment and computer software, as well as non-recurring adjustments, if applicable). LPS provides these measures because it believes that they are helpful to investors in comparing year-over-year performance in light of certain non-recurring charges, and to better understand our financial performance, competitive position and future prospects. Non-GAAP measures should be considered in conjunction with the GAAP financial presentation and should not be considered in isolation or as a substitute for GAAP net earnings. A reconciliation of these non-GAAP measures to related GAAP measures is included in the 1Q11 earnings release. Use of Non-GAAP Measures |
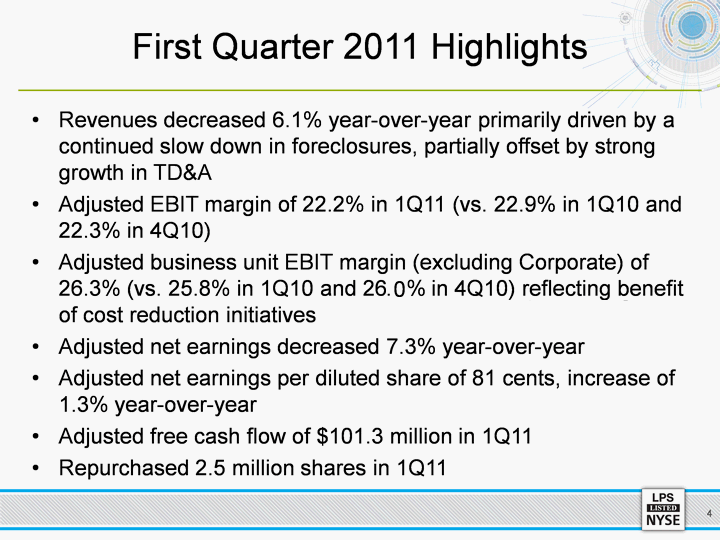
| Revenues decreased 6.1% year-over-year primarily driven by a continued slow down in foreclosures, partially offset by strong growth in TD&A Adjusted EBIT margin of 22.2% in 1Q11 (vs. 22.9% in 1Q10 and 22.3% in 4Q10) Adjusted business unit EBIT margin (excluding Corporate) of 26.3% (vs. 25.8% in 1Q10 and 25.9% in 4Q10) reflecting benefit of cost reduction initiatives Adjusted net earnings decreased 7.3% year-over-year Adjusted net earnings per diluted share of 81 cents, increase of 1.3% year-over-year Adjusted free cash flow of $101.3 million in 1Q11 Repurchased 2.5 million shares in 1Q11 First Quarter 2011 Highlights |
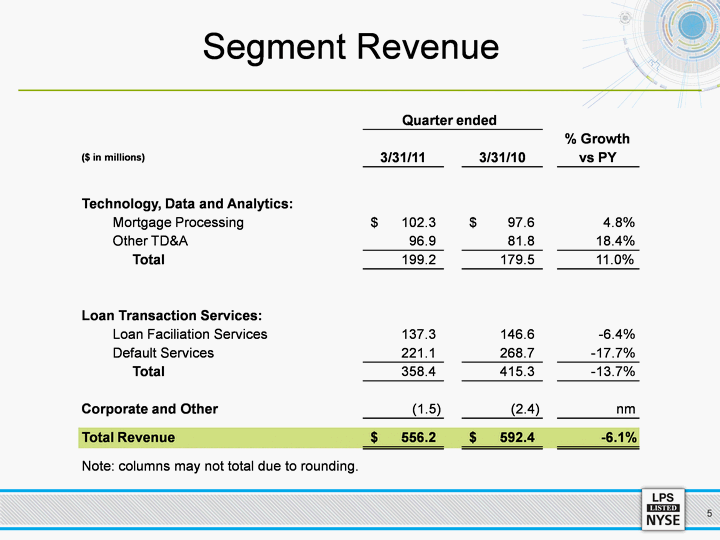
| Segment Revenue ($ in millions) 3/31/11 3/31/10 % Growth vs PY Technology, Data and Analytics: Mortgage Processing 102.3 $ 97.6 $ 4.8% Other TD&A 96.9 81.8 18.4% Total 199.2 179.5 11.0% Loan Transaction Services: Loan Faciliation Services 137.3 146.6 -6.4% Default Services 221.1 268.7 -17.7% Total 358.4 415.3 -13.7% Corporate and Other (1.5) (2.4) nm Total Revenue 556.2 $ 592.4 $ -6.1% Note: columns may not total due to rounding. Quarter ended |
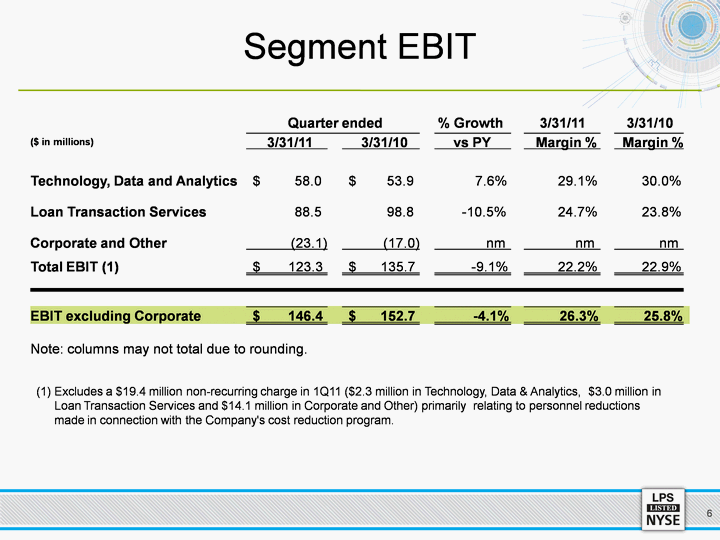
| Segment EBIT % Growth 3/31/11 3/31/10 ($ in millions) 3/31/11 3/31/10 vs PY Margin % Margin % Technology, Data and Analytics 58.0 $ 53.9 $ 7.6% 29.1% 30.0% Loan Transaction Services 88.5 98.8 -10.5% 24.7% 23.8% Corporate and Other (23.1) (17.0) nm nm nm Total EBIT (1) 123.3 $ 135.7 $ -9.1% 22.2% 22.9% EBIT excluding Corporate 146.4 $ 152.7 $ -4.1% 26.3% 25.8% Note: columns may not total due to rounding. (1) Excludes a $19.4 million non-recurring charge in 1Q11 ($2.3 million in Technology, Data & Analytics, $3.0 million in Loan Transaction Services and $14.1 million in Corporate and Other) primarily relating to personnel reductions made in connection with the Company's cost reduction program. Quarter ended |
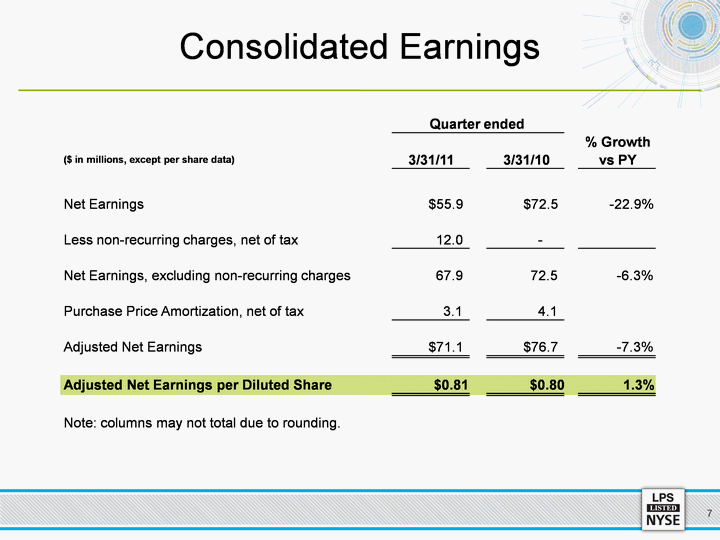
| Consolidated Earnings ($ in millions, except per share data) 3/31/11 3/31/10 % Growth vs PY Net Earnings $55.9 $72.5 -22.9% Less non-recurring charges, net of tax 12.0 - Net Earnings, excluding non-recurring charges 67.9 72.5 -6.3% Purchase Price Amortization, net of tax 3.1 4.1 Adjusted Net Earnings $71.1 $76.7 -7.3% Adjusted Net Earnings per Diluted Share $0.81 $0.80 1.3% Note: columns may not total due to rounding. Quarter ended |
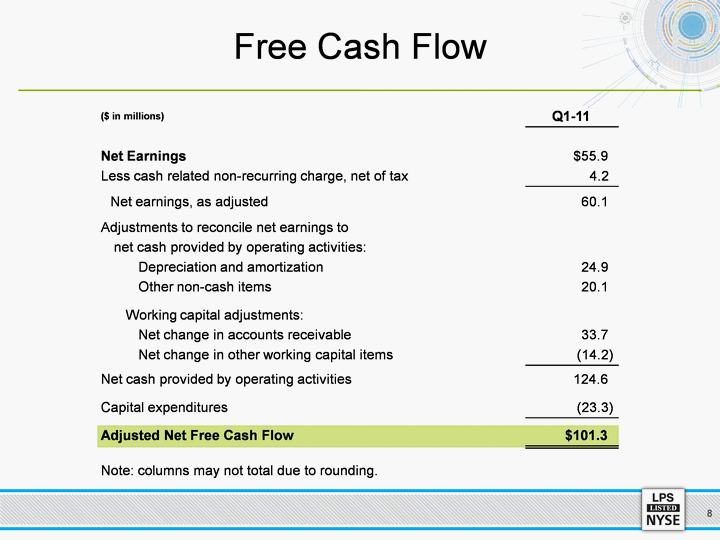
| Free Cash Flow ($ in millions) Q1-11 Net Earnings $55.9 Less cash related non-recurring charge, net of tax 4.2 Net earnings, as adjusted 60.1 Adjustments to reconcile net earnings to net cash provided by operating activities: Depreciation and amortization 24.9 Other non-cash items 20.1 Working capital adjustments: Net change in accounts receivable 33.7 Net change in other working capital items (14.2) Net cash provided by operating activities 124.6 Capital expenditures (23.3) Adjusted Net Free Cash Flow $101.3 Note: columns may not total due to rounding. |
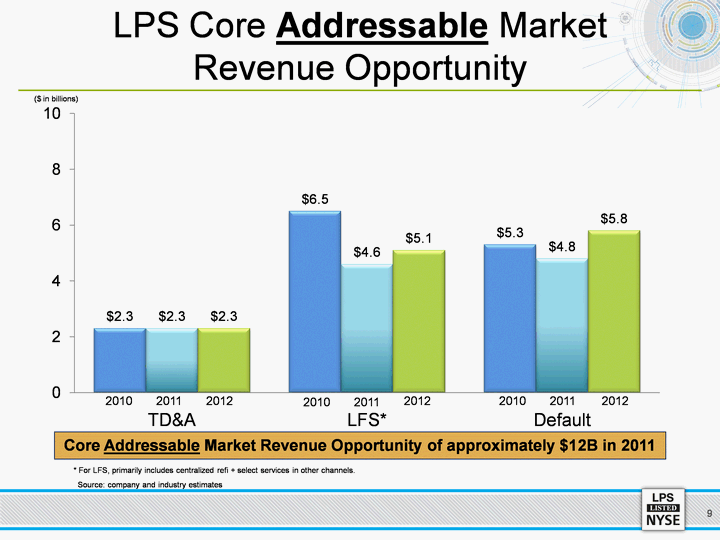
| LPS Core Addressable Market Revenue Opportunity Core Addressable Market Revenue Opportunity of approximately $12B in 2011 * For LFS, primarily includes centralized refi + select services in other channels. Source: company and industry estimates 2010 2011 ($ in billions) 2010 2011 2010 2011 |
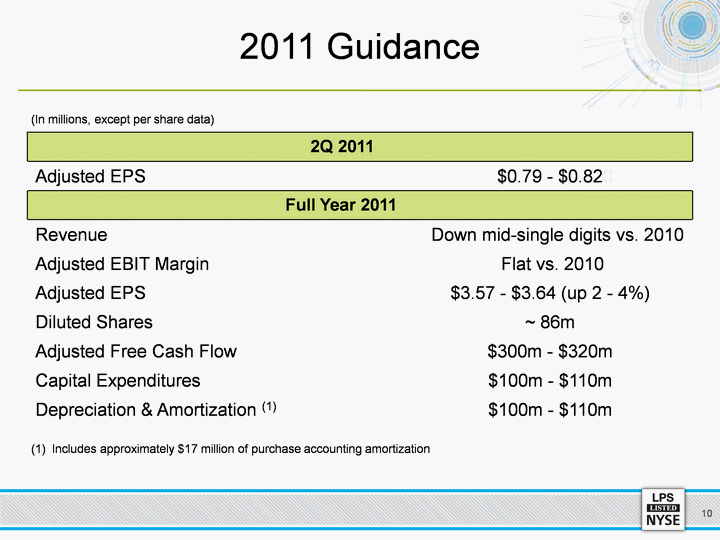
| 2011 Guidance (In millions, except per share data) (1) Includes approximately $17 million of purchase accounting amortization |
