Attached files
| file | filename |
|---|---|
| 8-K - Alliance Bancorp, Inc. of Pennsylvania | v219399_8k.htm |
| EX-99.1 - Alliance Bancorp, Inc. of Pennsylvania | ex99-1.htm |
Exhibit 99.2
We Build Relationships That LastAlliance Bancorp, Inc. of PennsylvaniaAnnualMeeting

The first slide tracks asset growth over the last five years. The Company’s assets have grown from $389 million in 2005 to $454 million in 2010. The decrease in 2010 was due to the planned repayment of $32 million of higher rate FHLB Advances during the year and has had a favorable impact on the Company’s net interest income. Subsequent to 2010, the Company completed a successful stock offering and raised $32.6 million in new capital and increased total assets to $472.3 million at March 31, 2011.
Alliance Bancorp, Inc. of PennsylvaniaAsset Growth (millions)$480 $472 $460 $464 $454 $440 $420 $424 $424 $400 $410 $380 $389 $360 $340 2005 2006 2007 2008 2009 2010 2011
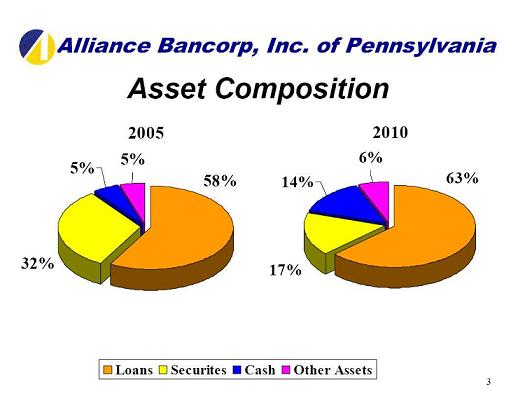
Here we can view the changes in asset composition from 2005 to 2010. The major categories of the Company’s income producing assets consist of loans, securities and cash and are represented by the orange, yellow and blue portions of the chart.
Together they represent approximately 94% of total assets at year end 2010.
The Company’s strong liquidity position will allow us to quickly respond to opportunities in the marketplace while providing protection from increasing interest rates.
Alliance Bancorp, Inc. of Pennsylvania Asset Composition
Loans Securites Cash Other Assets Fixed Assets & REO 58.0% 32.0% 5.0% 5.0%
Loans Securites Cash Other Assets Fixed Assets & REO 63.0% 17.0% 14.0% 6.0%

This slide shows loan production vs. loan repayments over the past several years. In 2010, our loan production exceeded repayments and was the primary factor contributing to a small increase in the total loan portfolio. One of the Company’s main objectives is to continue growing our loan portfolio in the 5-6% range in 2011.
Alliance Bancorp, Inc. of Pennsylvania Loan Production vs. Loan Repayments
(Millions)
2003 2004 2005 2006 2007 2008 2009 2010 LOAN PRODUCTION 93588 70221 73423 75771 77033 75061 65627 50200 LOAN REPAYMENTS 69464 67432 58702 64133 55764 53012 54264 46300

Alliance Bancorp, Inc. of Pennsylvania
Loan Portfolio Composition
Residential Real Estate Commercial Real Estate Construction BusinessConsumer
40.2% 45.7% 8.5% 2.9% 2.6%
Here we can see the composition of the loan portfolio at year end 2009 and 2010. Substantially all, except for 5% of the portfolio is secured by residential, commercial and construction real estate properties. Over the past several years the Company has focused its efforts on building the commercial real estate loan portfolio with shorter term more rate sensitive loans. The average yield earned on the loan portfolio decreased from 6.00% in 2009 to 5.86% in 2010. The Company expects to continue its focus on growing commercial real estate loans in 2011 which are significantly more rate sensitive than residential loans and generally lead to more profitable long term deposit relationships.
Residential Real Estate Commercial Real Estate Construction BusinessConsumer
40.0% 47.0% 8.0% 3.0% 2.0%

This chart breaks out the Company’s deposit composition from all sources. Our primary focus remains on gathering retail and business customer deposits which represent 85% of the Company’s funding sources. During 2010, the Company was able to increase its money market and passbook accounts by $7.7 million or 13% over year end 2009. This growth was achieved while lowering the average rate paid on all interest bearing deposits from
2.18% in 2009 to 1.51% in 2010. Moving ahead into 2011, the Company continues to emphasize its Money Market and checking account products including its highly successful Customer First® Checking account.
Alliance Bancorp, Inc. of Pennsylvania Deposit Composition
Money Market Passbook CD's CD's over $100k Checking East 7.0% 11.0% 49.0% 17.0% 16.0%

This slide shows the Company’s core deposits as compared to our FDIC peer group. Spanning the last few years, you can quickly see how the Company has continued to maintain a stronger core deposit base when compared to the peer group average.
Alliance Bancorp, Inc. of Pennsylvania CORE DEPOSITS
2004 2005 2006 2007 2008 2009 2010 Peer 67.83% 65.69% 0.6239 61.53% 60.93% 61.87% 64.78% Alliance 69.98% 71.29% 0.7291 70.96% 70.30% 69.40% 70.49%Peer group data based on FDIC Uniform Bank Performance Report

The next slide details the changes in stockholders’ equity over the past three years. Since our 2007 corporate reorganization and stock offering, the Company has repurchased 550,000 shares of stock. We recently completed our second step conversion and stock offering in January 2011. This added over $36 million in capital to support continued growth and expansion. Lastly, the Company has consistently paid a quarterly cash dividend dating back to 1995 and has most recently paid a $.03 per share quarterly dividend in February 2011.
Alliance Bancorp, Inc. of Pennsylvania Stockholders Equity Changes (dollars in thousands) 2008 2009 2010 2011(Q1) Opening Balance$51,458 $48,999 $48,445 $48,991 Net Income 605 1,359 1,080 675 Dividends Declared(743) (348) (327) (164) Net Proceeds From Sale of Common Stock 29,982 Equity from MHC 6,816 ESOP Shares Acquired (503) Treasury Stock (2,386) (1,919) (437) -- Other Adjustments(35) 354 230 (49) Ending Balance $48,999 $48,445 $48,991 $85,748

This slide shows the Company’s stock price over the past two years as adjusted for the recently completed reorganization and stock offering. Presently our stock is trading in the $11 range which represents an annual increase of over 10% in each of the last two years.
Management and the Board of Directors will evaluate, as part of its capital management strategy, whether to resume and in what amount our share repurchase program, when permitted by federal regulations.
Alliance Bancorp, Inc. of Pennsylvania Stock Price
Jan-09 Apr-09 Jul-09 Oct-09 Jan-10 Apr-10 Jul-10 Oct-10 Jan-11 Apr-11 Close 9.15 9.67 10.4 10.37 10.24 10.43 10.12 8.89 11.16 11

Here we compare the Company’s average earning assets with its Peer Group over the past several years. As you can see, Alliance has consistently maintained a higher level of average earning assets when compared to its FDIC peer group.
Alliance Bancorp, Inc. of Pennsylvania Average Earning Assets
2004 2005 2006 2007 2008 2009 2010 Alliance 95.34% 95.33% 95.20% 95.22% 95.12% 94.43% 94.36% Peer 94.73% 94.60% 94.60% 94.36% 94.19% 93.93% 93.35%
The Company’s main strategy is to build its business by collecting and expanding core deposit relationships and providing loans to new and existing credit-worthy borrowers. Generally, this strategy has worked well and resulted in year over year increases in net interest income. Management remains committed to minimizing the cost of deposits and maximizing the yield on loans to produce a strong net interest income.
Alliance Bancorp, Inc. of Pennsylvania
Net Interest Income
(Dollars in thousands)
12/31/06 12/31/07 12/31/08 12/31/2009 12/31/2010 Interest Income $10,421 $10,341 $10,841 $11,582 $13,636

Another measure that impacts the Company’s financial results is the performance of its loan portfolio. Like most banks, the Company has seen a significant increase in non-performing assets over the past couple of years. This increase is primarily due to cash flow difficulties and stalled sales experienced by a handful of borrowers as a result of the adverse economic conditions in recent years.
During 2010, the Company added $2.1 million to its allowance for loan losses which amounted to $5.1 million at year end. Although net charge-offs increased from $160,000 in 2009 to $568,000 in 2010, the collateral values securing our loans in the Company's primary lending area have not seen the significant declines as in other parts of the country. Overall, the recession combined with a very slow real estate recovery has played a major role in delaying a resolution of these non-performing assets. We continue to work with our delinquent borrowers to restructure their credits to provide a viable exit strategy for these loans.
Alliance Bancorp, Inc. of Pennsylvania Non-Performing Assets
12/31/03 12/31/04 12/31/05 12/31/2006 12/31/2007 12/31/2008 12/31/2009 12/31/2010 12/31/2011 East 2.27% 1.42% 0.96% 0.38% 0.49% 1.65% 2.33% 4.17% 4.17%

Prior to 2007, our overhead expense was higher than our FDIC peer group. However, the Company has taken the necessary steps to reduce its overhead expense and has consistently maintained a lower overhead expense than our peer group over the past four years.
Alliance Bancorp, Inc. of Pennsylvania Overhead Expense
2004 2005 2006 2007 2008 2009 2010 Peer 2.53% 2.56% 2.54% 2.61% 2.64% 2.74% 2.82% Alliance 2.73% 2.83% 2.69% 2.31% 2.42% 2.46% 2.45%

This slide shows our Net Income over the past five years. Our reported results for 2010 show a decrease from the previous year primarily due to a $2.1 million provision for loan losses in 2010 as compared to $528,000 in 2009. The lower amounts of net income in 2007 and 2008 were primarily due to impairment charges on securities related to the Company’s mutual fund investments. These funds were liquidated and sold in 2008.
Alliance Bancorp, Inc. of Pennsylvania Net Income
(Dollars in thousands)
2006 2007 2008 2009 2010 Net Income $1,371 $1,055 $605 $1,359 $1,080

Our quarterly net income has shown an improving trend over the past four quarters. This has primarily resulted from higher net interest income, lower loan loss provisions and a minimal change in non-interest expenses.
Alliance Bancorp, Inc. of Pennsylvania Quarterly Net Income
(Dollars in thousands)
2010 1Q 2010 2Q 2010 3Q 2010 4Q 2011 1Q Net Income $186 $78 $209 $606 $675
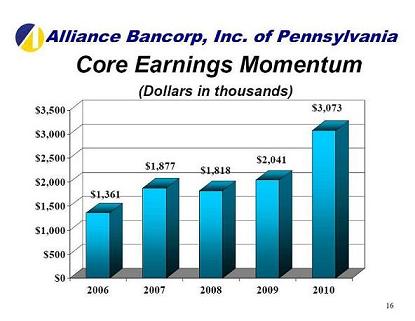
This last slide demonstrates our stable and increasing pre-provision core earnings over the past five years.
Looking to the future, management and the Board are confident we are prepared to meet the economic and business challenges and move our community bank forward in a safe, prudent and profitable manner.
Alliance Bancorp, Inc. of Pennsylvania
Core Earnings Momentum
(Dollars in thousands)
2006 2007 2008 2009 2010 Core Earning Momentum $1,361 $1,877 $1,818 $2,041 $3,073

Alliance Bancorp, Inc. of Pennsylvania
Annual Meeting