Attached files
| file | filename |
|---|---|
| EX-99.1 - EX-99.1 - VEECO INSTRUMENTS INC | a11-10824_1ex99d1.htm |
| EX-99.3 - EX-99.3 - VEECO INSTRUMENTS INC | a11-10824_1ex99d3.htm |
| 8-K - 8-K - VEECO INSTRUMENTS INC | a11-10824_18k.htm |
Exhibit 99.2
|
|
Earnings Conference Call 4/25/11 |
|
|
Introduction Debra A. Wasser, SVP, Investor Relations |

|
|
Safe Harbor Statement To the extent that this presentation discusses expectations or otherwise makes statements about the future, such statements are forward-looking and are subject to a number of risks and uncertainties that could cause actual results to differ materially from the statements made. These items include the risk factors discussed in the Business Description and Management's Discussion and Analysis sections of Veeco's Annual Report on Form 10-K for the year ended December 31, 2010 and subsequent Quarterly Reports on Form 10-Q and current reports on Form 8-K. Veeco does not undertake any obligation to update any forward-looking statements to reflect future events or circumstances after the date of such statements. In addition, this presentation includes non-GAAP financial measures. For GAAP reconciliation, please refer to the reconciliation section in this presentation as well as Veeco’s financial press releases and 10-K and 10-Q filings available on www.veeco.com. Note: All results presented herein are for Veeco’s “Continuing Operations” which excludes the Metrology business sold to Bruker Corporation on October 7, 2010. |
|
|
Q1 2011 Results David D. Glass, CFO |
|
|
Q1 2011 Strong Performance Across the Board See reconciliation to GAAP at end of presentation $ Millions Revenue declined 15% from the record Q4 ‘10 results, as expected, but increased 89% from Q1 ‘10 GAAP EPS was $1.25 and non-GAAP EPS was $1.33 Gross margin was 51% Results in-line with guidance Revenue Net Income Non-GAAP Net Income $255 $53 $57 $135 $23 $18 Q1 '11 Q1 '10 |
|
|
Q1 2011 Revenue & EBITA Performance by Segment Data Storage $40M Down 4% sequentially but up 72% from Q1‘10 Total Revenue: $255M LED & Solar $215M Down 17% sequentially but up 93% from Q1‘10 MOCVD at $204M ($M) Q1 ‘11 Q1 ‘10 Adj EBITA $74 $28 ($M) Q1 ‘11 Q1 ‘10 Adj EBITA $12 $3 See reconciliation to GAAP at end of presentation 84% 16% |
|
|
Q1 2011 Bookings Performance by Segment Data Storage $33M Down 22% sequentially but up 24% year-over-year Total Bookings: $231M LED & Solar $198M Down 22% sequentially and 6% year-over-year primarily due to timing of customer deposits for MOCVD systems. MOCVD remains strong at $186M Book to Bill = .91 to 1; Backlog $530M 86% 14% |
|
|
Q1 2011 Bookings Highlights Data Storage $33M 15 customers placed MOCVD orders China strength continues – Lattice Power, Shanghai Epilight, Nantong Tongfang, Smartlighting, Shandong Huaguang, United LED & others Key customer wins in US, Taiwan and Korea Continued to penetrate new accounts and gain share at existing customers Orders remain lumpy Q-to-Q; Q1 was light on technology and capacity buys Improvement anticipated in Q2 LED & Solar $198M Veeco TurboDisc K465i Veeco PVDi |
|
|
Q1 2011 P&L Highlights See reconciliation to GAAP at end of presentation ($ millions except GM) Q1’11 Q1’10 Q4’10 Revenues $254.7 $134.8 $300.0 Gross Profit 129.3 56.7 152.8 Gross Margin 50.8% 42.1% 50.9% Operating Income 79.7 25.2 100.9 GAAP Net Income 53.1 22.8 96.7 Non-GAAP Net Income 56.6 17.6 67.9 |
|
|
Strong Balance Sheet & Cash Generation in Q1 2011 03/31/2011 12/31/2010 Cash & Short-term Investments* $779.0 $715.4 Accounts Receivable 94.0 150.5 Inventory 121.3 108.5 Fixed Assets, Net 49.0 42.3 Total Assets 1,163.0 1,148.0 Long-term Debt (including current portion) 97.6 104.0 Equity 823.9 762.5 * Includes restricted cash of $76.1M at 3/31/11 and 12/31/10 ($ millions) Cash and short-term investments grew $64M Accounts receivable decreased $57M, representing 33 days sales outstanding Inventory grew by $13M to $121M, resulting in turns of 4.1 4/25: Announced call for redemption of all outstanding 4.125% convertible subordinated notes due 2012 (~$91.6M aggregate principle amount) |
|
|
Business Update and Q2 Guidance John R. Peeler, CEO |
|
|
China Update: Establishing a Domestic LED Value Chain National goal to achieve long-term sustainable economic growth Reduce pollution, lower energy consumption, become more energy efficient & increase domestic demand LED lighting: Key opportunity to cultivate green & sustainable industries Part of New Energy, Energy-Saving and Environmental Protection, 1 of 7 emerging strategic industries identified by state council in the 12th 5-year plan Aggressively developing domestic LED value chain in phases Growing domestic LED supply scale: equipment subsidies, industry parks, and international cooperation Stimulating internal demand: demonstration projects, applications programs (e.g., streetlights) and anticipated incentives for LED lighting products Increasing LED performance & manufacturing capability: position for global competition Long-term, systematic approach: cultivate LED industry to support its national economic objective Determination to develop LED supply chain drives MOCVD investment opportunities |
|
|
Veeco’s China Opportunity Just Beginning China central and local governments are providing incentives to establish LED manufacturing capacity throughout China MOCVD equipment subsidies (~$1.5M), tax breaks and land grants; regional competition A number of LED Manufacturers plan to invest without per-tool subsidies Zero interest loans and other government support Driving significant investments in LED manufacturing capacity by many companies Projects announced to date total >1,600 MOCVD reactors; >$4B in capex (Source: UBS 4/4/11); ~300 reactors were shipped and installed in 2009 & 2010 Major Chinese manufacturing companies are positioning themselves to win in LED manufacturing – domestic market and export Existing LED companies, JV partners and new entrants all investing The number of companies manufacturing LEDs continues to expand in 2011 Aspiration to supply LEDs globally means potential market for MOCVD reactors even larger China’s LED supply base has increased rapidly but there is much more growth to come |
|
|
Veeco CTC Opens to Support Customer Training Requirements Goal: Train Hundreds of Engineers to Use Veeco MOCVD Systems China Training Center, Shanghai, China Veeco Becoming “Supplier of Choice” to Chinese Companies |
|
|
Evolving LED Market Dynamics in Asia Reports of significant improvement in luminous efficiency from Taiwan’s LED epitaxy factories Ex: Formosa Epitaxy recently achieved 150 lm/W for 45mil Blue LED chip Taiwan’s Epistar, Formosa Epitaxy and GPI: utilization rates are rising rapidly and they are becoming more price competitive Korean LED manufacturers’ utilization rates also improving: intent on gaining share both in BLU and SSL Veeco opening world-class MOCVD demo/R&D/ process support facilities in Taiwan and Korea to solidify key customer relationships Source: GG LED 4/6/2011 (http://www.semi.org/ch/node/14601) LED Manufacturers across Asia are investing for the long term and Veeco expects to be the preferred supplier |
|
|
MaxBright™: Fast Adoption by Key Customers As planned, shipped three 4-chamber systems in Q1 Received multiple orders from leading accounts in Korea, Taiwan, China 3 of the top Taiwanese LED makers have placed MaxBright P.O.s Currently planning to ship 4-8 MaxBright systems in Q2 Very strong pipeline & quoting activity...we are well positioned for continued growth & share gain Lowest Cost of Ownership Highest throughput Highest capacity Highest footprint efficiency Highest capital efficiency |
|
|
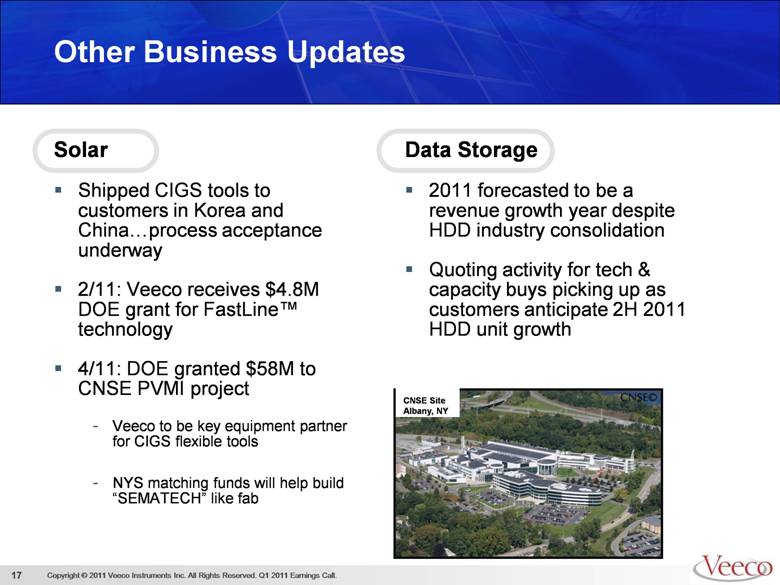
Other Business Updates Solar Shipped CIGS tools to customers in Korea and China...process acceptance underway 2/11: Veeco receives $4.8M DOE grant for FastLine™ technology 4/11: DOE granted $58M to CNSE PVMI project Veeco to be key equipment partner for CIGS flexible tools NYS matching funds will help build “SEMATECH” like fab Data Storage 2011 forecasted to be a revenue growth year despite HDD industry consolidation Quoting activity for tech & capacity buys picking up as customers anticipate 2H 2011 HDD unit growth CNSE Site Albany, NY |
|
|
Q2 2011 Revenue and Earnings Guidance Revenue $255-285M Gross Margins ~50% Operating Spending $54-55M (19-22%) Adjusted EBITA 30-32% GAAP EPS $1.08-$1.32 Non-GAAP EPS $1.20-$1.45 See reconciliation to GAAP at end of presentation |
|
|
Q2 2011 Order Outlook Currently forecast Veeco’s Q2 orders at 25% or more above Q1 level and we have visibility to continued strength through Q3: Extremely strong levels of quoting activity Fast adoption of MaxBright and continued purchases of market-leading K465i China’s commitment to LED for solid state lighting remains strong; Korean and Taiwanese utilization rates increasing Data Storage orders will be lumpy on a quarterly basis, but we expect Q2 to improve over Q1 levels |
|
|
Expect 2011 to be a solid year for MOCVD tool demand (BLU and lighting) Veeco opportunity to continue to gain share with most productive MOCVD systems CIGS Solar business will begin to deliver revenue in 2011 as we ship tools to key customers Data Storage business outlook remains favorable with strong customer alignment for technology and capacity buys Reaffirming Full Year 2011 Outlook 2011 Forecast: >$1B in revenue > $5.00 in Non-GAAP EPS Beginning backlog of $555M Visibility to strong 1H 2011 orders |
|
|
Q&A Session |

|
|
Financial Tables |
|
|
Q1 2011 Income Statement 2011 2010 Net sales 254,676 $ 134,750 $ Cost of sales 125,344 78,010 Gross profit 129,332 56,740 Operating expenses (income): Selling, general and administrative 23,933 17,726 Research and development 24,582 12,956 Amortization 1,135 1,237 Restructuring - (179) Other, net 13 (175) Total operating expenses 49,663 31,565 Operating income 79,669 25,175 Interest expense, net 1,299 1,783 Loss on extinguishment of debt 304 - Income from continuing operations before income taxes 78,066 23,392 Income tax provision 24,983 567 Income from continuing operations 53,083 22,825 Discontinued operations: (Loss) income from discontinued operations before income taxes (498) 3,962 Income tax (benefit) provision (57) 743 (Loss) income from discontinued operations (441) 3,219 Net income 52,642 $ 26,044 $ Income (loss) per common share: Basic: Continuing operations 1.33 $ 0.59 $ Discontinued operations (0.01) 0.08 Income 1.32 $ 0.67 $ Diluted: Continuing operations 1.25 $ 0.54 $ Discontinued operations (0.01) 0.08 Income 1.24 $ 0.62 $ Weighted average shares outstanding: Basic 39,842 38,784 Diluted 42,531 42,269 March 31, Three months ended Veeco Instruments Inc. and Subsidiaries Condensed Consolidated Statements of Income (In thousands, except per share data) (Unaudited) |
|
|
Q1 2011 Balance Sheet March 31, December 31, 2011 2010 (Unaudited) ASSETS Current assets: Cash and cash equivalents 276,837 $ 245,132 $ Short-term investments 426,025 394,180 Restricted cash 76,117 76,115 Accounts receivable, net 94,041 150,528 Inventories, net 121,342 108,487 Prepaid expenses and other current assets 31,676 34,328 Deferred income taxes, current 5,772 13,803 Total current assets 1,031,810 1,022,573 Property, plant and equipment, net 48,981 42,320 Goodwill 52,003 52,003 Deferred income taxes 9,403 9,403 Other assets, net 20,814 21,735 Total assets 1,163,011 $ 1,148,034 $ LIABILITIES AND EQUITY Current liabilities: Accounts payable 38,678 $ 32,220 $ Accrued expenses and other current liabilities 171,275 183,010 Deferred profit 4,518 4,109 Income taxes payable 21,347 56,369 Liabilities of discontinued segment held for sale 5,359 5,359 Current portion of long-term debt 94,973 101,367 Total current liabilities 336,150 382,434 Long-term debt 2,594 2,654 Other liabilities 392 434 Total liabilities 339,136 385,522 Equity 823,875 762,512 Total liabilities and equity 1,163,011 $ 1,148,034 $ Veeco Instruments Inc. and Subsidiaries Condensed Consolidated Balance Sheets (In thousands) |
|
|
Q1 2011 Reconciliation 2011 2010 Adjusted EBITA Operating income 79,669 $ 25,175 $ Adjustments: Amortization 1,135 1,237 Equity-based compensation 3,098 1,866 Restructuring - (179) (1) 83,902 $ 28,099 $ Non-GAAP Net Income Net income from continuing operations (GAAP basis) 53,083 $ 22,825 $ Non-GAAP adjustments: Amortization 1,135 1,237 Equity-based compensation 3,098 1,866 Restructuring - (179) (1) Loss on extinguishment of debt 304 - Non-cash portion of interest expense 769 (2) 741 (2) Income tax effect of non-GAAP adjustments (1,838) (3) (8,900) (3) Non-GAAP Net Income 56,551 $ 17,590 $ Non-GAAP earnings per diluted share excluding certain items ("Non-GAAP EPS") 1.33 $ 0.42 $ Diluted weighted average shares outstanding 42,531 42,269 March 31, Veeco Instruments Inc. and Subsidiaries Reconciliation of GAAP to non-GAAP results (In thousands, except per share data) (Unaudited) (3) By the end of 2010, the Company had fully utilized all prior NOL and tax credit carryfowards. As a result, beginning in 2011, the Company utilized the with and without method, at a 32% effective rate, to determine the income tax effect of non-GAAP adjustments. During the first quarter of 2010 we provided for income taxes at a 35% statutory rate to determine the income tax effect of non-GAAP adjustments. NOTE - This reconciliation is not in accordance with, or an alternative method for, generally accepted accounting principles in the United States, and may be different from similar measures presented by other companies. Management of the Company evaluates performance of its business units based on adjusted EBITA, which is the primary indicator used to plan and forecast future periods. The presentation of this financial measure facilitates meaningful comparison with prior periods, as management of the Company believes adjusted EBITA reports baseline performance and thus provides useful information. (1) During the first quarter of 2010, we recorded a restructuring credit of $0.2 million associated with a change in estimate. (2) Adjustment to exclude non-cash interest expense on convertible subordinated notes. Earnings from continuing operations before interest, income taxes and amortization excluding certain items ("Adjusted EBITA") Three months ended |
|
|
Q2 2011 Guidance LOW HIGH Adjusted EBITA Operating income 70,952 $ 86,452 $ Adjustments: Amortization 1,454 1,454 Equity-based compensation 3,818 3,818 76,224 $ 91,724 $ Non-GAAP Net Income Net income from continuing operations (GAAP basis) 46,250 $ 56,792 $ Non-GAAP adjustments: Amortization 1,454 1,454 Equity-based compensation 3,818 3,818 Loss on extinguishment of debt 2,794 2,794 Non-cash portion of interest expense 247 (1) 247 (1) Income tax effect of non-GAAP adjustments (2,797) (2) (2,825) (2) Non-GAAP Net Income 51,766 $ 62,280 $ Non-GAAP earnings per diluted share excluding certain items ("Non-GAAP EPS") 1.20 $ 1.45 $ Diluted weighted average shares outstanding 43,000 43,000 NOTE - This reconciliation is not in accordance with, or an alternative method for, generally accepted accounting principles in the United States, and may be different from similar measures presented by other companies. Management of the Company evaluates performance of its business units based on adjusted EBITA, which is the primary indicator used to plan and forecast future periods. The presentation of this financial measure facilitates meaningful comparison with prior periods, as management of the Company believes adjusted EBITA reports baseline performance and thus provides useful information. Veeco Instruments Inc. and Subsidiaries Reconciliation of GAAP to non-GAAP results (In thousands, except per share data) (Unaudited) the three months ending June 30, 2011 (1) Adjustment to exclude non-cash interest expense on convertible subordinated notes. Earnings from continuing operations before interest, income taxes and amortization excluding certain items ("Adjusted EBITA") (2) By the end of 2010, the Company had fully utilized all prior NOL and tax credit carryfowards. As a result, beginning in 2011, the Company utilized the with and without method, at a 32% effective rate, to determine the income tax effect of non-GAAP adjustments. Guidance for |
|
|
Q1 2011 Segment Information 2011 2010 LED & Solar Bookings 198,265 $ 211,663 $ Revenues 214,698 $ 111,505 $ Operating income 72,272 $ 27,095 $ Amortization 714 796 Equity-based compensation 977 467 Adjusted EBITA 73,963 $ 28,358 $ Data Storage Bookings 32,615 $ 26,372 $ Revenues 39,978 $ 23,245 $ Operating income 11,560 $ 2,458 $ Amortization 363 383 Equity-based compensation 308 215 Restructuring - (179) Adjusted EBITA 12,231 $ 2,877 $ Unallocated Corporate Operating loss (4,163) $ (4,378) $ Amortization 58 58 Equity-based compensation 1,813 1,184 Adjusted loss (2,292) $ (3,136) $ Total Bookings 230,880 $ 238,035 $ Revenues 254,676 $ 134,750 $ Operating income 79,669 $ 25,175 $ Amortization 1,135 1,237 Equity-based compensation 3,098 1,866 Restructuring - (179) Adjusted EBITA 83,902 $ 28,099 $ (Unaudited) Three months ended March 31, Veeco Instruments Inc. and Subsidiaries Segment Bookings, Revenues, and Reconciliation of Operating Income (Loss) to Adjusted EBITA (Loss) (In thousands) |
|
|
Earnings Conference Call 4/25/11 |