Attached files
| file | filename |
|---|---|
| 8-K - FORM 8-K - IDEX CORP /DE/ | c64289e8vk.htm |
| EX-99.2 - EX-99.2 - IDEX CORP /DE/ | c64289exv99w2.htm |
Exhibit 99.1

| First Quarter 2011 Earnings Release April 21, 2011 |
| Agenda 2 IDEX Economics IDEX Markets Q1 2011 Performance 2011 Guidance |
| Replay Information Dial toll-free: 800.642.1687 International: 706.645.9291 Conference ID: #56253366 Log on to: www.idexcorp.com 3 |
| Cautionary Statement Under the Private Securities Litigation Reform Act This presentation and discussion will include forward-looking statements. Our actual performance may differ materially from that indicated or suggested by any such statements. There are a number of factors that could cause those differences, including those presented in our most recent annual report and other company filings with the SEC. 4 |
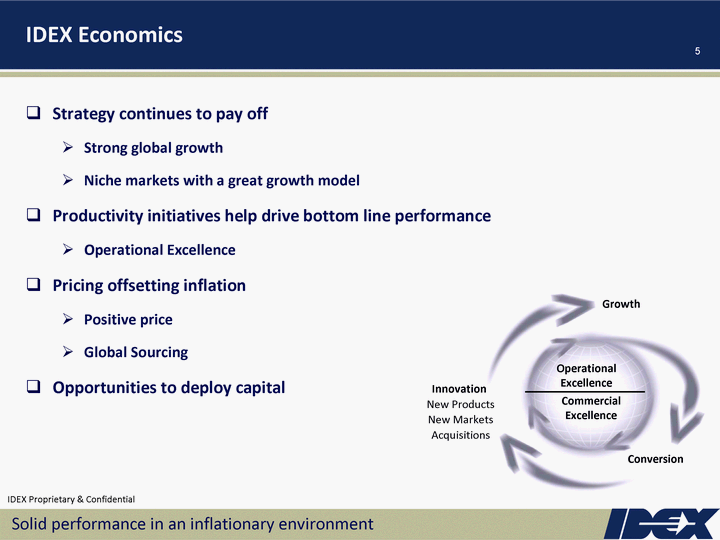
| IDEX Economics Strategy continues to pay off Strong global growth Niche markets with a great growth model Productivity initiatives help drive bottom line performance Operational Excellence Pricing offsetting inflation Positive price Global Sourcing Opportunities to deploy capital 5 Solid performance in an inflationary environment Operational Excellence Growth Conversion Innovation New Products New Markets Acquisitions Commercial Excellence |
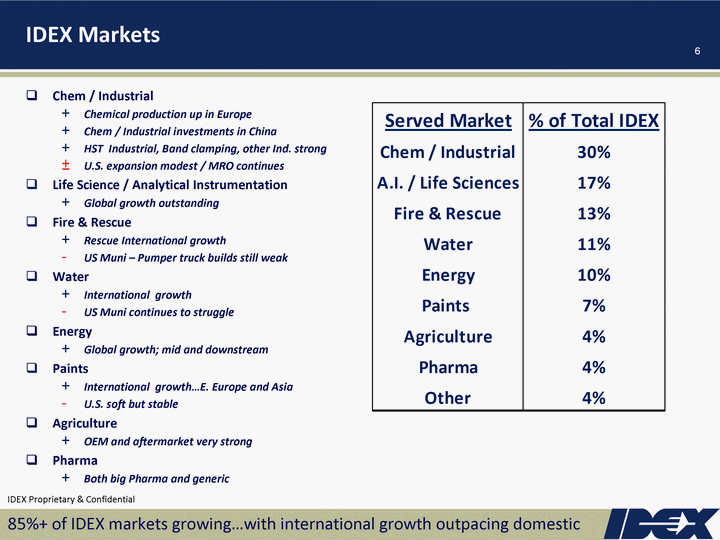
| IDEX Markets Chem / Industrial Chemical production up in Europe Chem / Industrial investments in China HST Industrial, Band clamping, other Ind. strong U.S. expansion modest / MRO continues Life Science / Analytical Instrumentation Global growth outstanding Fire & Rescue Rescue International growth US Muni - Pumper truck builds still weak Water International growth US Muni continues to struggle Energy Global growth; mid and downstream Paints International growth...E. Europe and Asia U.S. soft but stable Agriculture OEM and aftermarket very strong Pharma Both big Pharma and generic 6 85%+ of IDEX markets growing...with international growth outpacing domestic |
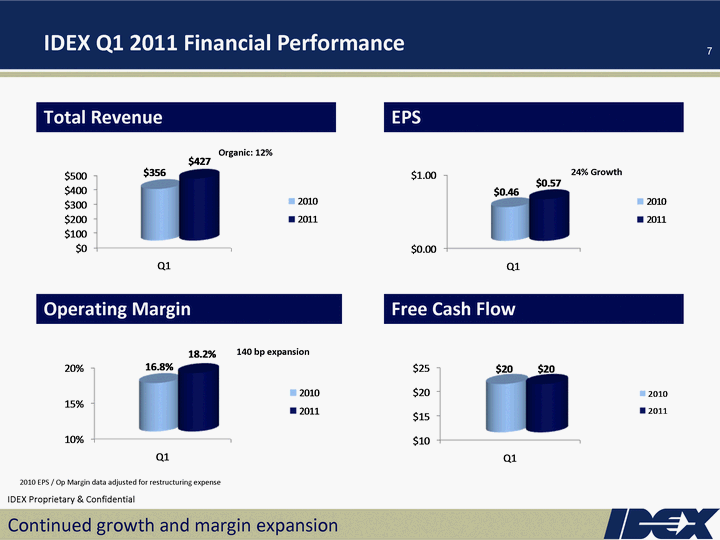
| Total Revenue Operating Margin Free Cash Flow EPS IDEX Q1 2011 Financial Performance Continued growth and margin expansion 7 2010 EPS / Op Margin data adjusted for restructuring expense Organic: 12% 24% Growth 140 bp expansion |
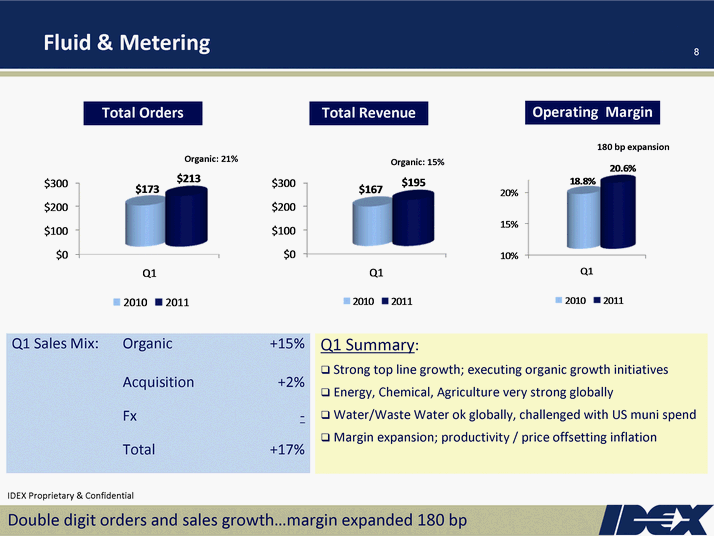
| Fluid & Metering Double digit orders and sales growth...margin expanded 180 bp 8 Q1 Sales Mix: Organic +15% Acquisition +2% Fx - Total +17% Q1 Summary: Strong top line growth; executing organic growth initiatives Energy, Chemical, Agriculture very strong globally Water/Waste Water ok globally, challenged with US muni spend Margin expansion; productivity / price offsetting inflation Total Orders Total Revenue Operating Margin Organic: 21% Organic: 15% 180 bp expansion |
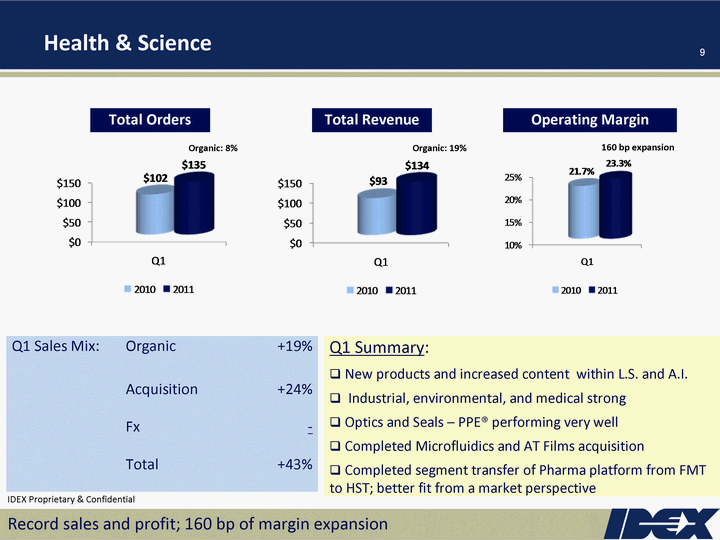
| Health & Science Record sales and profit; 160 bp of margin expansion 9 Q1 Sales Mix: Organic +19% Acquisition +24% Fx - Total +43% Q1 Summary: New products and increased content within L.S. and A.I. Industrial, environmental, and medical strong Optics and Seals - PPE(r) performing very well Completed Microfluidics and AT Films acquisition Completed segment transfer of Pharma platform from FMT to HST; better fit from a market perspective Total Orders Total Revenue Operating Margin Organic: 8% 160 bp expansion Organic: 19% |
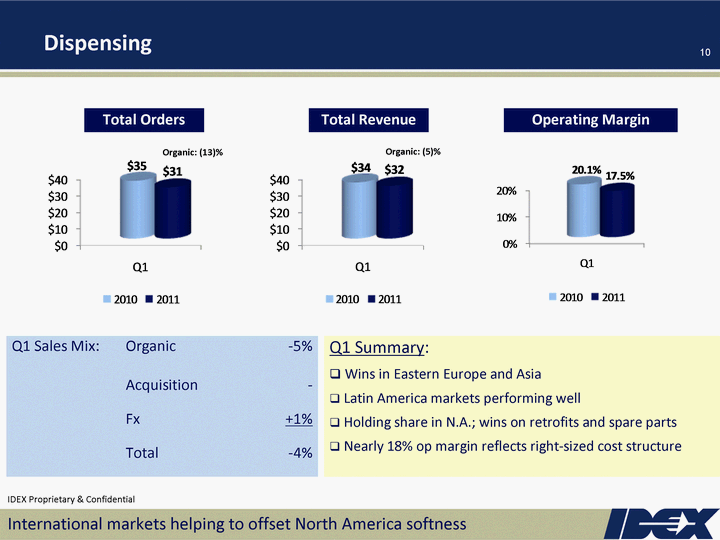
| Dispensing International markets helping to offset North America softness 10 Q1 Sales Mix: Organic -5% Acquisition - Fx +1% Total -4% Q1 Summary: Wins in Eastern Europe and Asia Latin America markets performing well Holding share in N.A.; wins on retrofits and spare parts Nearly 18% op margin reflects right-sized cost structure Total Orders Total Revenue Operating Margin Organic: (13)% Organic: (5)% |
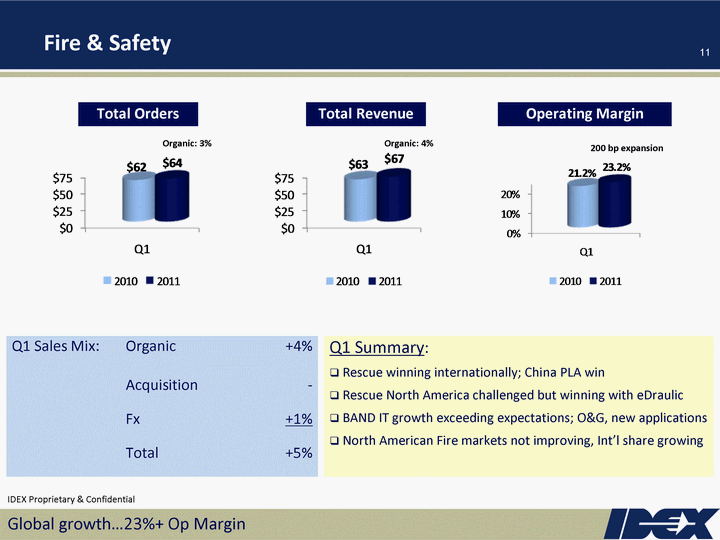
| Fire & Safety Global growth...23%+ Op Margin 11 Q1 Sales Mix: Organic +4% Acquisition - Fx +1% Total +5% Q1 Summary: Rescue winning internationally; China PLA win Rescue North America challenged but winning with eDraulic BAND IT growth exceeding expectations; O&G, new applications North American Fire markets not improving, Int'l share growing Total Orders Total Revenue Operating Margin Organic: 3% Organic: 4% 200 bp expansion |
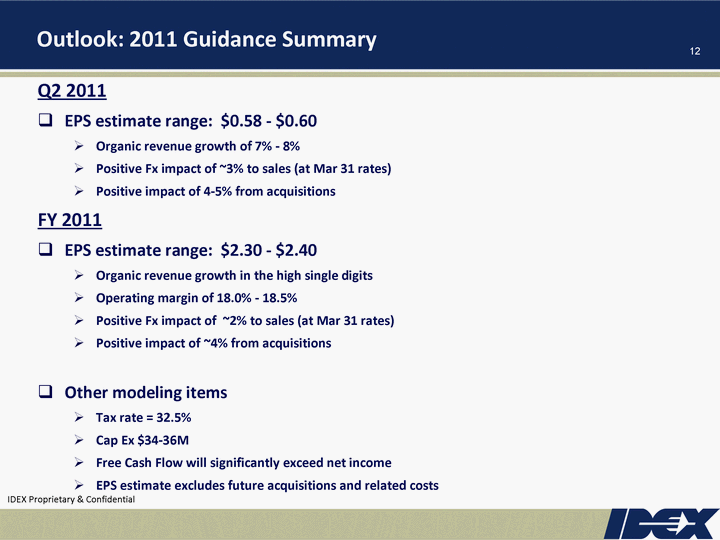
| Outlook: 2011 Guidance Summary Q2 2011 EPS estimate range: $0.58 - $0.60 Organic revenue growth of 7% - 8% Positive Fx impact of ~3% to sales (at Mar 31 rates) Positive impact of 4-5% from acquisitions FY 2011 EPS estimate range: $2.30 - $2.40 Organic revenue growth in the high single digits Operating margin of 18.0% - 18.5% Positive Fx impact of ~2% to sales (at Mar 31 rates) Positive impact of ~4% from acquisitions Other modeling items Tax rate = 32.5% Cap Ex $34-36M Free Cash Flow will significantly exceed net income EPS estimate excludes future acquisitions and related costs 12 |
| Q&A 13 |
