Attached files
| file | filename |
|---|---|
| 8-K - SHENANDOAH TELECOMMUNICATIONS COMPANY 8-K 4-19-2011 - SHENANDOAH TELECOMMUNICATIONS CO/VA/ | form8k.htm |
| EX-99.2 - EXHIBIT 99.2 - SHENANDOAH TELECOMMUNICATIONS CO/VA/ | ex99_2.htm |

Annual Shareholder Meeting
April 19, 2011
Exhibit 99.1

2
Adele Skolits
CFO and VP of Finance

3
Safe Harbor Statement
This presentation includes “forward-looking statements” within the meaning of Section
27A of the Securities Act and Section 21E of the Securities Exchange Act of 1934, as
amended, regarding, among other things, our business strategy, our prospects and our
financial position. These statements can be identified by the use of forward-looking
terminology such as “believes,” “estimates,” “expects,” “intends,” “may,” “will,”
“should,” “could,” or “anticipates” or the negative or other variation of these similar
words, or by discussions of strategy or risks and uncertainties. These statements are
based on current expectations of future events. If underlying assumptions prove
inaccurate or unknown risks or uncertainties materialize, actual results could vary
materially from the Company’s expectations and projections. Important factors that
could cause actual results to differ materially from such forward-looking statements
include, without limitation, risks related to the following:
qIncreasing competition in the communications industry; and
qA complex and uncertain regulatory environment.
A further list and description of these risks, uncertainties and other factors can be found
in the Company’s SEC filings which are available online at www.sec.gov,
www.shentel.com or on request from the Company. The Company does not undertake
to update any forward-looking statements as a result of new information or future
events or developments
in the Company’s SEC filings which are available online at www.sec.gov,
www.shentel.com or on request from the Company. The Company does not undertake
to update any forward-looking statements as a result of new information or future
events or developments

4
Use of Non-GAAP Financial Measures
Included in this presentation are certain non-GAAP financial measures that are not
determined in accordance with US generally accepted accounting principles. These
financial performance measures are not indicative of cash provided or used by operating
activities and exclude the effects of certain operating, capital and financing costs and
may differ from comparable information provided by other companies, and they should
not be considered in isolation, as an alternative to, or more meaningful than measures
of financial performance determined in accordance with US generally accepted
accounting principles. These financial performance measures are commonly used in the
industry and are presented because Shentel believes they provide relevant and useful
information to investors. Shentel utilizes these financial performance measures to
assess its ability to meet future capital expenditure and working capital requirements, to
incur indebtedness if necessary, return investment to shareholders and to fund
continued growth. Shentel also uses these financial performance measures to evaluate
the performance of its businesses and for budget planning purposes.

5
2010 Financial Highlights
Net Income (in millions)
Net Income from Continuing
Operations (in millions)
Operations (in millions)

6
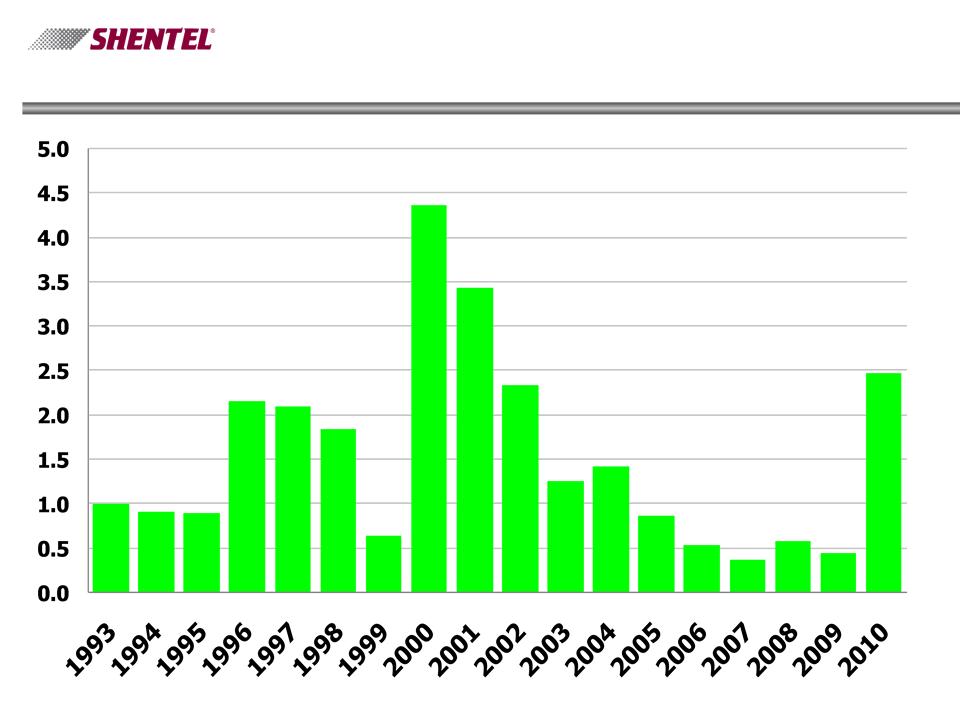
Long-term Growth in Net Income (in millions)

7
2010 Significant Events
qJetBroadBand acquisition-related
transaction costs - $3.1 million before tax
and $1.8 million after tax
transaction costs - $3.1 million before tax
and $1.8 million after tax
qNew Prepaid Customers - Net loss $.6
million pre-tax, $.4 million after-tax
million pre-tax, $.4 million after-tax
qClosed Defined Benefit Pension Plan -
Incurred cost of $3.8 million, pre-tax, $2.3
million after tax
Incurred cost of $3.8 million, pre-tax, $2.3
million after tax
qDirectory Sale - sold publishing rights for $4
million gain pre-tax, $2.4 million after tax
million gain pre-tax, $2.4 million after tax

8
Growth in Revenues (in millions)
Note: Effective 2007, Shentel amended its agreement with Sprint Nextel. The net
effect of this amendment was a reduction in both revenues and expenses.

9
2010 Expenses (in millions) as % of Revenue
10
Debt to Operating Cash Flow
11
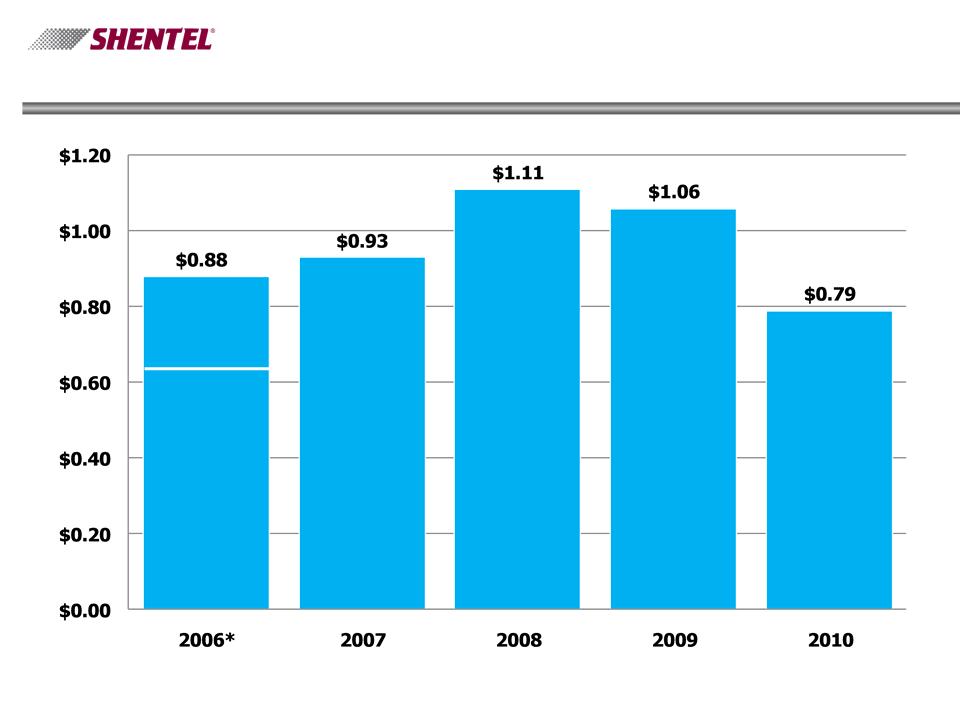
Earnings Per Share (EPS) - Continuing Operations
*-Includes gain on sale of Rural Telephone Bank stock of $.27 in EPS from Continuing Operations and EPS

12
Earnings Per Share (EPS)
*-Includes gain on sale of Rural Telephone Bank stock of $.27 in EPS from Continuing Operations and EPS
13
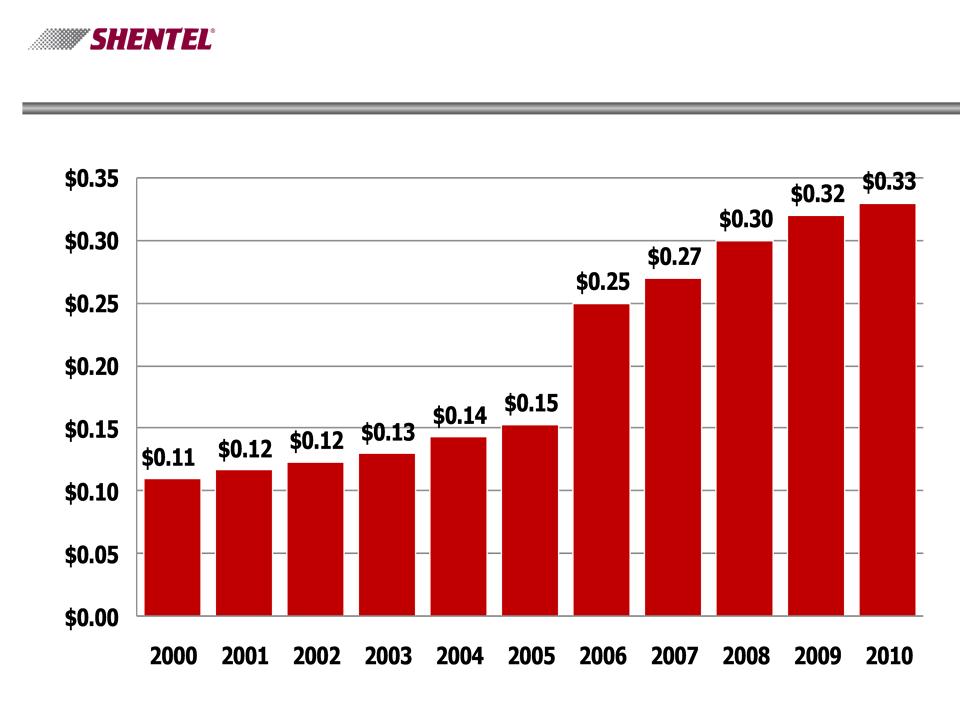
Cash Dividends Per Share

14
Wireless Segment - Significant Changes in Adjusted
OIBDA 2010 vs. 2009 (in $ millions)
OIBDA 2010 vs. 2009 (in $ millions)

15
Cable Segment - Significant Changes in Adjusted
OIBDA 2010 vs. 2009 (in $ millions)
OIBDA 2010 vs. 2009 (in $ millions)

16
Total Return - 5 Years

17
Earle MacKenzie
COO and EVP

18
Key Operational Results - Wireless
PCS Retail Subscribers (000s)

19
Key Operational Results - Wireless
PCS Net Additions

20
How Does Shentel’s Wireless Compare?
2010 Results (in thousands)
Verizon
AT&T
Sprint
Shentel
US
Cellular
Cellular
Alltel
(ATNI)
(ATNI)
T-
Mobile
Mobile
NTELOS
Covered
POPs
POPs
292,000
296,000
277,800
2,049
46,546
6,750
300,000
5,832
2010 Net
Adds or
(Loss)
Adds or
(Loss)
1,977
3,105
783
30
(15)
(110)
(856)
(6)
Total Subs
87,535
74,565
45,389
303
5,729
718
30,934
432
Penetration
30.0%
24.9%
16.3%
14.8%
12.3%
10.6%
10.3%
7.4%
Note: Totals exclude wholesale subscribers.

21
Key Operational Results - Wireless
PCS Gross Billed Data & Voice

22
$144.8
$156.8
Key Operational Results - Wireless
PCS Annual Billed Service Revenues (in millions)
* $25.2M of Management & Service Fees includes $24.8M from Postpaid and $.4M from Prepaid.
**
** $111.3M of Net Revenue includes $105.7M from Postpaid and $5.6M from Prepaid.
*
23
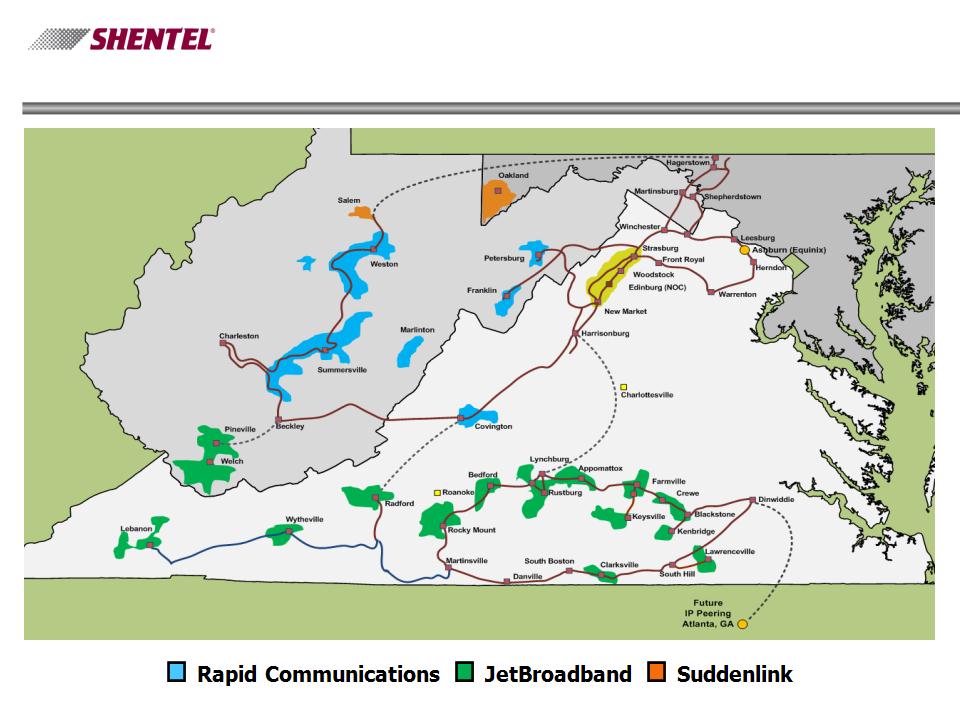
Cable Service Areas

24
Cable Revenue Generating Units (000s)

25
How Does Shentel Cable Compare?
* Industry Averages are from SNL Kagan's estimate of U.S. totals.

26
Key Operational Results - Wireline
Access Lines (000s)

27
Key Operational Results - Wireline
Internet Customers (000s)

28
Investing in the Future - CapEx Spending
$0.5 each,
Cable and
Other
Other

Annual Shareholder Meeting
April 19, 2011