Attached files
| file | filename |
|---|---|
| 8-K - FORM 8-K - SUNTRUST BANKS INC | d8k.htm |
| EX-99.1 - NEWS RELEASE - SUNTRUST BANKS INC | dex991.htm |
| EX-99.3 - NEWS RELEASE - SUNTRUST BANKS INC | dex993.htm |
 SunTrust Banks, Inc.
1Q 2011 Earnings Presentation
April 21, 2011
Exhibit 99.2 |
 1
Important Cautionary Statement
The following should be read in conjunction with the financial statements, notes and other information
contained in the Company’s 2010 Annual Report on Form 10-K, Quarterly Reports on Form 10-Q, and Current Reports
on Form 8-K.
This presentation includes non-GAAP financial measures to describe SunTrust’s performance. The
reconciliations of those measures to GAAP measures are provided within or in the appendix of this presentation. In this
presentation, net interest income and net interest margin are presented on a fully
taxable-equivalent (“FTE”) basis, and ratios are presented on an annualized basis. The FTE basis adjusts for the tax-favored status of
income from certain loans and investments. The Company believes this measure to be the preferred
industry measurement of net interest income and provides relevant comparison between taxable and non-taxable
amounts.
This presentation contains forward-looking statements. Statements regarding our expectations about
nonperforming loans and net charge-offs, net interest margin, and the impacts of legislative and regulatory changes are
forward-looking statements. Also, any statement that does not describe historical or current facts,
is a forward-looking statement. These statements often include the words “believes,” “expects,” “anticipates,” “estimates,”
“intends,” “plans,” “goals,” “targets,”
“initiatives,” “potentially,” “probably,” “projects,” “outlook” or similar expressions or future conditional verbs such as “may,” “will,” “should,” “would,”
and “could.” Forward-looking statements are based upon the current beliefs and
expectations of management and on information currently available to management. Our statements speak as of the date hereof, and we do not assume any obligation to
update these statements or to update the reasons why actual results could differ from those contained
in such statements in light of new information or future events. Forward-looking statements are subject to significant risks and uncertainties. Investors are
cautioned against placing undue reliance on such statements. Actual results may differ materially from those set forth in the
forward-looking statements. Factors that could cause actual results to differ materially from those
described in the forward-looking statements can be found in Item 1A of Part I of our 10-K and in other periodic reports that
we file with the SEC. Those factors include: difficult market conditions have adversely affected
our industry; concerns over market volatility continue; recently enacted legislation, legislation enacted in the future, and
certain proposed federal programs subject us to increased regulation and may adversely affect us; the
Dodd-Frank Act makes fundamental changes to the regulation of the financial services industry, some of which may
adversely affect our business; SunTrust Bank may be subject to higher deposit insurance assessments; we
are subject to capital adequacy and liquidity guidelines and, if we fail to meet these guidelines, our financial
condition would be adversely affected; emergency measures designed to stabilize the U.S. banking system
are beginning to wind down; we are subject to credit risk; our ALLL may not be adequate to cover our eventual
losses; we will realize future losses if the proceeds we receive upon liquidation of nonperforming
assets are less than the carrying value of such assets; weakness in the economy and in the real estate market, including
specific weakness within our geographic footprint, has adversely affected us and may continue to
adversely affect us; weakness in the real estate market, including the secondary residential mortgage loan markets, has
adversely affected us and may continue to adversely affect us; we are subject to certain risks from
originating, selling, and holding mortgages, including the risk that we may be required to repurchase mortgage loans or
indemnify mortgage loan purchasers as a result of breaches of representations and warranties, borrower
fraud, or certain borrower defaults, which could harm our liquidity, results of operations, and financial condition; we
are subject to risks related to delays in the foreclosure process; we may continue to suffer increased
losses in our loan portfolio despite enhancement of our underwriting policies; as a financial services company, adverse
changes in general business or economic conditions could have a material adverse effect on our
financial condition and results of operations; changes in market interest rates or capital markets could adversely affect our
revenue and expense, the value of assets and obligations, and the availability and cost of capital or
liquidity; the fiscal and monetary policies of the federal government and its agencies could have a material adverse effect
on our earnings; depressed market values for our stock may require us to write down goodwill; clients
could pursue alternatives to bank deposits, causing us to lose a relatively inexpensive source of funding; consumers
may decide not to use banks to complete their financial transactions, which could affect net income; we
have businesses other than banking which subject us to a variety of risks; hurricanes and other natural or man-made
disasters may adversely affect loan portfolios and operations and increase the cost of doing business;
negative public opinion could damage our reputation and adversely impact business and revenues; the soundness of
other financial institutions could adversely affect us; we rely on other companies to provide key
components of our business infrastructure; we rely on our systems, employees, and certain counterparties, and certain
failures could materially adversely affect our operations; we depend on the accuracy and completeness
of information about clients and counterparties; regulation by federal and state agencies could adversely affect the
business, revenue, and profit margins; competition in the financial services industry is intense and
could result in losing business or margin declines; maintaining or increasing market share depends on market acceptance
and regulatory approval of new products and services; we may not pay dividends on your common stock;
our ability to receive dividends from our subsidiaries could affect our liquidity and ability to pay dividends;
disruptions in our ability to access global capital markets may negatively affect our capital resources
and liquidity; any reduction in our credit rating could increase the cost of our funding from the capital markets; we have in
the past and may in the future pursue acquisitions, which could affect costs and from which we may not
be able to realize anticipated benefits; we are subject to certain litigation, and our expenses related to this litigation
may adversely affect our results; we depend on the expertise of key personnel, and if these individuals
leave or change their roles without effective replacements, operations may suffer; we may not be able to hire or retain
additional qualified personnel and recruiting and compensation costs may increase as a result of
turnover, both of which may increase costs and reduce profitability and may adversely impact our ability to implement our
business strategy; our accounting policies and processes are critical to how we report our financial
condition and results of operations, and require management to make estimates about matters that are uncertain; changes
in our accounting policies or in accounting standards could materially affect how we report our
financial results and condition; our stock price can be volatile; our disclosure controls and procedures may not prevent or
detect all errors or acts of fraud; our financial instruments carried at fair value expose us to
certain market risks; our revenues derived from our investment securities may be volatile and subject to a variety of risks; and we
may enter into transactions with off-balance sheet affiliates or our subsidiaries.
|
 2
Table of Contents
I.
TARP SHARES REDEMPTION
II.
FINANCIAL PERFORMANCE
III.
RISK REVIEW
IV.
BUSINESS HIGHLIGHTS
V.
APPENDIX |
 TARP
Redemption I. TARP SHARES REDEMPTION
TARP Redemption Completed Following Successful Equity and Debt Offerings
Key Points
•
Following the Federal Reserve’s review of SunTrust’s
capital plan in connection with the Comprehensive
Capital Analysis and Review (CCAR), SunTrust
completed $1 billion equity and debt offerings to
facilitate TARP redemption
•
Both offerings were substantially oversubscribed and
well-received by the market, as evidenced by the
equity offering’s 4.4% file-to-offer premium
•
TARP shares were repurchased from the U.S.
•
SunTrust demonstrated a patient, deliberate
approach to TARP redemption, which ultimately
benefited
our
shareholders.
In
connection
with
TARP redemption, SunTrust's common stock
issuance as a percentage of TARP outstanding
was 21%
Common Stock Offering –
3/18/11
Senior Debt Offering –
3/21/11
Total Offering Size
$1.0B
Shares Offered
35.3MM
Closing Stock Price 3/17/11
$28.25
Closing Stock Price 3/18/11
$29.59
Offering Price
$29.50
File-to-Offer Premium
4.4%
Total Offering Size
$1.0B
Maturity
April 2016
Coupon
3.60%
Offering Price over 5-yr UST
160bps
3
Treasury on March 30
th |
 4
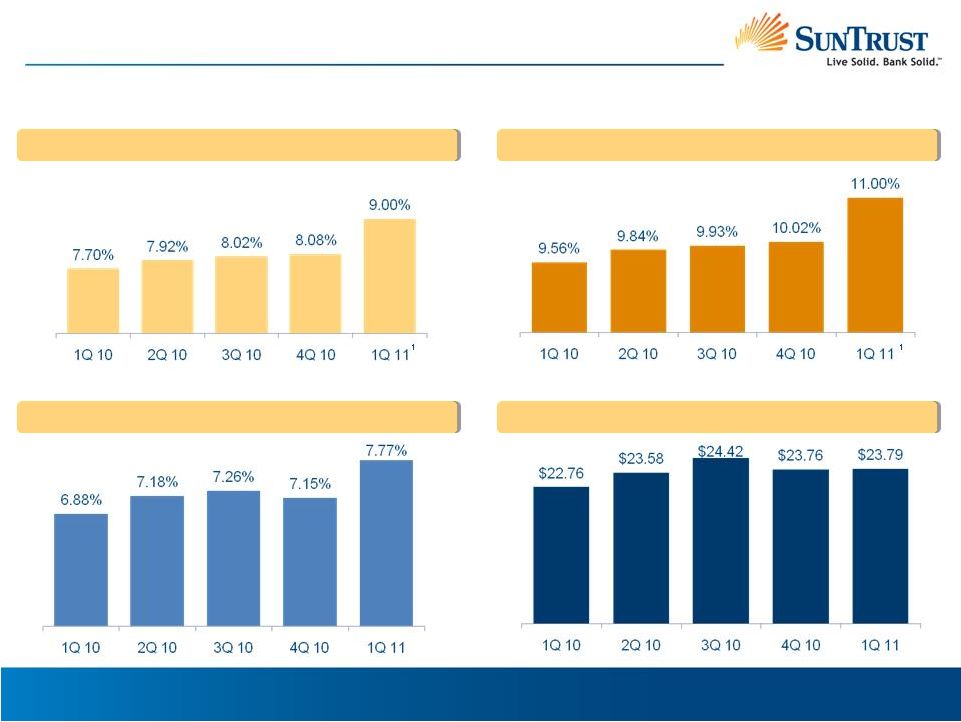
Tier 1 Common Ratio
Tier 1 Capital Ratio (Excluding TARP)
2
Tangible Common Equity Ratio
3
Tangible Book Value Per Share
3
1.
Estimated
2.
The Tier 1 Capital Ratio including TARP was 13.13% in 1Q 10, 13.51% in 2Q 10,
13.58% in 3Q 10, and 13.67% in 4Q 10 3.
Please refer to the Appendix for a reconcilement to the most directly comparable
GAAP financial measure Capital Position
Capital Ratios Further Strengthened and Significantly Exceed Current and Proposed
Regulatory Standards
1
1
I. TARP SHARES REDEMPTION |
 5
1Q 11 Summary
•
Reported earnings per share of $0.08
•
Excluding
the
impact
of
TARP
redemption,
EPS
was
$0.22
2
,
which
was
stable
compared
to the prior quarter and up substantially from the prior year
•
$4.85
billion
of
TARP
preferred
shares
repurchased
from
the
U.S.
Treasury
•
Patient and deliberate strategy proved beneficial to shareholders
•
9.0%
1Q
11
Tier
1
common
ratio
1
•
Growth in lower cost deposits and favorable deposit mix shift continued
•
Average loan balances increased modestly, with continued run-off in
higher-risk categories
•
Net Interest Margin expanded 9 basis points, up for the eighth consecutive
quarter •
Fee income declined sequentially due to market-sensitive factors, but
increased meaningfully from the prior year
•
Expenses declined 5% sequentially
Profitability
TARP
Redemption
Balance
Sheet
Revenue
Expense
1.
Estimated
2.
The TARP redemption charge was ($74) million, or approximately ($0.14) per
share. This non-cash charge to net income available to common shareholders reflects the
unamortized discount on the TARP preferred shares
•
Improvements in credit quality continued. Nonperforming loans/assets, early
stage delinquencies, net charge-offs, and the provision for loan losses
all declined Credit
II.
FINANCIAL
PERFORMANCE |
 6
($ in millions, except per share data)
Income Statement Highlights
II.
FINANCIAL
PERFORMANCE
Net Interest Income (FTE)
Provision for Credit Losses
Noninterest Income
Total Revenue (FTE)
Noninterest Expense
Net Income/(Loss)
Preferred Dividends
Net Income/(Loss) to Common
Shareholders
Net Income/(Loss) per Share
Net Income/(Loss) per Share excl.
TARP Redemption
1
$1,277
447
883
2,160
1,465
180
142
38
$0.08
$0.22
$1,202
862
698
1,900
1,361
(161)
68
(229)
($0.46)
($0.46)
$1,294
512
1,032
2,326
1,548
185
69
114
$0.23
$0.23
1Q 10
4Q 10
1Q 11
Financial Highlights
Key Points
Significant 1Q 11 Items
•($74) million after-tax charge from TARP
redemption –
($0.14) EPS impact
•$64 million securities gains in both 1Q 11
and 4Q 10 –
$0.08 EPS impact
Prior Quarter Variance
•Stable EPS (excluding TARP redemption):
Lower provision from continued credit
quality improvement
Decline in fee income from market-
sensitive / cyclical items
Reduced expenses, despite seasonal
increase in employee benefits costs
Prior Year Variance
•Significant EPS improvement driven by:
Net interest income growth, primarily
from improved deposit mix and pricing
Improved credit quality / lower provision
Higher fee income in core consumer and
commercial categories
EPS of $0.22 Excluding TARP Redemption Impact
1
1.
Reported EPS was $0.08. The TARP redemption charge of ($74) million, or
approximately ($0.14) per share, is reflected in the Preferred Dividends line item and is a non-cash
charge
related
to
the
unamortized
discount
on
the
TARP
preferred
shares |
 II.
FINANCIAL
PERFORMANCE
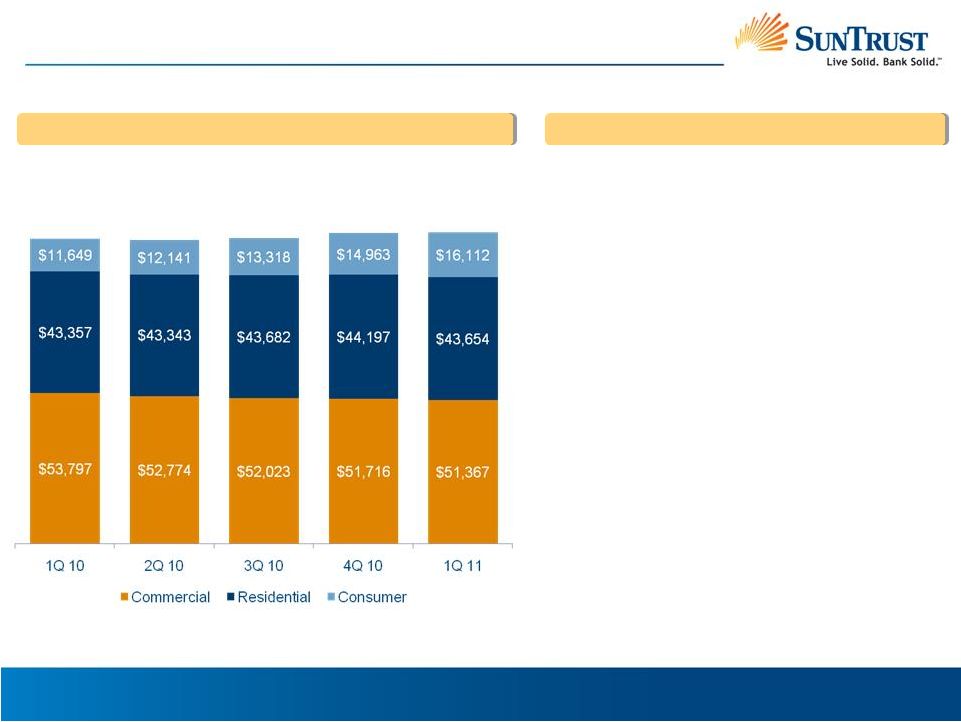
Loans
Average Performing Loans¹
Key Points
Prior Quarter Variance
•~$400 million performing loan balance growth, as
growth in Consumer more than offset declines in
Residential and Commercial
•Consumer segment growth driven by full quarter
impact of December 2010 auto loan purchase, as well
as growth in Guaranteed Student Loans
•In the Commercial segment, C&I increased while
Construction and CRE declined
•Residential segment declined due to continued run-
off in higher-risk segments
Prior Year Variance
•$2.1 billion, or 2% growth, in performing loans
•Consumer segment up ~$4.5 billion, driven by
Indirect and Guaranteed Student Loans
•Commercial segment down ~$2.4 billion, due to
Construction and CRE
•Residential segment flat as growth in Government
Guaranteed Mortgages offset declines in higher-risk
portions of the Residential Mortgage and Home
Equity categories
($ in millions)
Modest Average Balance Growth from 4Q 10
$110,702
$111,133
1.
2010 quarterly averages for the Commercial, Residential, and Consumer segments are
calculated using month end balances and, therefore, do not sum to the total performing loan
balances, which are calculated using daily average balances
$108,987
$108,033
$108,816
7 |
 8
II.
FINANCIAL
PERFORMANCE
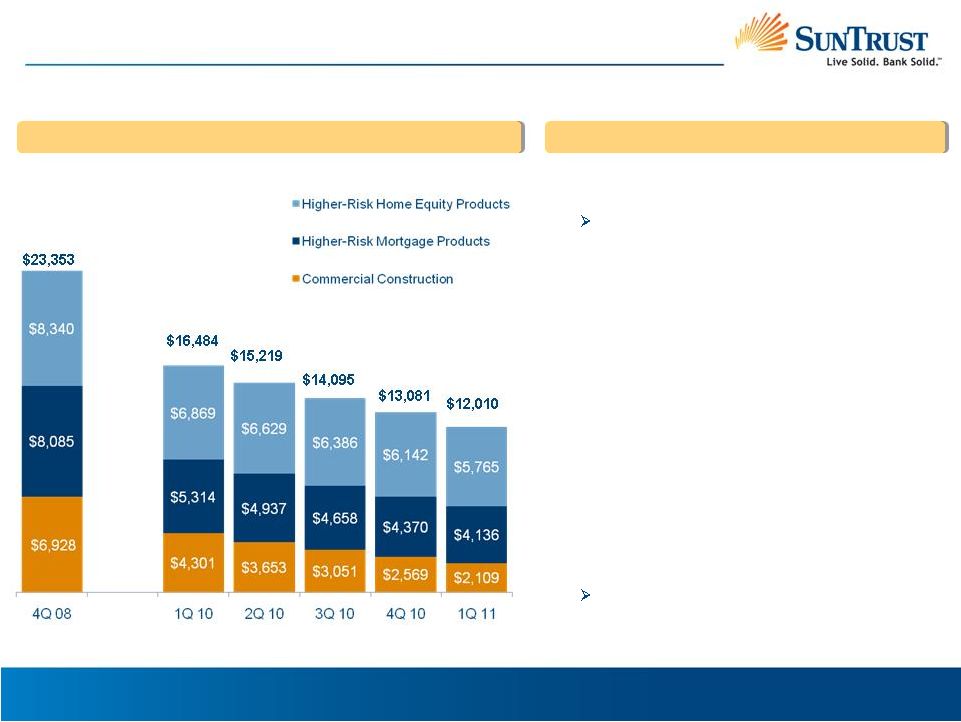
Higher-risk
Loans
1
Higher-risk Loans (period-end)
Key Points
•
Higher-risk categories down over $11 billion, or
almost 50%, since 4Q 08
These declining portfolios represent only 10%
of total loans
•
Over this same time, government-guaranteed loans
are up over $6 billion to $9.0 billion
Prior Quarter Variance
•
$1.1 billion, or 8%, decline in higher-risk loans
•
Declines occurred in each of the major categories,
as well as the sub-categories (listed in footnote)
•
Largest dollar declines occurred in Commercial
Construction ($460 million, or 18%) and High LTV
Home Equity ($233 million)
Prior Year Variance
•
$4.5 billion, or 27%, decline in higher-risk loans
•
Commercial Construction down $2.2 billion, or 51%
•
Higher-risk Mortgages down $1.2 billion, or 22%
Residential Construction down over $0.5 billion
•
Higher-risk Home Equity down $1.1 billion, or 16%,
primarily from High LTV Lines and HE Loans
($ in millions)
Continued Declines in Higher-risk Categories
1.
Higher-risk
Mortgage
products
include
Prime
2nds,
Residential
Construction,
and
Alt-A.
Higher-risk
Home
Equity
includes
High
LTV
lines
(includes
Florida
lines
>
80%
LTV
and
other
lines > 90% LTV), Brokered Home Equity, and Home Equity Loans. Data
includes performing and nonperforming loans |
 9
II.
FINANCIAL
PERFORMANCE
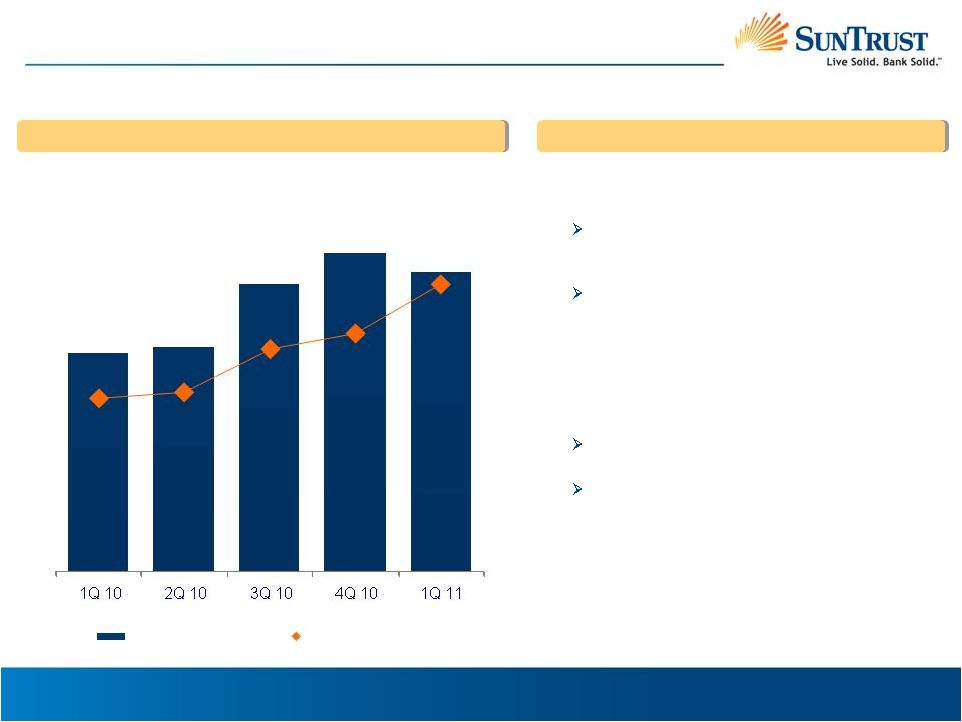
Deposits
Average Client Deposits
Key Points
($ in millions)
Favorable Deposit Growth and Mix Shift Trends Continued
$119,688
$116,460
$117,233
$115,084
$120,710
Prior Quarter Variance
•Client Deposits grew $1.0 billion, or 1%, to a
record level of $120.7 billion
•Continued favorable shift in deposit mix
DDA, NOW, MMA, and Savings up a combined
$2.2 billion, or 2%
Prior Year Variance
•Client Deposits grew $5.6 billion, or 5%
•Growth entirely in lower-cost accounts, including:
DDA up $3.8 billion, or 15%
MMA up $6.4 billion, or 18%
•Higher-cost Time Deposits declined $4.7 billion, or
19% |
 II.
FINANCIAL
PERFORMANCE
Net Interest Income
Net Interest Income, FTE
Key Points
($ in millions)
Net Interest Margin
Net Interest Income
Net Interest Margin Expanded for Eighth Straight Quarter
Prior Quarter Variance
•Net Interest Margin expanded 9 bps
Interest earning assets up 5 bps, as loan and
securities yields expanded 2 bps and 6 bps,
respectively
Deposit mix shift and lower rates paid contributed
to 4 bps decline in interest-bearing liabilities
•Net Interest Income down modestly due to day count
Prior Year Variance
•Net Interest Income up $75 million, or 6%, driven by a
21 bps expansion in the Net Interest Margin
Deposit mix shift and rates paid drove a 31 bps
decline in interest-bearing liabilities
Interest earning asset yields declined a modest 6
bps, as efforts to drive improved loan pricing and
the Commercial loan swap position helped
mitigate the impacts of the continued low rate
environment
2Q 11 Expectation
•Expect Net Interest Margin to be relatively stable to
1Q 11
$1,202
$1,277
$1,294
$1,266
$1,208
3.32%
3.33%
3.41%
3.44%
3.53%
1,000
1Q 10
2Q 10
3Q 10
4Q 10
1Q 11
3.0%
3.2%
3.4%
3.6%
10 |
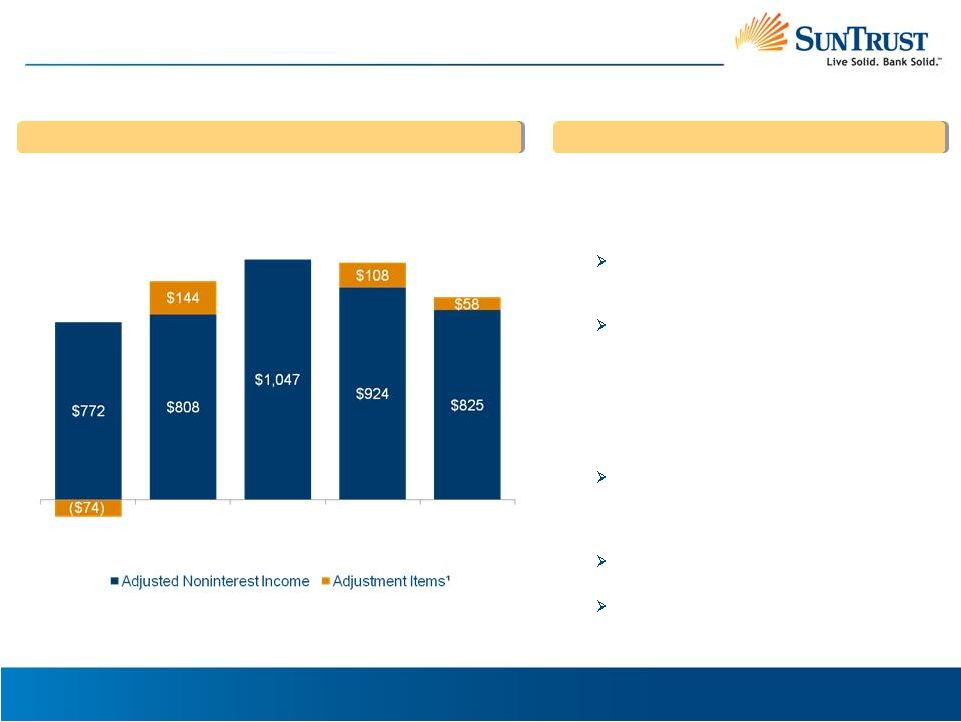 II.
FINANCIAL
PERFORMANCE
Noninterest Income
Noninterest Income
($ in millions)
$883
$1,047
$1,032
Key Points
Sequential Quarter Declined, as Expected, Due to Market-Sensitive Revenue
1.
Please refer to the appendix for adjustment detail
Prior Quarter Variance
•Adjusted Noninterest Income declined $99 million,
or 11%, due primarily to:
Mortgage Production –
higher interest rate
environment resulted in reduced refinance
activity
Investment
Banking
–
1Q
declined
from
a
record 4Q
Prior Year Variance
•Adjusted Noninterest Income increased $53
million, or 7%
Trust Income, Retail Investment Services,
Investment Banking, and Card Fees each
increased by over $10 million and grew by
double digit percentages
Mortgage Production increased due to lower
repurchase reserve costs
Service Charges on Deposits declined due to
the impact of Reg E
$952
$698
1Q 10
2Q 10 3Q 10 4Q 10
1Q11
11 |
 12
Repurchase demand increased in 1Q 2011 driven
by an increase in demands from 2007 vintage
Summary Statistics
Losses have stabilized but reserve is marginally up
due to an increase in new demands
II. FINANCIAL PERFORMANCE
Mortgage Repurchase Trends
($ in millions)
1Q 10
2Q 10
3Q 10
4Q 10
1Q 11
Period-end
Balance
$287
$317
$320
$293
$363
% Non-Agency
(approx.)
10%
5%
7%
10%
10%
($ in millions)
1Q 10
2Q 10
3Q 10
4Q 10
1Q 11
2005 & Prior
$18
$21
$26
$20
$24
2006
65
85
71
69
78
2007
168
204
134
108
157
2008
25
30
27
25
44
2009
8
8
4
7
2
2010
0
0
1
4
7
Total
$285
$349
$263
$233
$313
% Non-Agency
(approx.)
4%
3%
6%
7%
9%
Metric
(2005
–
2011
vintages)
Amount ($B)
Sold UPB
$ 209
Remaining UPB
106
Cumulative Repurchase Requests
3.7
Requests Resolved
3.3
Losses Recognized to Date
0.8
1Q 2011 Reserve
0.3
Income Statement Impact to Date
1.1
Memo: Non-Agency UPB
16
1.
Includes estimates
2.
Amount is an estimate and is included in the $106 billion of remaining UPB
($ in millions)
1Q 10
2Q 10
3Q 10
4Q 10
1Q 11
Pending demands increased in 1Q 2011
Beginning Balance
$200
$210
$256
$270
$265
Additions
128
148
95
85
80
Charge-Offs
(118)
(102)
(81)
(90)
(75)
Ending Balance
$210
$256
$270
$265
$270
1
2 |
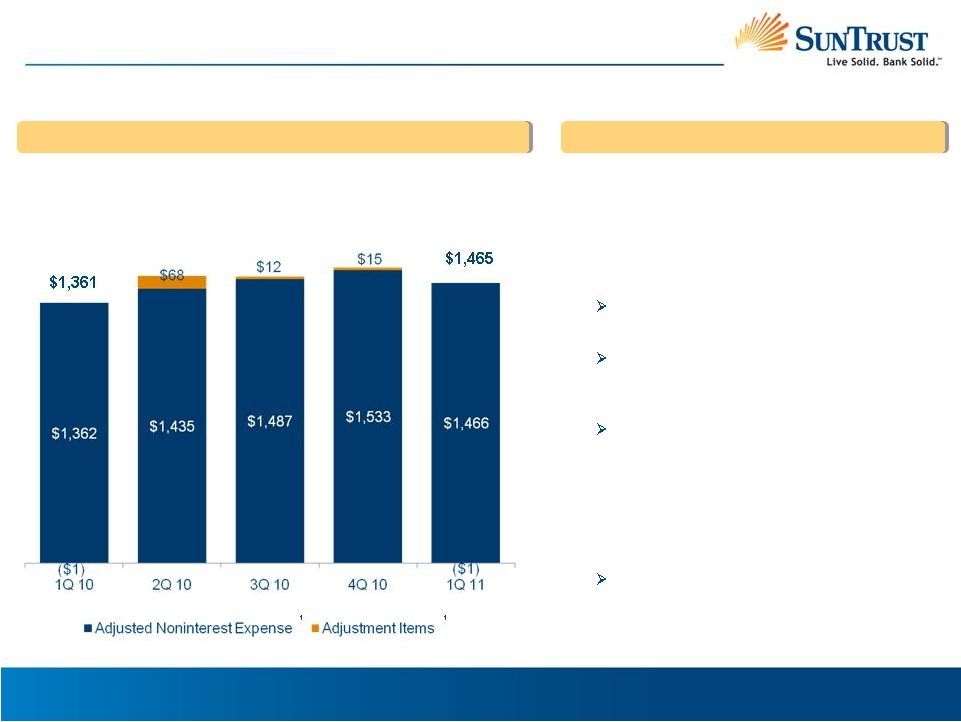 Noninterest Expense
($ in millions)
Key Points
II. FINANCIAL PERFORMANCE
$1,548
$1,499
$1,503
Decline from 4Q, Despite Seasonally Higher Benefits Expenses
1.
Please refer to the appendix for adjustment detail
Prior Quarter Variance
•$83 million, or 5%, decline in reported Noninterest
Expense
•$67 million, or 4%, decline in Adjusted Noninterest
Expense
Other Expenses down due primarily to lower
credit-related expenses
Marketing & Customer Development and
Outside Processing declined $18 million and
$16 million, respectively
Employee Compensation increased due to
seasonally higher benefits costs, which more
than offset declines in other staff expenses
Prior Year Variance
•Total Noninterest Expenses increased by $104
million
Employee Compensation is largest driver, up
$62 million, due to improved revenue
generation and staff additions
¹
¹
13 |
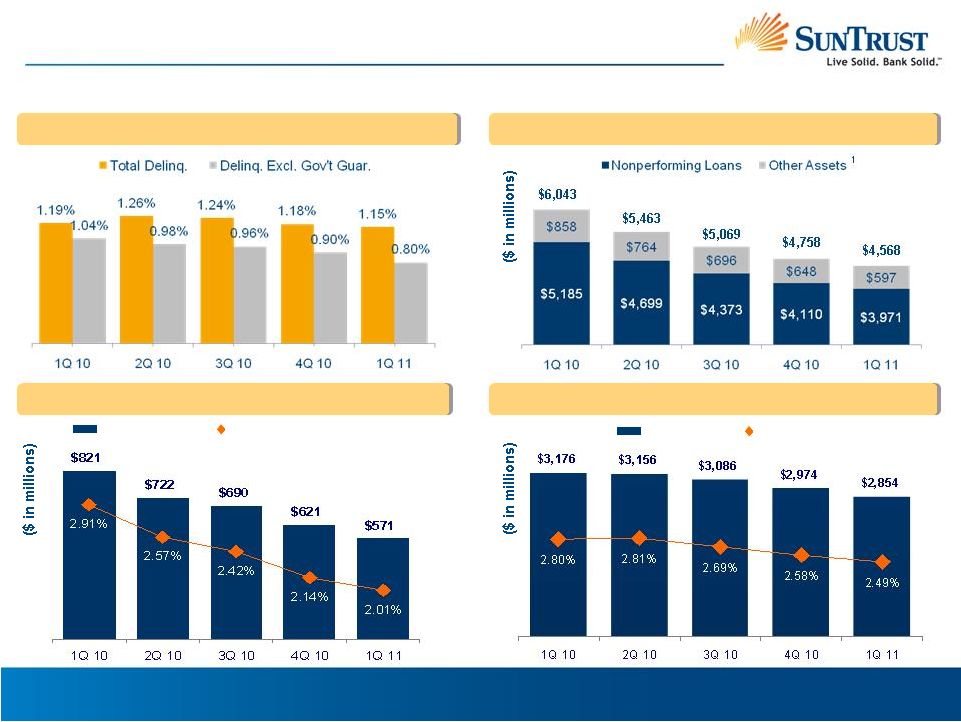 Credit
Quality Improvement III. RISK REVIEW
30 -
89 Day Delinquencies
Net Charge-offs
Allowance for Loan and Lease Losses
ALLL Ratio
ALLL ($)
Continued Improvement in All Key Metrics
1.
Includes
$160
million
in
mortgage
loans
transferred
to
HFS
in
1Q
10
and
$47
million
in
mortgage
loans
transferred
to
HFS
in
1Q 11
NCOs to Avg. Loans (annualized)
Net Charge-offs
Nonperforming Assets
14 |
 15
Loan Portfolio
Key Points
Net Charge-offs
$722
$690
$571
$621
$821
Nonperforming Loans
$3,971
$5,185
$4,699
$4,373
$4,110
Prior Quarter Variance
•NPLs
declined $139 million, or 3%
Residential down $112 million, including $57
million
from
the
transfer
to
HFS
1
•Net charge-offs declined $50 million, or 8%
Commercial down $47 million due to declines
in C&I and CRE
Residential and Consumer stable
Residential 1Q 11 NCO includes a $10 million
write-down on NPL transfer to HFS
Prior Year Variance
•NPLs
declined $1.2 billion, or 23%, driven by C&I,
Residential mortgages, and Construction
•NCOs decreased in all segments by a total of
$250 million, or 30%, with the largest declines in
the Residential Nonguaranteed portfolio
2Q 11 Expectation
•Expect NPLs
to decline and NCOs to be relatively
stable from 1Q 11 levels
Seventh Consecutive Quarter of NPL Declines
1.
$57
million
reflects
the
carrying
value
prior
to
the
transfer
to
HFS
III. RISK REVIEW |
 16
Selected Accomplishments
IV. BUSINESS HIGHLIGHTS
Excellent Client Service is Being Recognized by Our Industry
•
Received 18 Greenwich Excellence Awards for Distinguished Performance in Serving
the Financial Needs of Business Clients in Small and Middle Market Business
Banking One of the top two award recipients nationally
Ranked highest in customer satisfaction in Small Business Banking
•
Ranked
#1
bank
for
customer
experience
2
Client Service Improvements are Translating into Client Loyalty
•
Client satisfaction
is
at
an
all-time
high
as
measured
in
our
Service
Excellence
Program
3
•
Achieved #1 industry ranking for client loyalty in Commercial and Private Wealth
Management against
key
competitors
4
•
Net new
consumer
checking
accounts
up
30%
from
1Q
2010
driven
by
a
9%
decline
in
closed
accounts, as attrition continues to improve
Focus on Customer-Centric Strategies is Yielding Results
•
Client Deposits reached a record level in 1Q 11
•
Third highest quarter of net income and revenue results for CIB—revenue up
50% from prior year •
Wealth and Investment Management net income up 34% from the prior year; fee income
up 16% Teammate Engagement is Improving Markedly
•
Completed second annual employee engagement survey—90% participation:
Realized positive
improvements
in
every
surveyed
area
1
Working as One Team to Deliver the Organization to Our Clients
•
Improved cross-sell penetration across many of our lines of business
1.
Based upon internal surveys conducted by Gallup
2.
By Forrester Research
3.
Proprietary research conducted by Gallup on behalf of SunTrust
4.
Based upon Gallup Survey results within the SunTrust footprint
Client First
One Team
Profitable
Growth |
 1Q 11
Summary •
Reported earnings per share of $0.08
•
Excluding
the
impact
of
TARP
redemption,
EPS
was
$0.22
2
,
which
was
stable
compare
d to the prior quarter and up substantially from the prior year
•
$4.85
billion
of
TARP
preferred
shares
repurchased
from
the
U.S.
Treasury
•
Patient and deliberate strategy proved beneficial to shareholders
•
9.0%
1Q
11
Tier
1
common
ratio
1
•
Growth in lower cost deposits and favorable deposit mix shift continued
•
Average loan balances increased modestly, with continued run-off in
higher-risk categories
•
Net Interest Margin expanded 9 basis points, up for the eighth consecutive
quarter •
Fee income declined sequentially due to market-sensitive factors, but
increased meaningfully from the prior year
•
Expenses declined 5% sequentially
Profitability
TARP
Redemption
Balance
Sheet
Revenue
Expense
1.
Estimated
2.
The TARP redemption charge was ($74) million, or approximately ($0.14) per
share. This non-cash charge to net income available to common shareholders reflects the
unamortized discount on the TARP preferred shares
•
Improvements in credit quality continued. Nonperforming loans/assets, early
stage delinquencies, net charge-offs, and the provision for loan losses
all declined Credit
IV. BUSINESS HIGHLIGHTS
17 |
 18
Appendix |
 19
$0.2
3.8
18.0
0.6
0.3
0.2
0.7
2.8
$26.6
U.S. Treasury
U.S. Agency
MBS –
Agency
U.S. States and Subdivisions
MBS –
Private
Corporate & Other
Asset –
Backed Securities
Other Equity
Total AFS
4Q
2010 1Q 2011 $ Change
Securities
Available for Sale
($ in billions, period-end balances)
Securities Portfolio
V. APPENDIX
$5.5
1.9
14.4
0.6
0.3
0.5
0.8
2.9
$26.9
$(5.3)
1.9
3.6
-
-
(0.3)
(0.1)
(0.1)
$(0.3)
Stable Portfolio; $64 million in 1Q Gains Recognized in Repositioning
Note: Columns may not foot due to rounding |
 20
V. APPENDIX
30 –
89 Day Delinquencies by Loan Class –
Excl. Govt.
Guaranteed Loans
Memo:
($ in millions)
1Q 10
2Q 10
3Q 10
4Q 10
1Q 11
1Q 11 Loan
Balance
30-89 Day Delinquencies
Commercial Loans
Commercial & industrial
0.36
%
0.31
%
0.28
%
0.25
%
0.22
%
$ 45,080
Commercial real estate
0.77
1.05
0.88
0.43
0.33
6,043
Commercial construction
1.16
1.18
0.67
0.42
0.47
2,109
Total commercial loans
0.47
0.46
0.38
0.28
0.24
53,232
Residential Loans
Residential mortgages -
guaranteed
-
-
-
-
-
4,516
Residential mortgages -
nonguaranteed
1.91
1.83
1.88
1.90
1.63
23,443
Home equity products
1.46
1.44
1.52
1.40
1.46
16,382
Residential construction
3.27
2.82
2.61
3.28
2.94
1,208
Total residential loans
1
1.79
1.71
1.76
1.74
1.60
45,549
Consumer Loans
Guaranteed student loans
-
-
-
-
-
4,477
Other direct
1.03
0.63
1.87
0.92
1.12
1,786
Indirect
0.88
0.82
0.79
0.78
0.68
9,469
Credit cards
2.97
2.58
2.76
2.40
2.04
419
Total consumer loans
2
1.03
0.88
1.05
0.86
0.79
16,151
Total SunTrust -
excluding government guaranteed
delinquencies
1.04
%
0.98
%
0.96
%
0.90
%
0.80
%
$ 114,932
Total SunTrust -
including government guaranteed
delinquencies
3
1.19
%
1.26
%
1.24
%
1.18
%
1.15
%
1.
Excludes delinquencies on all federally guaranteed mortgages
2.
Excludes delinquencies for federally guaranteed student loans
3.
Excludes
mortgage
loans
guaranteed
by
GNMA
that
SunTrust
has
the
option,
but
not
the
obligation,
to
repurchase |
 21
V. APPENDIX
Nonperforming Loans by Loan Class
Memo:
($ in millions)
1Q 10
2Q 10
3Q 10
4Q 10
1Q 11
1Q 11 Loan
Balance
Nonperforming Loans
Commercial Loans
Commercial & industrial
$669
$644
$601
$584
$585
$45,080
Commercial real estate
252
321
346
342
435
6,043
Commercial construction
1,380
1,226
1,111
961
843
2,109
Total commercial loans
2,301
2,191
2,058
1,887
1,863
53,232
Residential Loans
Residential mortgages -
guaranteed
-
-
-
-
-
4,516
Residential mortgages -
nonguaranteed
2,008
1,749
1,591
1,543
1,458
23,443
Home equity products
369
360
357
355
343
16,382
Residential construction
476
364
325
290
275
1,208
Total residential loans
2,853
2,473
2,273
2,188
2,076
45,549
Consumer Loans
Guaranteed student loans
-
-
-
-
-
4,477
Other direct
7
14
14
10
11
1,786
Indirect
24
21
28
25
21
9,469
Credit cards
-
-
-
-
-
419
Total consumer loans
31
35
42
35
32
16,151
Total
$5,185
$4,699
$4,373
$4,110
$3,971
$114,932 |
 22
V. APPENDIX
Net Charge-offs by Loan Class
Memo:
($ in millions)
1Q 10
2Q 10
3Q 10
4Q 10
1Q 11
1Q 11 Loan
Balance
Net Charge-offs to Avg. Loans annualized
1
Commercial Loans
Commercial & industrial
0.92
%
0.92
%
0.74
%
0.94
%
0.44
%
$45,080
Commercial real estate
0.57
0.97
2.33
1.79
1.42
6,043
Commercial construction
4.97
10.38
13.06
9.62
14.76
2,109
Total commercial loans
1.22
1.61
1.70
1.50
1.19
53,232
Residential Loans
Residential
mortgages
-
guaranteed
-
-
-
-
-
4,516
Residential
mortgages
-
nonguaranteed
5.40
3.37
3.30
3.09
3.19
23,443
Home equity products
4.56
4.04
3.69
3.71
3.96
16,382
Residential construction
14.56
20.44
18.09
11.61
10.46
1,208
Total residential loans
5.26
4.06
3.68
3.28
3.37
45,549
Consumer Loans
Guaranteed student loans
-
-
-
-
-
4,477
Other direct
2.78
3.02
1.74
2.20
2.53
1,786
Indirect
1.00
0.57
0.55
0.65
0.56
9,469
Credit cards
16.37
11.59
10.34
9.52
8.68
419
Total consumer loans
1.69
%
1.19
%
0.91
%
0.93
%
0.89
%
$16,151
Total
2.91
%
2.57
%
2.42
%
2.14
%
2.01
%
$114,932
1.
2010 net charge-off ratios calculated using average of month-end loan
balances |
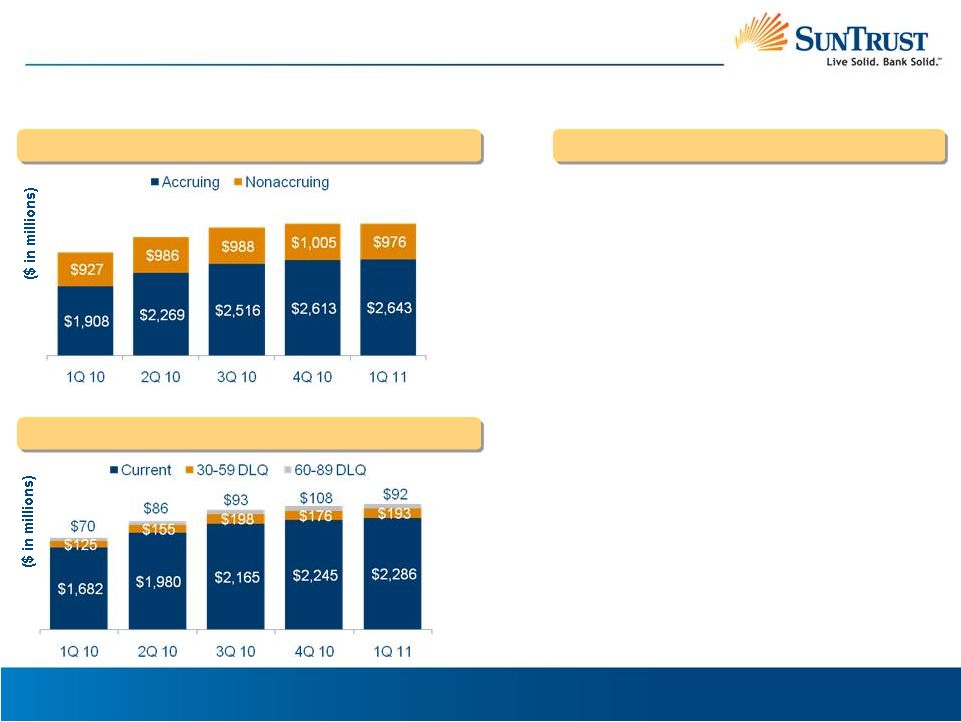 TDR
Composition Mortgage and Consumer Loans are 95% of Accruing TDRs; 87% are
Current on Principal and Interest Payments
TDR Trend
Early Stage Accruing TDR Delinquencies
Key Points
Prior Quarter Variance
•Total TDRs
were stable at $3.6 billion
•Accruing and current balances increased modestly
•Early stage delinquencies remained stable
Prior Year Variance
•Total TDRs
increased by $784 million due to
increased modifications, primarily in Residential
loans
•The percentage of TDRs
that are accruing
increased to 73% in 1Q 11 from 67% in 1Q 10
$2,835
$3,255
$3,504
$3,618
$3,619
V. APPENDIX
23 |
 24
Noninterest Income Reconciliation
V. APPENDIX
($ in millions)
1Q 10
2Q 10
3Q 10
4Q 10
1Q 11
Total Noninterest Income
$698
$952
$1,047
$1,032
$883
Adjustment Items:
Securities Gains/(Losses)
1
57
69
64
64
Fair Market Value Adjustments (Trading Income)
(23)
1
17
30
14
STI Debt Valuation (Trading Income)
(20)
63
(22)
16
(20)
SunTrust Index-linked CDs (SILC) (Trading
Income)
(31)
23
(59)
5
(11)
Auction Rate Securities (Trading Income)
7
(2)
1
(11)
16
Fair Value Adjustments (Mortgage Production)
(8)
2
(6)
(9)
(5)
Stable River Gain (Other Income)
-
-
-
13
-
Total Adjustments
(74)
144
0
108
58
Adjusted Noninterest Income
$772
$808
$1,047
$924
$825 |
 25
Noninterest Expense Reconciliation
V. APPENDIX
($ in millions)
1Q 10
2Q 10
3Q 10
4Q 10
1Q 11
Total Noninterest Expense
$1,361
$1,503
$1,499
$1,548
$1,465
Adjustment Items:
AHG Writedown (Other Exp.)
-
5
-
11
-
(Gain)/Loss on Debt Extinguishment
(9)
63
12
4
(1)
Visa Contract Termination Fee (Other Exp.)
8
-
-
-
-
Total Adjustments
(1)
68
12
15
(1)
Adjusted Noninterest Expense
$1,362
$1,435
$1,487
$1,533
$1,466 |
 26
Additional Noninterest Expense Disclosures
V. APPENDIX
Totals may not foot due to rounding
($ in millions)
1Q 10
2Q 10
3Q 10
4Q 10
1Q 11
Operating Losses
$14
$16
$27
$26
$27
Mortgage Reinsurance (Other Exp.)
9
9
7
2
7
Credit & Collections (Other Exp.)
74
66
69
71
51
Other Real Estate (Other Exp.)
46
86
77
90
69
Total Credit-related Expenses
$143
$177
$181
$189
$155 |
 27
Reconciliation of Non GAAP Measures
V. APPENDIX
($ in millions, except per share data)
Three Months Ended
March 31
June 30
September 30
December 31
March 31
2010
2010
2010
2010
2011
Total shareholders'
equity
$22,620
$23,024
$23,438
$23,130
$19,223
Goodwill, net of deferred
taxes
(6,202)
(6,197)
(6,192)
(6,189)
(6,185)
Other intangible assets including MSRs, net of deferred taxes
(1,761)
(1,409)
(1,174)
(1,545)
(1,635)
MSRs
1,641
1,298
1,072
1,439
1,538
Tangible
equity
16,298
16,716
17,144
16,835
12,941
Preferred stock
(4,923)
(4,929)
(4,936)
(4,942)
(172)
Tangible common equity
$11,375
$11,787
$12,208
$11,893
$12,769
Total
assets
$171,796
$170,668
$174,703
$172,874
$170,794
Goodwill
(6,323)
(6,323)
(6,323)
(6,323)
(6,324)
Other intangible assets including
MSRs
(1,800)
(1,443)
(1,204)
(1,571)
(1,659)
MSRs
1,641
1,298
1,072
1,439
1,538
Tangible
assets
$165,314
$164,200
$168,248
$166,419
$164,349
Tangible equity to tangible assets
9.86
%
10.18
%
10.19
%
10.12
%
7.87
%
Tangible common equity to tangible assets
6.88
%
7.18
%
7.26
%
7.15
%
7.77
%
Tangible book value per common share
$22.76
$23.58
$24.42
$23.76
$23.79 |