Attached files
Exhibit 99.2
Grant Park Fund
Class A, B, Legacy 2, Global 2 and Global 3 Units
Monthly Performance Report • March 2011
2 Grant Park Fund Performance Report • March 2011
Market Commentary: March 2011
| 2000 | 2001 | 2002 | 2003 | 2004 | 2005 | |||||||||||||||||||||||||||||||||||||||||||||||
| A Units (Closed to New Investment) |
|
11.0 | % | 7.0 | % | 15.3 | % | 20.0 | % | -7.6 | % | -3.4 | % | |||||||||||||||||||||||||||||||||||||||
| Jan | Feb | Mar | Apr | May | Jun | Jul | Aug | Sep | Oct | Nov | Dec | YTD | ||||||||||||||||||||||||||||||||||||||||
| 2006 |
3.5 | % | -3.3 | % | 4.1 | % | 9.5 | % | -0.8 | % | -2.9 | % | -3.7 | % | 2.2 | % | -1.1 | % | -0.6 | % | 3.6 | % | -0.9 | % | 9.1 | % | ||||||||||||||||||||||||||
| 2007 |
1.3 | % | -4.2 | % | -4.6 | % | 5.2 | % | 4.6 | % | 4.2 | % | -3.7 | % | -3.7 | % | 8.8 | % | 5.2 | % | -0.7 | % | 0.6 | % | 12.6 | % | ||||||||||||||||||||||||||
| 2008 |
2.5 | % | 9.7 | % | -0.6 | % | -0.1 | % | 2.1 | % | 3.1 | % | -5.1 | % | -2.4 | % | 1.3 | % | 4.8 | % | 2.8 | % | 1.1 | % | 19.9 | % | ||||||||||||||||||||||||||
| 2009 |
-0.9 | % | -0.8 | % | -3.3 | % | -1.7 | % | 1.6 | % | -3.4 | % | -1.3 | % | 1.1 | % | 1.2 | % | -2.6 | % | 4.2 | % | -3.6 | % | -9.2 | % | ||||||||||||||||||||||||||
| 2010 |
-8.0 | % | 0.6 | % | 4.1 | % | 1.8 | % | -3.8 | % | -0.2 | % | -1.7 | % | 2.8 | % | 3.2 | % | 4.3 | % | -2.6 | % | 4.6 | % | 4.5 | % | ||||||||||||||||||||||||||
| 2011 |
-0.5 | % | 2.3 | % | -2.5 | % | -0.8 | % | ||||||||||||||||||||||||||||||||||||||||||||
| 2003 | 2004 | 2005 | ||||||||||||||||||||||||||||||||||||||||||||||||||
| B Units (Closed to New Investment) |
|
7.7 | % | -8.4 | % | -4.3 | % | |||||||||||||||||||||||||||||||||||||||||||||
| Jan | Feb | Mar | Apr | May | Jun | Jul | Aug | Sep | Oct | Nov | Dec | YTD | ||||||||||||||||||||||||||||||||||||||||
| 2006 |
3.4 | % | -3.4 | % | 4.0 | % | 9.4 | % | -0.9 | % | -2.9 | % | -3.7 | % | 2.1 | % | -1.2 | % | -0.7 | % | 3.5 | % | -0.9 | % | 8.3 | % | ||||||||||||||||||||||||||
| 2007 |
1.2 | % | -4.3 | % | -4.6 | % | 5.2 | % | 4.5 | % | 4.1 | % | -3.8 | % | -3.8 | % | 8.7 | % | 5.2 | % | -0.7 | % | 0.6 | % | 11.8 | % | ||||||||||||||||||||||||||
| 2008 |
2.4 | % | 9.6 | % | -0.7 | % | -0.2 | % | 2.0 | % | 3.0 | % | -5.1 | % | -2.5 | % | 1.2 | % | 4.7 | % | 2.7 | % | 1.0 | % | 18.9 | % | ||||||||||||||||||||||||||
| 2009 |
-1.0 | % | -0.9 | % | -3.3 | % | -1.8 | % | 1.6 | % | -3.5 | % | -1.3 | % | 1.1 | % | 1.1 | % | -2.6 | % | 4.2 | % | -3.6 | % | -9.9 | % | ||||||||||||||||||||||||||
| 2010 |
-8.0 | % | 0.6 | % | 4.0 | % | 1.7 | % | -3.9 | % | -0.3 | % | -1.7 | % | 2.7 | % | 3.2 | % | 4.3 | % | -2.6 | % | 4.5 | % | 3.8 | % | ||||||||||||||||||||||||||
| 2011 |
-0.6 | % | 2.2 | % | -2.5 | % | -1.0 | % | ||||||||||||||||||||||||||||||||||||||||||||
| Legacy 2 Units |
||||||||||||||||||||||||||||||||||||||||||||||||||||
| Jan | Feb | Mar | Apr | May | Jun | Jul | Aug | Sep | Oct | Nov | Dec | YTD | ||||||||||||||||||||||||||||||||||||||||
| 2009 |
-1.6 | % | 1.6 | % | -3.1 | % | -1.1 | % | 1.3 | % | 1.2 | % | -2.4 | % | 4.0 | % | -3.2 | % | -3.6 | % | ||||||||||||||||||||||||||||||||
| 2010 |
-7.8 | % | 0.8 | % | 4.1 | % | 1.7 | % | -3.5 | % | -0.1 | % | -1.5 | % | 2.8 | % | 3.2 | % | 4.3 | % | -2.3 | % | 4.6 | % | 5.7 | % | ||||||||||||||||||||||||||
| 2010 |
-0.4 | % | 2.3 | % | -2.2 | % | -0.3 | % | ||||||||||||||||||||||||||||||||||||||||||||
| Global 2 Units |
||||||||||||||||||||||||||||||||||||||||||||||||||||
| Jan | Feb | Mar | Apr | May | Jun | Jul | Aug | Sep | Oct | Nov | Dec | YTD | ||||||||||||||||||||||||||||||||||||||||
| 2009 |
-0.3 | % | 2.0 | % | -3.2 | % | -1.3 | % | 1.1 | % | 1.1 | % | -3.2 | % | 3.6 | % | -4.2 | % | -4.6 | % | ||||||||||||||||||||||||||||||||
| 2010 |
-7.8 | % | 0.7 | % | 3.6 | % | 1.5 | % | -2.2 | % | 0.3 | % | -2.5 | % | 2.7 | % | 1.9 | % | 3.7 | % | -2.2 | % | 3.6 | % | 2.6 | % | ||||||||||||||||||||||||||
| 2011 |
-0.8 | % | 2.0 | % | -1.9 | % | -0.7 | % | ||||||||||||||||||||||||||||||||||||||||||||
| Global 3 Units |
||||||||||||||||||||||||||||||||||||||||||||||||||||
| Jan | Feb | Mar | Apr | May | Jun | Jul | Aug | Sep | Oct | Nov | Dec | YTD | ||||||||||||||||||||||||||||||||||||||||
| 2009 |
-0.4 | % | 1.8 | % | -3.5 | % | -1.4 | % | 0.9 | % | 1.0 | % | -3.4 | % | 3.5 | % | -4.4 | % | -6.0 | % | ||||||||||||||||||||||||||||||||
| 2010 |
-8.0 | % | 0.5 | % | 3.4 | % | 1.3 | % | -2.4 | % | 0.1 | % | -2.7 | % | 2.5 | % | 1.8 | % | 3.5 | % | -2.3 | % | 3.4 | % | 0.7 | % | ||||||||||||||||||||||||||
| 2011 |
-0.9 | % | 1.8 | % | -2.0 | % | -1.2 | % | ||||||||||||||||||||||||||||||||||||||||||||
ALL PERFORMANCE REPORTED IS NET OF FEES AND EXPENSES. PAST PERFORMANCE IS NOT INDICATIVE OF FUTURE RESULTS. FUTURES TRADING INVOLVES A HIGH DEGREE OF RISK AND IS NOT SUITABLE FOR ALL INVESTORS.
Grant Park Fund Performance Report • March 2011 3
Understand your Risks
| • | Performance can be volatile and you could lose all or substantially all of your investment in the Grant Park Fund. |
| • | No secondary market exists for Grant Park. Additionally, redemptions are prohibited for three months following subscription and may result in early redemption fees during the first year for some units. |
| • | Trading in the futures markets, from a macro perspective, results in a zero-sum economic outcome, in that every gain is offset by an equal and opposite loss. Grant Park therefore bears the risk that, on every trade, whether long or short, it will incur the loss. |
| • | Commodity futures trading may be illiquid. |
| • | An investment in Grant Park is speculative and leveraged; as a result of this leverage, the velocity of potential losses may accelerate and cause you to incur significant losses. |
| • | Grant Park pays substantial fees and expenses, including fees to its trading advisors, which must be offset by trading profits and interest income. |
| • | Grant Park invests in foreign securities, which are subject to special risks, such as currency fluctuations, different financial and regulatory standards, and political instability. |
| • | Grant Park’s use of multiple trading advisors may result in Grant Park taking offsetting trading positions, thereby incurring additional expenses with no net change in holdings. |
| • | You will have no right to participate in the management of Grant Park. |
| • | The structure and operation of Grant Park involves several conflicts of interest. |
| • | Your annual tax liability may exceed cash distributions to you. |
ALL PERFORMANCE REPORTED IS NET OF FEES AND EXPENSES. PAST PERFORMANCE IS NOT INDICATIVE OF FUTURE RESULTS. FUTURES TRADING INVOLVES A HIGH DEGREE OF RISK AND IS NOT SUITABLE FOR ALL INVESTORS.
4 Grant Park Fund Performance Report • March 2011
Grant Park Fund At-A-Glance
| Product |
Legacy Units |
Global Units |
A and B Units | |||||
| Class |
2 | 2 | 3 | Closed to New Investment | ||||
| Account Type |
Fee-based | Fee-based | Commission-based | |||||
| Minimum Investment |
$10,000 | $5,000 | $5,000 | |||||
| Retirement Account |
$1,000 | $1,000 | $1,000 | |||||
| Trading Strategy |
Traditional, systematic, medium- to long-term trend-trading philosophy employed by Grant Park for the past 20 years. | Traditional, systematic, medium- to long-term trend-trading philosophy combined with a systematic, pattern recognition model focused on shorter timeframes. | ||||||
| Breakeven Level |
5.57% | 4.98% | 7.18% | |||||
| Redemptions |
Monthly after 90 days | Monthly after 90 days | Monthly after 90 days | |||||
| Penalty |
No | No | 1.5% on a declining scale 0.5% per quarter | |||||
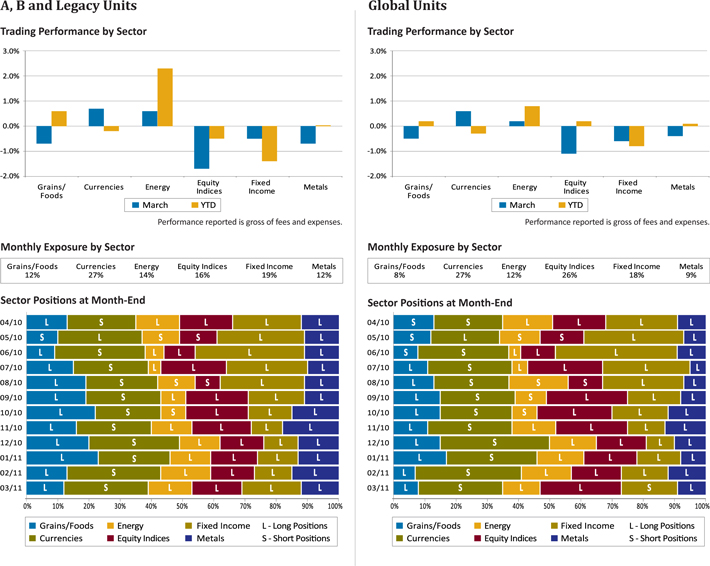
| Sectors Traded |
6 | 6 | 6 | |||||
| Eligibility |
Varies by state, but not less than $250k net worth or $70k net worth and $70k income. No investor should invest more than 10% of his/her net worth. | Varies by state, but not less than $250k net worth or $70k net worth and $70k income. No investor should invest more than 10% of his/her net worth. | ||||||
Statistics


Glossary
The following glossary may assist prospective investors in understanding certain terms used in this presentation; please refer to Appendix E in the prospectus for a more complete glossary of additional terms relevant to this offering:
Average 12-Month Return: The average (arithmetic mean) return of all rolling 12-month periods over the investment track record. This is calculated by summing all 12-month period returns and then dividing by the number of 12-month periods. This simple average does not take into account the compounding effect of investment returns.
Compounded Annualized Rate of Return (ROR): This is the geometric 12-month mean that assumes the same rate of return for each 12-month period to arrive at the equivalent compound growth rate reflected in the actual return data.
Correlation: This is the tendency for the returns of two assets, such as a portfolio and an index, to move together relative to their average. The measurement of this statistic (the correlation coefficient) can range from -1 (perfect negative correlation, one goes up the other down) to 1 (perfect positive correlation, both moving in the same direction). A correlation of 0 means no relationship can be found between the movement in the index and the movement in the portfolio’s performance.
Drawdown: A drawdown is any losing period during an investment’s performance history. It is defined as the percent retrenchment from an equity peak to an equity valley. Maximum drawdown is simply the largest percentage drawdown that has occurred during the specified time frame. Grant Park’s drawdowns are computed based on month-end equity values.
Net Asset Value per Unit: This is the total net asset value of a class of units divided by the aggregate number of units of such class outstanding as of the date noted.
All charts in this document were prepared by Dearborn Capital Management, LLC.
©2011 Grant Park Fund. All rights reserved.

|
www.grantparkfunds.com 866-242-4055 |

|
2-0311DB232